Interaction Data: Progress and Potential John Stillwell and Oliver Duke-Williams Centre for...
47
Interaction Data: Progress and Potential John Stillwell and Oliver Duke-Williams Centre for Interaction Data Estimation and Research (CIDER) School of Geography, University of Leeds Presentation at ‘Census 2011: Impact and Potential’ University of Manchester, 7-8 July, 2011
-
Upload
reynold-terry -
Category
Documents
-
view
214 -
download
0
Transcript of Interaction Data: Progress and Potential John Stillwell and Oliver Duke-Williams Centre for...

Interaction Data: Progress and Potential
John Stillwell and Oliver Duke-Williams
Centre for Interaction Data Estimation and Research (CIDER)School of Geography, University of Leeds
Presentation at ‘Census 2011: Impact and Potential’
University of Manchester, 7-8 July, 2011
Acknowledgement: Support from ESRC and data providers

Presentation
1. What has CIDER achieved over the last 5 years?
2. How have the interaction data sets been used in research?
3. What potential does the 2011 Census provide for data provision and research?
4. Conclusions: How will CIDER develop in the future?

1. What has CIDER achieved over the last 5 years?
1.1 Assembly and storage of large volume of origin-destination data sets
1.2 Development of important online interface (WICID) to the Census interaction data sets
1.3 Provision of training and advice to users1.4 Research using the interaction data sets-
examples

1.1 Assembly and storage of large volume of origin-destination data sets
CIDER’s audit of interaction data from various sources
• Censuses of Population – comprehensive, reliable migration and commuting data, particularly for flows within and between small areas
• Administrative records – collection of records arising from some transaction, registration or record of service delivery
• Social surveys – population samples allowing useful cross-classification at national (regional) level
See Dennett, A., Duke-Williams, O. and Stillwell, J. (2007) Interaction data sets in the UK: An audit, Working Paper 07/05, School of Geography, University of Leeds (http://www.geog.leeds.ac.uk/research/wpapers)

CIDER’s interaction data sets Census Origin-Destination Statistics
• 1981 SMS Set 2 and SWS Set C (county/region level)• 1991 SMS Sets 1 and 2; SWS Sets A-C (ward level) and Table 100 (students
flows at district level)• 2001 SMS Sets 1 and 2; SWS (levels 1-3: districts, wards, output areas in
England & Wales) STS (levels 1-3 and postal sectors in Scotland)• Some very large matrices
Country Level 1 Level 2 Level 3
England London Boroughs (33), Metropolitan Districts (36), Unitary Authorities (46), Other Local Authorities (239)
CAS wards (7,969) Output areas (165,665)
Wales Unitary Authorities (22) CAS wards ( 881) Output areas (9,769)
Scotland Council Areas (32) ST wards ( 1,176) Output areas (42,604)
Northern Ireland
Parliamentary Constituencies (18)
CAS wards (582 ) Output areas (5,022)
Total Districts (426) Interaction wards (10,608)
Output areas (223,060)

CIDER’s interaction data sets Census Commissioned Tables
• Set of tables from 2001 Census including, e.g.C0648: Migrants by religion at district levelC0649: Commuters by religion at district levelC0711: Migrants by ethnic group and age at district level (including all-age immigrants from different world regions of previous residence)C0723: Migrants by age and ethnic group at region/ward levelC0311: Commuters to OAs in London from districts in England and Wales

CIDER’s interaction data sets
Derived or estimated flows from Census data
• SMSGAPS: Counts for 1991 SMS Set 2 Tables 3-10 derived by Rees and Duke Williams that include estimates of suppressed values
• MIGPOP: Counts for 1991 SMS Set 2 Table 3 derived by Simpson and Middleton that adjust for under-enumeration
• 1981 SMS Set 2 (wards) and SWS Set C (wards): re-estimated for 1991 and 2001 geography by Boyle and Feng
• 1991 SMS Set 1 (wards) and SWS Set C (wards): re-estimated for 2001 geography by Boyle and Feng

CIDER’s interaction data setsEstimated flows based on administrative data
• Patient register/NHSCR flows between local authority districts in England and Wales, 19998/99-2007/08 (rounded) – estimated and supplied by ONS
• Inter-NUTS2 region migration estimates for UK, 1999/2000 to 2006/2007 – estimated and supplied by Rees and Dennett (DEMIFER project)
• Inter-NUTS2 region migration estimates for UK, calendar year 2000 to 2007 – estimated and supplied by Rees and Dennett (DEMIFER project)
• Inter-region migration by age, sex and ethnicity for Britain, 1991-1999 and 2000-2007 estimated and supplied by Raymer and Giuletti (ESRC project)
• Inter-county migration by age, sex and ethnicity, 1999-2007, estimated and supplied by Raymer and Giuletti (ESRC project)
• Inter-county migration by age, sex and economic activity , 1999-2007, estimated and supplied by Raymer and Giuletti (ESRC project)

1.2 Development of important online interface to the Census interaction data sets
CIDER Home Page
Need to be a registered user of census data

WICID Query Interface

Data selection
Tables available in 2001 SMS Level 1
Cells of Table 3 in 2001 SMS Level 1

Geography selection
Area selection tools available
List selection of districts
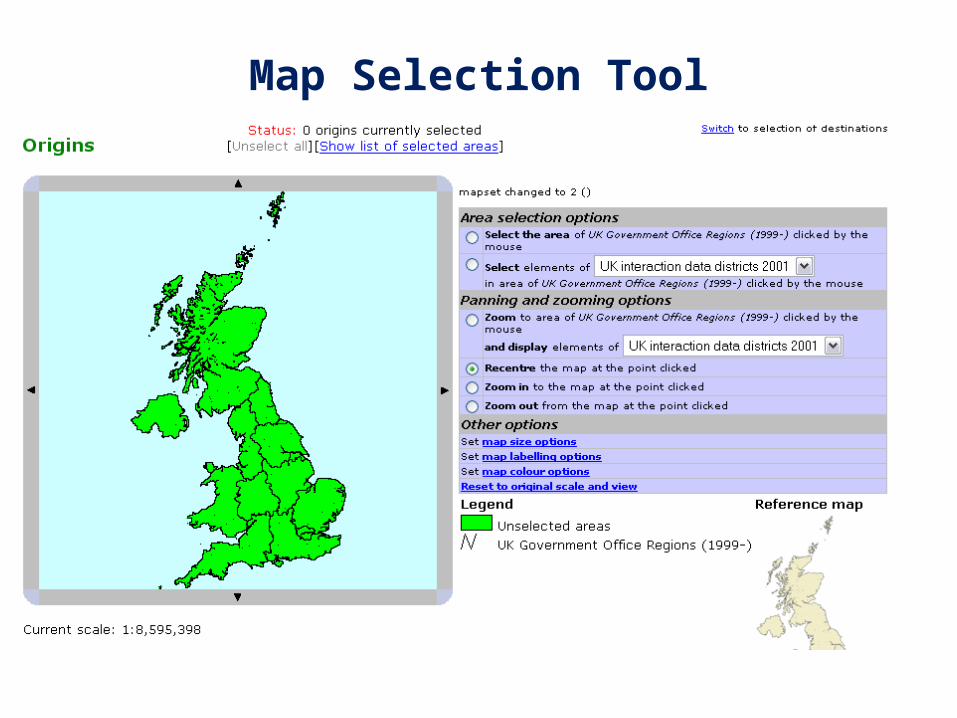
Map Selection Tool

Map Selection Tool (detail)

Postcode based selection

Finalise Screen
Screen Indicating Extraction Completed

Example of simple query and data extracted
The Query: Extract the data on total migrant flows between the countries of the UK from Table MG1010 in 2001 SMS
The Data: Origin by destination matrix of migration flows in 2000-01

Analysis functions for use on extracted data

Help System opening inside a new browser window

WICID User Statistics: Data extractions

1.3 Provision of training and advice to users• Census Programme training workshops• Classroom exercises (Stillwell, 2006b; Dennett, 2010)• Bespoke support for research users – particularly those
requiring large sets of data• Tutorial materials (CHCC project):

2. How have the interaction data sets been used in research?
2.1 Interaction data sets used by various researchers
See some examples in Part 2 of CIDER book:
CIDER staff plus Boden, Boyle, Champion, Coombes, Feng, Flowerdew, Frost, Giulietti, Harland, Norman, Raymer and Rees

2.2 CIDER Research Example 1: Migration patterns based on Vickers
et al. (2003) district classification Top ten directional flows and net migration rates between area clusters, 2000-01
Directional migration flows Directional net migration rates
Source: Dennett, A. and Stillwell, J. (2010) Internal migration in Britain, 2000-01, examined through an area classification framework, Population, Space and Place, 16(6): 517-538.
.

Example 2: CIDER’s own migration-based district classification
Source: Dennett, A. (2010) Understanding internal migration in Britain at the start of the 21st century, PhD Thesis, School of Geography, University of Leeds.
Forthcoming papers in Population Trends and Journal of Population Geography
District classification • 408 districts used• 56 migration variables selected and standardised• Euclidian distance used as measure of proximity• k-means algorithm used for clustering• Optimal solution is 8 clusters

Example 3: What processes of ethnic migration are taking place in London
at ward level? Net migration flows within Net migration flows between Greater London London and rest of England and Wales
Source: 2001 Census Commissioned TableStillwell, J. (2010) Ethnic population concentration and net migration in London, Environment and Planning A, 42: 1439-1456.Location quotients
WHITES

Example 4: Changing patterns of net migration as shown by patient register/NHSCR data
2005/06 net balances
Changes in net balances2000/01-2005/06
Source: Duke-Williams, O. and Stillwell, J. (2010) Temporal and spatial consistency, Chapter 5 in Stillwell, J., Duke-Williams, O. and Dennett, A. (eds.) (2010) Technologies for Migration and Commuting Analysis, IGI Global, pp. 89-110.
2360000
2380000
2400000
2420000
2440000
2460000
2480000
2500000
2520000
2540000
1 2 3 4 5 6 7 8
Years
Mig
rati
on
vo
lum
e
97.0
98.0
99.0
100.0
101.0
102.0
103.0
104.0
Tim
e s
eri
es i
nd
ex
Annual inter-district flows, 1998/99-2005/06

3. What potential does the 2011 Census provide for data provision and research?
3.1 What has not changed since 2001 in terms of available data based on questions asked?
3.2 What about statistical disclosure control?3.3 What new questions enable further
‘interaction’ data to be generated?

3.1 Migration question in 2011 similar to question in 2001
‘No usual address one year ago’ excluded ….. but ‘Student term time address..’ included
2011 2001

Commuting question also very similar
2011
2001
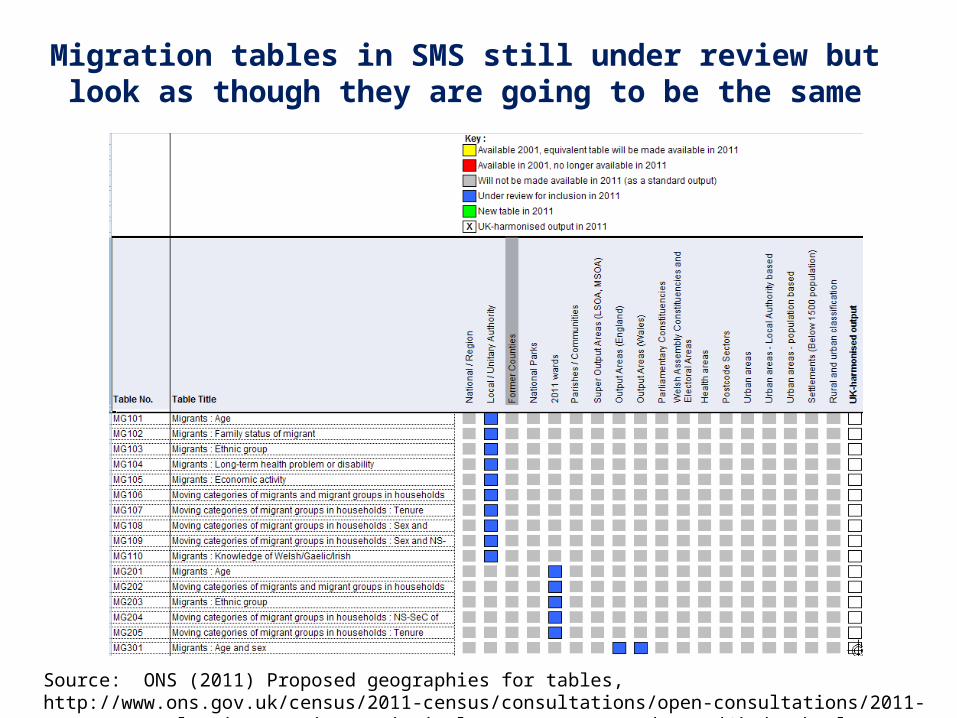
Migration tables in SMS still under review but look as though they are going to be the same
Source: ONS (2011) Proposed geographies for tables, http://www.ons.gov.uk/census/2011-census/consultations/open-consultations/2011-output-consultation---main-statistical-outputs---second-round/index.html
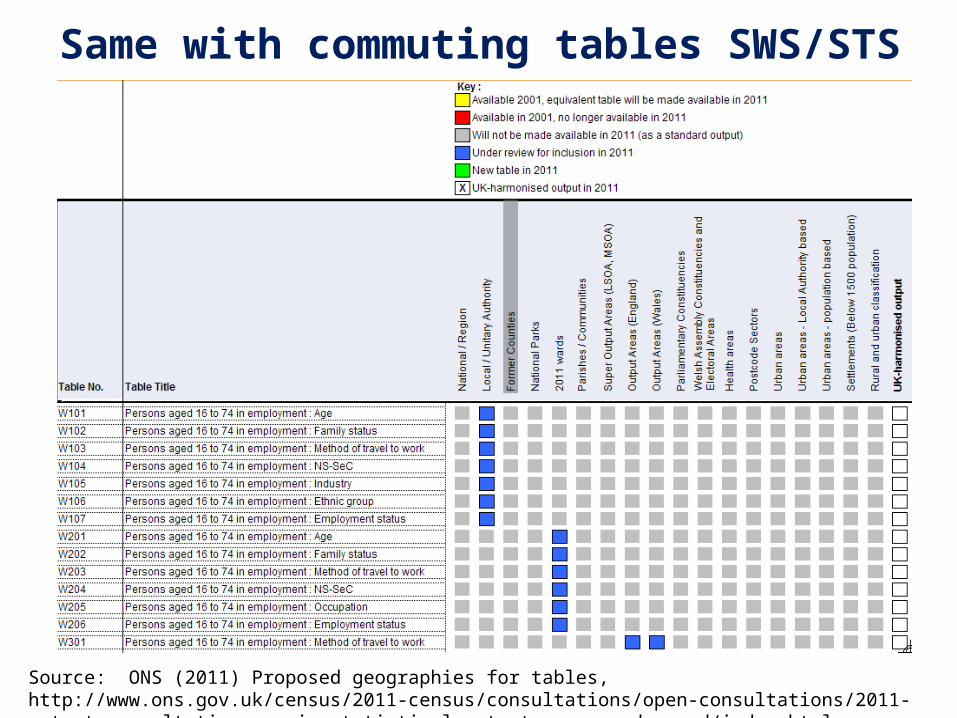
Same with commuting tables SWS/STS
Source: ONS (2011) Proposed geographies for tables, http://www.ons.gov.uk/census/2011-census/consultations/open-consultations/2011-output-consultation---main-statistical-outputs---second-round/index.html

New geography of commuting destinations: Workplace Zones (WPZs)
• OAs based on where people live not work – can be unsuitable for workplace statistics
• Some OAs contain no/few businesses; some contain many businesses or large employer, e.g. business parks, City of London
• Workplace Zones project looking at splitting/merging OAs for a new geography constrained to MSOAs
• Pilot areas: Tower Hamlets, City of London, Southampton, Nottingham, Suffolk Coastal
• Disclosure control: Population threshold same as OAs (100 workers min; 625 max; no household threshold)
Source: Spicer, K. (2011) Statistical Disclosure Control for 2011 UK Census, http://www.ons.gov.uk/census/2011-census/consultations/open-consultations/2011-output-consultation---main-statistical-outputs---second-round/index.html

3.2 What about statistical disclosure control?
• Small cell adjustment abandoned in favour of record swapping:
- Households swapped- Targeted to ‘risky’ records- Construct risk score for every individual; combine to
household score- Imputation considered as part protection- Households swapped only as far as their risk is
considered ‘high’- Individuals swapped between communal
establishments
• Work on SDC on Origin-Destination Tables still ongoingSource: Spicer, K. (2011) Statistical Disclosure Control for 2011 UK Census, http://www.ons.gov.uk/census/2011-census/consultations/open-consultations/2011-output-consultation---main-statistical-outputs---second-round/index.html

3.3 What new questions enable further ‘interaction’ data to be generated?
Questions 5 and 6 ask about another address
Potential to produce matrices of interaction flows between usual address and other address – very useful for analyses of mobility (weekly commuting, shared custody of children, second homes, international mobility) hitherto uncaptured …… except for students

Student ‘migration’ picked up by separate questions

Questions about international immigration
NB. ONS could provide immigrants by country of birth and by country of previous residence if cross-classified with Question 21

4. Conclusions: How will CIDER develop in the future?
• Anticipation of substantial demand for access to 2011 Census interaction data sets
• Continue to offer user access to data from previous censuses• Recognise the ‘new’ environment – with 2011 Census being
the last census of its kind• Focus data from on surveys and administrative sources• ONS ‘Beyond 2011’ project and Integrated Population
Statistics System • WICID will incorporate various non-census data sets and use
same type of query interface for extraction and downloading

WICID will become a repository for all types of interaction data
• CIDER already collecting other non-census data sets on: (i) internal migration (e.g. NHS patient movement data time series from 1988-89 to 2008-09; HESA student flows) (ii) international data (e.g. from a series of different administrative sources including GP Flag 4 registrations; NINo registrations; HESA statistics – all at district level)

Some challenges for WICID• Re-design the interface (and metadata) to present better
classification of data sets– List by source as well as by theme
• Extending the interface to handle time-series data– Easy selection of multiple waves of data of interest– Time series analysis and summary functions
• Extend the range of supported geographies– Different types of geography (point locations as well as area)– Clearly display of relevant geographies
• Incorporation of ‘on-the-fly’ disclosure control routines for datasets like HESA– Round data after aggregation but before giving to user
• Improved mapping of results– Flow maps of extracted data– Choropleth maps of extracted data and analysis results

Improved data divisions


Changing access arrangements
• Access arrangements for 2011 Census data are not yet known– ONS concerned about disclosure risks in interaction
data– There may need to be a more secure path for
spatially detailed data– However, interaction data don’t necessarily fit the
current security models– Open Government Data models suggest easier
access to data, not harder access

The benefits of an API based system
• Delivery of data via an API offers close linking of values with their corresponding metadata– This should make it easier to match data items
with the right populations when calculating rates• Makes it easier to add new specialised
aggregations as they become available• Easier to re-purpose ONS data• Allow WICID to become a value-adding
conduit for data
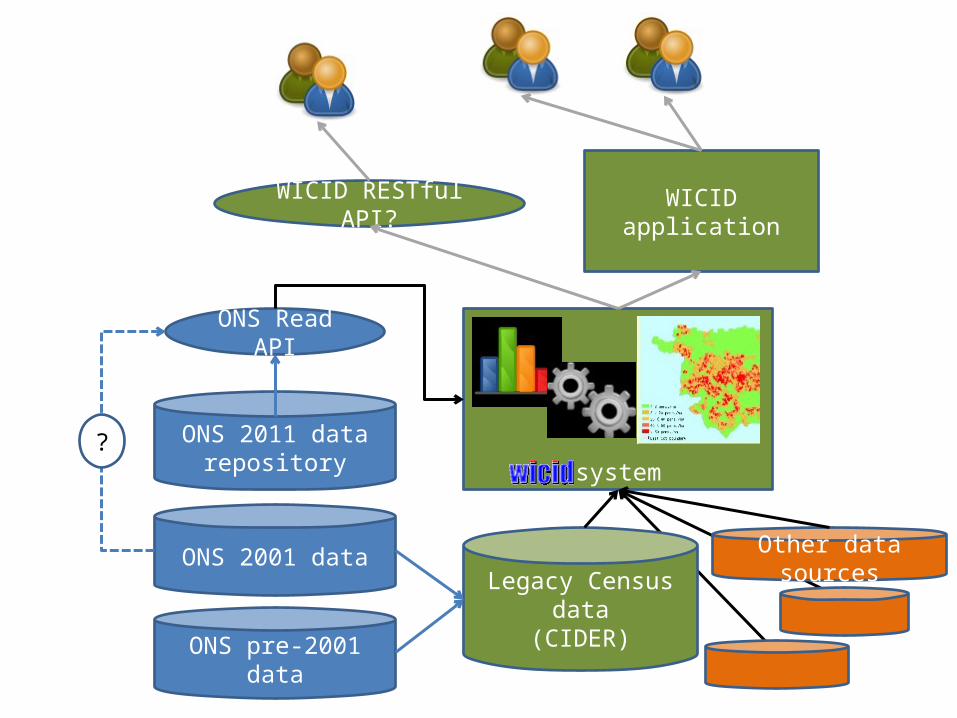
ONS 2011 data repository
ONS Read API
Legacy Census data(CIDER)
ONS 2001 data
ONS pre-2001 data
?
Other data sources
system
WICID RESTful API? WICID application

ONS web environment
ONS API(read)
ONS Content
Repository
Single ONS
website Bulk User
Bulk User
Partner
External systems
External systems
External systems
(mash-up)
External systems
(mash-up)
Data Supplier
Data Supplier
Data Supplier
PartnerONS API(write)
Bulk User
Specific audience
group
Specific audience
group
Other data sources
Users of ONS website
Users in this organisation
Users in this organisation
Users of ONS data on other
systemsCommunity
forum

Contact details
John StillwellEmail: [email protected]
Oliver Duke-WilliamsEmail: [email protected]
CIDER Web site: http://cider.census.ac.uk/