Interaction Between the Effects of Preparation Method … 4: Methods 28 4.1 Study 1 28 4.1.1...
122
Interaction Between the Effects of Preparation Method and Variety on the Glycemic Index of Novel Potato Varieties by Tara Kinnear A thesis submitted in conformity with the requirements for the degree of Master of Science Graduate Department of Nutritional Sciences University of Toronto © Copyright by Tara Kinnear, 2010
Transcript of Interaction Between the Effects of Preparation Method … 4: Methods 28 4.1 Study 1 28 4.1.1...

Interaction Between the Effects of Preparation Method and
Variety on the Glycemic Index of Novel Potato Varieties
by
Tara Kinnear
A thesis submitted in conformity with the requirements
for the degree of Master of Science
Graduate Department of Nutritional Sciences
University of Toronto
© Copyright by Tara Kinnear, 2010

ii
Interaction Between the Effects of Preparation Method and Variety on the Glycemic
Index of Novel Potato Varieties
Master of Science, 2010
Tara Kinnear
Department of Nutritional Sciences,
University of Toronto
ABSTRACT
As part of a project to see whether potatoes with a low glycemic-index (GI) could be
developed through plant breeding, the GI values of 4 new potato varieties differing in
starch structure was determined in 3 studies over 2 years in human subjects. Since
cooking and cooling affects starch structure the potatoes were studied both freshly
cooked (boiled) and cooled. The first study showed that cooling reduced the GI of two
varieties by 40-50% but had no effect in the others (treatment × variety interaction,
p=0.024), an effect which was confirmed in study 2. Differences in GI were readily
explained by differences in starch structure or in-vitro digestion rate. Carbohydrate
malabsorption increased from 3 to 5% upon cooling, not enough to account for the
reduced GI. It is concluded that the effect on GI of cooling cooked potatoes varies in
different varieties. Further research is needed to understand the mechanism.

iii
Acknowledgements
I would first like to thank my supervisor, Dr. Thomas Wolever for giving me the
opportunity to pursue my masters at the University of Toronto. His continued guidance
and support was truly appreciated. I thank him for respecting and encouraging my
extracurricular love for the sport of basketball and to him and his family for coming to
my games!
I would like to extend my appreciation to my committee members, Drs. Keith and El-
Sohemy who were always very approachable. I thank you for your co-operation, advice
and valued ideas. Thank you to Dr. Jenkins for being my external examiner and Dr.
Archer for chairing my defense. A special thanks, is extended to other members of the
department, specifically the support staff for their invaluable assistance.
Thank you to the members of Dr. Wolever’s lab, for all of their time spent helping me
prepare for seminars, conferences and my defense. To everyone at Glycemic Index
Laboratories, for training me, answering all of my questions and assisting me with the
organization and day-to-day operations of my studies.
Thanks to my friends, family and my partner Rob, for all of their love, support and
patience. Finally, thanks to my parents Joy and Dale Kinnear, without them my entire
academic career would have not been possible. Thank you for believing in me, at times
when I did not believe in myself.
Agriculture and Agri-Food Canada, Bioproducts Innovation Program (ABIP) funded this
research.

iv
Table of Contents
Abstract ii
Acknowledgements iii
List of Tables vii
List of Figures viii
Abbreviations x
Chapter 1: Introduction 1
Chapter 2: Literature Review 3
2.1 Potato Nutrition 3
2.1.1 Potato Starch 4
2.1.2 Effects of Cooking and Cooling on Starch 4
2.2 Classification and Measurement of Dietary Carbohydrates 5
2.2.1 In Vitro Classification and Measurement 5
2.2.2 The Glycemic Index 7
2.2.3 Ileostomy Model 9
2.2.4 The Breath Hydrogen Method 11
2.3 Health Implications of RDS, SDS and RS 14
2.3.1 RDS 14
2.3.2 SDS 15
2.3.3 RS 16
2.4 Potato Digestibility and the Glycemic Index 17
2.4.1 Physicochemical Factors Influencing Starch Digestibility and GI 22
2.4.1.1 Amylose:amylopectin 22
2.4.1.2 Amylopectin Branching 22
2.4.1.3 Phosphorus Content 23
2.4.1.4 Year of Harvest and Environmental Influences 23

v
2.4.1.5 Maturity 24
Chapter 3: Rationale, Objectives and Hypothesis 25
3.1 Rationale 25
3.2 Objectives 26
3.3 Hypothesis 27
Chapter 4: Methods 28
4.1 Study 1 28
4.1.1 Overview 28
4.1.2 Subjects 28
4.1.3 Test Meals 29
4.1.4 Protocol 30
4.1.5 Analytical Methods 32
4.1.6 Calculation of Glycemic Index 34
4.1.7 Statistical Analysis 34
4.2 Study 2 35
4.2.1 Overview 35
4.2.2 Subjects 36
4.2.3 Test Meals 36
4.2.4 Protocol 37
4.2.5 Analytical Methods 37
4.2.6 Calculation of Glycemic Index 37
4.2.7 Statistical Analysis 39
4.3 Study 3 39

vi
4.3.1 Overview 39
4.3.2 Subjects 40
4.3.3 Test Meals 40
4.3.4 Protocol 41
4.3.5 Analytical Methods 45
4.3.6 Calculation of Glycemic Index 45
4.3.7 Statistical Analysis 45
Chapter 5: Results 48
5.1 Study 1 48
5.2 Study 2 54
5.3 Study 3 59
5.3.1 Glycemic response and GI 59
5.3.2 Breath Hydrogen and Malabsorbed Carbohydrate 64
Chapter 6: Discussion 72
6.1 Study 1 72
6.2 Study 2 79
6.3 Study 3 82
Chapter 7: Conclusions and Implications 93
Chapter 8: Future Direction 95
References 96

vii
List of Tables
Table Page
1. Test meal composition for Study 1 31
2. Amylose, RDS, SDS and RS content of potato starch 33
3. Test meal composition for Study 2 38
4. Test meal composition for Study 3 42
5. Macronutrient composition of standard lunch for Study 3 44
6. AUC and GI values for varieties 1,2,3, and 4 harvested in 51
2008, served to subjects (n=10) fresh boiled, reheated and cold
7. AUC and GI values for varieties 2 and 3 harvested in 2009, 58
served to subjects (n=10) fresh boiled and cold
8. AUC (0-120 min and 240-360 min) and GI values for varieties 65
1 and 3# harvested in 2009, served to subjects (n=10) fresh
boiled and cold
9. Total breath hydrogen response after consumption of potato, white bread and 69
lactulose test meals (n=10).
10. Amount of malabsorbed carbohydrate (CHO) in potato and white bread test 71
meals (n=10).

viii
List of Figures
Figure Page
1. Glucose response elicited by fresh boiled, reheated and cold potatoes 49
for varieties 1,2,3 and 4, harvested in 2008
2. GI of fresh boiled, reheated and cold potatoes for varieties 1, 52
2, 3 and 4 harvested 2008
3. Reduction in the GI upon cooling fresh boiled potatoes 53
4. Correlations between the GI of fresh boiled potatoes and: A % RDS; 55
B % SDS; C % RS; and D % Amylose
5. Correlations between the GI of cold potatoes and: A % RDS; 56
B % SDS; C % RS; and D % Amylose
6. Glucose response elicited by fresh boiled and cold potatoes for 57
varieties 2 and 3, harvested in 2009
7. GI of fresh boiled and cold potatoes for varieties 2 and 3 60
harvested in 2008 and 2009.
8. A. Average GI of the fresh boiled and cold potato for that year 61
(2008 or 2009) and that variety (2 or 3) B. Average GI of the
2008 and 2009 potatoes for that treatment (fresh boiled or cold)
and that variety (2 or 3)
9. Glucose response elicited by fresh boiled and cold potatoes for 62
varieties 1 and 3, harvested in 2009 taken at breakfast (0 min)
followed by a standard lunch taken at 240 min.
10. GI of fresh boiled and cold potatoes for varieties 1 and 3 66
harvested in 2008 and 2009

ix
11. Breath hydrogen responses elicited by fresh boiled and cold potatoes 68
varieties 1,3 and lactulose

x
List of Abbreviations
AAFC Agriculture and Agri-food Canada
ANOVA Analysis of variance
AUC Area under the curve
BPN Bio Potato Network
BV Biological value
CHO Carbohydrate
CRP C-reactive protein
CVD Cardiovascular disease
GI Glycemic index
FFA Free fatty acids
FG Free glucose
H2 Hydrogen gas
HbA1c Glycated hemoglobin
NEFA Non esterfied fatty acids
RAG Rapidly available glucose
RDA Recommended Daily Allowance
RDS Rapidly digestible starch
RS Resistant starch

xi
SAG Slowly available glucose
SDS Slowly digestible starch
SEM Standard error of the mean
SME Second meal effect
1
Chapter 1
Introduction
The potato (Solanum tuberosum) originated approximately 8,000 years ago in South
America and first spread to European countries in the 16th
century. Since then potatoes
have spread worldwide, and are now grown in 160 countries. Canada is the 12th
largest
potato producer in the world, producing close to 5 million metric tons in 2007 with
approximately 160 registered varieties (AAFC, 2007).
Potatoes represent approximately 36% of all fresh and processed vegetables consumed.
Fresh potatoes account for 45% of total potatoes consumed, with processed potatoes (i.e.
French fries and potato chips) accounting for the remaining 55%. Despite potato
popularity, consumption has declined from 76 kg per person in 1994 to 65 kg in 2007
(AAFC, 2007). Canadians are simply preparing fewer fresh potatoes, with a 27% drop in
fresh potato consumption between 1997 and 2005. Frozen potato consumption, mainly as
French fries has also been decreasing since 2002 (AAFC, 2007).
This decline in potato consumption may be secondary to various dietary trends and
negative perceptions concerning its nutritional value. Although one medium potato
(150g, boiled with skin intact) contains only 129 kcal, is an excellent source of vitamin C,
a good source of potassium, and is virtually sodium and fat free (Health Canada, 2009),
potatoes continue to be discouraged by diet books (Steward et al., 2003; Willet, 2001),
magazines (Golden, 2002; Willet & Stampfer, 2006) and even scientific articles (Halton
et al., 2006; Liu & Willett, 2002; Willet, 2002) due to their purported high Glycemic

2
Index (GI). High GI diets have been associated with increased risk of diabetes and
cardiovascular disease (CVD) and therefore foods with a low GI have been encouraged
(Willet et al., 2002; Leeds, 2002). The GI is a method used to classify the blood glucose
raising potential of carbohydrate containg foods. It ranks carbohydrates on a scale of 0-
100, based on how they raise blood glucose relative to a reference food of glucose or
white bread (GI=100) (FAO, 1998; Wolever et al., 1991b).
Although potatoes are perceived as a high GI food, reported GI values vary widely from
as low as 23 to as high as 118 (Atkinson et al., 2008). These differences could be due to
random experimental error or inconsistencies between methodologies, but may also be
explained by factors such as differences in starch structure between varieties, processing
methods and harvest dates. This literature review will explore how each of these factors
can affect the digestibility of the potato, and ultimately its GI.

3
Chapter 2
Literature Review
2.1 Potato Nutrition
Newly harvested potatoes contain approximately 80% water and 20% dry matter, with
60-80% of dry matter as carbohydrate predominantly, starch (discussed below) (Camire
et al., 2009; USBP, 2008). Potatoes have been perceived to be high in calories and fat
compared with other carbohydrate sources such as rice or pasta. This is an incorrect
assumption as, potatoes based on 100g weight (boiled, with skin), contain 86 kcal
compared to an equal portion of rice (white, long grain, cooked) and pasta (enriched,
spaghetti, cooked) at 130 kcal and 141 kcal respectively, and like rice and pasta has
negligible fat. Potatoes are also considered a source of dietary fibre, with one medium
potato (150 g, boiled) with skin providing approximately 2 grams of fibre (Health
Canada, 2009).
Compared to other raw vegetables potatoes are low in overall protein (~2 g per 100 g
weight) (Health Canada, 2009). However, the little protein they do contain has excellent
biological value (BV), with a BV of 90-100 compared to that of whole eggs (100), or
soybeans (84) (Camire et al., 2009). Potatoes are also quite high in certain minerals such
as potassium and phosphorus. One medium potato (~150g, boiled with skin) provides
572mg of potassium, more than those foods commonly associated with potassium
content, such as bananas (1 medium, 422mg) or oranges( 1 medium, 232mg) (Health
Canada, 2009). Vitamin C is the predominant vitamin in potatoes, with 1 medium potato
4
(boiled with skin) containing 18.4 mg, 20% and 25% of the Recommended Daily
Allowance (RDA) for adult men and women respectively (IOM, 2000). In addition to
vitamins and minerals, potatoes also contain phytochemicals with antioxidant potential,
which can vary in amount and composition among varieties (Brown, 2005).
2.1.1 Potato Starch
Starch is the main carbohydrate source in potatoes. It is found in raw potatoes as water
insoluble granules (Miles et al., 1985). The two main polysaccharides that can be
extracted from these granules are amylose and amylopectin (Gallant et al., 1992).
Amylose is a linear un-branched chain containing 500-2,000 glucose residues attached
through α1-4 glycosidic bonds. Amylopectin is a highly branched- chain polymer,
containg 104-10
5 glucose units, linked by both α 1-4 and α 1-6 linkages at the branch
points (Gallant et al., 1992; USBP, 2008) . Potato starch is typically comprised of 80%
amylopectin and 20% amylose (Camire et al., 2009). Potato starch in its native form is
resistant to the action of amylolytic digestive enzymes. However, different processing
methods, such as cooking and cooling can alter the rate and extent at which glucose is
absorbed by the small intestine.
2.1.2 Effects of Cooking and Cooling on Starch
When starches are heated in liquid around temperatures of 60-70ºC hydrogen bonds
between glucose residues weaken and granular structure is lost. Starch granules take up
water and swell resulting in a suspension of porous and swollen granules. The starch is
dispersed and is susceptible to hydrolysis by α-amylase. This process is termed
gelatinization (Miles et al.,1985; Ring et al., 1988). Linear amylose tends to be more

5
resistant to the process of gelatinization than does amylopectin (Liu et al., 2007). When
cooled, the dispersed polymers re-associate with each other by way of hydrogen bonding,
forming an irregular structure that is more resistant to digestion. A process known as
retrogradation (Englyst et al.,1992a; Miles et al., 1985). Amylopectin is limited in its
retrograding capabilities by its branched structure and the polymers that do re-associate
are less firmly bound than those of retrograded amylose (Englyst, et al., 1992a).
Therefore, upon reheating at approximately 70ºC, crystallized (retrograded) amylopectin
is more easily reversed compared to crystallized amylose which requires a higher
reheating temperature of 160ºC to reverse the process of retrogradation (Miles et al.,
1985; Ring et al., 1988). Based on the effects of processing alone it is evident that starch
is hydrolysed to glucose at different rates and extents. These differences have led to the
development of measurements and classification systems for carbohydrates based on their
digestibility (Englyst et al., 1992a; Englyst et al., 1999; Jenkins et al., 1981; Bond et al.,
1972; Englyst et al., 1985).
2.2 Classification and Measurement of Dietary Carbohydrates
The following sections will review both in-vivo and in-vitro methods that have been and
are still used to measure and classify carbohydrates based on their absorption in the small
intestine.
2.2.1 In Vitro Classification and Measurement
In addition to food processing, the rate and extent of starch digestion also differs due to
physicochemical properties of the starch such as amylose:amylopectin ratio and
phosphorus content, not yet discussed. Analytical methods have been developed that

6
characterize dietary carbohydrates with regard to their physicochemical properties and
the likely site, rate and extent of digestion in vivo (Englyst et al., 2003).
Englyst et al. (1992a) classified dietary starch based on its susceptibility to α-amylase in
vitro. Briefly, rapidly digestible starch (RDS) and slowly digestible starch (SDS) were
measured after incubation with pancreatic amylase at 37ºC for 20 min and a 120 min,
respectively. Resistant starch is the starch not hydrolysed after 120 min incubation and is
calculated by subtracting RDS plus SDS from total starch (TS) (Englyst et al.,1992a).
This method provides estimates on the proportion of starch that is likely to be digested
rapidly in the small intestine (RDS), slowly (SDS) and the amount likely to pass through
to the large intestine (RS).
In more recent years Englyst et al. (1999) modified the Englyst et al. (1992a) method for
measuring RDS, SDS and RS in order to measure rapidly available glucose (RAG) and
slowly available glucose (SAG) to describe the likely rate and extent of glucose release
from starch and sugars in the small intestine. RAG is the amount of glucose measured
after incubation of a food sample with digestive enzymes for 20 min (G20). Values for
RDS can be determined by correcting RAG for free glucose (FG), which is obtained by a
separate analysis (RDS= (G20-FG) x 0.9). SAG is the amount of glucose measured after
120 min (G120) (SAG=G120-G20). Values for SDS can be calculated by SAG as, SDS=
((G120-G20) x 0.9). The RS can also be calculated by the fractions measured using the
Englyst et al. (1999) method (RS=total glucose – G120) x 0.9). Values for the calculated
starch fractions are expressed as polysaccharides by the conversion factor 0.9 (Englyst et
al., 1999; Englyst et al., 1996b). Depending on the composition of the carbohydrate (i.e.
starch or glucose) RAG, SAG and the starch fractions (RDS, SDS and RS) continue to be

7
measured to classify foods based on their carbohydrate bioavailability. The use of RAG
and SAG values instead of the starch fractions however, extends the application of in-
vitro analysis to non-starch foods, since RAG and SAG sources are not restricted by the
source of glucose (Englyst et al., 1996b).
The physiological relevance of the in-vitro measurements described have been
demonstrated through correlation with in-vivo glycemic responses (Englyst et al.,1999;
Englyst et al., 2003 Englyst et al., 1996b). So although these methods cannot account for
the physiological differences that occur between and within an individual, measurement
of RAG, SAG and starch fractions provide a consistent method of characterizing
carbohydrate availability for the comparison of different foods (Englyst & Englyst,
2005).
2.2.2 The Glycemic Index
Unlike the in-vitro methods described above, the GI takes a physiological approach in
classifying foods based of their ability to raise blood glucose on a scale from 0-100. It is
defined as the incremental area under the blood glucose response curve elicited by a 50g
portion of available carbohydrate of a test food expressed as a percentage of the response
after a 50g portion of glucose (reference food) taken by the same subject (Wolever et al.,
1991b). The GI is a property of the food, and is often times confused with the glycemic
response, which varies from subject to subject (Wolever, 2006). The reference food is
therefore used to correct for between-subject variation, as the GI adjusts the glycemic
responses of the test food to each subject’s individual response to the reference. This
allows for the comparison of different foods that are measured across different subject

8
groups (Wolever et al., 1990). A standard protocol for determining the GI of foods exists
(FAO, 1998), which is described in detail in the methods chapter of this thesis. Using this
method carbohydrate containg foods can be classified as either low (≤ 55), intermediate
(56-69) or high (≥70) GI, based on the glucose reference scale (GI=100) (Atkinson et al.,
2008).
As mentioned, studies have shown that the rates of digestion of foods in-vitro are related
to their glycemic responses in vivo, suggesting that differences in GI are due to
differences in the rates of digestion and absorption of carbohydrate from different foods
(Englyst et al., 1999; Englyst et al., 2003; Englyst et al. 1996b). This is evident in a study
investigating the determinants of GI on 23 manufactured cereal products. Results
indicated that in-vitro measures of RAG and SAG (i.e. the rate of carbohydrate digestion)
were closely related to the GI and described 68% of the variance in GI between foods
(Englyst et al., 2003). The importance of type of carbohydrate was also noted in a study
conducted by Wolever & Bolognesi (1996), where subjects were fed varying amounts
and sources of carbohydrates (total carbohydrate minus dietary fibre), to determine
whether the source and amount of carbohydrate affected postprandial glucose and insulin
responses. They found that 46-64% of the variability between glucose and insulin
responses could be explained by the source of carbohydrate similar to the 47-57% of the
variability explained by the amount of carbohydrate. This study concluded that alone
both the amount and source of carbohydrate are poor predictors of postprandial glucose
and insulin. However, these results validate the importance of considering and thus
measuring the source (GI) of carbohydrate foods along with the amount consumed.

9
From its discovery by Jenkins et al. (1981), until around the mid 1990s the only clinical
application of the GI was considered to be in the treatment of diabetes. Since then interest
in the GI and its utility has increased exponentially due to its newfound relevancy to
normal populations and different aspects of human health (Wolever, 2006). Although the
GI has gained popularity over the years, conflicting views remain around the reliability
and application of this measure in clinical and public health settings. Many GI skeptics
continue to question its usefulness for a number of different reasons (Flint et al., 2004;
Venn & Green, 2007; Williams et al., 2008; Vega-López et al., 2007; Coulston et al.,
1984), even though most if not all of these issues have been addressed elsewhere
(Wolever et al.,1991b; Wolever et al., 2008; Chew et al., 1988).
In addition to the GI, other in-vivo methods such as the ileostomy model and breath
hydrogen technique have been used to investigate carbohydrate digestibility. More
specifically they have the ability to quantify the amount of malabsorbed carbohydrate, or
RS in a food.
2.2.3 Ileostomy Model
An ileostomy is a surgically created opening where the ileum is brought to the abdomen,
diverting effluent into a pouch instead of its normal route through to the colon. It is often
used in treatment for disease or trauma to the colon including inflammatory bowel
disease and familial adenomatous polyposis, where the colon is either removed, or
requires time to heal (The Canadian Association for Enterostomal Therapy, 2009). Thus,
these patients have been used to study small intestine digestion and absorption, as
undigested nutrients are collected and then measured in the newly created abdominal

10
pouch. Briefly, the experimental design for most ileostomy studies include a period
where subjects with an ileostomy are placed on a control diet that is low or free of the
nutrient of interest (i.e. starch), followed by a period where the nutrient is included in the
diet. Diet information and ileal effluent is then analyzed to determine the presumed
absorption or malabsorption of the nutrient (Wolever, 2006).
The digestibility of starchy foods, including potato products measured in-vitro has been
reflected in in-vivo ileostomy studies. The amounts of starch recovered in the ileostomy
studies however are typically higher than the RS values obtained in-vitro. This is likely
due to variation between the individual ileostomy subjects, as the in-vitro methods
depend only on the property of the food and not on extrinsic factors such as individual
chewing habits or gut transit time (Englyst & Cummings, 1985; Englyst et al., 1992b).
The amounts of malabsorbed carbohydrate measured in ileostomy effluent have also been
compared to the glycemic response. A study conducted by Wolever et al. (1986) found
that the amount of malabsorbed carbohydrate recovered in the effluent after each test
food was not related to the foods’ area under the blood glucose curve (AUC). While,
another study by the same group (Jenkins et al., 1987) looked at the digestibility and
glycemic response of 20 starchy foods in one or more ileostomate subjects and found that
the glycemic response was negatively correlated (r=-0.611, p<0.05) with the percent
carbohydrate malabsorbed after each of the test foods. However, Wolever (2006) showed
that if you theoretically reduce carbohydrate intake by an amount equal to the proportion
of carbohydrate malabsorbed it only explains a small proportion of the reduction in
glycemic response. This is supported by Fernandes et al. (2005), as carbohydrate
malabsorption in cooked and cooled potatoes (measured by the ileostomy model in

11
Englyst et al. (1987)) accounted for only about 15% of the 35% reduction in glycemic
response upon cooling a boiled red potato. This suggests that differences in glycemic
responses between foods could be better explained by differences in the rate of
carbohydrate digestion rather than the amount.
To summarize ileostomy models are able to quantify carbohydrate malabsorption and
provide a more physiological representation of starch digestibility than in-vitro methods.
However, this measurement of malabsorption in-vivo, cannot account for the entire
reduction in glycemic response and unlike in-vitro methods cannot identify different rates
of starch digestion. In recent years although ileostomy studies have generally been
considered a reliable model for small intestine absorption other in-vivo methods such as
breath hydrogen have been used more often. This is likely due to difficulties in recruiting
subjects, inconveniences of consuming restricted diets and the collection of effluent
(Wolever, 2006).
2.2.4 The Breath Hydrogen Method
Hydrogen gas (H2) is produced in the colon by anaerobic bacteria, as a byproduct of
fermented un-digested carbohydrate (i.e. RS). H2 diffuses through the colonic epithelium
into circulation, where it is carried to the lungs and excreted through breath (Read et al.,
1985). Analyzing expired air for hydrogen concentration is a non-invasive method of
quantifying carbohydrate malabsorption, which was validated by Bond et al. (1972) and
has been used ever since (Anderson et al.,1981; Flourie et al., 1988; Robb et al., 1991;
Rumessen et al., 1990; Levitt et al., 1987; Rumessen et al., 1994; Owira et al., 2005).

12
Briefly, breath hydrogen is typically measured over an 8-12 hr period after the
consumption of a carbohydrate test meal at 30 min or hourly intervals. One of the test
days involves subjects taking a known dose of an un-absorbable standard carbohydrate,
most often lactulose or inulin, followed by a series of other test days including known
amounts of each test carbohydrate. Breath hydrogen production after each of the test
meals is typically measured by calculating the AUC or sum of the individual
concentrations. Lactulose or inulin is used to determine the H2 produced per gram of
unabsorable carbohydrate taken by each subject, this value is then divided into the
amount of H2 produced from each of the other test meals to give the grams of
carbohydrate malabsorbed (Wolever, 2006). Therefore, this technique is only semi
quantitative in nature.
The H2 breath method has been criticized, but has generally been considered a valid
technique for assessing carbohydrate malabsorption (Rumessen, 1992). Common
criticisms include large within and between subject variation (Flourie et al.,1988) and
previous antibiotic use (Gilat et al., 1978). Examples of within subject variation include,
content, amount and timing of meals before the test day, or retention of feces and gas in
the colon (Robb et al., 1991). A common example of between subject variation would be,
differences in colonic flora composition (Gilat et al., 1978). There is also the possibility
that the technique may not be sensitive enough to detect small amounts of malabsorbed
carbohydrate (i.e. less than 10g) (Grysma et al., 2008) and the fact that certain
malabsorbed carbohydrate when fermented by colonic bacteria do not produce H2 (Sanz
et al., 2005; Livesey et al., 1993; Olesen et al., 1994; Wolever & Robb, 1992).

13
A study by Flourie et al. (1988) evaluated the accuracy of the H2 breath test with lactulose
as the indicator carbohydrate for quantifying the malabsorption of raw wheat starch
(thought to be resistant to small intestine digestion). Subjects were rectally infused with
different amounts of starch that were compared to respective calculated amounts which
were determined through measurement of breath H2. Calculated results were significantly
correlated with the actual quantities of starch infused. This suggests that the lactulose
breath test is a valid method for comparing starch absorption in different foods. However
Flourie et al. (1988) also concluded that although the mean calculated values did not
differ significantly from the infused amounts, there was significant intra-individual
variation and therefore suggested this measurement is not appropriate for evaluating
starch malabsorption in a given subject.
Another study conducted by Wolever et al. (1986) validated the breath H2 method and
showed it to be remarkably similar to the direct measurement of the amount of undigested
carbohydrate in the small intestine in subjects with an ileostomy after three different test
foods. From this study the estimated mean percentage of available carbohydrate
malabsorbed from white bread, whole wheat bread and red lentils measured by the breath
H2 method was 10%, 8% and 22%, respectively, compared to 11%, 8% and 18%,
respectively using the ileostomy model. However, for this study, as previously discussed,
the amounts of malabsorbed carbohydrate after each of the different foods as determined
by the ileostomy model were not related to their glycemic response. It is therefore
assumed that the un-absorbed carbohydrate determined through breath H2 for these foods
was also not related to the glycemic response. Additionally, as discussed by Wolever
(2006) concerning the ileostomy model, the amount of carbohydrate malabsorbed

14
measured by breath hydrogen may account for some of the reduction in glycemic
response, but cannot explain all of the reduction, as indicated in Wolf et al. (2003).
In summary, the breath H2 technique is a non-invasive way of detecting carbohydrate
malabsorption and similar to the ileostomy model is generally considered a valid method.
Both methods, however are unable to evaluate the different rates of starch digestibility,
which may be more appropriately measured in-vivo through stable isotopes or the
euglycaemic hyperinsulinaemic clamp (not discussed here) (Wolever, 2006). Perhaps the
combination of both in-vivo and in-vitro methods is most appropriate to investigating
differences in starch digestibility between foods.
2.3 Health Implications of RDS, SDS and RS
Following a review of the methods commonly used in the classification of carbohydrate
digestion, this section will briefly re-visit the characterization of each starch fraction and
discuss their health implications, in an attempt to justify the importance of these methods
in identifying carbohydrate foods that are rapidly, slowly or resistant to digestion.
2.3.1 RDS
RDS or RAG is rapidly digested and absorbed in the duodenum and proximal regions of
the small intestine. This results in rapid elevation and high peak of blood glucose, usually
leading to a fast decline, partially below baseline levels (Lehmann & Robin, 2007; Zhang
& Hamaker, 2009). Foods thought to be high in RDS, are typically classified as high GI.
RDS and high GI have been associated with negative health outcomes. For example, high
GI diets and RDS contribute to potential risk factors for metabolic syndrome such as,

15
greater and more rapid changes in blood glucose, insulin and non esterfied fatty acids
(NEFA) concentrations (Ells et al., 2005; McKeown et al., 2004; Seal et al., 2003). Ells et
al. (2005) suggested an exchange of SDS for RDS in the diet to reduce these potentiating
risk factors. Brownlee et al. (2005) noted that a high concentration of cellular glucose
uptake resulting from high chronic consumption of RDS can lead to production of free
radicals in the mitochondria resulting in oxidative stress. An increase consumption of
high GI foods however has been recommended practice amongst certain types of
populations (i.e. athletes) (Burke et al., 1996; Wee et al., 2005) although is not always
recommended (Stevenson et al., 2009).
2.3.2 SDS
Unlike RDS, SDS or SAG can be characterized by a slow increase in postprandial blood
glucose levels, as well as its ability to sustain blood glucose levels over this period
(Lehmann & Robin, 2007). Foods with a greater proportion of SDS than RDS, are
usually measured as intermediate-low GI (Englyst et al., 2003; Lehmann & Robin, 2007).
Epidemiological studies have suggested that low-GI diets may play a role in reducing the
risk of CVD, diabetes, and certain cancers (Wong & Jenkins, 2007). A meta-analysis of
randomized control trials was conducted by Brand-Miller et al. (2003) to investigate the
effects of a low GI diet on overall glycemic control (indicated by glycated hemoglobin
(HbA1c) or fructosamine) compared to a high GI diet in subjects with type 1 and type 2
diabetes. This analysis indicated that low GI diets significantly reduced HbA1c and
fructosamine by an average of 7.4% more than on the high GI diet (95% CI 8.8-6.0)
(Brand-Miller et al., 2003). However, a 12-month study, looking at the effects of altering
the GI or carbohydrate intake on various bio-measures associated with the management

16
of type 2 diabetes found that a low GI diet had no effect on HbA1c. C-reactive protein
(CRP) however, was 30% less in subjects on the low GI diet than on the high and a
sustained reduction in postprandial glucose was also noted (Wolever et al., 2008). There
is also evidence suggesting that slowing and prolonging the rate of absorption (i.e. a meal
higher in SDS) can prolong postprandial suppression of free fatty acids (FFA) and
improve insulin sensitivity. Which reduces the glycemic impact of a subsequent meal,
commonly referred to as the “second meal effect” (SME) (Jenkins et al., 1982; Axelsen et
al.,1999; Wolever et al., 1995).
2.3.3 RS
Finally, RS is not digested in the upper gastrointestinal tract, and passes through to the
colon where it is fermented by colonic bacteria. Thus, this starch fraction does not
influence blood glucose levels, directly (Zhang & Hamaker, 2009; Sajilata et al., 2006).
Foods containg RS can moderate or slow the rate of digestion of more absorbable
starches (Sajilata et al., 2006). The byproducts of colonic fermentation of non-digestible
carbohydrates are the short chain fatty acids (SCFA), acetate, propionate and butyrate.
Starch fermentation primarily yield acetate and butyrate. Butyrate specifically, has been
positively associated with colonic health, as it is the primary fuel for colonocytes and
assists in the regulation of cell proliferation and differentiation (Wong & Jenkins, 2007).
Both acetate and propionate have been proposed to have opposing effects on lipid
metabolism. Acetate for example, may have the ability to lower serum FFA, (Wolever et
al., 1989; Wolever et al., 1991a; Ferchaud-Roucher et al., 2005 ) but raise cholesterol and
triglycerides as well (Wolever et al., 1989; Wolever et al., 1991a), although other studies
have reported no effect on cholesterol and a reduction in triglycerides (Vogt et al., 2006).

17
There is evidence to support the idea that propionate inhibits the utilization of acetate for
cholesterol synthesis (Wolever et al., 1991a). Studies using oral rather than rectal
infusions have been inconsistent, as one study showed no effect on serum cholesterol
and reported elevated triglycerides (Venter et al., 1990), while another study reported a
reduction in serum cholesterol (Vogt et al., 2006). Animal studies have also suggested
that propionate inhibits cholesterol synthesis (Wong & Jenkins, 2007). Finally, RS can be
considered a prebiotic as it has been linked to the promotion of beneficial bacteria such as
Bifido bacterium (Sajilata et al., 2006).
In summary due to the number of health outcomes associated with different rates of
carbohydrate absorption, classification systems are important in providing consumers
with the opportunity to limit or consume more of certain types of foods based on their
glycemic impact. It is sometimes difficult however to classify a type of food; especially
starchy foods with a specific GI value. As mentioned there are a number of factors that
can contribute to differences in the rate and extent at which carbohydrates are absorbed
by the small intestine. These factors should be taken into account when measuring and
interpreting the GI values of foods. The following section of this literature review will
discuss the potential factors that affect the digestibility of potatoes and the current
literature which report GI values to formulate a basis for its purported high GI.
2.4 Potato Digestibility and the Glycemic Index
As previously mentioned the main carbohydrate in potatoes is starch. A raw potato
contains mostly RS, which is resistant to digestion and absorption by the small intestine.
For example, a study that used the Englyst et al. (1992a) method to measure RDS, SDS

18
and RS fractions in potato samples processed differently reported a raw Marfona potato
to contain 70% RS, 7% SDS and only 2% RDS (% of total dry matter) (Kingman &
Englyst, 1994). Other in-vitro studies looking at different varieties have found similar
results in terms of high RS content, however the proportion of starch fractions differ
slightly depending on variety (H. Englyst & Cummings, 1987; Liu et al., 2007; Mishra et
al., 2008), which could be due to a number of factors. These factors, along with how they
could potentially affect the digestibility of potatoes will be discussed in the next section.
Based on these in-vitro studies it is presumed that raw potatoes could only slightly if at
all influence blood glucose as they contain insignificant amounts of available
carbohydrate. Since potatoes are unlikely to be consumed raw, there are no studies to our
knowledge that have tested the glycemic response of raw potato starch. It can only be
presumed from the in-vitro data, that raw potatoes would have a very low or an un-
measurable GI, due to their negligible RDS and SDS contents.
In order to consume potatoes, they are usually boiled, baked, roasted, steamed or fried,
causing starch granules to gelatinize (process explained in section 2.1.2) resulting in the
transition from a RS to a more digestible fraction (i.e. RDS). Using the same study as
above, upon boiling a Marfona potato the amount of RDS climbs to 71% of dry matter,
while SDS and RS both drop to 1% (Kingman & Englyst, 1994). Other in-vitro studies
noted similar proportions of the starch fractions after cooking (Mishra et al., 2008;
Englyst et al., 1992a; Leeman et al., 2005). When potatoes are cooled, gelatinized starch
retrogrades (process explained in section 2.1.2) resulting in a large proportion of RDS
converting to SDS or back to RS. When the boiled Marfona potato was cooled, for
example RDS fell to 66% of dry matter, while SDS and RS climbed to 9% and 5%

19
respectively (Kingman & Englyst, 1994), this has also been indicated by other studies
upon cooling previously cooked potatoes (Englyst et al., 1992a; Leeman et al., 2005;
Mishra et al., 2008).
The changes in terms of starch structure that occur after cooking and cooling potatoes are
not only indicated by in-vitro measurements of starch digestibility but also through
glycemic responses and measurement of the GI. Referring to some of the most recent
papers reporting GI values for potatoes (Fernandes et al., 2005; Henry et al., 2005;
Leeman et al., 2008; Soh & Brand-Miller, 1999; Leeman et al., 2005) most reported the
GI of fresh cooked potatoes to be greater than 70 (high GI), with a range of 72-118 on
the glucose scale (GI=100). All studies utilized the standard protocol for measuring the
GI (FAO, 1998), but were not all cooked in the same way and varieties differed across
studies. The range in GIs does not appear to be explained by different cooking methods,
as Soh & Brand-Miller (1999) reported no significant differences between GI values for
baked, boiled and mashed, boiled and microwaved Pontiac potatoes (93±11, 91±9,
88.9±9, 79±9, respectively). Fernandes et al. (2005) reported similar findings, as a baked
Russet, roasted California white, baked PEI white, and a boiled red, also did not differ
significantly in terms of their GI (76.5±8.7, 72.3±8.2, 72.8±4.5, 89.4±7.2, respectively).
The Fernandes et al. (2005) study also suggests that the variation in GI values (72-118)
between studies may not be explained by difference in varieties. This theory is also
supported in Soh & Brand-Miller (1999), as there were no significant differences
between the GI of boiled Desiree, Sebago or Pontiac potatoes (101±15, 87±7, 88±9,
respectively). However, comparing the same variety (Desire) and cooking method
(boiling) across two different studies, indicated quite different GIs of 77±17 (Henry et al.,

20
2005) and 101±15 (Soh & Brand-Miller, 1999). This variation could be due to
experimental error, or environmental factors such as time or location of harvest
(discussed further in following section), as the potatoes tested in Henry et al. (2005) were
purchased in the United Kingdom while the potatoes from the Soh & Brand-Miller.
(1999) study were purchased in Sydney, Australia from retail supermarkets. In terms of
cooling, only the Fernandes et al. (2005) and Leeman et al. (2005) studies subsequently
cooled previously cooked potatoes. Firstly, the GI of a boiled red potato (hot) was
89.4±7.2 which dropped to 56.2±5.3 when cooled in a refrigerator for 12-24 hrs
(Fernandes et al., 2005). The Leeman et al. (2005) study, reported similar results, as the
GI for a boiled Sava potato was 118, and upon cooling for 24 hrs at 8ºC the GI fell to 88,
this reduction in GI however was not significant. Although the GI for both varieties was
reduced upon cooling the red potato from the Fernandes et al. (2005) study reached
significance. This difference between varieties in terms of the magnitude at which
cooling effected the GI, could be due to different physicochemical properties found in
each variety (discussed below).
Reheating cold potatoes has been shown in-vitro to restore some of their digestibility, by
the re-gelatinization of retrograded starch (Englyst & Cummings, 1987; Kingman &
Englyst, 1994). There have been very few studies however, measuring the effects on the
GI after reheating Fernandes et al. (2005), measured the glycemic response but not the GI
of day cooked and pre-cooked (reheated); Russet Burbank, baked (conventional oven),
Russet Burbank, baked (microwave) and California white, boiled potatoes. They found
that there was no difference in terms of mean blood glucose AUC between the day
cooked and pre-cooked for both the Russet Burbank, baked (microwaved) and California

21
white, boiled potatoes. However, mean AUC after precooked Russet baked in a
conventional oven was 30% less than day-cooked potatoes, a difference which was
statistically significant (Fernandes et al., 2005).
There has also been some investigation around the effects of temperature cycling and the
duration and extent of cold treatments on starch digestibility and the GI (Englyst &
Cummings, 1987; García-Alonso & Goñi, 2000; Kingman & Englyst, 1994; Fernandes et
al., 2005; Leeman et al., 2008). For example, French fries which are pre-cooked, frozen
and then reheated, typically by frying or baking tend to have lower GIs than freshly
cooked potatoes. Fernandes et al. (2005), reported the GI of baked French fries to have an
intermediate GI of 63.6±5.5, which was significantly lower than the boiled red potato
(89.4±7.2). Leeman et al. (2008), reported a low GI of 54 for baked French fries tested in
their study, which was significantly lower than Asterix boiled potatoes (78). These
relatively low GIs may be explained by the pre-cooking, freezing and then reheating
process which has showed to create more SDS and RS fractions in-vitro (García-Alonso
& Goñi, 2000). Another theory is the formation of amylose-lipid complexes formed
during frying and/or reheating which are more slowly digested or resistant to α-amylase
(García-Alonso & Goñi, 2000). It is obvious that different processing methods can affect
the digestibility of a potato, which ultimately affects its GI. Certain physicochemical
properties of the starch may influence how different potato varieties are affected by
heating and cooling treatments. These properties will be discussed in the following
section, along with different environmental factors, that could affect them.

22
2.4.1 Physicochemical Factors Influencing Starch Digestibility and the GI
The following briefly reviews some of the physicochemical properties and environmental
factors that have been indicated as factors in influencing potato starch digestibility.
2.4.1.1 Amylose: amylopectin ratio
The ratio of amylose to amylopectin within potato starch is considered the most
important factor affecting the rate and extent of hydrolysis (Zhang et al., 2008). As
previously discussed starch granules typically contain amylose and amylopectin in a ratio
of 1:3 (Camire et al., 2009). This ratio can explain why cooked potatoes typically have
high GIs, as amylopectin due to its branched structure, is the polysaccharide that is
readily gelatinized (Camire et al., 2009). Potato starch containg higher degrees of
amylose, would likely result in less gelatinized starch upon heating resulting in more SDS
or RS and a lower GI. A high degree of amylose may also be advantageous upon
cooling. As it is linear amylose that is, better able to re-associate to form a crystalline
(retrograded) structure that is more resistant to digestion (Camire et al., 2009).
2.4.1.2 Amylopectin Branching
Identifying the fine structure of amylopectin, namely the chain length distribution and its
branching pattern is important to understanding starch digestibility as well (Zhang et al.,
2008). Amylopectin containg a greater number of branches has a lower gelatinization
temperature, and amylopectin with a greater number of long chains requires a higher
gelatinization temperature (Zhang et al., 2008). This study also indicated starch samples
with amylopectin that had either a high proportion of short chains or a high proportion of

23
long chains contained a higher content of SDS. Therefore the Zhang et al. (2008) study
indicated at least two types of amylopectin structures that are characteristic of SDS
fractions. Longer chain length and high amount of longer chain fractions in the starch
molecule has a potential role in starch retrogradation as well (Englyst, Kingman, &
Cummings, 1992a). A study by Liu et al. (2007) reported a Karnico potato to contain
higher amylose content and a greater proportion of long chains, which resulted in the
highest resistant starch content of any of the other varieties tested in both its native and
gelatinized form.
2.4.1.3 Phosphorus Content
As mentioned, potatoes have quite marketable phosphorus contents, and besides its
nutritional implications, phosphorus indirectly affects starch digestion and absorption as
it plays an important role in gelatinization and retrogradation processes. In potato starch,
the phosphorus is mainly present as phosphate monoesters, which are covalently bound to
amylopectin and thus it has been reported as being negatively correlated with linear
amylose (Karim et al., 2007). Phosphorus has also been noted to facilitate the swelling of
amylopectin during the gelatinization or heating process (Karim et al., 2007). Since
phosphorus is associated with amylopectin, which is readily gelatinized compared to
amylose, high phosphorus content can be linked with a more rapid rate of starch digestion
and absorption.
2.4.1.4 Year of Harvest and Environmental Influences
Year to year variation within the same variety with regards to the physicochemical
properties of potato starch have been reported (Svegmark et al., 2002). Variation in
24
growing conditions (i.e. weather, growing location) has been shown to influence
gelatinization behavior of the starch, granular size, amylose and phosphorus content, both
within and between varieties (Haase & Plate, 1996; Cottrell et al., 1995).
2.4.1.5 Maturity
There is evidence that small or “new” potatoes have slower rates of digestion compared
to larger or more mature ones resulting in a lower GI value (Soh & Brand-Miller, 1999).
It has been suggested that the reduction could be due to the fact that less mature potatoes
have a lesser degree of amylopectin branching, which leads to a higher resistance to
gelatinization, resulting in a slower rate of starch hydrolysis indicated by a low GI (Soh
& Brand-Miller, 1999). An in-vitro study however, did not report significant differences
between early and late potatoes and attributed the observed differences in the Soh &
Brand-Miller (1999) study to be due to some other food factor (Leeman et al., 2005). A
study by Henry et al. (2005) found similar results as Soh & Brand-Miller (1999), in that
earlier crop varieties generally had lower ( intermediate GI=56-69) GIs than the main or
late crop varieties (high GI≥70).
25
Chapter 3
Rationale, Objectives, Hypotheses
3.1 Rationale
Based on the literature, both in-vitro and in-vivo studies have confirmed that freshly
cooked potato starch generally, is rapidly digested and absorbed in the small intestine,
causing a more rapid rise in postprandial glucose. This has lead to the classification of
potatoes as a high GI food. Due to the association of high GI diets with negative health
outcomes such as diabetes and cardiovascular disease, potatoes have the potential of
being limited or even excluded from the diet, and from recent potato consumption data
this may already be the case (AAFC, 2007).
What are not always considered in classifying starch based on its digestibility are factors
such as; variety, preparation methods, physicochemical properties of the starch (i.e. ratio
of amylopectin to amylose), harvest date/year and growing conditions. Based on review
of the literature there is evidence to suggest that these factors can influence each other
thereby influencing the digestibility of the potato itself. This suggests that not all potatoes
can be labeled with one high GI value. If the goal, ultimately is to increase overall intake
of foods high in SDS and RS content due to their associated health benefits, than it is
important to obtain a better understanding of these factors and their effects on the
glycemic response.
A network of scientists from across the country, including plant breeders and starch
chemists (Bio Potato Network (BPN)) are in collaboration in order to identify specific

26
genotypes/germplasm with properties such as high amylose content and special branch
structures of amylopectin. Their overall goal is to ultimately develop or breed potato
starch that is slowly or less absorbed, resulting in new potato varieties with low GIs. We
examined a total of four such varieties (not available commercially), which differed with
respect to their amylose and fibre contents, to investigate how varying these and other
factors may affect the GI of potatoes. We previously showed that the effects of certain
preparation methods on the GI may depend on potato variety (Fernandes et al., 2005).
Thus, a pilot study (study 1) was designed to determine whether we could use one
preparation method for all varieties, or whether it was important to test various methods
for all varieties received. This led to the development of our first objective. Further
objectives were established based on the results from study 1. A total of three studies
were developed in accordance with the following objectives and hypothesis.
3.2 Objectives
1. To determine if the effects of cooking, cooling and reheating on the GI of potatoes
differs depending on the variety.
2. To confirm the effects of cooking and cooling on the GI in a subsequent harvest year
on varieties that were affected differently by these treatments in study 1.
3. To investigate the rate and extent of starch absorption after cooked and cooled potato
meals to determine whether the reduction in GI upon cooling can be explained by the
formation of RS or by the creation of SDS.

27
3.3 Hypotheses
1. The effects of cooking, cooling and reheating on the GI of potatoes will differ
depending on variety.
2. The effects of cooking and cooling on the GI of potatoes noted in study 1 will be
confirmed in a subsequent harvest year.
3. A small amount of RS will form when a cooked potato is cooled, however the
creation of SDS will explain the reduction in GI

28
Chapter 4
Methods
4.1 Study 1
4.1.1 Overview
During study 1, GI testing was conducted on four different potato varieties, harvested in
Fall 2008 to determine whether cooking, cooling and reheating processes affected the
varieties differently. This study took place from February-April 2009.
4.1.2 Subjects
Twenty healthy subjects participated in this study. Subjects were divided randomly into
two equal groups. Group A consisted of five females and five males with a mean age of
20.1± 0.7 years, mean height of 171.9 ± 2.0 cm, mean weight of 73.2 ± 4.5 kg, and mean
BMI of 24.6± 1.1 kg/m2. Group B consisted of six females and four males, with a mean
age of 20.5± 0.5 years, mean height of 170.9± 2.6 cm, mean weight of 68.7± 3.3kg, and
mean BMI of 23.7± 0.7 kg/m2. One male subject from group B could no longer
participate after one test visit, thus a male subject from group A completed the remainder
of the potato tests assigned to group B in addition to his tests for group A.
Subjects were excluded if they reported having diabetes mellitus or glucose intolerance as
well as any metabolic or gastrointestinal disease that interfered with nutrient absorption.
Subjects were free of medications that interfered with nutrient absorption, metabolism,
excretion or gastric motility and had not taken corticosteroids within three months or

29
antibiotics within three weeks of starting the study. All subjects provided written
informed consent before participation. The Research Ethics Board at the University of
Toronto granted ethics approval.
4.1.3 Test Meals
Four potato varieties, which differed with respect to their starch composition and fibre
content, were tested. These varieties were not available commercially during the study
period and will therefore be identified as varieties 1, 2, 3 and 4. Varieties 1 and 2 were
grown in Vauxhall, Alberta while varieties 3 and 4 were grown in Fredericton, New
Brunswick. All varieties were harvested during the 2008 season. Potatoes were stored at
Guelph University, at 11ºC, until required for the study. All varieties were sprout
inhibited, prior to their shipment to Guelph to prevent spoilage. Once at the lab potatoes
were stored in a dark cupboard at ambient temperature.
In order to complete the study in a timely manner, subjects in group A tested varieties 1
and 2 and group B tested varieties 3 and 4. Each variety was boiled and served to subjects
either fresh boiled, cold or reheated. Thus each subject in each group consumed six
potato test meals. In terms of preparation, on the morning of each test day potatoes were
cut into 2.5-3cm cubes and then weighed into predetermined portions (described below).
Individual portions (potato meals) were boiled in salted water with skin intact for 15
minutes, and then drained. Boiled potato meals were either served to subjects
immediately (fresh boiled) or they were cooled in the refrigerator at 4ºC and either served
cold or reheated to subjects 24-48 hrs later. Reheated potato meals, were warmed in the
microwave for 2-3 min and then served.

30
In addition to the potato meals, all subjects consumed a test meal of baked potato chips.
This served as a positive control, to verify that the GI for this food was the same in both
subject groups, to provide validity for the between group comparisons of GI values of the
different potato varieties. Each subject also consumed a test meal of white bread, on
three separate occasions, which served as a reference food for GI determination. White
bread was baked from weighed ingredients in a bread maker as previously described
(Wolever et al., 2003).
All test meals contained 50g available carbohydrate (defined as total carbohydrate minus
dietary fibre). For each variety, total carbohydrate and fibre content was determined by
proximate analysis. Proximate analysis was performed by Agri-Food Laboratories in
Guelph, Ontario and analysis for total dietary fibre was performed by Maxxam Analytics
in Mississauga, Ontario. Results from this analysis were given in 100g fresh weight units
and were then used to determine the weight of each variety to feed to ensure each test
meal contained 50g of available carbohydrate. Test meal composition of varieties 1, 2, 3
and 4 are presented in Table 1. The composition of the baked potato chip test meal was
determined by its nutrition facts table, and is presented in Table 1. The composition of
the reference white bread was predetermined using proximate analysis and has been
frequently re-analyzed (Table 1).
4.1.4 Protocol
The study was conducted at Glycemic Index Laboratories in Toronto, Ontario. Each test
lasted for 2 hours (120 min), and subjects were required to leave at least 48 hrs between
visits. Subjects arrived at the lab between 8-9:30am on the morning of the test after

31
Table 1. Test meal composition for Study 1
Test Meals Weight
(g)
Energy
(kcal)
Fat
(g)
Protein
(g)
Total
CHO
(g)
Fibre
(g)
Available
CHO
(g)
Variety 1a
345 252 0 7.2 55.8 5.8 50.0
Variety 2a
360 256 0 6.5 57.2 7.2 50.0
Variety 3a
321 244 0 6.1 55.6 5.4 50.0
Variety 4a
394 256 0 7.1 56.3 6.3 50.0
Baked Lays
potato chips
66 264 3.3 5.3 54.1 4.0 50.0
White bread b
104 245 1.7 7.5 52.8 2.8 50.0
Abbreviations: CHO, carbohydrate
a Proximate analysis performed by Agri-Food Laboratories, Guelph (Moisture: AOAC
930.15 (not shown), Protein: AOAC 990.03, Ash: AOAC 942.05 (not shown), Fat:
AOAC 920.39, Carbohydrate: by difference); Analysis for Total Dietary Fibre performed
by Maxxam Analytics, Mississauga (Total Dietary Fibre: AOAC 993.43, 985.29).
b Typical portion size, actual weight varied slightly due to moisture variations.

32
fasting for 10-12 hours. Each subject came to the lab on 10 separate mornings (6 potato
tests, 1 baked potato chip test and 3 white bread tests). Upon arrival, subjects were
weighed and two fasting blood samples (-5min and 0min) were collected by finger-prick
using a Microlet lancing device (Bayer Diagnostics, Tarrytown, NY, USA). Subjects then
consumed one of the test meals described above plus a drink of 250ml of water, tea, or
coffee with 30ml of 2% milk if desired (type and volume of beverage chosen by each
subject remained the same for the entire series of test foods). Test meals were consumed
within 15 minutes and within each group, each subject consumed all test meals in a
randomized order. Additional finger-prick blood samples (2-3 drops) were taken at 15,
30, 45, 60, 90, and 120 minutes after the start of the meal. Blood was collected into
fluoro-oxalate tubes, stored at -20ºC, before analysis for glucose.
4.1.5 Analytical Methods
Finger- stick whole blood glucose for each time point was analyzed using a Model 2300
STAT analyzer (Yellow Springs Instruments, Yellow Springs, OH, USA).
Dr. Q. Lui’s lab at Agriculture, Agri Food Canada (AAFC) provided physiochemical data
for all four varieties, to correlate with the GIs of the potatoes. Starch was isolated from
the varieties following the methods described in Liu et al. (2003). Amylose of potato dry
matter was determined by iodine colorimetry according to Williams et al. (1970) (Table
2). RDS, SDS and RS were also obtained from AAFC. Cooked starch samples from each
variety were treated with pancreatic α-amylase and amyloglucosidase and incubated for
20 and 120 minutes. Starch digestibility in vitro was measured based on the Englyst et al.
(1992a) method. Starch classifications were based on the rate of hydrolysis with; RDS,

33
Table 2. Amylose, RDS, SDS and RS content of potato starch*
Potato Amylose in dry
matter (%)
RDS in potato
starch (%)a
SDS in potato
starch (%)a
RS in potato
starch (%)b
Variety 1
27.1 ±0.2 73.8± 0.2 3.7± 2.1 22.5
Variety 2
24.3±0.2 71.1± 2.5 4.6± 1.9 24.3
Variety 3
22.7±0.2 68.7± 1.9 7.4± 1.0 24.0
Variety 4
22.8±.0.1 68.5± 1.8 5.8± 0.8 25.7
Abbreviations: RDS, rapidly digestible starch, SDS, slowly digestible starch, RS,
resistant starch.
*Values denote means ± SEM. Values for amylose obtained from the mean value of two
raw potato samples for each variety. RDS, SDS obtained from the mean values of two
cooked starch samples for each variety.
a RDS, SDS based on rate of starch hydrolysis with RDS classified as starch digested
within 20 minutes and SDS classified as starch digested between 20-120 minutes
(Englyst et al., 1992a)
b RS determined by; (100- (% RDS + % SDS)) and is classified as undigested starch after
120 minutes (Englyst et al., 1992a)

34
digested within 20 minutes, SDS, digested between 20-120 minutes and RS, undigested
after 120 minutes (Table 2). TS was not provided however, in order to determine RS it
was suggested to use 100, in place of the TS value.
4.1.6 Calculation of Glycemic Index
Incremental areas under the blood glucose curve (AUC), excluding area below fasting,
were calculated using the trapezoid rule (FAO, 1998). The AUC for each potato test
meal in each subject was expressed as a percentage of the mean AUC for the white bread
test meals taken by the same subject resulting in that subject’s individual GI. The GI for
each potato meal was then taken as the average of all ten individual subject values.
Both glucose and white bread have been used as the reference food for GI testing. To
reduce confusion it has been recommended that cited GI values be expressed on the
glucose scale (Wolever et al., 2003). Thus the GI values from this study were converted
to glucose-based GI values (i.e. GI of glucose= 100) by multiplying the bread based GI
values by 0.71, as white bread elicits a glycemic response 29% less than that of oral
glucose (Wolever et al., 2003).
4.1.7 Statistical Analysis
Results are expressed as means ± standard error of the mean (SEM). To determine if the
GI of baked potato chips differed between group A and group B a two-tailed un-paired t-
test was conducted.
Blood glucose profiles for each variety (1,2,3, and 4) and treatment (fresh boiled, cold,
and reheated) were subjected to analysis of variance (ANOVA) to identify a possible

35
time× treatment × variety interaction. If this three way interaction was significant, data
from each time point was subjected to ANOVA examining for the effects of treatment
and variety. AUC and GI values were also subjected to ANOVA examining for the main
effects of potato variety and treatment and the variety×treatment interaction. If the
variety×treatment interaction was significant, data from each variety was subjected to
ANOVA examining for the effects of treatment. After demonstration of significant
heterogeneity, the significance of differences between individual mean blood glucose
concentrations at each time point, AUC and GI values were determined using the
Bonferroni method to adjust for multiple comparisons. A separate analysis was also
conducted to compare the GIs of each potato test meal to that of white bread (GI white
bread= 71). This analysis involved only one factor (food) and thus a one-way ANOVA
was conducted.
Simple regression analyses were preformed to assess the relationship between the GIs for
all four potato varieties (fresh boiled and cold test meals) and the physicochemical data
(percent amylose, RDS, SDS, and RS) received from AAFC.
Differences and relationships were considered significant if two-tailed P ≤ 0.05. Analysis
was done using SPSS Statistics version 17.0.
4.2 Study 2
4.2.1 Overview
During study 2, two varieties (harvested in fall 2009) from study 1 were re-tested. The
results of study 1 showed that the GI of these two varieties were affected by cooking and

36
cooling differently, and thus potatoes were re-investigated to confirm these different
effects. This study took place from December 2009-January 2010.
4.2.2 Subjects
Ten healthy subjects (n= five females and five males) with a mean age of 42.3± 3.3 years,
mean height of 167.5± 3.2 cm, mean weight of 75.4± 3.0 kg, and mean BMI of 26.9±0.4
kg/m2
participated in this study. Subjects in study 2 met the same inclusion criteria, as
defined in section 4.1.2. All subjects provided written informed consent before
participation. The Research Ethics Board at the University of Toronto granted ethics
approval.
4.2.3 Test Meals
Two of the four potato varieties tested during study 1 (varieties 2 and 3) were re-tested
during this study. These potatoes however, were harvested during the 2009 growing
season. Variety 2 was grown in the same location as the potatoes for study 1 (Vauxhall,
Alberta) but were harvested earlier, at 100 days vs. at maturity (120 days). Variety 3 was
grown in Guelph, Ontario, while the variety 3 potatoes tested in study 1 were grown in
Fredericton, New Brunswick. Both varieties were stored as described in section 4.1.3, but
only variety 2 was sprout inhibited.
All ten subjects tested both variety 2 and 3. Preparation methods were the same as those
explained in section 4.1.3; however, potatoes were not served to subjects reheated. Each
variety was served fresh boiled and cold. Each subject thus consumed four potato test
meals.

37
Subjects were not required to consume a test meal of baked potato chips, as there was
only one group of subjects in study 2. Each subject also consumed a test meal of white
bread, on two separate occasions, serving as the reference food.
For each variety, total carbohydrate and fibre content was determined by proximate
analysis using the methods explained in section 4.1.3, to determine the weight of each
potato variety required to feed 50 g of available carbohydrate (Table 3). The composition
of the reference white bread was predetermined using proximate analysis, as in study 1
(Table 3).
4.2.4 Protocol
The protocol for this study was similar to that described in section 4.1.4 for study 1. The
only difference being subjects were required to visit the lab on six separate occasions (4
potato tests and 2 white bread tests) opposed to ten. Like study 1, all subjects consumed
the test meals in random order.
4.2.5 Analytical Methods
Analytical methods preformed during this study were the same as those described in
section 4.1.5 for study 1. No physicochemical data was received from AAFC for the
potatoes in study 2.
4.2.6 Calculation of Glycemic Index
The GI for the potato meals tested during this study, were calculated as described in
section 4.1.6 for study 1.

38
Table 3. Test meal composition for Study 2
Test Meals Weight
(g)
Energy
(kcal)
Fat
(g)
Protein
(g)
Total
CHO
(g)
Fibre
(g)
Available
CHO
(g)
Variety 2a
291 242 0 5.5 54.9 4.9 50
Variety 3a
250 235 0 4.8 54 4 50
White bread b
104 245 1.7 7.5 52.8 2.8 50
Abbreviations; CHO, carbohydrate
a Proximate analysis performed by Agri-Food Laboratories, Guelph (Moisture: AOAC
930.15 (not shown), Protein: AOAC 990.03, Ash: AOAC 942.05 (not shown), Fat:
AOAC 920.39, Carbohydrate: by difference); Analysis for Total Dietary Fibre performed
by Maxxam Analytics, Mississauga (Total Dietary Fibre: AOAC 993.43, 985.29).
b Typical portion size, actual weight varied slightly due to moisture variations.

39
4.2.7 Statistical Analysis
Results are expressed as means±SEM. Blood glucose profiles, AUC and GI values for
each variety (2 and 3) and treatment (fresh boiled and cold) were subjected to ANOVA as
described in section 4.1.7.
Additionally, the GI values from study 1 for variety 2 and 3 (fresh boiled and cold) were
included in the analysis to investigate the effects of year of harvest on the GI, as potatoes
tested in study 1 were harvested in Fall of 2008, and potatoes for study 2 were harvested
Fall 2009. GI values from both years were subjected to ANOVA examining for the main
effects of potato variety (2 and 3), treatment (fresh boiled and cold), and year of harvest
(2008 vs. 2009), and the year×variety, variety×treatment, year×treatment and
year×variety×treatment interactions. If any significant interactions were identified
ANOVA was used to look at differences in one factor across all levels of another factor,
or factors in the case of a three-way interaction. After demonstration of significant
heterogeneity, the significance of the differences between GI values was assessed using
Bonferroni method for multiple comparisons. Differences were considered significant if
two-tailed p ≤ 0.05. Analysis was done using SPSS Statistics version 17.0.
4.3 Study 3
4.3.1 Overview
During study 3, two varieties (harvested in fall 2009) from study 1 were re-tested, one of
these varieties being the same variety that was re-tested in study 2. The results of study 1
showed that the GIs of both varieties were affected by cooking and cooling processes

40
differently so study 3, not only looked to confirm these results but to investigate if the
differences between varieties could be explained by slowly or malabsorbed starch. This
study took place from March-April 2010.
4.3.2 Subjects
Nine of the ten subjects who participated in study 2 also volunteered for study 3. One of
the subjects was unable to continue, as he was having difficulty consuming the potato
meals; therefore, an additional subject was recruited. Subject characteristics were as
follows; four females and six males with a mean age of 43.8± 2.7 years, mean height of
169.3± 3.1 cm, mean weight of 76.8 ± 3.0 kg, and a mean BMI of 26.8± 0.4 kg/m2. The
new subject was screened, while the other subject’s information was only verified. All
subjects met inclusion criteria as defined in section 4.1.2 for study 1. Subjects provided
written informed consent before participation and the Research Ethics Board at the
University of Toronto granted ethics approval.
4.3.3 Test Meals
Variety 1 potatoes were re-tested during this study and where harvested during the 2009
growing season. Variety 1 potatoes for study 3 were grown in Fredericton, New
Brunswick (2009), while variety 1 potatoes tested in study 1 where grown in Vauxhall,
Alberta (2008). Variety 1 potatoes from both study 1 and 3, were harvested in different
years but had a similar harvest date. These potatoes were also sprout inhibited and stored
as described in section 4.1.3. Variety 3 was tested again during study 3; but these
potatoes were grown in Fredericton, New Brunswick as in study 1. Although study 2 and
3 were conducted during the same harvest year (2009), the variety 3 potatoes grown in

41
Guelph (study 2) were not sprout inhibited. Since study 3 was planned for several months
after harvest, sprout inhibited potatoes were required for a prolonged shelf life. This is
why variety 3 potatoes from Fredericton were used, as they had been sprout inhibited
prior to shipment. The harvest dates for variety 3 were the same across all three studies,
and the potatoes were stored as described in section 4.1.3.
All ten subjects tested both variety 1 and 3. Preparation methods were the same as those
explained in section 4.2.3 with each subject consuming four potato test meals. Similarly,
to study 2 all subjects consumed a test meal of white bread, on two separate occasions.
One of the bread test meals also included 20 ml of a lactulose solution (Ratio-Lactulose
667mg/ml) which provided 10g of lactulose. This was dissolved in 100ml of water.
Lactulose represented a known amount of malabsorbed carbohydrate. This allowed for
calibration of the amount of H2 produced (method of collection explained below) by each
subject per gram of malabsorbed carbohydrate, estimating semi-quantitatively the amount
of carbohydrate malabsorbed after each of the other test meals. Table 4 includes the test
meal composition for study 3, as determined by proximate analysis described in section
4.1.3.
4.3.4 Protocol
Subjects visited the lab on 6 separate occasions (4 potato test meals , 1 white bread and 1
white bread + lactulose test meal), consuming the test meals in random order. Each test
lasted for 8 hours (480 min). Over the first 2 hours, a test meal was consumed and blood
samples were obtained exactly as described above in section 4.1.4. Once the 2 hour (120
min) blood sample had been taken subjects remained seated quietly, until 4 hours (240

42
Table 4. Test meal composition for Study 3
Test Meals Weight
(g)
Energy
(kcal)
Fat
(g)
Protein
(g)
Total
CHO
(g)
Fibre
(g)
Available
CHO
(g)
Variety 1 a
235 237 0.24 5.4 53.5 3.5 50.0
Variety 3 a
301 250 0.30 6.3 55.4 5.4 50.0
White bread b
104 245 1.7 7.5 52.8 2.8 50.0
Abbreviations; CHO, carbohydrate
a Proximate analysis performed by Agri-Food Laboratories, Guelph (Moisture: AOAC
930.15 (not shown), Protein: AOAC 990.03, Ash: AOAC 942.05 (not shown), Fat:
AOAC 920.39, Carbohydrate: by difference); Analysis for Total Dietary Fibre performed
by Maxxam Analytics, Mississauga (Total Dietary Fibre: AOAC 993.43, 985.29).
b Typical portion size, actual weight varied slightly due to moisture variations.

43
min), where they took another finger-prick blood sample and consumed a standard
lunch meal provided (described below). Subjects consumed the lunch meal within 15
minutes and additional blood samples were taken at 255, 270, 285, 300, 330, 360 minutes
after starting to eat their morning test meal. Blood glucose was measured after the
standard lunch meal, to investigate the second meal effect of the potato test meals on the
blood glucose response of a meal served later.
The standard lunch consisted of a cheese, tomato, lettuce and turkey sandwich (2 slices of
Dempster’s white bread, 20g of cheddar marble cheese (Selection brand), 30g hot house
tomato, 10g romaine lettuce, 60g oven roasted turkey breast (Selection brand), and 1 tbsp
Helman’s ½ The Fat Mayonnaise), a choice of either 250ml apple juice (Rougemont
McIntosh apple juice) or 250ml orange juice (Tropicana No Pulp 100% orange juice),
and two Oreo cookies (choice of either Golden Oreo or Original Oreo). One subject was a
vegetarian and requested no turkey, and another subject requested no cheese. Food
choices and amounts determined at the first visit remained consistent for the other five
test days. The lunch provided approximately 606 kcal, 25.4 g protein, 19.5g fat, 82.5g
carbohydrate and 2.1g fibre. The macronutrient content of each food choice is presented
in Table 5.
In addition to blood samples, breath samples were collected fasting (2 samples) and at
hourly intervals after the start of the test meal for 8 hours. Thus each subject collected a
total of 10 breath samples per test day. Expired air was collected into 10 ml evacuated
glass tubes using an EasySampler device (Quintron Instruments, Milwaukee, WI, USA)
and stored at room temperature. After the last blood sample (360 minutes), subjects had

44
Table 5. Macronutrient composition of standard lunch for Study 3 a
Possible Choices
Serving Kcal Fat Protein CHO Fibre
Dempsters White Bread
2 slices (71g) 170kcal 1.5g 6g 34g 1g
Oven Roasted Turkey Breast
3 slices (60g) 60kcal 1g 12g 2g 0g
Rougemont McIntosh Apple
Juice
OR
Tropicana No Pulp 100%
Orange Juice
250ml 110kcal 0g 0g 27g 0g
250ml 110kcal 0g 2g 27g 0g
Golden Oreo Cookie
OR
Oreo Original Cookie
2 cookies (24g) 120kcal 5.0g 1g 17g 0g
2 cookies (24g) 120kcal 5.0g 1g 17g 1g
Helman’s ½ the fat
Mayonnaise
1 tbsp 45kcal 5g 0g 1g 0g
Tomato
2 slices (30g) 6 kcal 0g 0.3g 1.2g 0.4g
Romaine Lettuce
1 leaf (10 g) 2 kcal 0g 0.1g 0.3g 0.2
Cheddar Marble Cheese-
Selection
1 slice (20g) 80kcal 7g 5g 0g 0g
Abbreviations; CHO, carbohydrate
a Nutritional information for each food was obtained from its nutrition fact table. Lettuce
and tomato nutritionals obtained from the Canadian Nutrient File (Health Canada, 2009).

45
the option to either remain at the lab or take the EasySampler home to collect their last
two breath samples. If they decided to go home they were instructed to bring the tubes
back to the lab on their next scheduled visit.
4.3.5 Analytical Methods
Finger-stick blood samples from both the morning and lunch meals were analyzed for
glucose as described for study 1 in section 4.1.5. Two out of 825 (0.24%) blood samples
were recorded as missing secondary to blood clotting during storage. Missing data were
imputed by averaging the preceding and following values.
Breath samples were analyzed for carbon dioxide, H2, and methane content using gas
chromatography (Microlyzer Gas Analyzer, model SC; Quintron Intruments) at the
University of Toronto. Very high carbon dioxide concentrations were present in 5 of the
600 breath samples (0.83%); these were considered poor samples and data were entered
as missing. Missing data were imputed by interpolating from preceding and following
values. If the last breath sample (480 min) was missing, the 420 min value was inserted.
4.3.6 Calculation of Glycemic Index
Blood glucose data collected during the morning session of study 3 were used to
calculate the GI of the potato meals, as described for study 1 in section 4.1.6.
4.3.7 Statistical Analysis
Results are expressed as means±SEM. AUCs were calculated separately for 0-120 min
(blood glucose response to morning test meals) and 240-360 min (blood glucose response

46
to a standard lunch). The GI values of the potatoes were calculated as described for study
1 using the AUC values for 0-120min. Blood glucose profiles (0-120 min and 240-360
min), AUC (0-120 min and 240-360 min) and GI values for each variety (1 and 3) and
treatment (fresh boiled and cold) were subjected to ANOVA as described in section 4.1.7.
The GI values from study 1 for variety 1 and 3 (fresh boiled and cold) were included in
the analysis to investigate the effects of year of harvest on the GI. The statistical analysis
described for study 2 in section 4.2.7 were the procedures used.
Breath hydrogen profiles for each variety and treatment were subjected to ANOVA,
similar to the procedures described in 4.1.7 for the blood glucose profiles. The total
hydrogen produced by each subject over each test day was calculated by summing the
hydrogen concentration from baseline (defined as the lowest value in the first 3 hours) to
8 hrs. To evaluate the differences between test meals, total hydrogen data was subjected
to ANOVA, as described in section 4.1.7 for the blood glucose AUC. In a separate
analysis, hydrogen profiles after lactulose were compared to each potato meal profile
using a two factor ANOVA (time× test meal) while total hydrogen produced after
lactulose was compared to each of the potato meals and white bread using a one factor
(test meal) ANOVA.
Total H2 per gram of lactulose, L, was calculated for each subject as L = (BL-B)/10 g,
where BL is total H2 after the white bread plus lactulose meal and B is total H2 after
white bread alone. The amount of malabsorbed carbohydrate in each potato test meal
was calculated for each subject as P/L, where P is total H2 after the potato test meal and L
is total H2 per gram of lactulose. Differences between test meals in terms of malabsorbed

47
carbohydrate were assessed using ANOVA, as described for blood glucose AUCs and
total hydrogen. The amount of malabsorbed carbohydrate in white bread, was compared
to each of the potato meals using a one factor ANOVA .
After demonstration of significant heterogeneity, the significance of differences between
means was assessed using the Bonferroni method to adjust for multiple comparisons. If
some results appeared not to be normally distributed, they were subjected to log-
transformation prior to statistical analysis. All differences were considered significant if
two-tailed P ≤ 0.05. In keeping consistent with study1 and study 2, all analysis for study
3 was conducted using SPSS Statistics version 17.0.

48
Chapter 5
Results
5.1 Study 1
The GI for baked potato chips was the same for both subject group A and group B, 72.3
± 6.1 and 71.2 ± 8.2 respectively (F= 0.279, p=0.929). This provides validity for between
group comparisons of the GI for the different potato varieties.
Variety 2 began to spoil halfway through the study, as a result 6 tests involving this
variety were unable to be completed including; 3 fresh boiled, 2 reheated and 1 cold
test. Missing data were interpolated based on a method described by Cochran & Snedecor
(1980).
Blood glucose response elicited by fresh boiled, reheated and cold potatoes for varieties
1, 2, 3 and 4 harvested in 2008 are shown in Figure 1. ANOVA could not identify a time
× variety interaction (F=1.5, p=0.99) or a time ×treatment ×variety interaction (F=1.2,
p=0.28) but a significant time × treatment interaction (F=7.5, p=<0.001) for each variety
was identified. Fresh boiled potatoes at 15 min elicited a significantly greater blood
glucose response than cold potatoes for variety 2, while in variety 1 fresh boiled potatoes
elicited a greater response at both 15 and 30 min. For variety 3, reheated and fresh boiled
treatments both elicited a significantly greater response than cold potatoes at 15, 45 and
60 min; at 30 min only the fresh boiled treatment was greater than the cold. Finally, for
variety 4, at 15, 45 and 60 min fresh boiled potatoes elicited a significantly greater
response than cold potatoes. At 30 min both reheated and fresh boiled treatments elicited

49
Variety 1
3
4
5
6
7
8
9
10
a
a
Blo
od
G
luc
os
e (
mm
ol/L
)
Variety 2
Fresh Cooked
Reheated
Cold
a
Variety 3
0 30 60 90 1203
4
5
6
7
8
9
10
ab
bab
ab
Time (min)
Blo
od
G
luc
os
e (
mm
ol/L
)
Variety 4
0 30 60 90 120
a
abc a
a
Time (min)
Figure 1. Glucose response elicited by fresh boiled, reheated and cold potatoes for
varieties 1,2,3 and 4 harvested in 2008. Values are means ± SEM (n=10). There was a
significant time x treatment interaction for each variety, F=7.5, p<0.001. Significant
differences; fresh boiled vs. cold treatments denoted by “a”; reheated vs. cold treatments
denoted by “b”; fresh boiled vs. reheated treatments denoted by “c”. All differences
significant at P<0.05.

50
a greater response than cold potatoes, and fresh boiled potatoes had a higher glucose
concentration than reheated potatoes at this time point. All differences were significant at
P<0.05.
There was no main effect of potato variety for the mean blood glucose AUC (F=1.4,
p=0.241) but a main effect of treatment (F=7.0, p= 0.001), with fresh boiled and reheated
potatoes having significantly greater AUCs than cold potatoes (182.5±27.6 and
181.7±26.7 vs. 123.2±21.7). There was no treatment ×variety interaction for the AUC of
the potato meals (F=1.1, p=0.387) (Table 6).
GI values for all potato varieties (harvested 2008) are shown and compared to the GI of
white bread in Table 6. The GI of variety 3 cold (40.3±5.3) was the only potato test meal
that differed significantly from that of white bread (GI= 71). Three of the twelve potato
meals (variety 2, 3, 4 cold) could be classified as low GI (GI ≤55). Five potato meals had
an intermediate GI (GI =55-69), while only four were classified as high GI (GI= ≥ 70)
(Table 6). ANOVA, showed no main effect of potato variety (F =0.9, p=0.42), but a
significant main effect of treatment (F = 15.1, p<0.001), with cold potatoes having a
lower GI than freshly boiled and reheated potatoes (48.7±6.4 vs. 67.9±6.4 and 70.2±5.1,
respectively) (Table 6). There was however, a significant treatment× variety interaction
(F=2.6, p=0.024), with cooling significantly reducing the GI of variety 3 and 4 and not
significantly reducing the GI of variety 1 and 2 (Table 6 and Figure 2). Figure 3, further
emphasizes the differences between varieties upon cooling a fresh boiled potato, as the
38.7±8.5 unit reduction upon cooling variety 3 was significantly greater than the
reduction in GI upon cooling varieties 1 and 2 (4.5±7.4 and 6.2±6.9 respectively)
(P<0.05).

51
Table 6. AUC and GI values for varieties 1,2,3, and 4 harvested in 2008,
served to subjects (n=10) fresh boiled, reheated and cold.
Treatment
Mean for
Variety
Fresh Boiled
Reheated Cold
AUC (mmol×min/L)
Variety 1
158.8±27.8 178.1±25.9 130.7±21.0 155.9±24.9
Variety 2
140.4±12.9 164.2±25.9 132.7±24.1 145.8±20.9
Variety 3
230.8±37.6 217.3±26.7 113.8±18.2 187.3±27.5
Variety 4
200.1±32.1 167.3±28.2 115.4±23.3 160.9±27.9
Mean for
Treatment
182.5±27.6a 181.7±26.7
a 123.2±21.7
b
Glycemic Index
Variety 1
59.8±5.2 75.3±5.3 55.3±6.9 63.5±5.8
Variety 2
61.2±3.9 69.1±5.3 55.0±6.5 61.8±5.2
Variety 3
79.1±8.8a 78.5±4.3
a 40.3±5.3
b y 66.0±6.1
Variety 4
71.6± 7.8a 57.8± 5.3
ab 44.1± 6.7
b 57.8±6.6
Mean for
Treatment
67.9±6.4a 70.2±5.1
a 48.7±6.4
b
Values are means ± SEM
a b GI values not sharing the same letter superscripts differ significantly within each row
(P<0.05).
y GI values of potato meals that differ significantly from the GI of white bread (GI= 71).

52
0
20
40
60
80
100
a
a
b
Variety 1 Variety 2 Variety 3 Variety 4
a
b
ab
Fresh Boiled
Reheated
Cold
GI
Figure 2. GI of fresh boiled, reheated and cold potatoes for varieties 1,2,3 and
4. Values are means ± SEM (n=10). A significant treatment x variety interaction
existed (F=2.6, p=0.024). Bars with different letters, within each variety differ
significantly (P<0.05).

53
0
10
20
30
40
50
Variety 1 Variety 2 Variety 3 Variety 4
a
ab
bb
Re
du
cti
on
in
GI
Figure 3. Reduction in the GI upon cooling fresh boiled potatoes. Each bar
represents the difference between the GI of fresh boiled and cold potatoes for each
variety. Values are means ± SEM (n=10). The reduction in the GI upon cooling
variety 3 was significantly greater than the reduction in variety 1 and 2 (P<0.05).
Bars with different letters, differ significantly (P<0.05).
54
There was a significant positive correlation between the GI of fresh boiled potatoes and
% SDS (r=0.982, p=0.02). Although GI of fresh boiled potatoes was negatively
correlated with both % RDS (r=-0.866, p=0.13) and % Amylose (r=-0.823, p=0.17) these
relationships did not reach significance (Figure 4). There was a significant negative
correlation between the GI of cold potatoes and % SDS (r=-0.951, p=0.049), but the
positive correlations between the GI of cold potatoes and % RDS (r=0.883, p=0.12) and
% Amylose (r=0.825, p=0.17), were not significant (Figure 5). Finally the % RS in
potatoes were not correlated with the GI of either fresh boiled (r=0.457, p=0.54) or cold
potatoes (r=-0.527, p=0.47) (Figures 4 & 5).
5.2 Study 2
Blood glucose response elicited by fresh boiled and cold potatoes for varieties 2 and 3,
harvested in 2009 are shown in Figure 6. A significant time× treatment× variety
interaction existed, (F= 5.4, p= 0.005). At 30 minutes, the blood glucose concentration
after variety 3 fresh boiled was significantly greater than after variety 3 cold (p<0.001)
and there was no difference between treatments for variety 2 at this time point. There
were no significant differences between treatments for any of the other time points. In
terms of mean blood glucose AUC for variety 2 and 3 (harvested 2009), there was no
main effect of treatment (F=4.1, p=0.059) but a significant main effect of potato variety
(F=9.9, p=0.005), with variety 3 having a significantly higher AUC than variety 2,
141±14 vs. 93±13, respectively. A significant treatment ×variety interaction existed
(F=8.8, p=0.008), as cooling significantly reduced the AUC in variety 3, and had no
effect on the AUC of variety 2 (Table 7).

55
50 60 70 80 9060
65
70
75
80
r= -0.866p= 0.13
A
RD
S (
%)
50 60 70 80 900
2
4
6
8
r= 0.982p= 0.02
B
SD
S (
%)
50 60 70 80 9020
22
24
26
28
r= 0.457p= 0.54
C
GI
RS
(%
)
50 60 70 80 9020
22
24
26
28
30
r= -0.823p= 0.17
D
GIA
mylo
se (%
)
Figure 4. Correlations between the GI of fresh boiled potatoes and: A % RDS ; B %
SDS; C % RS; and D % Amylose.
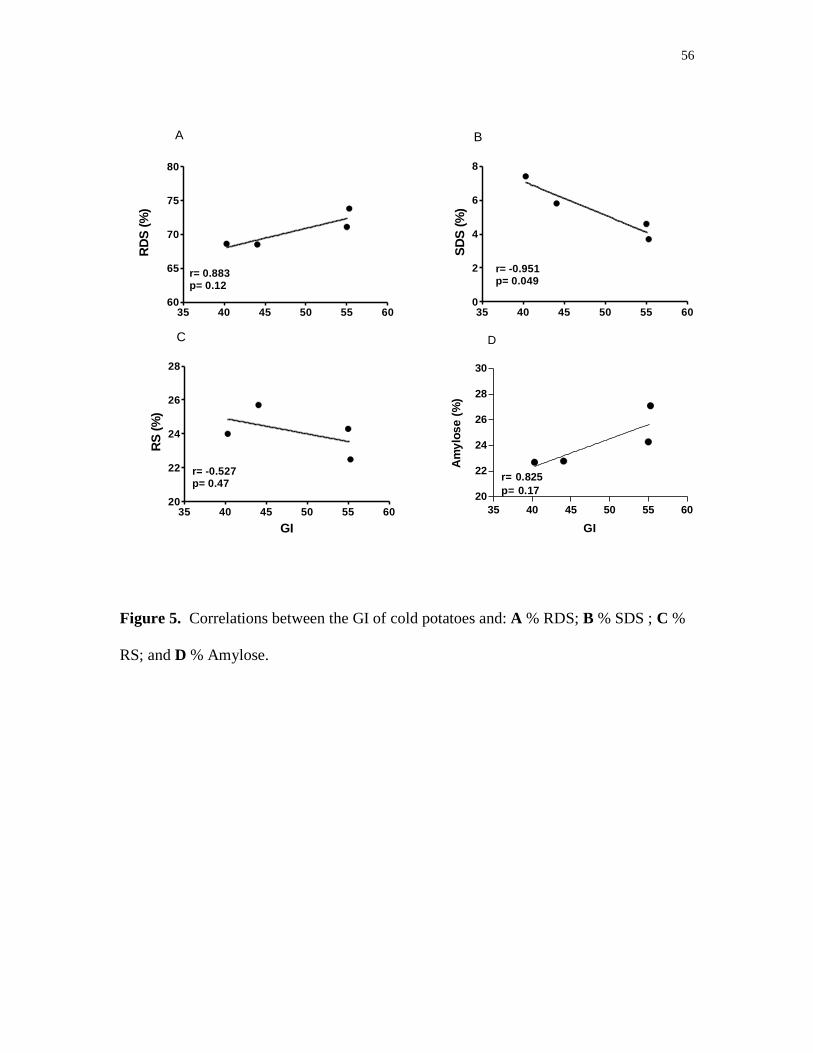
56
35 40 45 50 55 6060
65
70
75
80
r= 0.883p= 0.12
AR
DS
(%
)
35 40 45 50 55 600
2
4
6
8
r= -0.951p= 0.049
B
SD
S (
%)
35 40 45 50 55 6020
22
24
26
28
r= -0.527p= 0.47
C
GI
RS
(%
)
35 40 45 50 55 60
20
22
24
26
28
30
r= 0.825
p= 0.17
D
GI
Am
ylo
se
(%
)
Figure 5. Correlations between the GI of cold potatoes and: A % RDS; B % SDS ; C %
RS; and D % Amylose.

57
0 30 60 90 1203.5
4.5
5.5
6.5
7.5
8.5
Variety 2 Fresh Boiled
Variety 2 Cold
Variety 3 Fresh Boiled
Variety 3 Cold
a
Time (min)
Blo
od
G
luc
os
e (
mm
ol/L
)
Figure 6. Glucose response elicited by fresh boiled and cold potatoes for varieties 2 and
3 harvested in 2009. Values are means ± SEM (n=10). There was a significant time
×treatment ×variety interaction, F= 5.4, p= 0.005. Significant differences; fresh boiled vs.
cold treatments for variety 3 denoted by “a” (p<0.001).

58
Table 7. AUC and GI values for varieties 2 and 3 harvested in 2009, served
to subjects (n=10) fresh boiled and cold
Treatment
Mean for Variety
Fresh Boiled
Cold
AUC (mmol x min/L)
Variety 2
87±12 98±13 93±13x
Variety 3
168±14a 113±14
b 141±14
y
Mean for Treatment
128±13 106±14
Glycemic Index
Variety 2
37.8±5.5
40.6±5.0 39.2±5.3x
Variety 3 72.5±6.1a
48.6±6.9b 60.5±6.5
y
Mean for Treatment
55.2±5.8 44.6+6.0
Values are means ± SEM
a b Values not sharing the same letter superscripts differ significantly within each row
(P<0.05).
x y Mean AUC and GI for variety 2 differ significantly from mean of variety 3 (P<0.05).

59
The GI values for variety 2 and 3 harvested in 2009, are listed in Table 7. Variety 3 cold
and variety 2, fresh boiled and cold had low GI values (GI ≤55), while variety 3 fresh
boiled had a high GI (GI ≥70). Consistent with the AUC results there was no main effect
of treatment (F=4.3, p= 0.054), but a main effect of variety (F=10.3, p=0.005), with
variety 3 having a significantly higher GI than variety 2, 60.5±6.5 vs. 39.2±5.3,
respectively. There was a significant treatment× variety interaction (F=6.8, p=0.018), as
the GI for variety 3 fresh boiled was significantly greater than its GI cold , while there
was no difference between fresh boiled and cold potatoes for variety 2 (Table 7).
Figure 7 shows the GI’s for variety 2 and 3, harvested during 2008 and 2009. There was
a significant year of harvest ×variety interaction (F=5.1, p=0.027), as the GI of variety 2
differed across year of harvest while variety 3 virtually had the same GI two harvest
years in a row (Figure 8A). A significant treatment ×variety (F=11.6, p=0.001)
interaction also existed, indicating that cooling significantly reduced the GI of variety 3,
while having no effect on the GI of variety 2 (Figure 8B). The year of harvest ×treatment
interaction was not significant (F=1.87, p=0.176) and there was no significant year of
harvest ×treatment ×variety interaction (F=0.114, p=0.736).
5.3 Study 3
5.3.1 Glycemic responses and GI
Blood glucose responses elicited by fresh boiled and cold potatoes for varieties 1 and 3,
harvested in 2009 are shown in Figure 9. There was no treatment × variety (F=0.99,
p=0.756), time × variety (F=1.68, p=0.203) and no treatment × time × variety (F=1.38,

60
0
20
40
60
80
100
Variety 22008
Variety 2 2009
Variety 32008
Variety 3 2009
Fresh Boiled
Cold
GI
Figure 7. GI of fresh boiled and cold potatoes for varieties 2 and 3 harvested in 2008 and
2009. Values are means ± SEM (n=10).

61
0
20
40
60
80
100
Variety 2 Variety 3
2008
2009
a
b
AG
I
0
20
40
60
80
100
Variety 2 Variety 3
Fresh Boiled
Colda
b
B
Figure 8. A: Each bar represents the average GI of the fresh boiled and cold potato for
that year (2008 or 2009) and that variety (2 or 3). A year of harvest ×variety interaction
existed (F=5.1, p=0.027), the GI of variety 2 differed significantly between years but no
difference in GI between years for variety 3. B: Each bar represents the average GI of the
2008 and 2009 potatoes for that treatment (fresh boiled or cold) and that variety (2 or 3).
A treatment× variety interaction existed (F=11.6, p=0.001), cooling significantly reduced
the GI of variety 3, and had no effect on variety 2. Values expressed as mean ± SEM
(n=2). Bars with different letters, within each graph differ significantly (P<0.05).

62
0 60 120 180 240 300 3603.5
4.5
5.5
6.5
7.5
8.5
9.5Variety 1 Fresh Boiled
Variety 1 Cold
Variety 3 Fresh Boiled
Variety 3 Cold
b
ab
ab
ab
b
a
Time (min)
Blo
od
G
luc
os
e (
mm
ol/L
)
Figure 9. Glucose response elicited by fresh boiled and cold potatoes for varieties 1 and
3, harvested in 2009 taken at breakfast (0 min) followed by a standard lunch taken at 240
min. Values are means ± SEM (n=10). There was a significant time× treatment
interaction (F=11.4, p<0.001) after breakfast (0 -120min) and a significant main effect of
treatment (F=5.6, p=0.029) after the standard lunch (240-360 min). Significant
differences; fresh boiled vs. cold treatments for variety 1 denoted by “a”; fresh boiled vs.
cold treatments for variety 3 denoted by “b (P<0.05).

63
p=0.292) interactions for glucose concentrations after the potato test meals (0-120 min).
However, there was a significant time ×treatment interaction (F= 11.4, p<0.001) (Figure
9). At 15 minutes blood glucose was significantly higher after variety 3 fresh boiled than
after variety 3 cold. Blood glucose continued to rise and at 30 minutes, fresh boiled
potatoes for both variety 1 and 3 were significantly higher than cold potatoes. The
differences in peak rise (45 min) was significant, as both variety 1 and 3 fresh boiled
potatoes had significantly higher glucose concentrations than cold potatoes. Finally,
blood glucose at 60 min was significantly higher after fresh boiled potatoes for both
variety 1 and 3 than for cold potatoes. All difference were significant at P<0.05. For the
glucose concentrations after the standard lunch meal (240-360 min) there was no time ×
treatment (F=0.46, p=0.826), variety × time (F=0.57, p=0.746), treatment × variety
(F=.435, p=.518) and no treatment × time × variety (F=1.65, p=0.21) interactions. A main
effect of treatment (F=5.6, p=0.029) however was identified, with fresh boiled potatoes
having significantly lower glucose concentrations than cold potatoes (5.52±0.13 vs.
5.71±0.11, respectively) (Figure 9). Although a time × treatment interaction was not
identified after the lunch meal (240-360 min) the effects of treatment were investigated at
each time point. According to this secondary analysis, at 240 min (before start of lunch
meal), the blood glucose concentration for variety 3 fresh boiled was significantly lower
than for variety 3 cold potatoes and at 255 min (15 min after the start of lunch), variety 1
fresh boiled had a significantly lower blood glucose concentration than variety 1 cold
potatoes. All differences were considered significant at P<0.05.
Concerning the mean 0-120 min AUC, there was no main effect of variety (F=1.12, p=
0.307) or treatment × variety (F=2.06, p=0.168). A main effect of treatment (F=20.4,

64
p<0.001) was identified however, as the AUC after cold potato meals, had a significantly
lower AUC than after fresh boiled potato meals (122±15 vs. 203±23, respectively).
Specifically, variety 1 cold was 47% lower than for variety 1 fresh boiled while; variety 3
cold had an AUC 31% lower than variety 3 fresh boiled. These differences were
significant at (P<0.05) (Table 8). In terms of the AUC for the standard lunch (240-360
min), there was no main effect of treatment (F=0.52, p=0.482) or variety (F=0.19,
p=0.668) and no interaction (F=0.001, p=0.970) was found (Table 8).
The GI values for variety 1 and 3 harvested in 2009, are listed in Table 8. Variety 1 and 3
cold were measured as low GI (GI ≤ 55). Fresh boiled, variety 1 and 3 potatoes were
classified as high (GI ≥ 70) (Table 8). As with the mean 0-120 min AUC, ANOVA
showed a main effect of treatment (F=26.4, p<0.001), with fresh boiled potatoes having a
significantly higher GI than the cold potatoes (78.2±7.9 vs. 49.3±5.7, respectively). No
treatment× variety interaction was found (F=0.792, p=0.385), and thus both variety 1 and
3 fresh boiled potatoes had significantly greater GIs than variety 1 and 3 cold. A main
effect of variety was also not identified (F=0.129, p=0.713) (Table 8).
Upon factoring in the year of harvest (2008 vs. 2009) into the analysis a significant year
of harvest× variety× treatment (F=5.3, p=0.025) interaction was identified. Where the GI
of variety 1 was significantly reduced by cooling during the 2009 year of harvest and not
reduced during the 2008 year of harvest, while the GI of variety 3 was reduced upon
cooling, two harvest years in a row (Figure 10).
5.3.2 Breath Hydrogen and Malabsorbed Carbohydrate
There was no significant time × treatment (F=1.84, p=0.173), time × variety (F=0.384,

65
Table 8. AUC (0-120 min and 240-360 min) and GI values for varieties 1
and 3# harvested in 2009, served to subjects (n=10) fresh boiled and cold
Treatment
Mean for Variety
Fresh Boiled
Cold
AUC (mmol x min/L)- 0-120 min
Variety 1
228±32a 121±17
b 175±25
Variety 3
178±14a 123±13
b 151±14
Mean for Treatment
203±23
a 122±15
b
AUC (mmol x min/L)- 240-360 minh
Variety 1
228±26 218±28 223±27
Variety 3
217±17 205±17 211±17
Mean for Treatment
223±22 212±23
Glycemic Index (GI= 100)
Variety 1 82.2±6.8a
48.3±5.5b 65.3±6.2
Variety 3
74.2±9.0a
50.3±5.9 b 62.3±7.5
Mean for Treatment
78.2±7.9
a 49.3±5.7
b
Values are means± SEM
# Variety 3 had a different harvest location than study 2, but the same harvest year (2009)
ab Mean values not sharing the same letter superscripts differ significantly within each
row (P<0.05).

66
0
20
40
60
80
100
Variety 1
2008
Variety1
2009
Variety3
2008
Variety3
2009
a
b
a
b
a
b
Fresh Boiled
Cold
GI
Figure 10. GI of fresh boiled and cold potatoes for varieties 1 and 3, harvested in 2008
and 2009. Values are means ± SEM (n=10). A significant year of harvest × variety ×
treatment interaction existed (F=5.3, p=0.025), with the effect of cooling on the GI
dependent upon the year of harvest and potato variety. Bars with different letters, within
each variety differ significantly (P<0.05).

67
p=0.908), treatment × variety (F=0.722, p=0.407) and no treatment× time× variety
(F=0.629, p=0.314) interactions for breath hydrogen concentrations (Figure 11). A main
effect of treatment however was found (F=4.6, p=0.045) with cold potatoes producing
significantly greater hydrogen concentrations than fresh boiled potatoes (7.8±1.8 vs.
4.5±0.82, respectively). Although a time × treatment interaction was not identified for
hydrogen concentrations the effects of treatment were investigated at each time point.
According to this secondary analysis at 420 min and 480 min hydrogen concentrations
for variety 1 cold, were greater than variety 1 fresh boiled (P<0.05).
When the hydrogen concentrations after lactulose were compared to the potato meals,
ANOVA identified significant differences at 6 of the 9 time points. For example, at 180
min and 240 min hydrogen concentrations of lactulose were significantly greater than all
four potato meals. Hydrogen for lactulose at 120 min was significantly greater than
variety 1 fresh boiled and variety 1 cold. At 300 min variety 3 cold was the only potato
meal that had significantly lower hydrogen concentrations than lactulose. Variety 1 fresh
boiled, variety 1 cold and variety 3 fresh boiled had lower hydrogen levels than lactulose
at 360 min. Finally, at 420 min lactulose was greater than variety 1 fresh boiled and
variety 3 fresh boiled. All differences were considered significant at P<0.05.
The values for total breath hydrogen were not normally distributed thus data was logged
for statistical analysis. However, absolute values are presented in Table 9 for all test
meals. There was a main effect of treatment for total hydrogen (F=6.4, p=0.021), as total
hydrogen after cold potatoes was significantly greater than that after fresh boiled
potatoes, 61.2 ± 19.4 ppm and 33.9± 9.4 ppm respectively. No main effect of variety

68
0 60 120 180 240 300 360 420 4800
10
20
30
40
50Variety 1 Fresh Boiled
Variety 1 Cold
Variety 3 Fresh Boiled
Variety 3 Cold
Lactuloseabd a
bc
bcdebcde
e
bcd
Time (min)
Hy
dro
ge
n (
pp
m)
Figure 11. Breath hydrogen responses elicited by fresh boiled and cold potatoes for
varieties 1,3 and lactulose. Values are means ± SEM (n=10). Main effect of treatment for
potato test meals (F=4.6, p=0.045) and breath hydrogen concentrations for lactulose
differed significantly from potato test meal concentrations (P<0.05). Significant
differences ; fresh boiled vs. cold treatments for variety 1 denoted by “a”, variety 1 fresh
boiled vs. lactulose denoted by “b”, variety 1 cold vs. lactulose denoted by “c” , variety 3
fresh boiled vs. lactulose denoted by “d”, variety 3 cold vs. lactulose denoted by “e”. All
differences significant at P<0.05.

69
Table 9. Total breath hydrogen response after consumption of potato, white
bread and lactulose test meals (n=10).
Treatment
Mean for Variety
Fresh boiled Cold
Total Breath Hydrogen (ppm)*
Variety 1
28.6± 6.7 y 41.30±7.7
y p 35.0±7.2
Variety 3
39.2± 12.0 y 81.0± 31.1
y p 60.1±21.6
Mean for Treatment
33.9±9.4
a 61.2±19.4
b
White Bread
19.3 ±5.0y
Lactulose#
233.4±34.9
Data not normally distributed, logged for statistical analysis
Values are means ±SEM
* Calculated by summing the hydrogen concentration from baseline (defined as the
lowest value in the first 3 hours) to 8 hrs
# Consumed with white bread test meal, total hydrogen produced for lactulose,
determined by subtracting total hydrogen produced after white bread.
y Means differ significantly from lactulose test meal (P<0.05).
p Means differ significantly from white bread test meal (P<0.05).
a b Values with different letters differ significantly from each other, within each row
(P<0.05).

70
(F=1.13, p=0.302) nor a treatment× variety interaction (F=0.001,p=0.982) were found.
Upon factoring in white bread and lactulose to the analysis, total hydrogen for white
bread and potato meals were all significantly lower than that for lactulose (P<0.05).
Variety 1 and 3 cold had significantly greater total hydrogen than after white bread
(41.30±7.7 ppm and 81.0± 31.1 ppm vs. 19.3 ±5.0 ppm, respectively) (P<0.05).
Data for malabsorbed carbohydrate after each of the test meals was also not normally
distributed and thus logged for statistical analysis. Absolute values are presented in Table
10. There was a main effect of treatment (F=6.38, p=0.021), as the amount of
malabsorbed carbohydrate in the cold potato test meals was significantly greater than the
amount in the fresh boiled potatoes, 2.5±0.4 g and 1.6 ±0.3 g, respectively. No main
effect of variety (F=1.47, p=0.240) nor a treatment × variety interaction (F=0.001,
p=0.982) existed. In comparing the amount of malabsorbed carbohydrate in the potato
meals to that of white bread, variety 1 cold and variety 3 cold had significantly greater
amounts of malabsorbed carbohydrate (1.8±0.2 g and 3.2±0.9 g vs. 0.8±0.1 g) (P<0.05).

71
Table 10. Amount of malabsorbed carbohydrate (CHO) in potato and
white bread test meals (n=10).
Treatment
Mean for Variety
Fresh Boiled
Cold
Malabsorbed CHO (g) *
Variety 1
1.6±0.5 1.8±0.2y 1.7±0.4
Variety 3
1.6±0.3 3.2±0.9y 2.4±0.6
Mean for Treatment
1.6±0.4a 2.5±0.6
b
White Bread
0.8±0.1
Data not normally distributed, logged for statistical analysis
Values are means ±SEM
* Calculated by taking the amount of H2 produced by each subject per gram lactulose
and determining a semi-quantitative amount of carbohydrate malabsorbed after each of
the other test meals.
y Means differ significantly from white bread test meal (P<0.05).
a b Means with different letters differ significantly from each other (P<0.05).

72
Chapter 6
Discussion
6.1 Study 1
The 2008 International Tables of Glycemic Index and Glycemic Load Values reports GI
values of fresh potatoes ranging from as low as 23 to as high as 118 on the glucose scale
(GI=100), irrespective of variety, cooking or cooling method (Atkinson et al., 2008). The
potatoes identified as being cooked then cooled, from the table generally tend to have low
to intermediate GIs (23, 56 and 67) however this is not always the case, as one out of the
total four cooled potato values reported, had a GI of 88. From forty values (excluding,
cooled, canned, French fried, instant and instant mashed potatoes) 28% can be classified
with an intermediate GI, while the remaining 72% are classified as high GI (Atkinson et
al., 2008). Without considering methodological errors between studies, the distribution of
GI values alone from this table warrants the perception of the potato as high GI. With
regards to the four potato varieties (12 potato meals) tested in study 1, the majority of the
potato meals (67%) were either low or intermediate, and the four potato meals that were
classified as high GI all had values less than 80 (Table 6). This is compared to 62%
(18/29) of the high values from the 2008 International Tables with a GI over 80
(Atkinson et al., 2008).
The potatoes tested in this study generally have lower GI values than the potatoes
reported in the 2008 International Tables particularly if you consider the mean for each
variety or each treatment (Table 6). In addition, there is perception that a boiled or

73
cooked potato has a GI or a glucose response similar to that of glucose. However, even
within the 2008 International Tables, there are very few potatoes with GIs greater than
90. While all of the potato meals tested in study 1 were at least 20 units lower than the GI
of glucose, although all, with the exception of variety 3 cold were comparable to the GI
of white bread (GI=71). It is fair to say that based on this pilot study perhaps not low, but
lower GI potato varieties have been identified, and it is not only the cold potato meals
that fit into this category, as the fresh boiled variety 1 and 2 potatoes have GIs of 59.8
and 61.2, respectively. The identification of low GI potatoes during this pilot study
suggests that the plant breeders and starch chemists of the BPN may be approaching their
goal in breeding potato starch that is more slowly or less absorbed than those varieties
available commercially.
The 2008 International Tables reports the majority of its GI values for potatoes from six
main studies (Fernandes et al., 2005; Aston et al., 2008; Henry et al., 2005; Leeman et al.,
2005; Leeman et al., 2008; Soh & Brand-Miller, 1999). Of these studies, not one
investigated interactions between variety and preparation. In other words, they did not
determine whether the effects of a particular preparation method (i.e. cooling) on the GI
of one variety influenced other varieties similarly. One study by Fernandes et al. (2005)
suggested that the effect of preparation method on GI may depend on the variety of
potato as cooling and reheating baked Russet potatoes reduced the glycemic response by
approximately 30%, whereas there was no effect for California white potatoes. This
interaction, however was not tested directly and the white potatoes although a different
variety were boiled not baked, thus the differences in glycemic responses between
varieties with respect to cooling and reheating could be due to initial preparation method

74
(i.e. boiled vs. baked) and not due to differences in variety. This interaction likely existed
however, as Soh & Brand-Miller. (1999) determined no differences in GI between four
different cooking methods (baked, boiled and mashed, boiled and microwaved) in a
Pontiac potato. Both of these studies helped with the design for study 1; first to
investigate an interaction, and secondly to focus on one cooking treatment. From the six
studies listed above, only two investigated the effects of cooling a previously cooked
potato (Fernandes et al., 2005; Leeman et al., 2005), and both reported reductions in GI,
although not to the same extent. Thus, it seemed important to investigate the effects of
cooling and determine if these effects differed between the four varieties that supposedly
differed with respect to their physicochemical composition.
As expected the effects of preparation method on the GI differed depending on potato
variety. Specifically, cooling lowered, the GI of varieties, 3 and 4 but did not lower the
GI in varieties 1 and 2. The difference in growing location between both pairs of varieties
may explain some of the differences. Variety 3 and 4, which were harvested in
Fredericton, New Brunswick, reacted similarly to all three treatments, as did variety 1
and 2 from Vauxhall, Alberta (Table 6). Different growing conditions and environments
have been shown to affect certain physicochemical properties such as granular size,
amylose, and phosphorus content of potato starch (Cottrell et al., 1995; Haase & Plate,
1996). These properties to varying degrees have been shown to effect starch hydrolysis
(Liu et al., 2007).This may explain some of the similarities noted within growing
location. Unfortunately, we were not provided with specific information pertaining to soil
composition, average growing temperatures, or weather conditions, and we received
limited data concerning each variety’s physicochemical make up. Therefore, it is difficult

75
to determine which factor or combination of factors may have contributed to a specific
starch property. Although, variations in growing environment could definitely be a
contributor, the likely culprit is that the genotypes within each pair (variety 1 and 2 vs.
variety 3 and 4) are quite similar to each other, while between each pair of varieties the
genotypes differ quite markedly.
Another possible explanation for these differences in terms of cooking and cooling is that
a higher degree of gelatinization occurred upon boiling varieties 3 and 4 than occurred
after boiling varieties 1 and 2. Which is reflected by higher GI values for variety 3 and 4
fresh boiled (Table 6, Figure 2). A higher degree of gelatinization, theoretically should
lead to a higher degree of retrogradation when the starch is cooled, resulting in a
significant reduction in GI upon cooling as was the case for both variety 3 and 4.
Differences in gelatinization properties between starches can be due to an interplay of a
number of previously discussed factors such as, the molecular structure of amylopectin
(unit chain length and extent of branching), amylose:amylopectin ratio, and phosphorus
content (Liu et al., 2007). Unfortunately, only one of these factors was provided by
AAFC; amylose: amylopectin ratio.
As previously indicated the ratio of amylose: amylopectin is one of the main factors
affecting starch digestibility and its physiological response (Lehmann & Robin, 2007).
Generally, due to its linear structure, amylose is more resistant to hydrolysis by amylase
than the highly branched amylopectin molecule. Thus, high amylose starches have been
associated with slower rates of or resistance to, digestion (Liu et al., 2007). Based on this,
one could assume that the lower GIs after boiling varieties 1 and 2 could be explained by
a higher percentage of amylose in the starch, compared to amounts found in varieties 3

76
and 4. According to the data received from AAFC variety 1 and 2 did contain a higher
percentage of amylose (27.1 ±0.2% and 24.3±0.2%, respectively) compared to varieties 3
and 4 (22.7±0.2% and 22.8±0.1%, respectively). The correlation between percent
amylose and the GI of fresh boiled potatoes can further support the theory that higher
amylose concentrations are associated with lower glycemic responses or GIs. As amylose
although not significantly, was inversely related to the GI of fresh boiled potatoes (Figure
4).
In-vitro measurements of RDS, SDS and RS fractions for each variety were correlated
with their respected GIs for fresh boiled potatoes as well (Figure 4), which resulted in
some unanticipated findings. For example, from the literature (Englyst et al., 1999;
Englyst et al., 2003; Englyst et al., 1996a) it was presumed that a higher proportion of
RDS would correspond with a higher GI, as high GI is characteristic of a greater glucose
load entering the blood relatively quickly. The data indicated however, that RDS was in
fact inversely related to the GI of fresh boiled potatoes. As for SDS, we had also
anticipated an opposite correlation to what occurred. From the literature (Englyst et al.,
1999; Englyst et al., 2003; Englyst et al., 1996a) a higher degree of SDS is typically
correlated with a lower glycemic response or GI, as there would be a slower rate of
glucose absorption into the blood. The data indicated however that SDS was directly
related to the GI of fresh boiled potatoes. Unlike RDS and SDS, RS was not related to the
GI of fresh boiled potatoes. Theoretically, the higher the GI, the lower the amount of RS
in a food, this non-correlation however is not surprising as the values for RS may be
incorrect. Published RS values from cooked potatoes are usually around 1-7 % of TS
(Englyst et al.,1992a; Kingman & Englyst, 1994), where the data we received ranged

77
between 22.5-25.7% of TS from all four varieties. RS is usually calculated (RS=TS-
(RDS+SDS)) and not measured, but TS was not provided to us by AAFC, thus it was
suggested to use 100 in place of the TS value. The use of 100 instead of the actual
percentage of TS, may account for some of the increase in RS values, but not all as the
TS values in the literature for potatoes are typically not substantially less than 100
(typically~75-80% of potato dry matter) (Englyst et al., 1992a; García-Alonso & Goñi,
2000; Kingman & Englyst, 1994). This and the unanticipated correlations with RDS and
SDS suggest that the in vitro analysis of starch fractions should be repeated, preferably
with a greater number of potato samples.
Each starch fraction (RDS, SDS and RS) and amylose was correlated with the GIs for the
cold treatments (Figure 5). It should be noted that the in-vitro measurements discussed
here are the same values used to correlate with the GI of fresh boiled potatoes. Thus, the
measurements were taken from cooked potato starch, so the validity of the correlations is
questionable. Nevertheless, unlike the correlations with fresh boiled potatoes, the GI of
the cold potatoes was associated with both RDS and SDS as anticipated. The lower the
proportion of RDS, the lower the GI of the cold potatoes and the greater the proportion of
SDS, the lower the GI, which corresponds with the literature that states low GI is
characterized by SDS (Englyst et al., 1999; Englyst et al., 2003; Englyst et al., 1996a).
Similarly to fresh boiled potatoes, RS was also not related to the GI of cold potatoes.
Even though when cooked potatoes are cooled RS starch has been known to increase to
as high as 13% TS (Englyst, et al.1992a) the values obtained from AAFC (22.5-25.7%)
are still quite high to be used in the correlation. Amylose although not significantly, is
directly correlated to the GI of cold potatoes, which does not correspond with the

78
literature. Amylose due to its linear structure is able to retrograde and re-form stronger
bonds between other starch molecules than the highly branched amylopectin
polysaccharide (Englyst et al., 1992a). Retrogradation creates SDS and RS therefore
should theoretically result in a reduced glycemic response or GI.
Finally, all varieties responded similarly to being reheated in the microwave after
cooling (Figure 2). Generally, the high GI across all four varieties may be explained by
the fact that amylopectin (which constitutes the majority of the starch in each variety
despite the varying degrees of amylose) when retrograded can be re-gelatinized at lower
(70 ºC) temperatures than amylose (160 ºC) (Miles et al., 1985; Ring et al., 1988).
Specifically, in varieties 1 and 2 the GI was higher after the potatoes were reheated then
after they were initially boiled. What could have occurred, is that a second round of
heating caused the retrograded starch to re-gelatinize and the starch that had initially or
was partially gelatinized after boiling to become gelatinized resulting in the higher GI for
reheated potatoes. For varieties 3 and 4 it appeared that re-heating caused the retrograded
starch to re-gelatinize to the same extent as after fresh boiled potatoes, as the GIs for
reheated and boiled potatoes were similarly high. These results are comparable to in-vitro
studies investigating the effects of temperature cycling on starch digestibility, as a
Marfona potato cooled and then reheated had similar amounts of RDS than when the
same variety was freshly boiled and mashed (Kingman & Englyst, 1994).
To investigate further, the different effects of cooking and cooling, which were
documented between growing locations, we decided to re-test varieties 2 and 3 the
following year. These results are discussed in the following section.
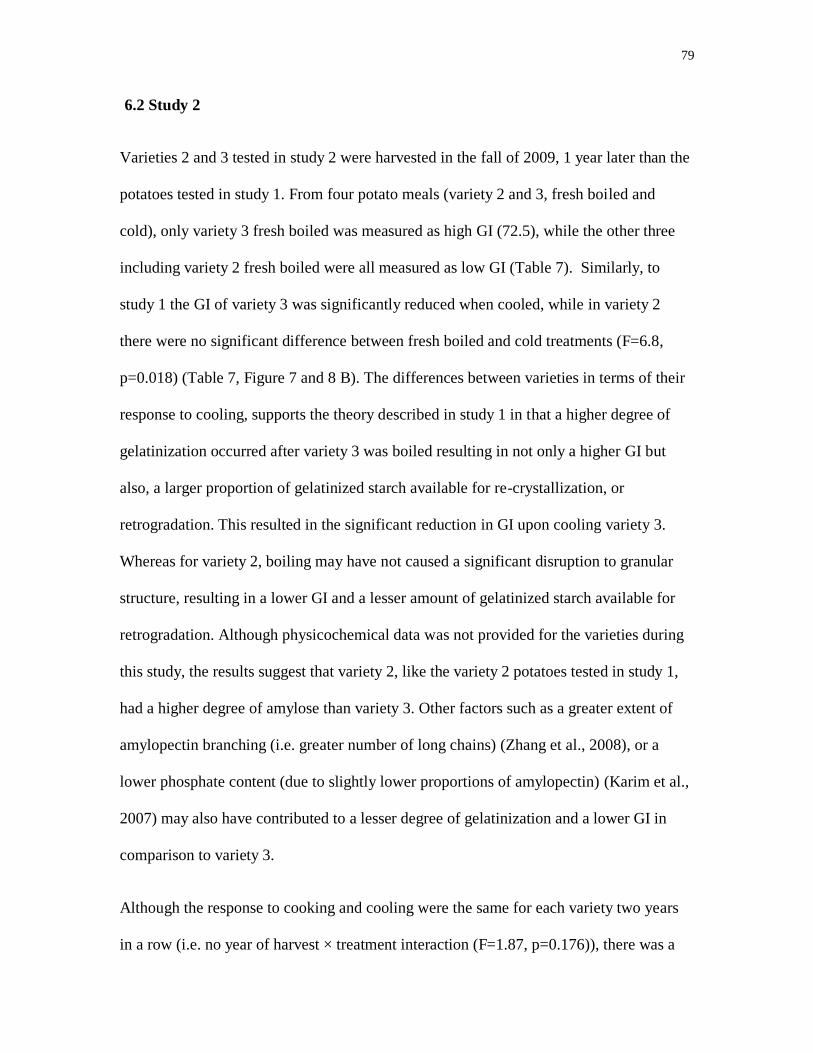
79
6.2 Study 2
Varieties 2 and 3 tested in study 2 were harvested in the fall of 2009, 1 year later than the
potatoes tested in study 1. From four potato meals (variety 2 and 3, fresh boiled and
cold), only variety 3 fresh boiled was measured as high GI (72.5), while the other three
including variety 2 fresh boiled were all measured as low GI (Table 7). Similarly, to
study 1 the GI of variety 3 was significantly reduced when cooled, while in variety 2
there were no significant difference between fresh boiled and cold treatments (F=6.8,
p=0.018) (Table 7, Figure 7 and 8 B). The differences between varieties in terms of their
response to cooling, supports the theory described in study 1 in that a higher degree of
gelatinization occurred after variety 3 was boiled resulting in not only a higher GI but
also, a larger proportion of gelatinized starch available for re-crystallization, or
retrogradation. This resulted in the significant reduction in GI upon cooling variety 3.
Whereas for variety 2, boiling may have not caused a significant disruption to granular
structure, resulting in a lower GI and a lesser amount of gelatinized starch available for
retrogradation. Although physicochemical data was not provided for the varieties during
this study, the results suggest that variety 2, like the variety 2 potatoes tested in study 1,
had a higher degree of amylose than variety 3. Other factors such as a greater extent of
amylopectin branching (i.e. greater number of long chains) (Zhang et al., 2008), or a
lower phosphate content (due to slightly lower proportions of amylopectin) (Karim et al.,
2007) may also have contributed to a lesser degree of gelatinization and a lower GI in
comparison to variety 3.
Although the response to cooking and cooling were the same for each variety two years
in a row (i.e. no year of harvest × treatment interaction (F=1.87, p=0.176)), there was a

80
significant year of harvest × variety interaction (F=5.1, p=0.027). Specifically, the GI for
variety 3 measured during study 2 was virtually the same as its GI measured a year prior
(60.5 vs. 59.7, respectively (averaging across fresh boiled and cold treatments). While the
GI for variety 2 measured in study 2 (39.2) was significantly less than the GI measured a
year prior in study 1 (58.1) (Figure 7 and 8 A). A difference in growing location could
not explain the difference in GI between years as variety 2 potatoes were grown in the
same location; Vauxhall, Alberta. It was discovered after study completion however, that
the potatoes received for study 2 (harvested 2009) were harvested early, at 100 days,
compared to the potatoes tested in study 1 which were harvested to maturity (120 days).
Potatoes with shorter growing seasons are known to consumers as “new” potatoes and are
distinguished by their small shape and tender mouth feel (Camire et al., 2009). The
potatoes from study 2 however, looked no different from the study 1 variety 2 potatoes,
as both were quite large. Despite this, there has been evidence to suggest that fluctuations
in harvest dates can affect starch digestibility.
Soh & Brand-Miller (1999) explained that as potatoes mature, the degree of amylopectin
branching significantly increases, which could potentially affect the glycemic response.
The quantity of amylose increases only slightly or remains consistent as potatoes mature
and thus is not likely to affect the glycemic response. We therefore speculate that the
lower GI of variety 2 from study 2 may be due to reduced amylopectin branching
resulting in greater resistance to gelatinization. The same study reported the GIs of both
boiled new potatoes and canned new potatoes to have lower GIs than the other more
mature potatoes tested (Soh & Brand-Miller, 1999). Other than the GI values from Soh
& Brand-Miller (1999), there have only been two other values cited for “new” potatoes in

81
the most recent International Tables of Glycemic Index and Glycemic Load Values
however, and they are classified as high GIs, with values of 70 and 80 (Atkinson et al.,
2008).
There has also been supporting evidence from in-vitro studies to support reduced
amylopectin branching in “new” or less mature potatoes and the theory that this may
cause some resistance to gelatinization. For example Liu et al. (2003) conducted a study
to characterize the physicochemical properties of starches from potatoes of different
varieties and growth times, concluding that variation in growth time effects starch
properties, and appears to influence varieties differently. Although this study did not
investigate amylopectin branching specifically, they did note that the percentage of
amylose in the starch was higher for potatoes harvested at the shortest growth time,
decreased after first harvest and remained unchanged during the remaining growth
period. The decrease in amylose is likely due to an increase in the proportion of
amylopectin. This can also be supported by the fact that phosphorus, which is covalently
bound to amylopectin, also increases with growth time (Liu et al., 2003). In terms of
gelatinization properties, Liu et al. (2003) determined that potatoes with shorter growth
time were more resistant to gelatinization than those potatoes with later harvest dates, as
indicated by higher gelatinization temperatures and other measurements such starch
swelling capabilities and viscosity. This study and other in-vitro studies (Madsen &
Christensen, 1996) support the fact that the differences noted between study 1 and study
2 in terms of the GI for variety 2 could be due to differences in physicochemical
properties as affected by difference in harvest dates.

82
Lastly, it is interesting that the differences in growing locations (Fredericton, New
Brunswick vs. Guelph, Ontario) for variety 3 between studies did not appear to influence
the GI (Figure 8A). This supports the theory, that effect of growing or environmental
conditions on starch properties can be dependent on potato variety (Cottrell et al., 1995;
Haase & Plate, 1996; Liu et al. 2007).
In summary study 2 has validated the fact that cooking and cooling can affect these
specific potato varieties (2 and 3) differently, regardless of harvest year. We were also
able to reproduce the same GI values two years in a row for variety 3, but variety 2
differed rather significantly between studies. The latter discovery has prompted us to
consider growth times as another determinant of the GI for potatoes. For our third and
final study, we wanted to determine if the reduction in GI upon cooling previously
cooked potatoes, noted in both study 1 and 2 could be better explained by the
malabsorption or slowed absorption of starch. The results of this in-vivo study of starch
digestibility are discussed in the following section.
6.3 Study 3
As indicated in the methods chapter, study 3 was conducted during the same harvest year
as study 2, and one year after study 1. Therefore similar to study 2, the potatoes tested in
study 3 were harvested in 2009. We initially intended to test variety 2 and 3 again;
however, variety 1 was used in place of variety 2, as there were not enough variety 2
potatoes left over from study 2.
In terms of GI classifications, both varieties 1 and 3 fresh boiled potatoes were measured
as high GI (82.2 and 74.2, respectively), and both variety 1 and 3 cold potatoes were

83
classified as low GI (48.3 and 50.3, respectively) (Table 8). The GI of variety 1 (82.2)
had the highest GI of all potato meals tested over the course of all three studies,
interesting as its GI in study 1 was the lowest (59.8) of all four fresh boiled potato meals
(Table 6). This difference in GI within the same variety may be due to variation in
growing location and conditions, as variety 1 potatoes received for testing during study 3,
were harvested in 2009 from Fredericton, New Brunswick, while the potatoes from study
1 were grown and harvested in 2008 from Vauxhall, Alberta. The potential effects of
growing locations and conditions on the physicochemical properties of starch were
previously discussed in section 6.1. As discussed in section 6.2 there is evidence to
suggest that the variation in growing conditions may affect some potato varieties more
others than (Cottrell et al., 1995; Haase & Plate, 1996; Liu et al., 2007). This is supported
again by the fact that the GI of variety 3 has remained consistent over all three studies,
regardless of growing location (Table 6, 7, and 8). As variety 3 in study 1 was grown in
Fredericton, New Brunswick (2008), study 2 in Guelph, Ontario (2009), and study 3 in
Fredericton, New Brunswick (2009).
With regards to the effects cooking and cooling on the GI of potatoes, unlike studies 1
and 2 there was no interaction between treatment and variety (F=0.792, p=0.385), and
only a main effect of treatment (F=26.4, p<0.001) as the GI for both variety 1 and 3 fresh
boiled were reduced significantly when cooled (Table 8). This was an interesting
observation, as in study 1; there was no difference in GI between variety 1 fresh boiled
and cold potato meals. This may be due to the fact that both variety 1 and 3 from study 3,
had a high degree of gelatinization during boiling, resulting in a greater percentage of
retrograded starch upon cooling leading to a reduced GI. From these differences between

84
studies in terms of the overall GI for variety 1 and the effects of cooling, it was expected
that upon factoring in the GI values from study 1 into the statistical model that there
would be a significant year of harvest× variety× treatment (F=5.3, p=0.025) interaction.
This represents the fact that the effects of treatment (fresh boiled and cooling) on potato
varieties can depend on year of harvest or in the case of study 3 growing location (Figure
10). These differences discussed in terms of GI may be due to difference in starch
properties between varieties and even within varieties of different years. Unfortunately,
like study 2 physicochemical data was not obtained for the potatoes tested in study 3, and
it is difficult to make inferences as it is likely a combination of factors contributing to
these differences.
In addition to measuring the glycemic response after the potato meals, to determine their
GIs this study also fed a second meal (served 4 hrs after the potato meals), and measured
the glycemic response two hours postprandial. A lunch meal was served in study 3 to
investigate what is known as the second meal effect (SME). Studies have shown that the
glycemic impact of an earlier meal can affect the glycemic response elicited by the next
meal. More specifically, that slowed absorption of carbohydrates at an earlier meal has
the potential to reduce the glucose response or improve second-meal carbohydrate
tolerance (Jenkins et al., 1982; Wolever et al., 1995; Jenkins et al., 1980). Thus, we used
the SME theory to investigate whether the formation of SDS or slowed absorption could
explain the reduction in GI upon cooling variety 3. We initially thought there would be a
lower glycemic response elicited by the lunch meal after consumption of variety 3 cold at
the morning test meal versus after consumption of variety 1 cold, as the GI of variety 1 in
study 1 was not reduced upon cooling. As recently discussed however, variety 1 in study

85
3 was affected by cooling, and its GI did significantly lower when cooled. Therefore,
after GI data from study 3 was analyzed we expected that there would be no difference in
terms of glucose response to a lunch meal between the two varieties. However, we did
anticipate that generally the glucose response of the cold treatments (variety 1 and 3 cold)
would elicit a lower glucose response to the lunch meal compared to the fresh boiled
treatments (variety 1 and 3 fresh boiled), secondary to the formation of SDS after
cooling. Results did in fact indicate that there was a main effect of treatment (F=5.6,
p=0.029), but interestingly the exact opposite as to what was anticipated occurred as the
fresh boiled potatoes caused a significantly lower glucose concentration after lunch than
the cold potatoes (5.52±0.13 vs. 5.71±0.11, respectively) (Figure 9). If you consider the
glucose profiles, immediately after consumption of the potato meals (0-120min), these
differences in glucose concentrations between treatments (fresh boiled vs. cold) may
explain why a lower glycemic response elicited at lunch was noted after consumption of
the fresh boiled meals rather than after the cold meals. For instance, a substantial rise in
blood glucose concentration was noted 30, 60, and 90 min after consumption of fresh
boiled potatoes. These concentrations were significantly greater than the concentrations
at the same time points after the cold potatoes were consumed (Figure 9). After 90 min
the glucose concentrations for fresh boiled potatoes fell quickly, resulting in lower
glucose concentrations at 240 min (before the start of lunch) and at 255min (15 min after
the start of lunch). This is compared to the cold potatoes, which had a much more gradual
fall in blood glucose resulting in significantly higher blood glucose concentrations at 240
and 255 min. The blood glucose profiles after cold potatoes are characteristic of SDS
behavior (Lehmann & Robin, 2007), as they appeared to slowly increase postprandial

86
blood glucose levels (0-120min), and then sustain concentrations over a longer time
period (240-360min). This suggests that cooling does create SDS or cause slowed
absorption, which may explain much of the reduction in GI between the fresh boiled and
cold treatments.
In terms of blood glucose AUC for the standard lunch (240-360 min), there was no main
effect of treatment (F=0.52, p=0.482) or variety (F=0.19, p=0.668) and no interaction
(F=0.001, p=0.970) was found (Table 8). In other words, the blood glucose AUC after
fresh boiled and cold potato meals (0-120 min) had no effect on the glucose response
elicited by the lunch meal. Similarly, with the GI values discussed above, there was a
main effect of treatment for mean blood glucose AUC after the morning test meals (0-120
min) (F=20.4, p<0.001). Cold potato meals had a significantly lower AUC than the AUC
for the fresh boiled potatoes (122±15 vs. 203±23, respectively) (Table 8). The reduction
in blood glucose profiles (0-120 min), GI and AUCs after cooling fresh boiled potatoes
suggest formation of SDS or insinuate that slowed absorption has occurred, even though
an improved second meal glucose tolerance was not indicated (no SME).
We may not have seen a SME in the current study for one or a combination of three
reasons. First, the amount of SDS formed upon cooling may not have been enough to
affect the glucose response of a later meal. For example in many of the studies that have
documented improved glycemic response to a later meal, the earlier meals contained
foods such as whole barley, guar and lentils as their slowly digestible components
( Jenkins et al., 1982; Jenkins et al., 1980; Nilsson, 2008; Wolever et al., 1988 Priebe et
al., 2010). Potatoes upon cooling are shown to contain approximately 2.1 g of SDS and
1.1 g of RS in a 100g edible portion (Englyst & Hudson, 1996a; Kingman & Englyst,

87
1994). While from the same study (Englyst & Hudson, 1996a) , barley (7.0g of SDS and
2.1g of RS in a 100g edible portion) and lentils (6.1 SDS and 2.4 RS 100g edible portion)
have been shown to contain greater amounts of SDS and slightly higher amounts of RS.
Guar is a viscous fibre and is not absorbed by the small intestine, and like other fibers is
known for its effects on slowing the rate of absorption of other available carbohydrates.
Therefore the proportion of SDS, RS and fibre included in the earlier meals of the studies
listed above are likely able to slow the rate of absorption better than SDS and RS from a
cold potato resulting in a SME. Second, the differences in GI between fresh boiled and
cold treatments may not have been significant enough to cause differences between the
glucose responses after the lunch meal. Some of the studies reporting SMEs have
investigated foods or meals that have larger differences between their GIs than the
difference noted between the fresh boiled and cold GIs for the current study (78.2±7.9
vs. 49.3±5.7, respectively, values averaged across variety) (Table 8). For example a study
by Wolever et al. (1988) reported a low GI meal (GI=40) to significantly reduce both the
acute postprandial blood glucose response to dinner and the glycemic response to a
subsequent breakfast compared to that of a high GI meal (GI=105). The difference
between the GIs in the Wolever et al. (1988) study was 61%, compared to a 36%
difference between the GIs of the fresh boiled and cold potato meals in study 3. Lastly,
the other possible reason a SME was not documented could be due to the composition of
the standard lunch meal. For example, the standard lunch served to subjects in the current
study was more or less a complete meal providing 17% of calories from protein, 29%
from fat and 54% of calories from carbohydrate with 2.1g of fibre. Some of the second
meals from other studies included simpler meals such as solutions of glucose (Wolever et

88
al., 1988; Jenkins et al., 1980; Priebe et al.2010), cornflakes with 2% milk (Wolever et
al., 1988) and white bread with water (Nilsson et al., 2008). There have been other
studies however, that have documented SMEs, that fed more substantial meals similar to
the current study (Jenkins et al., 1982). Perhaps the effects of slowed absorption on a
second meal is more pronounced or better documented if the later meal contains a simple
or more rapidly absorbable food component such as glucose. Instead of a more complete
meal, including fat, protein, fibre and more complex carbohydrates which could minimize
the effects of SDS from the earlier meal.
To summarize the blood glucose response elicited by a lunch meal was not reduced after
consumption of cold potato meals compared to when fresh boiled potatoes were
consumed. This non-reduction is likely due to the factors mentioned above rather than to
a greater proportion of RS than SDS creation upon cooling fresh boiled potatoes
(discussed below).
Lactulose has been widely used as a standard in breath hydrogen measurement. As
previously described, breath hydrogen can be a noninvasive way of detecting
carbohydrate malabsorption in humans. Lactulose is commonly used to represent a
known amount of malabsorbed carbohydrate in order to obtain a semi-quantitative
estimate of the amount of unabsorbed carbohydrate in a test meal (as described in the
methods chapter) (Wolever, 2006; Owira et al.,2005). The use of lactulose to generate
hydrogen and the ability of the Quintron system to collect and measure it in breath was
validated by the fact that hydrogen concentrations for lactulose were significantly greater
than after the potato meals, in six out of the nine concentration points (P<0.05) (Figure
11). The total hydrogen produced after lactulose (233.4±34.9 ppm), was also significantly

89
greater than all four potato meals (28.6 ±6.7 ppm to 81.0±31.1 ppm) and white bread
(19.3±5.0 ppm) (P<0.05) (Table 9).
As anticipated, cold potatoes generated significantly more total hydrogen than fresh
boiled potatoes (61.2 ± 19.4 ppm and 33.9± 9.4 ppm, respectively) (F=6.4, p=0.021)
(Table 9). This corresponded with the estimation for malabsorbed carbohydrate in each of
the potato meals, as cold potatoes had significantly greater malabsorbed carbohydrate or
RS than the fresh boiled potatoes (2.5±0.4 g and 1.6±0.3g, respectively) (F=6.4, p=0.021)
(Table 10). It is also interesting to point out that variety 1 and 3 cold potatoes had
significantly greater total breath hydrogen and contained more malabsorbed carbohydrate
than white bread (P<0.05) (Table 9 and 10).
For the purpose of comparison, the average amount of RS found in variety 1 and 3 cold
was 0.9 g in 100g edible portion, and the amount found in variety 1 and 3 fresh boiled
was 0.6 g. These are comparable to the RS values from Kingman et al. (1994), which
determined the starch fractions of different potato varieties cooked and cooled, using the
Engyst et al. (1992a) method. For example a Marfona boiled, fresh cooked potato
contained 0.3 g of RS, while the same variety cold contained 1.2 g of RS (per 100 g
edible portion). A boiled, hot, Belle Fontenay potato from the same study had a RS
content of 0.2 g, which increased to 0.8 g when cooled (per 100 g edible portion)
( Kingman et al. 1994). The RS measurements for the hot potatoes from the literature
tend to be lower than the amount of RS measured in the current study for fresh boiled
potatoes. It is also interesting that the average difference in RS between the hot and cold
potatoes for the values cited is 0.8 g/100g, while the average difference between the hot
and cold potatoes in study 3 is only 0.3 g/100g. This suggests and supports the discussion

90
in section 6.1 in that the novel potatoes tested have potentially been bred as hoped, in that
they contain a slightly higher proportion of RS than other commercial varieties.
One of the main goals of study 3; however was to determine if the significant reduction in
GI upon cooling some of the novel potato varieties could be explained by an increase in
RS content. We conclude that this is not likely the case, as the reduction in GI or blood
glucose is much larger than can be accounted for by the reduction in the amount of
digestible starch. To use study 3 as an example, the cooked potato starch from variety 1
and 3 contained an average of 1.6 g of RS per serving (~268 g) which increased to 2.5 g
upon cooling (Table 10). Thus the 50g “available” carbohydrate portion of cold potatoes
would therefore contain 47.5 g of digestible starch, compared to 48.5 g in the fresh boiled
potatoes. This 2.1% reduction in digestible starch cannot possibly account for the 37%
reduction in GI noted in study 3 when fresh boiled potatoes were cooled. Similar rational
is discussed in Fernandes et al. (2005). So although there is an increase in RS upon
cooling these novel potatoes, it is likely that the reduction in GI is better explained by the
creation of SDS or slowed digestion, even though a SME was not found.
Potential limitations to the breath hydrogen method for a means of estimating
malabsorbed carbohydrate should be discussed. A more detailed discussion however, is
outlined in Chapter 1, as the limitations discussed will only include those relevant to the
interpretation of the results from study 3. One of the main criticisms of the breath H2
method is the perception that it has the inability to detect small changes in breath H2
output (Robb et al., 1991) or is not sensitive enough to detect differences in malabsorbed
carbohydrate of less than 10g (Grysman et al., 2008). This was not indicated in the
current study, as small differences much less than 10 g of RS were identified. However,

91
perhaps a more appropriate method for estimating RS could be to determine the
differences between individual potato meals for both breath hydrogen and malabsorbed
carbohydrate values, as the only significant differences noted in this study were between
the main effects of treatment (fresh boiled vs. cold).
The fermentable capabilities of fibre have also been thought of as a contributor to
hydrogen exhalation (Scheppach et al., 1991). However a study by Robb et al. (1991)
showed that the addition of 15 g of the fermentable fibre guar gum, did not contribute to
any significant production in H2 over 12 hrs. The amount of fibre in variety 1 and 3 test
meals contained much less than 15g as variety 1 contained 3.5 g of fibre in a 235 g
serving and variety 3 contained 5.4 g of fibre in a 301 g serving.
Finally the use of both lactulose and inulin have been used as the standard in breath
hydrogen measurement, and there is ongoing debate as to which is more valid (Owira et
al., 2005). A study looking at the effects of using either inulin or lactulose as the standard
in controls and patients with chronic pancreatic exocrine insufficiency indicated that
maximum hydrogen production was significantly greater in both groups, with lactulose
than with inulin (Owira et al., 2005). This suggests that the colonic bacteria metabolism
of lactulose produces more hydrogen than that of inulin. This study also stresses that due
to these differences, breath hydrogen studies that have used different standards (i.e. inulin
vs. lactulose) should not be used to compare hydrogen concentrations or amounts of
malabsorbed carbohydrate between foods (Owira et al., 2005).
These and other limitations of this method should be considered when measuring and
interpreting breath hydrogen. However, based on the supporting literature we feel breath

92
hydrogen is a useful and fairly accurate method for investigating carbohydrate
malabsorption in-vivo.

93
Chapter 7
Conclusions and Implications
The results of study 1 and 2 supported our hypothesis, in that the effects of preparation
method, specifically cooling on the GI was dependent upon the variety of potato. This
was confirmed two harvest years in a row. We were also able to confirm the GI of variety
3, as it was virtually the same in both studies 1 and 2. We were unable to confirm
however, the GI of variety 2, as its GI differed significantly between study years. This
variation was hypothesized to be due to differences in growing times between studies for
that particular variety.
The GI of variety 3 was confirmed as well as its response to cooling for a third and final
time in study 3. Interestingly, cooling variety 1 significantly reduced its GI; while in
study 1 cooling had no effect on this variety. Thus, study 3 identified a year of harvest
×variety ×treatment interaction, meaning that the effect of treatment (fresh boiled and
cold) was dependent on the variety of potato and the year it was harvested. The difference
in terms of the effects of cooling across harvest years for variety 1 may be due to the fact
that potatoes from study 1 were not grown in the same place as study 3.
After evaluation and estimation of slowed absorption and malabsorption of potato starch,
we were able to support our hypothesis in that, the increase in RS upon cooling a fresh
boiled potato was not nearly large enough to explain the 37% reduction in GI. We
speculate that the majority of the reduction was likely due to a reduction in the rate (i.e.
creation of SDS) rather than the amount of starch absorbed.

94
All three studies have re-emphasized the importance of factors such as preparation
method, harvest dates and growing conditions to the glycemic response of potato starch.
Unfortunately, limited physicochemical data was received, and we were unable to
investigate how these different factors can interplay to affect the properties of starch,
ultimately leading to differences in potato starch digestibility. However, from GI testing
alone, we were able to identify low GI or lower GI potatoes and perhaps provided a
different perspective to measuring and interpreting the GIs of potatoes.
Potatoes in our minds remain a healthy food choice. If the ultimate goal however, is to
increase consumption of low GI or slowly digested foods, potatoes can be considered, as
not all are created equal.

95
Chapter 8
Future Directions
In the development of all three studies and through the interpretation of their respected
results, we have indentified some opportunities for future work around the variables
effecting potato starch digestibility. First, a greater number of novel varieties should be
subjected to GI testing, to determine the effects of cooking and cooling, and whether
these effects differ between varieties. It would also be interesting to re-investigate starch
digestibility in-vivo with a greater number of varieties through measurement of breath
hydrogen and the glycemic response of a lunch meal and see if a larger sample of
potatoes may identify greater differences.
Potato maturity and the variation in growing conditions were identified as potential
factors affecting the glycemic response. It would therefore be interesting to conduct
another study to investigate different growing times to determine the effects on different
physicochemical properties, and how this can influence the GI of different varieties.
Lastly, and perhaps most importantly, physicochemical data is required to better interpret
the in-vivo data. Better collaboration would be helpful with plant breeders who provide
the novel potato varieties for testing, to better understand the genotype of each variety
and how they differ from other varieties received. Any future work should also involve
the starch chemists as well to link and explain what is occurring physiologically, with the
properties of the potato starch.

96
References
AAFC. (2007). Canadian potato situation and trends 2006-2007. Retrieved July 10 2010
from www.agr.gc.ca
Anderson, I. H., Levine, A. S., & Levitt, M. D. (1981). Incomplete absorption of the
carbohydrate in all-purpose wheat flour. New England Journal of Medicine,
304(15), 891-892.
Aston, L. M., Gambell, J. M., Lee, D. M., Bryant, S. P., & Jebb, S. A. (2008).
Determination of the glycaemic index of various staple carbohydrate-rich foods in
the UK diet. European Journal of Clinical Nutrition, 62(2), 279-285.
Atkinson, F. S., Foster-Powell, K., & Brand-Miller, J. C. (2008). International tables of
glycemic index and glycemic load values: 2008. Diabetes Care, 31(12), 2281-2283.
Axelsen, M., Lenner Arvidsson, R. f., L nnroth, P., & Smith, U. (1999). Breakfast
glycaemic response in patients with type 2 diabetes: Effects of bedtime dietary
carbohydrates. European Journal of Clinical Nutrition, 53(9), 706-710.
Bond Jr., J. H., & Levitt, M. D. (1972). Use of pulmonary hydrogen (H2)
measurementsto quantitate carbohydrate absorption. study of partially
gastrectomized patients. Journa of Clinical Investigation, 51(5), 1219-1225.
Brand-Miller, J., Hayne, S., Petocz, P., & Colagiuri, S. (2003). Low-glycemic index diets
in the management of diabetes: A meta-analysis of randomized controlled trials.
Diabetes Care, 26(8), 2261-2267.

97
Brown, C. R. (2005). Antioxidants in potato. American Journal of Potato Research, 82,
163-172.
Brownlee, M. (2005). The pathobiology of diabetic complications: A unifying
mechanism. Diabetes, 54(6), 1615-1625
Burke, L. M., Collier, G. R., Davis, P. G., Fricker, P. A., Sanigorski, A. J., & Hargreaves,
M. (1996). Muscle glycogen storage after prolonged exercise: Effect of the
frequency of carbohydrate feedings. American Journal of Clinical Nutrition, 64(1),
115-119.
Camire, M., Kubow, S., & Donnelly, D. J. (2009). Potatoes and human health. Critical
Reviews in Food Science and Nutrition, 49, 823-840.
Chew, I., Brand, J. C., Thorburn, A. W., & Truswell, A. S. (1988). Application of
glycemic index to mixed meals. American Journal of Clinical Nutrition, 47(1), 53-
56.
Cochran, W. G., & Snedecor, G. W. (1980). Failures in the assumptions. Statistical
methods (Seventh ed., pp. 274-279) The Iowa State University Press.
Cottrell, J. E., Duffus, C. M., Paterson, L., & Mackay, G. R. (1995). Properties of potato
starch: Effects of genotype and growing conditions. Phytochemistry, 40(4), 1057-
1064.
Coulston, A. M., Hollenbeck, C. B., & Liu, G. C. (1984). Effect of source of dietary
carbohydrate on plasma glucose, insulin, and gastric inhibitory polypeptide

98
responses to test meals in subjects with noninsulin-dependent diabetes mellitus.
American Journal of Clinical Nutrition, 40(5), 965-970.
Ells, L. J., Seal, C. J., Kettlitz, B., Bal, W., & Mathers, J. C. (2005). Postprandial
glycaemic, lipaemic and haemostatic responses in ingestion of rapidly and slowly
digested starches in healthy young women. British Journal of Nutrition, 94(6), 948-
955.
Englyst, H. N., & Cummings, J. H. (1985). Digestion of the polysaccharides of some
cereal foods in the human small intestine. American Journal of Clinical Nutrition,
42(5), 778-787.
Englyst, H. N., & Hudson, G. J. (1996a). The classification and measurement of dietary
carbohydrates. Food Chemistry, 57(1), 15-21.
Englyst, H. N., Veenstra, J., & Hudson, G. J. (1996b). Measurement of rapidly available
glucose (RAG) in plant foods: A potential in vitro predictor of the glycaemic
response. British Journal of Nutrition, 75(3), 327-337.
Englyst, H. N., Kingman, S. M., & Cummings, J. H. (1992a). Classification and
measurement of nutritionally important starch fractions. European Journal of
Clinical Nutrition, 46(Suppl.2), S33-S50.
Englyst, H. N., Kingman, S. M., & Cummings, J. H. (1992b). Starch digestion in the
small intestine of man. Gastroenterology, A550.

99
Englyst, H., & Cummings, J. (1987). Digestion of polysaccharides of potato in the small
intestine of man. American Journal of Clinical Nutrition, 45(2), 423-431.
Englyst, K. N., & Englyst, H. N. (2005). Carbohydrate bioavailability. British Journal of
Nutrition, 94(1), 1-11.
Englyst, K. N., Englyst, H. N., Hudson, G. J., Cole, T. J., & Cummings, J. H. (1999).
Rapidly available glucose in foods: An in vitro measurement that reflects the
glycemic response. American Journal of Clinical Nutrition, 69(3), 448-454.
Englyst, K. N., Vinoy, S., Englyst, H. N., & Lang, V. (2003). Glycaemic index of cereal
products explained by their content of rapidly and slowly available glucose. British
Journal of Nutrition, 89(3), 329-339.
FAO. (1998). FAO food and nutrition paper 66. Carbohydrates in human nutrition.
Rome, Italy.
Ferchaud-Roucher, V., Pouteau, E., Piloquet, H., Zaïr, Y., & Krempf, M. (2005). Colonic
fermentation from lactulose inhibits lipolysis in overweight subjects. American
Journal of Physiology - Endocrinology and Metabolism, 289(4 52-4), E716-E720.
Fernandes, G., Velangi, A., & Wolever, T. M. S. (2005). Glycemic index of potatoes
commonly consumed in North America. Journal of the American Dietetic
Association, 105(4), 557-562.
100
Flint, A., Møller, B. K., Raben, A., Pedersen, D., Tetens, I., Holst, J. J., & Astrup, A.
(2004). The use of glycaemic index tables to predict glycaemic index of composite
breakfast meals. British Journal of Nutrition, 91(6), 979-989.
Flourie, B., Florent, C., Etanchaud, F., Evard, D., Franchisseur, C., & Rambaud, J.
(1988). Starch absorption by healthy man evaluated by lactulose hydrogen breath
test. American Journal of Clinical Nutrition, 47(1), 61-66.
Gallant, D. J., Bouchet, B., Buleon, A., & Perez, S. (1992). Physical characteristics of
starch granules and susceptibility to enzymatic degradation. European Journal of
Clinical Nutrition, 46(Suppl.2), S3-S16.
García-Alonso, A., & Goñi, I. (2000). Effect of processing on potato starch: In vitro
availability and glycaemic index. Nahrung/Food, 44(1), 19-22.
Gilat, T., Ben Hur, H., & Gelman Malachi, E. (1978). Alterations of the colonic flora and
their effect on the hydrogen breath test. Gut, 19(7), 602-605.
Golden, F. (2002, January 21, 2002). And now the bad news: Potatoes. Time Magazine,
55-56.
Grysman, A., Carlson, T., & Wolever, T. M. S. (2008). Effects of sucromalt on
postprandial responses in human subjects. European Journal of Clinical Nutrition,
62(12), 1364-1371.
Haase, N. U., & Plate, J. (1996). Properties of potato starch in relation to varieties and
environmental factors. Starch/Staerke, 48(5), 167-171.

101
Halton, T. L., Willett, W. C., Liu, S., Manson, J. E., Stampfer, M. J., & Hu, F. B. (2006).
Potato and french fry consumption and risk of type 2 diabetes in women. American
Journal of Clinical Nutrition, 83(2), 284-290.
Health Canada. (2009). Canadian nutrient file. Retrieved July 12 2010, from www.hc-
sc.gc.ca
Henry, C. J. K., Lightowler, H. J., & Strik, C. M. (2005). Glycaemic index values for
commercially available potatoes in Great Britain. The British Journal of Nutrition,
94(6), 917-921.
IOM. (2000). Dietary reference intakes for vitamin C, vitamin E, selenium, and
carotenoids. Washington, D.C: National Academy Press.
Jenkins, D. J., & Wolever, T. M. (1981). Slow release carbohydrate and the treatment of
diabetes. Proceedings of the Nutrition Society, 40(2), 227-235.
Jenkins, D. J., Wolever, T. M., Taylor, R. H., Griffiths, C., Krzeminska, K., Lawrie, J. A.,
Bennett, C. M., Goff, D. V., Sarson, D. L., & Bloom, S. R. (1982). Slow release
dietary carbohydrate improves second meal tolerance. American Journal of Clinical
Nutrition, 35(6), 1339-1346.
Jenkins, D. J. A., Cuff, D., Wolever, T. M. S., Knowland, D., Thompson, L., Cohen, Z.,
& Prokipchuk, E. (1987). Digestibility of carbohydrate foods in an ileostomate:
Relationship to dietary fiber, in vitro digestibility, and glycemic response. American
Journal of Gastroenterology, 82(8), 709-717.

102
Jenkins, D. J. A., Wolever, T. M. S., & Nineham, R. (1980). Improved glucose tolerance
four hours after taking guar with glucose. Diabetologia, 19(1), 21-24.
Karim, A. A., Toon, L. C., Lee, V. P. L., Ong, W. Y., Fazilah, A., & Noda, T. (2007).
Effects of phosphorus contents on the gelatinization and retrogradation of potato
starch. Journal of Food Science, 72(2), C132-C138.
Kingman, S. M., & Englyst, H. N. (1994). The influence of food preparation methods on
the in-vitro digestibility of starch in potatoes. Food Chemistry, 49, 181-186.
Leeds, A. R. (2002). Glycemic index and heart disease. The American Journal of Clinical
Nutrition, 76(1), 286S-289S.
Leeman, A. M., Bårström, L. M., & Björck, I. M. E. (2005). In vitro availability of starch
in heat-treated potatoes as related to genotype, weight and storage time. Journal of
the Science of Food and Agriculture, 85(5), 751-756.
Leeman, M., Östman, E., & Björck, I. (2005). Vinegar dressing and cold storage of
potatoes lowers postprandial glycaemic and insulinaemic responses in healthy
subjects. European Journal of Clinical Nutrition, 59(11), 1266-1271.
Leeman, M., Östman, E., & Björck, I. (2008). Glycaemic and satiating properties of
potato products. European Journal of Clinical Nutrition, 62(1), 87-95.
Lehmann, U., & Robin, F. (2007). Slowly digestible starch - its structure and health
implications: A review. Trends in Food Science and Technology, 18(7), 346-355.

103
Levitt, M. D., Hirsh, P., & Fetzer, C. A. (1987). H2 excretion after ingestion of complex
carbohydrates. Gastroenterology, 92(2), 383-389.
Liu, Q., Tarn, R., Lynch, D., & Skjodt, N. M. (2007). Physicochemical properties of dry
matter and starch from potatoes grown in Canada. Food Chemistry, 105, 897-907.
Liu, Q., Weber, E., Currie, V., & Yada, R. (2003). Physicochemical properties of starches
during potato growth. Carbohydrate Polymers, 51(2), 213-221.
Liu, S., & Willett, W. C. (2002). Dietary glycemic load and atherothrombotic risk.
Current Atherosclerosis Reports, 4(6), 454-461.
Livesey, G., Johnson, I. T., Gee, J. M., Smith, T., Lee, W. E., Hillan, K. A., Meyer, J., &
Turner, S. C. (1993). 'Determination' of sugar alcohol and polydextrose® absorption
in humans by the breath hydrogen (H2) technique: The stoichiometry of hydrogen
production and the interaction between carbohydrates assessed in vivo and in vitro.
European Journal of Clinical Nutrition, 47(6), 419-430.
Madsen, M. H., & Christensen, D. H. (1996). Changes in viscosity properties of potato
starch during growth. Starch/Staerke, 48(7-8), 245-249.
McKeown, N. M., Meigs, J. B., Liu, S., Saltzman, E., Wilson, P. W. F., & Jacques, P. F.
(2004). Carbohydrate nutrition, insulin resistance, and the prevalence of the
metabolic syndrome in the framingham offspring cohort. Diabetes Care, 27(2), 538-
546.

104
Miles, M. J., Morris, V. J., Orford, P. D., & Ring, S. G. (1985). The roles of amylose and
amylopectin in the gelation and retrogradation of starch. Carbohydrate Research,
135, 271-281.
Mishra, S., Monro, J., & Hedderley, D. (2008). Effect of processing on slowly digestible
starch and resistant starch in potato. Starch/Staerke, 60(9), 500-507.
Nilsson, A., Östman, E., Preston, T., & Björck, I. (2008). Effects of GI vs. content of
cereal fibre of the evening meal on glucose tolerance at a subsequent standardized
breakfast. European Journal of Clinical Nutrition, 62(6), 712-720.
Olesen, M., Rumessen, J. J., & Gudmand-Hoyer, E. (1994). Intestinal transport and
fermentation of resistant starch evaluated by the hydrogen breath test. European
Journal of Clinical Nutrition, 48(10), 692-701.
Owira, P. M. O., Young, G. O., & Winter, T. A. (2005). Comparison of inulin and
lactulose as reference standards in the breath hydrogen test assessment of
carbohydrate malabsorption in patients with chronic pancreatic exocrine
insufficiency. Digestive Diseases and Sciences, 50(6), 1058-1063.
Priebe, M. G., Wang, H., Weening, D., Schepers, M., Preston, T., & Vonk, R. J. (2010).
Factors related to colonic fermentation of nondigestible carbohydrates of a previous
evening meal increase tissue glucose uptake and moderate glucose-associated
inflammation. American Journal of Clinical Nutrition, 91(1), 90-97.

105
Read, N. W., Al-Janabi, M. N., & Bates, T. E. (1985). Interpretation of the breath
hydrogen profile obtained after ingesting a solid meal containing unabsorable
carbohydrate. Gut, 26(8), 834-842.
Ring, S. G., Gee, J. M., Whittam, M., Orford, P. D., & Johnson, I. T. (1988). Resistant
starch: Its chemical form in foodstuffs and effect on digestibility in vitro. Food
Chemistry, 28, 97-109.
Robb, P. A., Wolever, T. M. S., & Hassanein, J. (1991). Use of breath hydrogen to
quantify carbohydrate malabsorption: Lack of effect of soluble fibre (guar). Nutrition
Research, 11(12), 1349-1356.
Rumessen, J. J. (1992). Hydrogen and methane breath tests for evaluation of resistant
carbohydrates. European Journal of Clinical Nutrition, 46(SUPPL. 2), S77-S90.
Rumessen, J. J., Hamberg, O., & Gudmand-Hoyer, E. (1990). Interval sampling of end-
expiratory hydrogen (H2) concentrations to quantify carbohydrate malabsorption by
means of lactulose standards. Gut, 31(1), 37-42.
Rumessen, J. J., Nordgaard-Andersen, I., & Gudmand-Hoyer, E. (1994). Carbohydrate
malabsorption: Quantification by methane and hydrogen breath tests. Scandinavian
Journal of Gastroenterology, 29(9), 826-832.
Sajilata, M. G., Singhal, R. S., & Kulkarni, P. R. (2006). Resistant starch - A review.
Comprehensive Reviews in Food Science and Food Safety, 5(1), 1-17.

106
Sanz, M. L., Gibson, G. R., & Rastall, R. A. (2005). Influence of disaccharide structure
on prebiotic selectivity in vitro. Journal of Agricultural and Food Chemistry, 53(13),
5192-5199.
Scheppach, W., Bach, M., Bartram, P., Christl, S., Bergthaller, W., & Kasper, H. (1991).
Colonic fermentation of potato starch after a freeze-thaw cycle. Digestive Diseases
and Sciences, 36(11), 1601-1605.
Seal, C. J., Daly, M. E., Thomas, L. C., Bal, W., Birkett, A. M., Jeffcoat, R., & Mathers,
J. C. (2003). Postprandial carbohydrate metabolism in healthy subjects and those
with type 2 diabetes fed starches with slow and rapid hydrolysis rates determined in
vitro. British Journal of Nutrition, 90(5), 853-864.
Soh, N. L., & Brand-Miller, J. C. (1999). The glycemic index of potatoes: The effect of
variety, cooking method and maturity. European Journal of Clinical Nutrition, 53,
249-254.
Stevenson, E. J., Thelwall, P. E., Thomas, K., Smith, F., Brand-Miller, J., & Trenell, M.
I. (2009). Dietary glycemic index influences lipid oxidation but not muscle or liver
glycogen oxidation during exercise. American Journal of Physiology -
Endocrinology and Metabolism, 296(5), E1140-E1147.
Steward, H. L., Bethea, M. C., Andrews, S. S., & Balart, L. A. (2003). The new sugar
busters!: Cut sugar to trim fat. New York, NY: Ballantine Publishing Group.

107
Svegmark, K., Helmersson, K., Nilsson, G., Nilsson, P., Andersson, R., & Svensson, E.
(2002). Comparison of potato amylopectin starches and potato starches - influence of
year and variety. Carbohydrate Polymers, 47(4), 331-340.
The Canadian Association for Enterostomal Therapy. (2009). A guide to living with an
illeostomy. Retrieved July 18 2010, 2010, from www.caet.ca
USBP. (2008). Compendium of current university research projects affecting the media
and nutrition leader environment regarding issues relating to potatoes. Retrieved
July 10 2010 from www.potato2008.org
Vega-López, S., Ausman, L. M., Griffith, J. L., & Lichtenstein, A. H. (2007).
Interindividual variability and intra-individual reproducibility of glycemic index
values for commercial white bread. Diabetes Care, 30(6), 1412-1417.
Venn, B. J., & Green, T. J. (2007). Glycemic index and glycemic load: Measurement
issues and their effect on diet-disease relationships. European Journal of Clinical
Nutrition, 61(SUPPL. 1), S122-S131.
Venter, C. S., Vorster, H. H., & Cummings, J. H. (1990). Effects of dietary propionate on
carbohydrate and lipid metabolism in healthy volunteers. American Journal of
Gastroenterology, 85(5), 549-553.
Vogt, J. A., Ishii-Schrade, K. B., Pencharz, P. B., Jones, P. J. H., & Wolever, T. M. S.
(2006). L-rhamnose and lactulose decrease serum triacylglycerols and their rates of
synthesis, but do not affect serum cholesterol concentrations in men. Journal of
Nutrition, 136(8), 2160-2166.

108
Wee, S., Williams, C., Tsintzas, K., & Boobis, L. (2005). Ingestion of a high-glycemic
index meal increases muscle glycogen storage at rest but augments its utilization
during subsequent exercise. Journal of Applied Physiology, 99(2), 707-714.
Willet, W. C. (2001). Eat,drink, and be healthy: The Harvard medical school guide to
healthy eating. New York, NY: Free Press.
Willet, W. C., Manson, J., & Liu, S. (2002). Glycemic index, glycemic load and risk of
type 2 diabetes. The American Journal of Clinical Nutrition, 76, S274-S280.
Willet, W. C., & Stampfer, M. J. (2006, December 2006). Rebuilding the food pyramid.
Scientific American, 16, 12-21.
Williams, P. C., Kuzina, F. D., & Hlynka, I. (1970). A rapid colorimetric procedure for
estimating the amylose conent of starches and flours. Cereal Chemistry, 47, 411-420.
Williams, S. M., Venn, B. J., Perry, T., Brown, R., Wallace, A., Mann, J. I., & Green, T.
J. (2008). Another approach to estimating the reliability of glycaemic index. British
Journal of Nutrition, 100(2), 364-372.
Wolever, T. M. S. (2006). The glycaemic index A physiological classification of dietary
carbohydrate. Cambridge,MA: CABI.
Wolever, T. M. S., Bentum-Williams, A., & Jenkins, D. J. A. (1995). Physiological
modulation of plasma free fatty acid concentrations by diet: Metabolic implications
in nondiabetic subjects. Diabetes Care, 18(7), 962-970.

109
Wolever, T.M.S.,& Bolognesi, C. (1996). Source and amount of carbohydrate affect
postprandial glucose and insulin in normal subjects. Journal of Nutrition, 126 (11),
2798-2806
Wolever, T. M. S., Brand-Miller, J. C., Abernethy, J., Astrup, A., Atkinson, F., Axelsen,
M., Björck, I., Brighenti, F., Brown, R., Brynes, A., Casiraghi, M. C., Cazaubiel, M.,
Dahlqvist, L., Delport, E., Denyer, G. S., Erba, D., Frost, G., Granfeldt, Y.,
Hampton, S., Hart, V. A., Hätönen, K. A., Henry, C. J., Hertzler, S., Hull, S., Jerling,
J., Johnston, K. L., Lightowler, H., Mann, N., Morgan, L., Panlasigui, L. N.,
Pelkman, C., Perry, T., Pfeiffer, A. F. H., Pieters, M., Ramdath, D. D., Ramsingh, R.
T., Robert, S. D., Robinson, C., Sarkkinen, E., Scazzina, F., Sison, D. C. D., Sloth,
B., Staniforth, J., Tapola, N., Valsta, L. M., Verkooijen, I., Weickert, M. O.,
Weseler, A. R., Wilkie, P., & Zhang, J. (2008). Measuring the glycemic index of
foods: Interlaboratory study. American Journal of Clinical Nutrition, 87(1), 247S-
257S.
Wolever, T. M. S., Brighenti, F., Royall, D., Jenkins, A. L., & Jenkins, D. J. A. (1989).
Effect of rectal infusion of short chain fatty acids in human subjects. American
Journal of Gastroenterology, 84(9), 1027-1033.
Wolever, T.M.S.,Cohen, Z., & Thompson, L.U. (1986). Ileal loss of available
carbohydrate in man: Comparison of a breath hydrogen method with direct
measurement using a human ileostomy model. American Journal of
Gastroenterology, 81 (2), 115-122

110
Wolever, T. M. S., Gibbs, A. L., Mehling, C., Chiasson, J., Connelly, P. W., Josse, R. G.,
Leiter, L. A., Maheux, P., Rabasa-Lhoret, R., Rodger, N. W., & Ryan, E. A. (2008).
The Canadian trial of carbohydrates in diabetes (CCD), a 1-y controlled trial of low-
glycemic-index dietary carbohydrate in type 2 diabetes: No effect on glycated
hemoglobin but reduction in C-reactive protein. American Journal of Clinical
Nutrition, 87(1), 114-125.
Wolever, T. M. S., Jenkins, D. J. A., Ocana, A. M., Rao, V. A., & Collier, G. R. (1988).
Second-meal effect: Low-glycemic-index foods eaten at dinner improve subsequent
breakfast glycemic response. American Journal of Clinical Nutrition, 48(4), 1041-
1047.
Wolever, T. M. S., Jenkins, D. J. A., Vuksan, V., Josse, R. G., Wong, G. S., & Jenkins,
A. L. (1990). Glycemic index of foods in individual subjects. Diabetes Care, 13(2),
126-132.
Wolever, T. M. S., & Robb, P. A. (1992). Effect of guar, pectin, psyllium, soy
polysaccharide, and cellulose on breath hydrogen and methane in healthy subjects.
American Journal of Gastroenterology, 87(3), 305-310.
Wolever, T. M., Spadafora, P., & Eshuis, H. (1991a). Interaction between colonic acetate
and propionate in humans. American Journal of Clinical Nutrition, 53(3), 681-687.
Wolever, T. M. S., Vorster, H. H., Björck, I., Brand-Miller, J., Brighenti, F., Mann, J. I.,
Ramdath, D. D., Granfeldt, Y., Holt, S., Perry, T. L., Venter, C., & Wu, X. (2003).

111
Determination of the glycaemic index of foods: Interlaboratory study. European
Journal of Clinical Nutrition, 57(3), 475-482.
Wolever, T. M., Jenkins, D. J., Jenkins, A. L., & Josse, R. G. (1991b). The glycemic
index: Methodology and clinical implications. American Journal of Clinical
Nutrition, 54(5), 846-854.
Wong, J. M. W., & Jenkins, D. J. A. (2007). Carbohydrate digestibility and metabolic
effects. Journal of Nutrition, 137(11), 2539S-2546S.
Wolf, B. W., Garleb, K. A., Choe, Y.S., Humphrey, P. M., & Maki, K. C. (2003). Pullan
is a slowly digested carbohydrate in humans. Journal of Nutrition, 133(4), 1051-
1055
Zhang, G., Ao, Z., & Hamaker, B. R. (2008). Nutritional property of endosperm starches
from maize mutants: A parabolic relationship between slowly digestible starch and
amylopectin fine structure. Journal of Agricultural and Food Chemistry, 56(12),
4686-4694.
Zhang, G., & Hamaker, B. R. (2009). Slowly digestible starch: Concept, mechanism, and
proposed extended glycemic index. Critical Reviews in Food Science and Nutrition,
49(10), 852-867.