Interaction between financial information and the ... · Project steered by the underwriting...
12
1 SCOR P&C - TECHNICAL NEWSLETTER #43 - APRIL 2018 TECHNICAL NEWSLETTER #43 - April 2018 INTRODUCTION Solvency II regulation has been in force for over 2 years. Its effects have yet to be fully felt by insurance companies, customers, regulators, and capital providers. However, we already see a number of impacts well beyond the regulatory solvency framework. Considering Solvency II in a broader sense than its strict regulatory nature, we begin to see how: Pillar I provides the tools for capital management sophis- tication and optimization; Pillar II provides a framework for better risk appetite setting and governance in general; Pillar III should be an integral part of a risk management and financial communications strategy. The consequences of Pillar III are familiar to insurers already using capital markets for their debt and equity funding. Many other insurers, especially mutuals, are not used to so much transparency, plus the constraints and long-term consequences that go with it. Nevertheless, over time, Solvency II and the disclosures required by Pillar III should catalyze greater sophistication in the management of risk and capital among all insurers. WHAT SHOULD WE MAKE OF EUROPEAN INSURERS’ SOLVENCY II DISCLOSURES? Interaction between financial information and the reinsurance underwriting process THE CONSEQUENCES OF INCREASED DISCLOSURES The production of additional metrics raises the question of the standards on which they are based. Even if assump- tions are used to produce additional indicators (especially for transitional measures), we could expect Solvency and Financial Condition Reports (SFCRs) to lead to greater homo- geneity in insurers’ behaviour over time: as the performance metrics become standardized (and more sophisticated), the tools used to monitor and therefore maximize performance are better defined, becoming standard over time, ultimately leading to more homogenous insurer behaviours that comply with the new additional Key Performance Indicators. This increased transparency in terms of both the perfor- mance and the funding of insurers and reinsurers comes at a point in the underwriting cycle where capital levels are relatively high and interest rates low. This is contributing to a re-evaluation of the industry’s approach to capital and sources of funding in the light of economic capital (including Solvency II) requirements. The reinsurance solutions explored in our previous Technical Newsletter (“From Capital Management to Capital Optimization”, March 2017) have continued to gain momentum among insurers and their reinsurance managers, Chief Risk Officers, Chief Financial Officers and Boards. This was confirmed by a number of public restructurings in the reinsurance purchase strategies of large, if not global, insurers. With this evolution towards viewing reinsurance solutions as another form of capital available to insurers, to complement more traditional sources such as equity and debt, there is growing pressure on reinsurers to take a more holistic view of their clients’ business. In this respect, SFCRs and Quantitative Reporting Templates can provide a valuable source of information.
Transcript of Interaction between financial information and the ... · Project steered by the underwriting...

1NP SCOR P&C - TECHNICAL NEWSLETTER #43 - APRIL 2018SCOR P&C - TECHNICAL NEWSLETTER #43 - APRIL 2018
TECHNICALNEWSLETTER
#43 - April 2018
INTRODUCTION
Solvency II regulation has been in force for over 2 years. Its effects have yet to be fully felt by insurance companies, customers, regulators, and capital providers. However, we already see a number of impacts well beyond the regulatory solvency framework.
Considering Solvency II in a broader sense than its strict regulatory nature, we begin to see how:
� Pillar I provides the tools for capital management sophis-tication and optimization;
� Pillar II provides a framework for better risk appetite setting and governance in general;
� Pillar III should be an integral part of a risk management and financial communications strategy.
The consequences of Pillar III are familiar to insurers already using capital markets for their debt and equity funding. Many other insurers, especially mutuals, are not used to so much transparency, plus the constraints and long-term consequences that go with it. Nevertheless, over time, Solvency II and the disclosures required by Pillar III should catalyze greater sophistication in the management of risk and capital among all insurers.
WHAT SHOULD WE MAKE OF EUROPEAN INSURERS’ SOLVENCY II DISCLOSURES? Interaction between financial information and the reinsurance underwriting process
THE CONSEQUENCES OF INCREASED DISCLOSURES
The production of additional metrics raises the question of the standards on which they are based. Even if assump-tions are used to produce additional indicators (especially for transitional measures), we could expect Solvency and Financial Condition Reports (SFCRs) to lead to greater homo-geneity in insurers’ behaviour over time: as the performance metrics become standardized (and more sophisticated), the tools used to monitor and therefore maximize performance are better defined, becoming standard over time, ultimately leading to more homogenous insurer behaviours that comply with the new additional Key Performance Indicators.
This increased transparency in terms of both the perfor-mance and the funding of insurers and reinsurers comes at a point in the underwriting cycle where capital levels are
relatively high and interest rates low. This is contributing to a re-evaluation of the industry’s approach to capital and sources of funding in the light of economic capital (including Solvency II) requirements. The reinsurance solutions explored in our previous Technical Newsletter (“From Capital Management to Capital Optimization”, March 2017) have continued to gain momentum among insurers and their reinsurance managers, Chief Risk Officers, Chief Financial Officers and Boards. This was confirmed by a number of public restructurings in the reinsurance purchase strategies of large, if not global, insurers. With this evolution towards viewing reinsurance solutions as another form of capital available to insurers, to complement more traditional sources such as equity and debt, there is growing pressure on reinsurers to take a more holistic view of their clients’ business. In this respect, SFCRs and Quantitative Reporting Templates can provide a valuable source of information.

32 SCOR P&C - TECHNICAL NEWSLETTER #43 - APRIL 2018SCOR P&C - TECHNICAL NEWSLETTER #43 - APRIL 2018
As the focus on how insurers define their “risk appetite” continues (Pillar II of Solvency II regulation), we believe that the role of leading reinsurers as providers of optimized balance sheets and complex capital optimization solutions can only grow.
In this year’s Technical Newsletter, we look at the impact on insurers of greater public disclosures, and discuss how financial analysis and understanding can feed the reinsur-ance underwriting process, helping reinsurance underwriters to better understand their clients’ needs and deliver the most appropriate solutions.
The raw material for this Technical Newsletter comes from an initiative we have been developing at SCOR Global P&C over the past 2 years:
THE VALUE OF FINANCIAL INFORMATION: NEWLY DISCLOSED DATA PROVIDES ADDITIONAL PUBLIC INFORMATION ON INSURERS’ EXPOSURES AND CAPITAL CONSTRAINTS
We are seeing a growing maturity in how insurers approach the quantitative aspects of solvency regulation (“Pillar I”), and how they deal with the governance implications (“Pillar II”).
However, the full effects of the new disclosures (“Pillar III”) are far less visible, particularly for the public disclosures in SFCRs, including the Quantitative Reporting Templates (QRTs). Public
QRTs provide rather limited information compared to the dis-closures that insurers are required to make when using funding from the capital markets (whether equity or debt). But public QRTs introduce a degree of transparency that a large number of small and medium-sized insurers are not used to. As historical data series become available over time, this will lead to greater transparency, potentially impacting prices and valuations.
Project steeredby the underwriting management team in Europe…
A team of European underwriters, with the involvement of each of the 8 European offices and benefitting from an understanding of local challenges…
… as well as experts in the underwriting of alternative reinsurance solutions
A technical team with strong Solvency II expertise, put together during the creation of SCOR’s internal model
Combining various skills: Pricing, Modelling, Natural Catastrophes, Finance, Reserving, etc.
…backed by a team of Solvency II experts
Working together on three main focus areas
Familiarising underwriters with Solvency II and its potential implications for the risk appetite
of insurers and their reinsurance needs
Providing underwriters with technical Solvency II support and creating a case studies library and a
“toolkit” based on SCOR’s expertise
Developing a proactive commercial approach, centered on understanding
and analyzing the needs of clients
Stay informed Be proactiveBe prepared
Phase1
Phase2
Phase3
SOLVENCY II IS PART OF A BROADER TREND TO PRODUCE AND USE LEADING ECONOMIC INDICATORS TO STEER BUSINESS
?1st January 2016 2016 - 2018 2018 - …
“Exceeding the standard solvency ratio level”
Done!
Overcoming the operational challenges linked to regulatory implementation
In progress!
Seizing opportunities to optimize required and available capital
To be defined, and anticipated…
� The vast majority of European insurers are above the standard 100% solvency ratio level
�Regularly producing figures
� Implementing required governance, and formalizing risk appetite and reporting procedures
�Overcoming regulatory constraints and developing economic steering tools at the heart of operating activity
�Moving from a static view of capital to a dynamic view, with measured and controlled volatility
32 SCOR P&C - TECHNICAL NEWSLETTER #43 - APRIL 2018SCOR P&C - TECHNICAL NEWSLETTER #43 - APRIL 2018
Niccolò Dalla Palma, a Dutch and Italian citizen, started his career in 2007 as an equity analyst in London, covering Italian insurers. In 2009 he joined Exane BNP Paribas in Equity Research based on Paris, where he heads the European insurance team since 2015. Niccolo is a graduate of Bocconi University in Milan, with a Master of Science in Finance.Niccolo DALLA PALMA
Equity Analyst, Exane BNP Paribas
GUEST CORNER
This view is confirmed by the large number of financial (mainly equity) analysts’ reports that appeared following the first QRT publications in May 2017. We have asked one of these analysts to provide a financial point of view on these disclosures (see “Guest Corner”).
We could draw a parallel here between reinsurance prices and financial economic theory, the “efficient markets hypothesis”. The term “efficient market” was first defined in 1965, by E.F. Fama, who said that “in an efficient market, on the average, competition will cause the full effects of new information on intrinsic values to be reflected “instantaneously” in actual prices”. While this theory is the subject of endless debates and a vast body of academic literature, it remains probably the best explanation of price movements in securities markets. In the Efficient Markets Hypothesis, the key factor explaining price changes is the arrival of new information, and there is
strong empirical evidence of the so-called “semi-strong” form of efficiency. “The ‘semi-strong’ form of market efficiency hypothesis suggests that the current price fully incorporates all publicly available information1”.
Drawing a parallel with reinsurance, an interesting question arises: to what extent will the newly available QRT data enable reinsurers to assess and price risks differently, if not better? And more generally speaking, how will reinsurers use the informa-tion provided in the SFCRs to deliver more tailored solutions to their clients?
These are the questions we try to answer in the following section.
1 The efficient markets hypothesis (“EMH”) is also known as the “Random Walk Theory”. See the article The efficient markets hypothesis by Jonathan Clarke, Tomas Jandik and Gershon Mandelker. In: Robert C. ARFFA, ed. Expert Financial Planning: Investment Strategies from Industry Leaders. New York: Wiley, 2001
SFCRs: THE EQUITY FINANCIAL ANALYST’S VIEW Investors have long sought better comparability and transparency when it comes to insurers’ balance sheets. From an equity analyst’s perspective, two years after the first implementation of Solvency II we believe there is still a way to go on comparability, but SFCRs have in our view provided useful disclosure to allow for more meaningful conversations with management around capital and capital allocation. And while investors familiarise themselves with the new Solvency II disclosures, they also prepare for the next important debate and new disclosure round with the 2021 accounting changes (namely International Financial Reporting Standard 17).
COMPARABILITY IS STILL AN ISSUE, BUT DISCLOSURE HAS IMPROVED
Investors hoping for full comparability to benchmark based on a set target Solvency level for all companies alike may be disappointed. And disagreements around some of the technical details of the framework have often come up in our conversations with investors, especially where it may appear that these are just the result of political compromise. However, one thing has improved in our view: disclosure.
54 SCOR P&C - TECHNICAL NEWSLETTER #43 - APRIL 2018SCOR P&C - TECHNICAL NEWSLETTER #43 - APRIL 2018
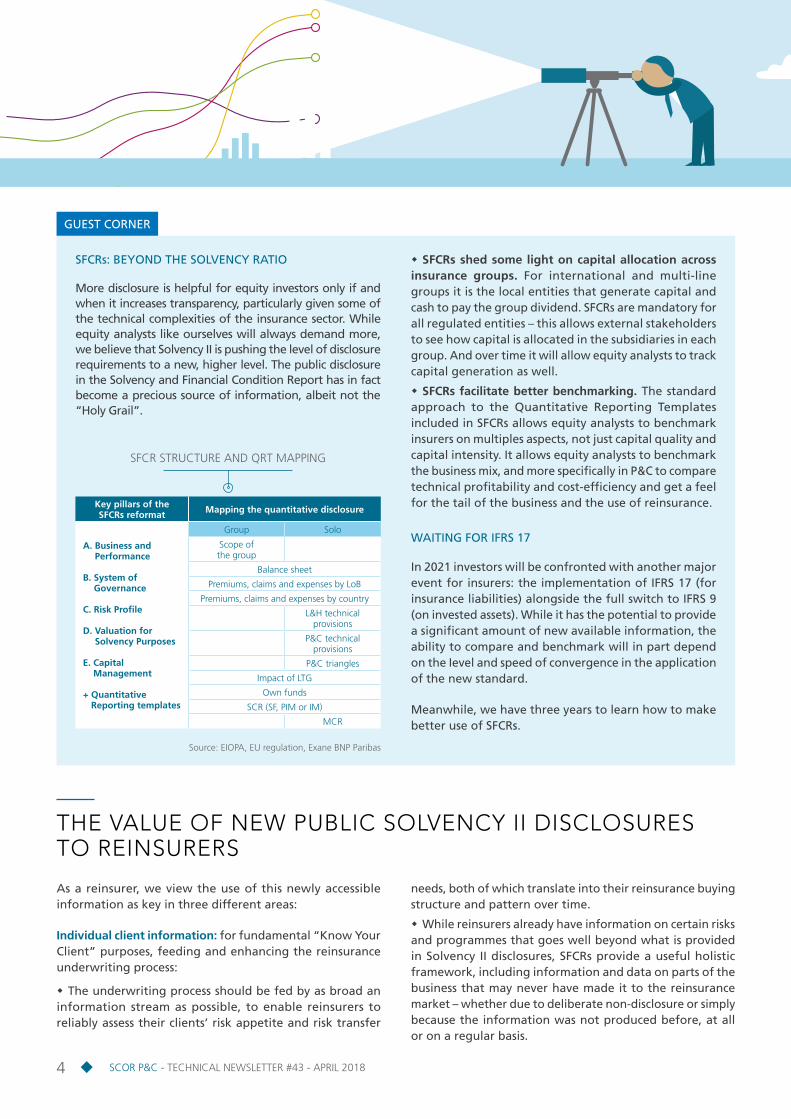
SFCRs: BEYOND THE SOLVENCY RATIO
More disclosure is helpful for equity investors only if and when it increases transparency, particularly given some of the technical complexities of the insurance sector. While equity analysts like ourselves will always demand more, we believe that Solvency II is pushing the level of disclosure requirements to a new, higher level. The public disclosure in the Solvency and Financial Condition Report has in fact become a precious source of information, albeit not the “Holy Grail”.
� SFCRs shed some light on capital allocation across insurance groups. For international and multi-line groups it is the local entities that generate capital and cash to pay the group dividend. SFCRs are mandatory for all regulated entities – this allows external stakeholders to see how capital is allocated in the subsidiaries in each group. And over time it will allow equity analysts to track capital generation as well.
� SFCRs facilitate better benchmarking. The standard approach to the Quantitative Reporting Templates included in SFCRs allows equity analysts to benchmark insurers on multiples aspects, not just capital quality and capital intensity. It allows equity analysts to benchmark the business mix, and more specifically in P&C to compare technical profitability and cost-efficiency and get a feel for the tail of the business and the use of reinsurance.
WAITING FOR IFRS 17
In 2021 investors will be confronted with another major event for insurers: the implementation of IFRS 17 (for insurance liabilities) alongside the full switch to IFRS 9 (on invested assets). While it has the potential to provide a significant amount of new available information, the ability to compare and benchmark will in part depend on the Ievel and speed of convergence in the application of the new standard.
Meanwhile, we have three years to learn how to make better use of SFCRs.
THE VALUE OF NEW PUBLIC SOLVENCY II DISCLOSURES TO REINSURERS
As a reinsurer, we view the use of this newly accessible information as key in three different areas:
Individual client information: for fundamental “Know Your Client” purposes, feeding and enhancing the reinsurance underwriting process:
� The underwriting process should be fed by as broad an information stream as possible, to enable reinsurers to reliably assess their clients’ risk appetite and risk transfer
needs, both of which translate into their reinsurance buying structure and pattern over time.
� While reinsurers already have information on certain risks and programmes that goes well beyond what is provided in Solvency II disclosures, SFCRs provide a useful holistic framework, including information and data on parts of the business that may never have made it to the reinsurance market – whether due to deliberate non-disclosure or simply because the information was not produced before, at all or on a regular basis.
GUEST CORNER
Key pillars of the SFCRs reformat Mapping the quantitative disclosure
A. Business and Performance
B. System of Governance
C. Risk Profile
D. Valuation for Solvency Purposes
E. Capital Management
+ Quantitative Reporting templates
Group Solo
Scope of the group
Balance sheet
Premiums, claims and expenses by LoB
Premiums, claims and expenses by country
L&H technical provisions
P&C technical provisions
P&C triangles
Impact of LTG
Own funds
SCR (SF, PIM or IM)
MCR
SFCR STRUCTURE AND QRT MAPPING
Source: EIOPA, EU regulation, Exane BNP Paribas

54 SCOR P&C - TECHNICAL NEWSLETTER #43 - APRIL 2018SCOR P&C - TECHNICAL NEWSLETTER #43 - APRIL 2018
� This information can take the form of either qualitative disclosures, such as those found in the SFCRs on system of governance or risk profile, or quantitative data as presented in the QRTs. While the quantitative data gives valuable information on business performance and balance sheet solidity, the qualitative disclosures provide the background on the risk management culture and control framework. This information is inherently less comparable, both in form and content, than the data contained in the QRTs, but the interaction of these two sources of information can provide important insights into the management of a client’s business.
Market benchmarking and pricing analysis: as time series become available with annual releases, public QRTs will become key sources of information for risk assessment and valuation / pricing purposes.
� This is particularly true for Line of Business disclosure (premiums and reserves), which is provided gross and net of reinsurance for individual (“solo”) entities and groups, leading to market and line of business benchmarks built from a more complete and comparable data set than previously.
� Outliers will therefore become more easily identifiable, leading to a better relative positioning analysis of each insurer in a given market.
Increasing reinsurers’ ability to deliver more tailored solutions to their clients
� Insurers’ discretion when disclosing information to their reinsurers will be reduced: SFCRs will disclose information on portfolio subsets that might be unknown to external capital providers (reinsurance, debt, equity).
� This increased disclosure is an additional incentive for insurers to be as transparent as possible to their stakeholders, and a tool for these stakeholders to be more autonomous when providing capital and earnings’ volatility management solutions to insurance companies.
� Reinsurers will potentially be able to propose solutions for their clients proactively, based on a wider information set than that contained in broker information packs.
We illustrate the above points by providing the standard analysis we produce on insurer and market benchmarks. For the purpose of this Technical Newsletter, we look at a number of Nordic insurers and markets.
DRILLING INTO THE PUBLIC QRTs OF SELECTED NORDIC INSURERS AND MARKETS
The publication of QRTs (both for solo entities and Groups) as part of the SFCRs allows all stakeholders to analyse the balance sheet structure and P&L performance of all insurance companies, and to benchmark them against each other. This can be done within a single market, or by comparing similar companies across markets. The information provided can generally be divided into 3 different types:
1. Solvency position & balance sheet structure
2. Operating performance
3. Approach to reinsurance
1. Solvency position & balance sheet structure
Balance sheet information can be useful to reinsurers in several respects:
� Generally speaking, it can help reinsurers to better understand an insurer’s situation and robustness, the balance sheet being the result of its history.
� It is the starting point to understand an insurer’s risk appetite: an economic approach would imply that the stronger the balance sheet, the higher the risk appetite should be (eventhough it is often not the case).
� Following both points above, reinsurance solutions can make an insurer’s balance sheet stronger, or optimized. Reinsurance “alternative solutions” focus on creating eligible own funds, or alleviating capital needs generated by the balance sheet structure.
76 SCOR P&C - TECHNICAL NEWSLETTER #43 - APRIL 2018SCOR P&C - TECHNICAL NEWSLETTER #43 - APRIL 2018
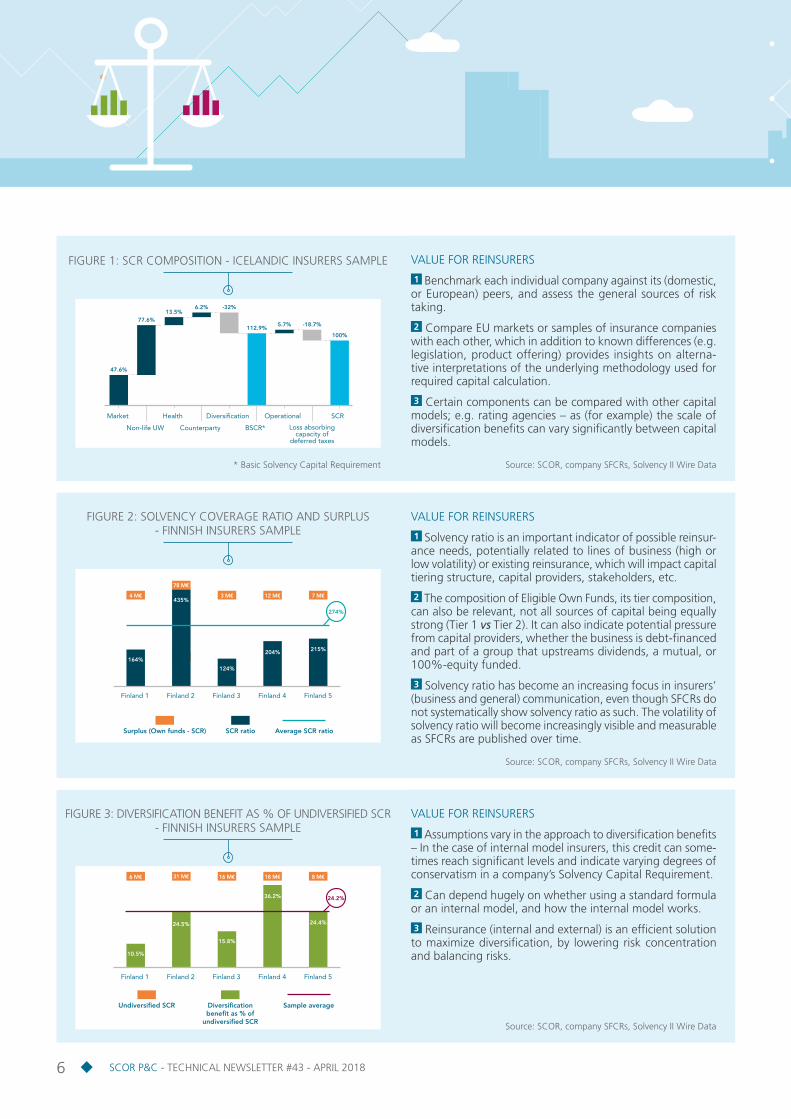
VALUE FOR REINSURERS
1 Benchmark each individual company against its (domestic, or European) peers, and assess the general sources of risk taking.
2 Compare EU markets or samples of insurance companies with each other, which in addition to known differences (e.g. legislation, product offering) provides insights on alterna-tive interpretations of the underlying methodology used for required capital calculation.
3 Certain components can be compared with other capital models; e.g. rating agencies – as (for example) the scale of diversification benefits can vary significantly between capital models.
Diversification
Counterparty
Health
Non-life UW
Market
BSCR*
Operational
Loss absorbing capacity of
deferred taxes
SCR
47.6%
77.6%13.5%
6.2% -32%
112.9%5.7% -18.7%
100%
FIGURE 1: SCR COMPOSITION - ICELANDIC INSURERS SAMPLE
* Basic Solvency Capital Requirement Source: SCOR, company SFCRs, Solvency II Wire Data
VALUE FOR REINSURERS
1 Solvency ratio is an important indicator of possible reinsur-ance needs, potentially related to lines of business (high or low volatility) or existing reinsurance, which will impact capital tiering structure, capital providers, stakeholders, etc.
2 The composition of Eligible Own Funds, its tier composition, can also be relevant, not all sources of capital being equally strong (Tier 1 vs Tier 2). It can also indicate potential pressure from capital providers, whether the business is debt-financed and part of a group that upstreams dividends, a mutual, or 100%-equity funded.
3 Solvency ratio has become an increasing focus in insurers’ (business and general) communication, even though SFCRs do not systematically show solvency ratio as such. The volatility of solvency ratio will become increasingly visible and measurable as SFCRs are published over time.
Finland 1 Finland 2 Finland 3 Finland 4 Finland 5
Surplus (Own funds - SCR) SCR ratio Average SCR ratio
78 M€
3 M€4 M€ 12 M€ 7 M€
215%
274%
204%
124%
435%
164%
FIGURE 2: SOLVENCY COVERAGE RATIO AND SURPLUS - FINNISH INSURERS SAMPLE
Source: SCOR, company SFCRs, Solvency II Wire Data
VALUE FOR REINSURERS
1 Assumptions vary in the approach to diversification benefits – In the case of internal model insurers, this credit can some-times reach significant levels and indicate varying degrees of conservatism in a company’s Solvency Capital Requirement.
2 Can depend hugely on whether using a standard formula or an internal model, and how the internal model works.
3 Reinsurance (internal and external) is an efficient solution to maximize diversification, by lowering risk concentration and balancing risks.
Finland 1 Finland 2 Finland 3 Finland 4 Finland 5
Undiversified SCR Diversification benefit as % of
undiversified SCR
Sample average
31 M€ 16 M€6 M€ 18 M€ 8 M€
24.4%
24.2%36.2%
15.8%
24.5%
10.5%
FIGURE 3: DIVERSIFICATION BENEFIT AS % OF UNDIVERSIFIED SCR - FINNISH INSURERS SAMPLE
Source: SCOR, company SFCRs, Solvency II Wire Data

76 SCOR P&C - TECHNICAL NEWSLETTER #43 - APRIL 2018SCOR P&C - TECHNICAL NEWSLETTER #43 - APRIL 2018
VALUE FOR REINSURERS
1 Assumptions behind risk margin can vary significantly, the methodology used to assess it having been subject to much debate over the past few years.
2 Different risk margins can be explained by different tails in business, or differences in the maintenance of assumptions.
3 This is one of the key questions behind the ongoing revision process of the Standard Formula.
4 Although more relevant for Life business, the retrospective reinsurance solutions for Non-Life long tail business lead to an increase in eligible own funds via the risk margin reduction.
Incomeprotection
20%
18%
16%
14%
12%
10%
8%
6%
4%
2%
0%
Germany 1 0%
6.8%
10.5%
8%
6.4%
0%
15.3%
0%
15.5%
8.8%
0%
8.7%
26.5%
2.2%
7.7%
0%
4.8%
51%
0%
4.7%
29.5%
5%
63%
1.8%
4.4%
0%
14.2%
7.8%
10.1%
11%
0%
3.4%
0%
0%
2.7%
49.2%
8.6%
10.3%
7.3%
8.7%
Germany 2
Germany 3
Germany 4
Sample Average
Germany 1 Germany 2 Germany 3 Germany 4 Sample Average
Credit andsuretyship Total
Motor vehicleliability
Other motorinsurance
Marine, aviationand transport
Fire and otherdamage
to property
Generalliability
Additional graphs can be derived, focusing on insurers’ asset mix, the tiering of available capital, leverage and use of debt instruments, etc.
2. Operating performance
There is a general perception that, over time, the interests of reinsurers and insurers align, and should converge as both carriers share their fortunes. It is therefore key for reinsurers to fully understand the top line growth and profitability trends of their clients, whether at a business line or aggregate level.
The operating performance analysis that can be derived from public QRTs range from business mix analysis to under-writing performance and operational efficiency. Just as with balance sheet analysis, reinsurance underwriters should increase their financial skills to analyse this Profit & Loss Account data in a way that is useful to the underwriting process.
FIGURE 4: RISK MARGIN AS % OF NET BEST ESTIMATE - GERMAN INSURERS SAMPLE
Source: SCOR, company SFCRs, Solvency II Wire Data

98 SCOR P&C - TECHNICAL NEWSLETTER #43 - APRIL 2018SCOR P&C - TECHNICAL NEWSLETTER #43 - APRIL 2018
VALUE FOR REINSURERS
1 This is a (or even the) key indicator used to measure the quality of insurers’ underwriting, whether gross or net of reinsurance.
2 The main value of this data is to place an insurer within its peer group, based on a dataset that is both comparable and comprehensive for the market. The value will also increase over time as it develops into an historical series.
3 Line of Business analysis, gross of reinsurance, will provide some insights on the pricing approach of individual insurers and show market subsets by LoB in a very transparent way, highlighting potential opportunities or problematic sub-segments.
FIGURE 5: LOSS RATIO NET* - DANISH INSURERS SAMPLE
Incomeprotection
120%
100%
80%
60%
40%
20%
0%
Denmark 1 64.1%
55.8%
23.7%
32.2%
61.1%
76.7%
44%
38.2%
49.7%
71.5%
76.2%
50.7%
45%
62.4%
69.5%
68.7%
60.7%
40.4%
62.8%
65.5%
0%
92.9%
55.4%
10.7%
77.4%
70.8%
57.6%
40.1%
54.6%
66.8%
Denmark 2
Denmark 3
Denmark 4
Sample Average
Denmark 1 Denmark 2 Denmark 3 Denmark 4 Sample Average
Motor vehicleliability
Other motoinsurance
*Net claims incurred as percentage of net earned premiums
Fire and otherdamage to property
Generalliability
Total
Iceland 1 Iceland 2 Iceland 3
INCOME PROTECTION
Iceland 4
108.8%110.1%
108.8% 108.9%106.5%
108.5%
114.6%
0.7% 0.2% 2.4% 6.3%
122.6%
Iceland 1 Iceland 2 Iceland 3
MARINE, AVIATION & TRANSPORT
Iceland 4
25.3%28.2%
35.3%38.6%
43.3%
48.2%
22.2%
31.7% 13.1% 10.7% 20.9%
24%
Iceland 1 Iceland 2 Iceland 3
GENERAL LIABILITY
Iceland 4
203.2%241.4%
169.5% 177.2%
346.9%
221.7%
161.3%
14.6% 4.1% 4.1% 7.8%
165.7%
Iceland 1 Iceland 2 Iceland 3
FIRE & DAMAGE TO PROPERTY
Iceland 4
41.3%
32.1%
58.7%
30.2%34% 33%
27.8%
6.3% 8.9% 5.9% 6.5%
31%
Iceland 1 Iceland 2 Iceland 3
WORKER’S COMPENSATION
Iceland 4
258.5% 261.4%
207% 208.5%
222.6%228.9%
223.5%
1.1% 1.4% 2.7% 5%
226.4%
Iceland 1 Iceland 2 Iceland 3
MOTOR LIABILITY
Iceland 4
138.1% 139%
103.2% 103.4%
123.8% 123.7%120.9%
0.5% 0.3% 0.5% 1.2%
124%
GrossCession rate** Net
FIGURE 6: RESERVE RATIO* GROSS VERSUS NET OF REINSURANCE - ICELANDIC INSURERS SAMPLE
Source: SCOR, company SFCRs, Solvency II Wire Data

98 SCOR P&C - TECHNICAL NEWSLETTER #43 - APRIL 2018SCOR P&C - TECHNICAL NEWSLETTER #43 - APRIL 2018
VALUE FOR REINSURERS
1 Loss ratios must be analyzed in conjunction with reserve ratios, as a proxy for reserve adequacy.
2 One of the key qualities of an insurer is to have a prudent and consistent reserving philosophy. The data available for a comprehensive analysis is unfortunately limited (with the exception of Reinsurance groups and a handful of primary players).
3 SFCRs are not comprehensive enough, but the information included on reserves can once again support the discussion with insurers – focusing on the extremes of the reserve ratios and risk margins by line of business and by company.
VALUE FOR REINSURERS
1 Costs here are all inclusive: admin costs, brokerage, net of reinsurance. Insurers have to make some assumptions on how they allocate admin costs by business line, which creates comparability issues.
2 Who’s best on costs? Expense ratios provided in standard reporting often have slightly different definitions and are hard
to compare unless we can adjust for the country mix and therefore market structure. SFCRs are useful in this respect.
3 Cost ratio is a key element of an insurer’s efficiency, and of its ability over time to deliver value-adding products to clients while achieving attractive returns. A lean cost structure can be a significant advantage in a tight underwriting market.
FIGURE 7: COST RATIO NET* OF REINSURANCE - DANISH INSURERS SAMPLE
Incomeprotection
50%
45%
40%
35%
30%
25%
20%
15%
10%
5%
0%
Denmark 1 0%
17.3%
21%
23.5%
3.8%
14.5%
5.8%
27.5%
20.4%
14.7%
0%
7.6%
33.7%
26.5%
5.2%
3.9%
9.6%
28.1%
11.1%
7.7%
0%
18.7%
38.2%
34.7%
28%
4.5%
10%
29%
55.6%
7.9%
Denmark 2
Denmark 3
Denmark 4
Sample Average
Denmark 1 Denmark 2 Denmark 3 Denmark 4 Sample Average
Motor vehicleliability
Other motoinsurance
Fire and otherdamage to property
Generalliability
Total
*Expenses incurred as percentage of net earned premiums
Iceland 1 Iceland 2 Iceland 3
INCOME PROTECTION
Iceland 4
108.8%110.1%
108.8% 108.9%106.5%
108.5%
114.6%
0.7% 0.2% 2.4% 6.3%
122.6%
Iceland 1 Iceland 2 Iceland 3
MARINE, AVIATION & TRANSPORT
Iceland 4
25.3%28.2%
35.3%38.6%
43.3%
48.2%
22.2%
31.7% 13.1% 10.7% 20.9%
24%
Iceland 1 Iceland 2 Iceland 3
GENERAL LIABILITY
Iceland 4
203.2%241.4%
169.5% 177.2%
346.9%
221.7%
161.3%
14.6% 4.1% 4.1% 7.8%
165.7%
Iceland 1 Iceland 2 Iceland 3
FIRE & DAMAGE TO PROPERTY
Iceland 4
41.3%
32.1%
58.7%
30.2%34% 33%
27.8%
6.3% 8.9% 5.9% 6.5%
31%
Iceland 1 Iceland 2 Iceland 3
WORKER’S COMPENSATION
Iceland 4
258.5% 261.4%
207% 208.5%
222.6%228.9%
223.5%
1.1% 1.4% 2.7% 5%
226.4%
Iceland 1 Iceland 2 Iceland 3
MOTOR LIABILITY
Iceland 4
138.1% 139%
103.2% 103.4%
123.8% 123.7%120.9%
0.5% 0.3% 0.5% 1.2%
124%
GrossCession rate** Net
FIGURE 6: RESERVE RATIO* GROSS VERSUS NET OF REINSURANCE - ICELANDIC INSURERS SAMPLE
*Claims provisions as percentage of earned premiums **Cession rate defined as premiums ceded/gross premiums
Source: SCOR, company SFCRs, Solvency II Wire Data
Source: SCOR, company SFCRs, Solvency II Wire Data
1110 SCOR P&C - TECHNICAL NEWSLETTER #43 - APRIL 2018SCOR P&C - TECHNICAL NEWSLETTER #43 - APRIL 2018
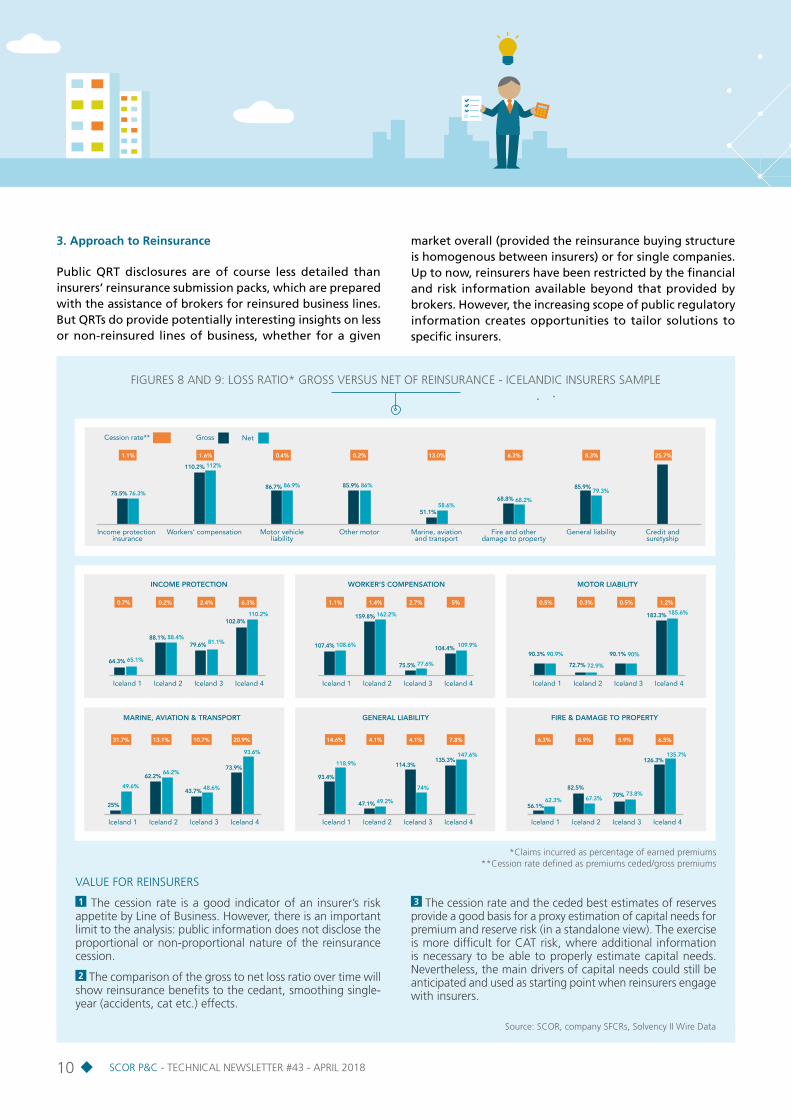
3. Approach to Reinsurance
Public QRT disclosures are of course less detailed than insurers’ reinsurance submission packs, which are prepared with the assistance of brokers for reinsured business lines. But QRTs do provide potentially interesting insights on less or non-reinsured lines of business, whether for a given
market overall (provided the reinsurance buying structure is homogenous between insurers) or for single companies. Up to now, reinsurers have been restricted by the financial and risk information available beyond that provided by brokers. However, the increasing scope of public regulatory information creates opportunities to tailor solutions to specific insurers.
VALUE FOR REINSURERS
1 The cession rate is a good indicator of an insurer’s risk appetite by Line of Business. However, there is an important limit to the analysis: public information does not disclose the proportional or non-proportional nature of the reinsurance cession.
2 The comparison of the gross to net loss ratio over time will show reinsurance benefits to the cedant, smoothing single-year (accidents, cat etc.) effects.
3 The cession rate and the ceded best estimates of reserves provide a good basis for a proxy estimation of capital needs for premium and reserve risk (in a standalone view). The exercise is more difficult for CAT risk, where additional information is necessary to be able to properly estimate capital needs. Nevertheless, the main drivers of capital needs could still be anticipated and used as starting point when reinsurers engage with insurers.
FIGURES 8 AND 9: LOSS RATIO* GROSS VERSUS NET OF REINSURANCE - ICELANDIC INSURERS SAMPLE
Iceland 1 Iceland 2 Iceland 3
INCOME PROTECTION
Iceland 4
64.3% 65.1%
88.1% 88.4%79.6% 81.1%
102.8%
0.7% 0.2% 2.4% 6.3%
110.2%
Iceland 1 Iceland 2 Iceland 3
MARINE, AVIATION & TRANSPORT
Iceland 4
25%
49.6%
62.2%66.2%
43.7% 48.6%
73.9%
31.7% 13.1% 10.7% 20.9%
93.6%
Iceland 1 Iceland 2 Iceland 3
GENERAL LIABILITY
Iceland 4
93.4%
118.9%
47.1% 49.2%
114.3%
74%
135.3%
14.6% 4.1% 4.1% 7.8%
147.6%
Iceland 1 Iceland 2 Iceland 3
FIRE & DAMAGE TO PROPERTY
Iceland 4
56.1%62.3%
82.5%
67.3% 70% 73.8%
126.3%
6.3% 8.9% 5.9% 6.5%
135.7%
Iceland 1 Iceland 2 Iceland 3
WORKER’S COMPENSATION
Iceland 4
107.4% 108.6%
159.8% 162.2%
75.5% 77.6%
104.4%
1.1% 1.4% 2.7% 5%
109.9%
Iceland 1 Iceland 2 Iceland 3
MOTOR LIABILITY
Iceland 4
90.3% 90.9%
72.7% 72.9%
90.1% 90%
183.3%
0.5% 0.3% 0.5% 1.2%
185.6%
51.1%58.6%
85.9% 86%86.7% 86.9%
110.2% 112%
75.5% 76.3%68.8% 68.2%
85.9%79.3%
Income protection insurance
Motor vehicleliability
Workers’ compensation Other motor Marine, aviation and transport
1.1% 1.6% 0.4% 0.2%
Fire and other damage to property
General liability Credit and suretyship
13.0% 6.3% 8.3% 25.7%
GrossCession rate** Net
*Claims incurred as percentage of earned premiums **Cession rate defined as premiums ceded/gross premiums
Source: SCOR, company SFCRs, Solvency II Wire Data

1110 SCOR P&C - TECHNICAL NEWSLETTER #43 - APRIL 2018SCOR P&C - TECHNICAL NEWSLETTER #43 - APRIL 2018
CONCLUSION
DEVELOPING TOOLS TO BETTER UNDERSTAND CLIENT NEEDS AND DELIVER TAILOR‑MADE REINSURANCE SOLUTIONS
As regulatory pressure continues, it will become increasingly important for reinsurance underwriters to combine financial and underwriting skills, in order to prepare better for the future of the (re)insurance industry and the needs of their clients.
To support and assist our clients as effectively as possible, we have been developing a number of tools that allow us to make the best use of the available information in QRTs, and to model the impact of reinsurance solutions on the Solvency Capital Requirement of insurers:
IFRS 17 is looming in the medium term and will only increase the necessity for (re)insurance professionals to fully understand how accounting interacts with value and cash. The paradox being that, however complex regulation and accounting make the (re)insurance industry, investors in this space remain attracted by very tangible and simple features: its resilience and its ability to produce stable cash flows, often in the form of steady dividends.
Anticipating the greater transparency imposed by Pillar III of Solvency II, in order to know our clients better and identify their needs
SCOR Tool #1“Publication of Quantitative Reporting Templates”
� Tool #1 summarizes the information that all insurance companies in Europe have published starting with the end of May (for Solo entities) and June 2017 (for Groups)…
�…in order to extract economic indicators relevant to reinsurance underwriting
Supporting and assisting clients in the management and optimization of their capital, by modelling the impact of reinsurance solutions on the Solvency Capital Requirement under the standard formula
SCOR Tool #2“Optimization of Solvency Capital Requirement”
� Tool #2 models the impacts/advantages of reinsurance on capital needs in a simple way…
�…in order to gauge the optimal reinsurance structure under the standard formula
12SCOR P&C - TECHNICAL NEWSLETTER #43 - APRIL 2018
PLEASE FEEL FREE TO VISIT US AT SCOR.COM
SCOR P&C5, avenue Kléber - 75795 Paris Cedex 16 [email protected]
TO GET THE FULL RANGE OF TECHNICAL NEWSLETTERS, PLEASE CONTACT [email protected]
Editor: SCOR P&C Strategy & Development ISSN: 1967-2136
No part of this publication may be reproduced in any form without the prior permission of the publisher. SCOR has made all reasonable efforts to ensure that information provided through its publications is accurate at the time of inclusion and accepts no liability for inaccuracies or omissions.
© April 2018 - Design and production: Periscope
VINCENT FOUCARTChief Underwriting Officer
You can also contact our SCOR Alternative Solutions experts
Eric Le Mercier - Deputy CUO, Asia Pacific,
Western Europe [email protected]
Jacky Mochel - Head of Advisory and Modelling [email protected]
Martin Hanek - Specialty Lines [email protected]
Ross Paltridge - Americas, UK & Ireland [email protected]
Thomas Renggli - Nordic, Central & Eastern Europe,
Middle East and Africa [email protected]
James Donald - Head of Captive Solutions [email protected]
SCOR Alternative Solutions offers tailor-made solutions covering financial optimization and capital management matters, specific situations and major events related issues, emerging and non-covered risk solutions. It provides SCOR clients with a dedicated execution capacity based on semi-traditional, non-traditional and ILS solutions. SCOR Alternative Solutions is constantly adapting to market shifts matching the growing sophistication and composite nature of reinsurance program rationale and the increased diversification of capacity sources.
LAURENT ROUSSEAUDeputy Chief Executive Officer of SCOR Global P&C
This article is written by : For more information, please contact our team
Europe, Middle East & Africa P&C Treaties
Doug Lacoss - Chief Underwriting Officer P&C Treaties
Europe, Middle East and Africa [email protected]
Caren Büning - Germany [email protected]
Anne-Marie Cical - France, BeLux, Iberia, Italy [email protected]
Fabrice de Dianous - Austria, Switzerland, Central
& Eastern Europe [email protected]
Hedi Hachicha - Africa, Near & Middle East [email protected]
Peter Koefod - Nordics & Netherlands [email protected]
Joanne Woodcock - UK & Ireland [email protected]