YEAR BOOK - pitac.gov.pk · for M/s Millat Equipment Limited and M/s Millat Tractors (Pvt) Ltd ...
Upload
dangnguyetCategory
view
217download
2
InterMarket Perspective
To find our Research on Bloomberg, please type -IMKP <GO> www.jamapunji.pk
Research Entity Number – REP‐085
Analyst certification and required disclosures begin on page 23 & 24
05 September 2016
Muneeb Naseem [email protected] +92‐21‐37131600 Ext. 305
On the cusp of a sales turnaround amid agri‐upswing; OW
Pakistan Tractors
Price (PkR)
TP (PkR) Return P/E (x)‐
17F DY (%)17F
MTL 556.77 626 22.2% 10.24 9.8%
AGTL 429.62 448 13.7% 10.64 9.4%
Source: IMS Research
MTL Estimates
Key Ratios FY16F FY17F FY18F FY19F
EPS (PkR) 38.52 54.36 61.37 66.73
DPS (PkR) 40.0 54.0 61.0 60.0
AGTL Estimates
Key Ratios CY16F CY17F CY18F CY19F
EPS (PkR) 32.63 40.36 45.77 49.24
DPS (PkR) 50.0 40.0 46.0 49.0 Source: IMS Research
Pakistan Tractors vs. KSE100 Index
‐15%
‐5%
5%
15%
25%
Jan‐16
Jan‐16
Feb‐16
Mar‐16
Mar‐16
Apr‐16
May‐16
May‐16
Jun‐16
Jul‐1
6
Jul‐1
6
Aug‐16
KSE100 Index IMS Tractors Universe
Source: IMS Research
• We initiate coverage on the Pakistan Tractors space with an Overweight stance; we have a Buy rating on Millat Tractors (MTL; TP PkR626/sh) and are Neutral on Al Ghazi Tractors (AGTL; TP PkR448/sh). These two companies practically encapsulate the entire domestic market (70k unit pa. industry at peak); a number which truly stands out given there are over twenty tractor manufacturers in India (500k unit pa. market).
• The Pakistan Tractor industry has endured tough times in the last 5yrs on weak Agriculture growth (FY16: ‐0.2%) and an unstable taxation regime. We now see a marked turnaround in fortunes on pickup in farmer incomes and favorable GoP policies ahead of 2018 elections (e.g. recent GST reduction on Tractors), which can accelerate mechanization (1.4hp/ha in Pakistan vs. 2.4xhp/ha in India).
• With incumbents expected to retain near‐monopolistic pricing power, EBITDA margins should stay elevated over the medium‐term (MTL: 15%, AGTL: 22%). This means demand is the primary growth driver where we see 3yr sales/profit CAGR of c.20%. This blend of growth and dividends (D/Y: 9%) can unlock further price performance.
Demand expected to grow at pre‐2010 rate We expect demand for tractors to mimic the pre‐2010 path; tractor unit sales recorded a 13% CAGR across FY04‐FY10 and we expect similar growth to repeat over the next 3yrs. Immediate‐term impetus is likely to arise from recent halving of GST on tractors to 5% (lowest since 2012); resulting in unit price reduction of US$400‐US$800, material compared to Pakistan’s per capita income of US$1,600. At the same time, the trend of depressed farmer incomes over the last 4‐5yrs – due to falling commodity prices and rising input costs (urea prices rose at a 12% CAGR) – is now beginning to reverse. This is due to stabilization in crop prices and GoP policies where relief packages worth US$4.5bn, incorporating lower fertilizer prices and cash rebates etc., were announced last year. We believe the GoP will continue to pursue farmer friendly policies ahead of 2018 elections, and prospects for new subsidized tractor schemes are very much on the table.
Stable margins will persist Tractor industry margins have remained stable over time on the back of strong pricing power, high degree of localization and low sensitivity to metal prices; EBITDA margins have averaged 15% for MTL and 22% for AGTL over the last 5yrs with little volatility. Lack of competition gives these tractor companies immense pricing power – average annual price increase is 7‐10%, similar to the long‐term inflation trend in Pakistan. We believe that industry dynamics are expected to remain in equilibrium, supporting strong margins over the medium to longer run.
Valuations – MTL can rerate, AGTL not so much MTL (FY17F EPS: PkR54.36; up 41%YoY) trades at a forward P/E of 10.25x and P/S of 1.03x, similar to its mean multiples over the last 5yrs. Our target price of PkR626/sh offers a 1yr total return of 22.2%. On the flipside, AGTL (CY17F EPS: PkR40.36; up 24%YoY) trades at a CY17F P/E of 10.7x and P/S of 1.8x where the latter is already close to +1sd above mean. We are Neutral on AGTL with a target price of PkR448/sh.
Risks to our thesis (i) Adverse change in GST regime, (ii) Decline in commodity prices (iii) Any major crop failure, and (iv) New competitors penetrating quicker than expected.

2 | P a g e
Perspective
Unit sales to grow at 13% CAGR in next 3yrs
5,00010,00015,00020,00025,00030,00035,00040,00045,000
2005
2006
2007
2008
2009
2010
2011
2012
2013
2014
2015
2016
2017
F
2018
F
2019
F
AGTL Sales MTL Sales
Source: Company Reports, PAMA
Margins are high and expected to sustain
10%
15%
20%
25%
30%
2010
2011
2012
2013
2014
2015
2016
2017
F
2018
F
2019
F
EBITDA Margin MTL GP Margin MTLGP Margin AGTL EBITDA Margin AGTL
Source: Company Reports
GoP has taken steps to reduce fertilizer prices…
0
500
1000
1500
2000
0500
1,0001,5002,0002,5003,0003,5004,0004,500
2002
2003
2004
2005
2006
2007
2008
2009
2010
2011
2012
2013
2014
2015
2016
DAP Prices Urea Prices ‐Rhs
Source: Economic Survey of Pakistan
…as crop Prices were on the decline in the last 5 years
0
100
200
300
400
500
600
0
2,000
4,000
6,000
8,000
10,000
2003
2004
2005
2006
2007
2008
2009
2010
2011
2012
2013
2014
2015
Cotton Prices(local)(PKR/Maund) Rice($/tonne)‐Rhs
Source: USDA, KCAPK
Tractors offer a blend of growth and defensive attributes
‐
4.0
8.0
12.0
16.0
20.0
Jan‐11
Jul‐1
1
Jan‐12
Jul‐1
2
Jan‐13
Jul‐1
3
Jan‐14
Jul‐1
4
Jan‐15
Aug‐15
Feb‐16
Aug‐16
PER (x)
AGTL MTL KSE100 Index
Source: IMS Research
IMS tractor universe has very high payout ratios
0%
50%
100%
150%
200%
250%
300%
350%
2009
2010
2011
2012
2013
2014
2015
2016
2017
F
2018
F
2019
F
AGTL Payout MTL Payout
Source: Company Reports

3 | P a g e
Perspective
MF 455‐100 HP launched to counter imported Belarus Tractors
Source: Company Website
Millat Rice puddler‐ non‐tractor sales are 3% of total
Source: Company Website
New Holland 480s‐ 55HP
Source: Company Website
MTL manufactures under license from Anhui Forklift Group
Source: Company Website
Many of the agriculture processes in Pakistan are still manual
Source: IMS Research
About 20% of the Tractor demand comes from haulage
Source: IMS Research

4 | P a g e
Perspective
Investment Thesis • The tractor industry is in the midst of a turnaround on improving farmer economics amidst stabilization in crop prices and relief
packages worth US$4.5bn (lower GST on tractors, lower fertilizer/pesticide prices, direct cash rebates etc). We see industry unit sales growing 23%YoY to 42,500 units in FY17 and by a 13% CAGR over the next 3yrs. Positive surprises are possible – peak unit sales occurred in FY10 (70k units).
• Favorable GoP policies are likely to persist in the run up to 2018 elections; on the tractors front, we see no change to the GST regime and see possibility of new provincial subsidized tractor schemes (these can potentially increase our base‐case 3yr sales estimates by 12%).
• Longer term growth drivers are still intact – Pakistan’s mechanization levels are low (1.4hp/ha vs. 2.4hp/ha for India) while crop yields are also on the lower side. According to the FAO, just 40% of landowners with 20ha or more own tractors. Considering average farmer has 2ha, the untapped market for tractors is sizable.
• Margins have remained stable over the last 5yrs; given demand uptick and near‐monopolistic pricing power, we expect margins to sustain over the medium‐term. This earmarks demand, expected to enter a sweet spot, as the key earnings driver for Pakistan tractors. The IMS Tractors Universe is projected to post 3yr sales/profit CAGR of c. 20%
• The Pakistan Tractor space offers a blend of high growth (2017 – MTL: up 41%YoY; AGTL: up 24%YoY) and dividend yield (c. 9%). This blend of high growth and yields can potentially unlock further price performance, in our view.
We prefer MTL over AGTL
Swift rebound in sales/earnings is expected for both MTL and AGTL. However, we prefer the former due to:
• A more diversified revenue mix: MTL has a small but growing sales of agriculture implements and forklifts which currently constitute 3% of revenues.
• Leadership position amidst better customer perception and brand loyalty gives it a market share of61% vs. 39% for AGTL.
• Global reach and huge potential for exports in Middle East and Africa as a result of recent agreement with AGCO Corporation (its parent company).
• Backward Integration with group holdings in Bolan Castings Ltd (BCL), Millat Equipment Ltd. and Millat Industrial Products Ltd, which account for about 30% of total input cost.
• More attractive valuations ‐ MTL trades at a forward P/E of 10.25x and P/S of 1.0x, similar to its mean multiples over the last 5yrs. AGTL trades at a CY17F P/E of 10.7x and P/S of 1.8x where the latter is already close to +1sd. above mean. Both MTL and AGTL offer 3yr profit CAGR of c. 20%.
MTL: Revenue Breakup (PkRmn)
0
5,000
10,000
15,000
20,000
25,000
30,000
FY08 FY09 FY10 FY11 FY12 FY13 FY14 FY15
Tractor Non‐TractorS
ource: Company Reports
Market Shares
39%
61%
2016
AGTL MTL
Source: Company Reports

5 | P a g e
Perspective Demand expected to grow at pre‐2010 rate We expect demand for tractors to take pre‐2010 path – unit sales to grow at 13%pa over next 3yrs – since retardants such as (i) low farmer incomes and (ii) unfavorable government policies have subsided. Farmer purchasing power remained depressed over the last 4‐5 years in the midst of consistently falling commodity prices and rising input costs (urea prices rose at 12% CAGR in last 5yrs). With changing global agricultural dynamics, prices of major crops are expected to stabilize and gradually increase in the medium term. This, coupled with GoP relief programs (worth US$4.5bn announced so far), are expected to alleviate farmer economics. A more favorable policy tilt is underpinned by the recent halving of GST on tractors to 5%, which is expected to provide immediate‐term impetus to demand. Long‐term demand drivers such as low mechanization levels remain in place.
Lower GST can trigger immediate‐term liftoff! The Pakistan tractor industry saw a golden era of sales growth in the pre‐GST period from 2002‐10, wherein unit sales grew by a 15% CAGR, peaking at 70,646 units in FY10. However, a 17% GST on tractors was introduced in Mar’11; which, coupled with frequent changes in the applicable rate, resulted in uncertainty for farmers and consequently a drastic drop in sales with FY16 sales registering at just 34,612 units.
Within this backdrop, we think the reduction in GST on tractors from 10% to 5% in the Federal Budget 2016‐17 is expected to give immediate respite to the industry. Tractor sales aggregated to 215k units over FY12‐FY16 vs. 308k units over the previous 5yrs, a sharp 30% decline which we largely attribute to frequent GST changes since the product is highly price elastic with customers mostly being low income farmers (93% of farmers own less than 12.5 acres land). In 2011, the imposition of GST changed the market price of a 55 HP tractor by PkR80,000(US$ 900)and for the 85HP variant by about PkR150,000(US$ 1600). This is material given per capita income in Pakistan is US$1,600.
Precedence indicates how transformative the recent GST reduction can be; MTL and AGTL together sold39,539 tractors in the 6m after GST was reduced from 16% to 5% back in Feb’12, up from aggregate sales of a paltry 11,998 units in the preceding 6m before the GST reduction. Although Jul’16 tractor sales of 1,441 units were almost half the monthly run rate in FY16, we believe a marked pickup in volumes is around the corner (July is typically a weak month for tractor sales because of sowing season).
Importantly, in contrast to frequent changes over the previous 5yrs, we believe this reduced 5% GST rate will remain unchanged at least until 2018 elections due to a large vote bank in the rural areas (65% of the population lives in rural areas). As a result, we expect medium‐term demand to mimic the smooth growth trajectory witnessed across 2002‐2010; we expect tractor sales to reach close to 60k units in FY21F.
About 40,000 tractors were sold in the 6m after GST was reduced from 16% to 5% back in Feb’12. Sales totaled just 12,000 units in the preceding 6m before the GST reduction.
Industry unit sales
0
20,000
40,000
60,000
2014
2015
2016
2017
F
2018
F
2019
F
Tractor Sales
Source: PAMA
GST Regime for Tractors Date Rate
Before Mar' 11 0%
Mar' 11 17%
Jun'11 16%
Feb'12 5%
Jan'13 10%
Jan'14 17%
Jun'14 10%
Jun'16 5% Source: Company Reports, IMS Resarch
Monthly unit sales vs. GST changes
‐
2,000
4,000
6,000
8,000
10,000
Jan‐11
Apr‐1
1
Jul‐1
1
Oct‐1
1
Jan‐12
Apr‐1
2
Jul‐1
2
Oct‐1
2
Jan‐13
Apr‐1
3
Jul‐1
3
Oct‐1
3
Jan‐14
Apr‐1
4
Jul‐1
4
Oct‐1
4
Jan‐15
Apr‐1
5
Jul‐1
5
Oct‐1
5
Jan‐16
Apr‐1
6
Tractor Sales
GST= 5%GST= 17% GST= 10%GST= 10% GST=5%
Source: PAMA, IMS Research

6 | P a g e
Perspective
Subsidized tractor schemes remain on the cards The Punjab and Sindh provincial governments have from time to time announced subsidized tractor schemes in the past, particularly close to elections e.g. the PML‐N government announced the Green Tractor Scheme in 2012, just ahead of the 2013 general elections which helped bring it into power in the Center. In the past decade, such schemes were announced with a gap of 2‐3yrs.
While the recent announced provincial tractor schemes (FY15 budget of Punjab and Sindh) failed to be implemented, we believe there is a good chance that similar schemes will be announced and executed ahead of the 2018 elections. While we have not built this into our base‐case, our aggregate FY17/18F sales assumption of 42,500/46,600 units could potentially rise to 47,500/51,500 units, an increase of 12%.
Government opens up its treasury Farmer income came under pressure in the last few years, prompting the PML‐N government to provide relief packages. A large PkR341bn (US$3.4bn) Kissan Package was announced by the Prime Minister in Nov’15 followed by a PkR100bn (US$1bn) package by the Chief Minister Punjab in May’16.Further such relief packages are possible in the run up to 2018 elections.
Prime Minister Kissan Package: Salient features • Direct Cash support to small farmers for PkR40bn. • Subsidy on local and imported fertilizer. • Concession on electricity tariff of agricultural tube‐wells. • Reduction in cost of credit by 2%.
Chief Minister Punjab Kissan Package: Salient features • Fertilizer subsidy worth PkR11.6bn. • Interest free credit worth PkR17.7bn. • Cotton seed reform project. • Warehouse receipt financing system. • Measures to promote high‐value agriculture. • Establishment of high‐tech mechanization service centers.
While implementation risk remains (courts initially challenged the timing of such schemes), we believe even partial implementation of these projects would push the agriculture linked economy into growth phase. We also flag our liking of possible structural changes to the agriculture sector; high‐value agriculture and high‐tech mechanization are acutely needed to improve the yield of wheat and cotton (measures taken in Kissan Package reportedly may increase yields by 17% and 47%, respectively).
Federal Budget 2017 was notable for its pro‐agri stance The FY17 Budget continued the GoP’s pro‐agriculture tilt with measures to reduce input costs. Specifically, these included:
• PkR400/bag reduction in urea prices to PkR1,400/bag.
• Extension of PkR300/bag cut in DAP prices to PkR2,500/bag.
• Reduction in GST on tractors to 10% from 5% earlier.
• 2% reduction in agri‐credit loan financing rates; agr‐credit target of PkR700bn.
• Withdrawal in duties on pesticides.
• Concessionary tariffs for tube wells (tariff reduced by PkR3.5/kWh).
• Concessionary tariffs on import of livestock/dairy machinery.
• Tax exemption on cold storage chain.
Subsidized tractor schemes – possible ahead of 2018 elections – can increase our base‐case FY17/18F unit sales assumptions by a further 12%.
Farmer relief packages worth US$4.5bn have already been announced.

7 | P a g e
Perspective
At the average farmer level (2 hectares), we estimate that measures introduced in the FY17 Budget, together with the current support prices for wheat and international prices for cotton and rice, can boost net income in the 10%‐15% range for a farmer only cultivating wheat and rice.
Farmer incomes took a hit in FY13‐15… Farmer income is a major driver of tractor sales; it is no coincidence that as farmer incomes came under pressure from both the revenue and costs side during the last 3‐5 years, tractor sales also suffered. Major pressure points over the last few years included:
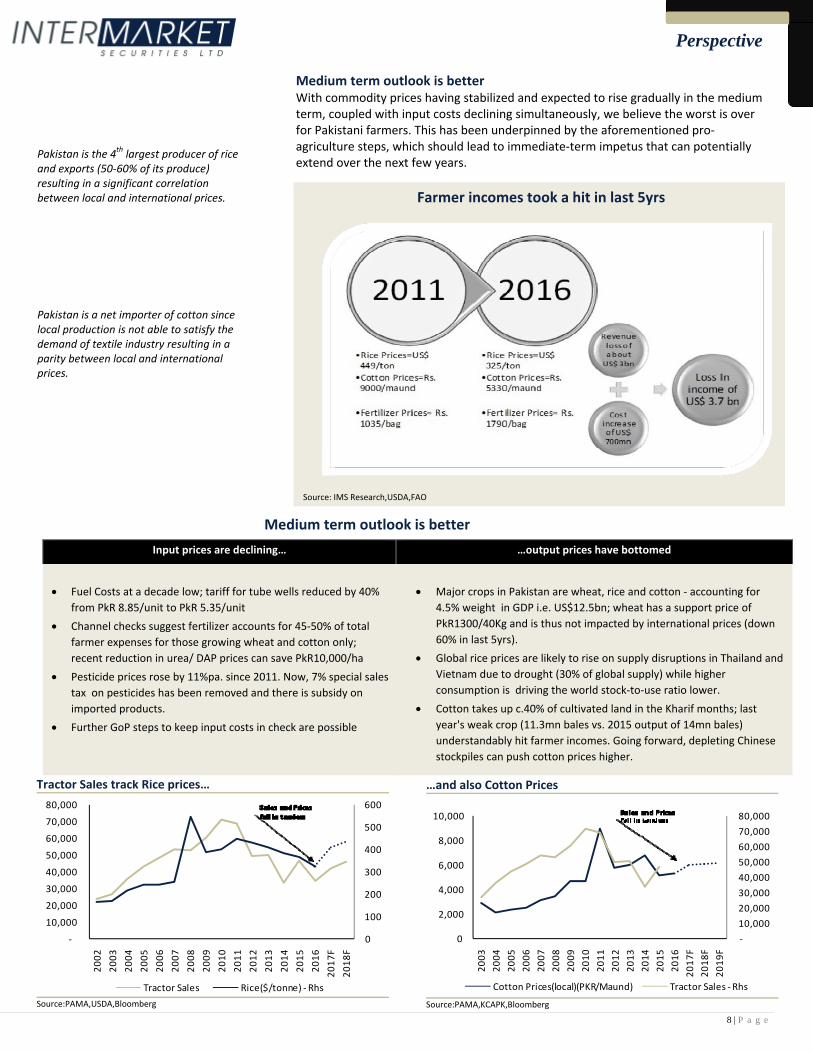
• Quoted price of Pakistani rice in the international market declined to a 9yr low of US$325/ton(down almost 30% since 2011);
• Cotton prices in the local market nosedived to PkR5,219/maund in the local market vs. PkR9,000/maund in 2011; and
• Urea/DAP retail prices peaked at PkR1,790/PkR2,800 per 50kg bag.
Income Statement‐Sample farmer (2 ha) comparison before and after budget Yield(Kg/ha) Price/40 Kg Revenue Bf. Budget Aft. Budget Bf. Budget Aft. Budget
Wheat 2,700 1,300 1,300 175,500 175,500 Rice 2,400 1,100 1,100 150,000 150,000 Total Revenue 307,500 307,500
Requirement(Kg/ha) Price/50 Kg Cost Bf. Budget Aft. Budget Bf. Budget Aft. Budget Urea 396 1,790 1,400 28,354 22,176 DAP 357 2,800 2,500 39,384 35,700 Rice Seed 12 20,000 20,000 9,600 9,600 Wheat Seed 120 2,200 2,200 10,560 10,560 Disel 20,300 20,300 Electricity 16,000 8,000 Other Costs 20,000 20,000 Total Cost 144,798 126,336 Profit/(Loss) 162,702 181,164 Source: IMS Research
Fertilizer Prices (PkR/bag)
0
500
1000
1500
2000
0500
1,0001,5002,0002,5003,0003,5004,0004,500
2002
2003
2004
2005
2006
2007
2008
2009
2010
2011
2012
2013
2014
2015
2016
DAP Prices Urea Prices ‐Rhs
Source: Economic survey of Pakistan
Decline in Urea, DAP and electricity costs increase an average farmers farm income by 13% .
8 | P a g e
Perspective
Medium term outlook is better With commodity prices having stabilized and expected to rise gradually in the medium term, coupled with input costs declining simultaneously, we believe the worst is over for Pakistani farmers. This has been underpinned by the aforementioned pro‐agriculture steps, which should lead to immediate‐term impetus that can potentially extend over the next few years.
Medium term outlook is better
Farmer incomes took a hit in last 5yrs
Source: IMS Research,USDA,FAO
Tractor Sales track Rice prices…
0
100
200
300
400
500
600
‐
10,000
20,000
30,000
40,000
50,000
60,000
70,000
80,000
2002
2003
2004
2005
2006
2007
2008
2009
2010
2011
2012
2013
2014
2015
2016
2017
F20
18F
Tractor Sales Rice($/tonne) ‐Rhs
Source:PAMA,USDA,Bloomberg
…and also Cotton Prices
‐10,000 20,000 30,000 40,000 50,000 60,000 70,000 80,000
0
2,000
4,000
6,000
8,000
10,000
2003
2004
2005
2006
2007
2008
2009
2010
2011
2012
2013
2014
2015
2016
2017
F20
18F
2019
F
Cotton Prices(local)(PKR/Maund) Tractor Sales ‐Rhs
Source:PAMA,KCAPK,Bloomberg
Pakistan is the 4th largest producer of rice and exports (50‐60% of its produce) resulting in a significant correlation between local and international prices.
Pakistan is a net importer of cotton since local production is not able to satisfy the demand of textile industry resulting in a parity between local and international prices.
Input prices are declining… …output prices have bottomed
• Fuel Costs at a decade low; tariff for tube wells reduced by 40%
from PkR 8.85/unit to PkR 5.35/unit • Channel checks suggest fertilizer accounts for 45‐50% of total
farmer expenses for those growing wheat and cotton only; recent reduction in urea/ DAP prices can save PkR10,000/ha
• Pesticide prices rose by 11%pa. since 2011. Now, 7% special sales tax on pesticides has been removed and there is subsidy on imported products.
• Further GoP steps to keep input costs in check are possible
• Major crops in Pakistan are wheat, rice and cotton ‐ accounting for
4.5% weight in GDP i.e. US$12.5bn; wheat has a support price of PkR1300/40Kg and is thus not impacted by international prices (down 60% in last 5yrs).
• Global rice prices are likely to rise on supply disruptions in Thailand and Vietnam due to drought (30% of global supply) while higher consumption is driving the world stock‐to‐use ratio lower.
• Cotton takes up c.40% of cultivated land in the Kharif months; last year's weak crop (11.3mn bales vs. 2015 output of 14mn bales) understandably hit farmer incomes. Going forward, depleting Chinese stockpiles can push cotton prices higher.

9 | P a g e
Perspective
Long‐term demand drivers are in place We see immediate‐term impetus to tractor demand arising from GST reduction and favorable government policies, while medium‐term drivers include anticipated improvement in farmer incomes. We are also positive on longer term tractor demand given Pakistan’s low farm mechanization levels as well as burgeoning use of tractors for diversified purposes e.g. haulage.
Low level of Mechanization provides ample room for output growth: Pakistan is one of the least agriculturally mechanized countries, which is the primary reason it lags behind in terms of yield for most crops, most notably Rice and Sugar Cane. Specifically, in Pakistan the horse power (HP) of tractors available per hectare currently stands at 1.4, significantly lower than China (4.1hp/ha) and Japan (7hp/ha), while India is also much better (2.4hp/ha).
Although Pakistan’s HP available per hectare has reached the FAO prescribed standard for mechanization, we still lag far behind the global players and there is still a lot of room for mechanization; much of Rice and Sugar Cane cultivation is done without the use of modern equipment. Estimates suggest that Pakistan still needs 800,000 to 1mn more tractors to reach the level of mechanization India has achieved. Present tractor population is estimated to be 700,000 only (28 per 1000 hectares).
Even in terms of the processes, Pakistani farm practices are still largely manual and involve minimal use of the advanced machinery and equipment prevalent in competing countries like India and China. With rising domestic consumption for grains, mechanization in agricultural sector is inevitable and tractor comes first in the queue to enable it, in our view. That is because, (i) tractors are already available in Pakistan, (ii) and farmers are aware of its usage and utility. In contrast, in the case of specialized seeds and biotechnology – for which suppliers are rare, demand is primitive and extensive training may be required –the initial gains may be modest, in our view.
Crop Process Mechanization
Land Preperation Sowing Spraying Harvesting Threshing
Crop Yield Comparison Pakistan India Global
Average Cotton Semi Full Full Nil ‐ Rice 2.40 2.37 4.30 Rice Full Nil Nil Semi Semi Wheat 2.70 3.14 2.90 Wheat Semi Low Low Semi Full Cotton 0.81 0.49 0.86 Sugar Cane Semi Semi Nil Nil ‐ Maize 4.20 2.47 4.90 Maize Full Semi Nil Low Full Sugar Cane 55.00 70.00 70.50
Improving incomes can expand target market by 1mn tractors! Pakistan’s current agricultural land comprises mostly of small sized farms (less than 2 ha) and average farm size is decreasing. With slowly growing yields, land holding becomes a major determinant to customer affordability. Our analysis suggests that improvement in farmer income coupled with improved credit availability (FY17 target of PkR 700bn) and GoP reforms (similar to India, which recently announced setting up virtual exchange for farmers and 980 agricultural machinery banks) will expand the tractor market size by 1mn as 2‐3 ha segment (only 11% of the 1.12 mn farms own tractors) would be able to afford the products.
Mechanization Comparison (HP/ha) of land
0.01.02.03.04.05.06.07.08.0
Japan
S. Korea
China
Philipines
India
Thailand
Iran
Pakistan
Indonesia
Vietnam
Source: FAO,IMS Research

10 | P a g e
Perspective
Construction industry can also catalyze sales growth Tractor usage for the purpose of haulage (transporting goods) roughly constitutes 20% of the volumetric sales; the accelerating construction activity in the country is likely to catalyze tractor sales growth going forward. This serves as a second driver of tractor demand in Pakistan, in our view. We use cement sales as a proxy for construction activity. Both PSDP spending (Federal Budget allocation up 33%) and cement dispatches (local dispatches growing at a 5‐year CAGR of 11%) depict sizable uptick in construction in the medium term. Also, all the major cement players have announced expansions, which indicate their expectation of much higher demand for cement in the next five years.
Land holding Pattern (ha) show concentration of small to average sized farm…
65%
14%
11%
7%3% 1%
less than 2
2‐3
3‐5
5‐10
10‐20
more than 20
Source: Agriculture Statistics Pakistan
…but tractor ownershipis prevalent among the large‐size farmers
0%
10%
20%
30%
40%
50%
less than 2 2‐3 3‐5 5‐10 10‐20 more than 20Ownership of tractor
Source: Agriculture Statistics of Pakistan
Tractor Sales track cement dispatches
‐
5
10
15
20
25
30
35
‐10,000 20,000 30,000 40,000 50,000 60,000 70,000 80,000
2002
2003
2004
2005
2006
2007
2008
2009
2010
2011
2012
2013
2014
2015
2016
Tractor Sales Cement dispatches(local) mn
GST distorts thecorrelation
Source: PAMA, APCMA

11 | P a g e
Perspective
Pakistan Tractors command high pricing power The margins of Tractor industry have remained stable over time on the back of strong pricing power, high degree of localization and low sensitivity to metal prices. Lack of competition give these tractor companies immense pricing power, where average YoY increase in prices is 7‐10%; similar to the long‐term inflation average in Pakistan. Extremely high degree of localization and low sensitivity of metal prices protects both the companies from any volatility in margins. We believe that industry dynamics will remain in equilibrium, supporting margins in the long run.
Margins have been stable post FY10… Despite high volatility in commodity prices (particularly steel, copper and rubber) over FY11‐16,gross margins of Pakistan tractor manufacturers have remained in a relatively narrow range – 17‐19% and 20‐26% for MTL and AGTL, respectively. This stability is partly explained by the ability of local tractor manufacturers to pass on cost increases to farmers – by an average of 7%‐10%pa, broadly inline with average inflation levels. Tractor prices have also not reduced despite the rout in commodity prices benefitting tractor parts suppliers, consequently lowering costs for MTL and AGTL.
…and are likely to sustain in the medium‐term Both our coverage companies have historically maintained stable EBITDA margins (MTL:15% and AGTL:22%) because of(i) strong pricing power, (ii) high degree of localization, and (iii) very low sensitivity to metal prices. We think there are no foreseeable threats to disturb the existing equilibrium, because the industry is protected by large barriers to entry which include brand loyalty, well‐established dealer network, significant investment in the vendor industry and high capital requirements.
Oligopolistic structure& big barriers to entry explain margin sustainability Pakistan Tractors operate as mature oligopolies and only compete on non‐price factors where our channel checks suggest dealership plays an important role and has enabled them to establish stronghold in different regions. This brand loyalty and dealer power gives them monopolistic power and enables them to easily pass on any increase in the input costs and maintain margins. The monopoly power has come on the back of:
(i) Strong brand equity ‐ both brands have been selling in Pakistan for at least 35 years;
(ii) Dealer network ‐ new entrants will have to develop a new network of distributors, and dealers play an important role in attracting customers;
(iii) Lack of competition in the local market;
(iv) Higher prices of imported tractors
Average Tractor Prices continue to rise unabated…
0
200,000
400,000
600,000
800,000
2008
2009
2010
2011
2012
2013
2014
2015
MTL AGTL
Source: Company Reports
…and gross margins have stabilized at higher levels
0%
5%
10%
15%
20%
25%
30%
2008
2009
2010
2011
2012
2013
2014
2015
2016
2017
F
2018
F
2019
F
GP Margin MTL GP Margin AGTL
Source: Company Reports, IMS Research

12 | P a g e
Perspective
Both incumbents have been operating in the market for decades, and we have recently seen only two new players –Orient Tractors and Minsk Tractors – entering the market and started production. Moreover MTL has also launched its new 100HP tractor to counter imported tractors (more suitable for hard soil).
We believe that with the maturity of our coverage companies in terms of operations, marketing and distribution, these new players do not pose significant threat. Lower prices of Pakistani assembled tractors strengthens their position further, where imported tractors are only available in the market for atleast 30% higher prices than local variants.
High localization protects against currency weakness With a high degree of localization (close to 90%), local tractor manufacturers are significantly immune to any sort of currency movements both in the short and the long term. This has been achieved because of high investment in vendors (backward integration in the case of MTL) over the years; the US$ has strengthened by 6%pavs. the PkR for the last 15 years which would have been severely damaging for the tractor industry had it not been for low dependence on foreign suppliers. The gross margins of IMS Tractor Universe are also not sensitive to PkR depreciation against the Japanese Yen (since both companies are Western brands unlike as in passenger vehicles industry).
The least degree of deletion is in the most advanced 4WD high HP tractors, but they constitute a very low proportion of overall tractor mix; which is not likely to change in the medium‐term without significant investment in mechanization, in our view.
Low sensitivity to metal prices It is worth noting that the gyrations seen in international metal prices since 2011 did not materially affect the margins of both tractor companies. The gross margins of these companies have remained in a very narrow range (MTL: 21‐24%; AGTL: 25‐31%) over the last five years. Most of the changes that we can still observe in the margins are on the back of changes in price of tractors rather than input costs; which have been skewed on the upside, in our view.
Imported tractors are typically 30% pricier than local variants.

13 | P a g e
Perspective
Valuations – MTL can rerate, AGTL not so much MTL (FY17F EPS: PkR54.36; up41%YoY) trades at a forward P/E of 10.25x and P/S of 1.0x, similar to its mean multiples over the last 5yrs. Our DCF based target price of PkR626/sh offers a 1yr total return of 22.2%. On the flipside, AGTL (CY17F EPS: PkR40.42; up 24%YoY) trades at a CY17F P/E of 10.7x and P/S of 1.8x where the latter is already close to +1sd above mean. We are Neutral on AGTL with a target price of PkR448/sh. AGTL has historically traded below its mean levels of PE/PS (8.8x/1.41x) until 2014 when it started paying hefty dividends inducing huge excitement; however, the company currently stands at 12.6x/2.1x on P/E and P/S i.e. already at +1 standard deviation from the mean. On the flipside, MTL trades at its mean PE/PS of 10.7x/1.xOur analysis shows that market has historically kept MTL at a premium to AGTL for its leadership position and its current valuation at a discount suggests a strong case for rerating.
Peer group comparison shows that Pakistan Tractors are trading at a discount to the regional players in the emerging markets (average PE/PS: 33.2/3.67x) even though farmer incomes are depressed all over the world. The discounted valuations despite a promising earning growth outlook (MTL:41%, AGTL:18% vs average : 25%) is a compelling case for a turnaround in price performance, in our view.
AGTL ‐ PER (x)
‐2 4 6 8
10 12 14 16 18 20
Jan‐11
Dec
‐11
Nov
‐12
Oct‐13
Sep‐14
Aug‐15
Aug‐16
SD ‐2 SD ‐1 PER (x) SD +1 SD +2 Mean
SD +2
SD +1
SD ‐1
SD ‐2
Mean
Source: IMS Research
AGTL ‐ P/S (x)
‐
0.5
1.0
1.5
2.0
2.5
3.0
3.5
Jan‐11
Dec
‐11
Nov
‐12
Oct‐13
Sep‐14
Aug‐15
Aug‐16
SD ‐2 SD ‐1 P/Sales (x) SD +1 SD +2 Mean
SD +2
SD +1
SD ‐1
SD ‐2
Mean
Source: IMS Research MTL ‐ PER (x)
4 6 8
10 12 14 16 18 20
Jul‐1
0
Nov
‐10
Apr‐11
Sep‐11
Feb‐12
Jul‐1
2
Dec
‐12
May‐13
Oct‐13
Mar‐14
Aug‐14
Jan‐15
Jun‐15
Nov
‐15
Mar‐16
Aug‐16
SD ‐2 SD ‐1 PER (x) SD +1 SD +2 Mean
SD +2
SD +1
SD ‐1
SD ‐2
Mean
Source: IMS Research
MTL ‐ P/S (x)
0.4
0.6
0.8
1.0
1.2
1.4
1.6
1.8
Jul‐1
0
Nov
‐10
Apr‐11
Sep‐11
Feb‐12
Jul‐1
2
Dec
‐12
May‐13
Oct‐13
Mar‐14
Aug‐14
Jan‐15
Jun‐15
Nov
‐15
Mar‐16
Aug‐16
SD ‐2 SD ‐1 P/Sales (x) SD +1 SD +2 Mean
SD +2
SD +1
SD ‐1
SD ‐2
Mean
Source: IMS Research
Assumptions Rf rate 8.0% Equity Risk Premium 6.0% Terminal Growth rate 3% FY17 unit sales 42500 FY18 unit sales 46600 Market Share (MTLvsAGTL) 61%vs39%

14 | P a g e
Perspective
We have valued IMS Tractor universe using the DCF methodology; where the unit sales are projected to grow at 23% for the first year and 8% for the rest of projection horizon. Potential for exports and a tractor scheme are not built in the base case model; however, these triggers can significantly improve earnings outlook. Conservatively, margins are assumed to be converging to the long‐term average levels and sustainable payout ratio of 100% has been assumed.
Why we prefer MTL over AGTL? MTL seems a more lucrative investment in the IMS Tractor universe on the back of: • A more diversified revenue mix ‐ product mix includes agriculture implements
and forklift trucks; • Leadership position on the back of good customer perception and brand loyalty; • Global reach and hidden potential for exports in Middle East and Africa; • Backward Integration with group holdings in Bolan Castings Ltd, Millat Equipment
Ltd. and Millat Industrial Products Ltd, which supply about 30% of the total input cost; and
• More attractive valuations: MTL is presently trading at FY17F P/E and P/S of 10.25x and 1x respectively; while AGTL is trading at 10.7xP/E and 1.8 P/S. despite MTL enjoying fairly unassailable competitive advantages, as described above, in our view. Potential reason for AGTL trading at a premium to MTL is its magnanimous payout policy (309% payout ratio in CY15), which we expect to normalize in future.
MTL: Small but promising contribution from non‐tractor sales Although agriculture implements such as harvesters, threshers and forklifts contribute a meager 3% to the company’s topline, diversification into these products moderates the company’s reliance on the more expensive tractors. Vigorous competition from local non‐branded products keeps a check on the sales growth of this segment; however, an alternate and potentially growing cash stream would be considered a plus point if tractor sales take a hit. AGTL has also hinted focusing more on this segment (recently shelved generator segment) but has made limited progress till date.
Winning the race MTL holds a dominant position in the industry with a relatively stable market share (above 61%) over the last 5 years. Greater preference for the purpose of haulage and better customer perception makes MTL’s products a more solid candidate for any turnaround in the industry. With little change expected in industry entry dynamics, we believe that MTL’s leadership position is going to remain stable if not improve in the medium term and it will continue to lead the industry in terms of product development and pricing.
MTL is a more lucrative investment opportunity…
Source: IMS Research
MTL Revenue Breakup‐local vs Exports
0
5,000
10,000
15,000
20,000
25,000
30,000
2008
2009
2010
2011
2012
2013
2014
2015
Local Exports
Source: Company Reports
Company P/S (x) P/E (x) EPS Growth (%) Millat Tractor (MTL PA) 1.30 10.70 41.0% Al‐Ghazi Tractors (AGTL PA) 2.60 12.59 18.0% Thinker Agricultural Machinery ( 603789 CH) 9.10 67.00 ‐48.0% First Tractor Co (38 HK) 0.40 24.00 ‐19.0% ESCORTS Ltd. (ESC IN) 1.10 50.00 0.9% Force Motors (FML IN) 1.33 22.43 76.8% V.S.T Tractors (VSTT IN) 2.52 21.89 6.6% Xinjiang Machinery Research (300159 CH) 11.00 57.00 121.0% Average 3.67 33.20 24.7%

15 | P a g e
Perspective Backward Integration provides flexibility Control of its suppliers gives a lot of flexibility to MTL in terms of production and procurement; MTL has controlling stakes in Bolan Castings Ltd (BCL), Millat Equipment Ltd and Millat Industrial Products Ltd, all of which manufacture tractor parts. With a well‐integrated supply chain, MTL has been able to maintain gross margins in a narrower range (17‐19% over the last 5 years) unlike AGTL, which does not have similar integration and has experienced greater margins volatility. Despite significant changes in the metal prices in the local and global markets, MTL with its integrated supply chain has been able to absorb all the input price movements without affecting its margins. Global reach may energize sales Recently, MTL was able to resolve the long‐standing issue of tractor exports under the brand name of “Massey Ferguson” with its principal,AGCO Corporation (AGCO). According to the agreement, AGCO will initially import Pakistani assembled tractors from MTL to its Middle East and African markets and later to other markets. MTL operated at 70% utilization levels in FY16, which means it can export about 9,000 tractors per annum. The signing of this deal will give the company instant access to a huge network of 3,000 dealers in the aforementioned regions, which the Agriculture machinery giant AGCO has already developed. Although it is difficult to assess the true potential of this new move – since these regions contributes about 51% of AGCO’s revenues, it is certainly going to reduce MTL’s dependence on local demand dynamics. We present this as another major sales impetus for MTL which can provide further push on valuations on the levels of regional players (currently MTL trading at 64% discount to the region), which is unmatched by AGTL.
We believe that MTL will be able to potentially reach 10,000pa tractors in exports in the next 5 years.(conservatively not built in the model)

16 | P a g e
Perspective
Risks to our thesis We believe that IMS Tractor universe will be the prime beneficiary of the upward trend in commodity cycle; however, our estimates remain vulnerable to:
Change in GST Regime As seen in the past, increasing GST severely impacts tractor sales due to an immediate rise in market prices. However, with several pro‐agri measures in the recent federal budget, we remain positive with regards to our assumption of constant GST in the run up to 2018 elections.
Further Decline in Commodity Prices As mentioned earlier, with crop yields growing at a slow pace and declining average land holdings, farmer revenue remains a function of commodity prices. Even though recent developments suggest an upward trend in major commodity prices, any contraction in demand from China for commodities might put downward pressure on commodity prices. Having said that, global dynamics depict a very low probability of any further decline.
Major Crop Damage Major crop damage resulting from floods or other natural disasters results in very low farmer income directly impacting the purchasing power. However, as seen in the past, the impact of any such event neutralizes with increased replacement demand in subsequent years (FY11 sales resulted after major floods in 2010).
Faster than expected growth of competitors We believe competition from Orient and Minsk Tractors, who are in their infancy, will be limited over the medium‐term. However, faster‐than‐expected penetration by competition may affect the pricing power and market share of MTL and AGTL. Particularly the removal of duty on CBU import on tractor parts in FY17 can help these new entrants; however, lower prices will shield the incumbents, in our view.

17 | P a g e
Perspective
MTL – The superior tractors play! • We initiate coverage on MTL with a Buy rating where our TP of PkR626/sh offers
a total return of 22.2%, including a 9.8% D/Y. MTL offers a blend of growth and yield, and is the superior tractors play in Pakistan given its market leadership in Punjab and backward integration.
• We see MTL delivering a 3yr EPS CAGR of 20%; with an unlevered balance sheet and stable margins, we see ROE averaging 58% over this period. Positive surprises can occur from any government tractor schemes and rising exports.
• MTL trades at a FY17F P/E of 10.3x and P/S of 1.0x, which is similar to its valuation set over the last 5yrs. We see room for MTL to rerate to +1sd above its mean valuations; where we flag projected 41%YoY growth in FY17F earnings and announcement of any new tractor schemes by the government as key triggers.
Sales growth driving handsome ROEs north of 50% With stable EBITDA margins (FY17‐19F: 14%) and an unlevered balance sheet, revenue growth becomes a key driver of return generation for MTL; we forecast handsome average ROEs of 58% over FY17‐19F amid a conducive environment for sales and high pricing power. After registering sales of 21,111 units in FY16, we see MTL selling 30700 units by FY19F – a 3yr CAGR of 13%. Volumetric growth will be a function of (i) improving farmer incomes as commodity prices increase and input costs contract,(ii) reduced GST will alleviate a major overhang and (iii) GoP incentives in the run up to elections may unfold more agri positives. MTL also carries export potential, following its recent agreement with AGCO to export Massey Ferguson tractors (50‐85hp) to AGCO’s customers in Middle East and Africa. Staying conservative, we have not built in this export potential in our estimates.
Brand loyalty is key to sustained domination Our liking for MTL is firmed up by it being the oldest tractor manufacturer in Pakistan where the Massey Ferguson model has strong brand loyalty. This has helped mitigate the damage resulting from the previous adverse GST scenario and lower farmer incomes; MTL’s market share increased from 50% to 61% in the last 5 years as AGTL suffered a relatively sharper dip in volumes. We believe this is largely a result of customer perception of MTL producing a relatively stronger tractor in terms of durability and tenacity (better for haulage purposes). This brand loyalty results in strong pricing power which drives stable margins and earmarks MTL as the superior tractor play in Pakistan.
Backward integration is a key positive Currently, sale of agriculture implements such as harvesters, threshers and forklifts contribute just 3% to MTL’s topline, but this area represents long‐term growth potential. In addition, MTL has controlling stakes in tractor parts manufacturers such as Bolan Castings Ltd (BCL), Millat Equipment Ltd and Millat Industrial Products Ltd. This integrated supply‐chain allows MTL another avenue to shield margins; we project MTL to post average GMs of 18% over FY17F‐19F vs. an average of 18.2% over the previous 3yrs.
Trading at mean valuations; swift growth can drive rerating MTL trades at a FY17F P/E of 10.25 and P/S of 1.0x, similar to its historical mean valuations. While the company’s P/E is at a 3% premium to the KSE‐100, we believe this is justified by swift growth prospects (FY17F: 41%YoY; 3yr CAGR: 21%) coupled with an impressive dividend yield (FY17F: 9.8%). Accordingly, our TP of PkR626/share offers a total return of 22.2%. We take 2002‐09 as a proxy for sales growth over the medium‐term owing to expected stability in GST regime and anticipated gradual increase in farmer incomes. In this regard, positive surprises may emanate from harnessing of export potential.
Millat Tractors Limited Price (PkR/sh) 556.8 TP (PkR/sh) 626.0 Stance Buy Upside 12.4% Fwd D/Y 9.8% Total Return 22.2% Bloomberg / Reuters MTL PA / MILM.KA Mkt Cap (US$mn) 235.5 52wk Hi‐Low (PkR/sh) 655.84‐463.13 3m Avg. Daily Vol ('000 shrs) 37 3m Avg. Traded Val (US$mn) 0.21
Key Ratios FY15A FY16F FY17F FY18F EPS (PkR) 53.80 38.52 54.36 61.37 EPS Gth (%) 60.8% ‐28.4% 41.1% 12.9% P/E (x) 10.35 14.45 10.24 9.07 PBV (x) 5.2 5.3 5.3 5.3 DPS (PkR) 52.0 40.0 54.0 61.0 DY (%) 9.4% 7.2% 9.8% 11.0% ROE (%) 53.0% 36.1% 52.9% 59.9% EV/EBITDA (x) 6.4 9.3 7.2 6.4 Gross Margin 19.3% 17.8% 18.2% 17.7%
MTL vs. KSE100 index
‐45%
‐30%
‐15%
0%
15%
30%
Sep‐15
Oct‐15
Dec
‐15
Jan‐16
Feb‐16
Apr‐16
May‐16
Jul‐1
6
Aug‐16
MTL KSE100 Index
Source: IMS Research
MTL –DuPont Analysis FY13 FY14 FY15
Asset Turnover 2.22 1.94 3.12
Leverage 2.13 1.56 1.64
NP Margins 9% 9% 10%
ROE (%) 45% 27% 53% Source: Company Reports Dupont Analysis shows that with stable margins, ROE is solely dependent on Asset Turnover (Sales) as leverage is only due to trade payables

18 | P a g e
Perspective
Risks: These include: (i) any fresh downturn in farmer incomes, (ii) adverse government policies e.g. increase in GST, (iii) advent of greater competition – either via imports or entry of new manufacturers in the country.
About the company MTL is the largest manufacturer of farm equipment and engineering products in the country operating under license from AGCO Corporation UK (owners of Massey Ferguson). The company started its operations in 1964 as a tractor manufacturer and currently leads the industry with a market share of 61%. The company offers eight different models of tractors ranging from 55 to 100HP. It also has a range of implements such as harvesters, puddlers, threshers etc along with an engineering product range.
Sponsors
AGCO Corporation: AGCO Corporation is the one of the largest manufacturer and distributor of agricultural equipment and machinery, based in US. The company owns multiple popular brands including Challenger, Fendt and Massey Ferguson and has a vast network of over 3,000 dealers all over the world. Anhui Heli Co. Ltd.: Anhui Heli Forklift Company is a China based company established in 1958 and is engaged in R&D, manufacturing and distribution of Industrial vehicles, construction machinery and key components. The company is the owner of one of the leading brand “Heli” and markets forklift trucks under its umbrella.
ROE expected to rise, similar to 2002‐2010 path
0%
10%
20%
30%
40%
50%
60%
70%
80%
2004
2005
2006
2007
2008
2009
2010
2011
2012
2013
2014
2015
2016
2017
F
2018
F
2019
F
Source: Company Reports,IMS Research
MTL – Capacity Utilization
0%
20%
40%
60%
80%
100%
120%
140%
160%
2011
2012
2013
2014
2015
2016
2017
F
2018
F
2019
F
Source: Company Reports
Less dependence on other income recently
0%
10%
20%
30%
40%
50%
‐100 200 300 400 500 600 700 800
2007
2008
2009
2010
2011
2012
2013
2014
2015
Other Income(PkR mn) Other income as % of PBT ‐Rhs
Source: Company Reports
Pattern of Shareholding
Directors and their family 29.89%
General Public 28.32%
Executives 10.23%
Insurarace Companies 3.96%
Mutual Funds 3.8%
Others 23.8%
19 | P a g e
Perspective
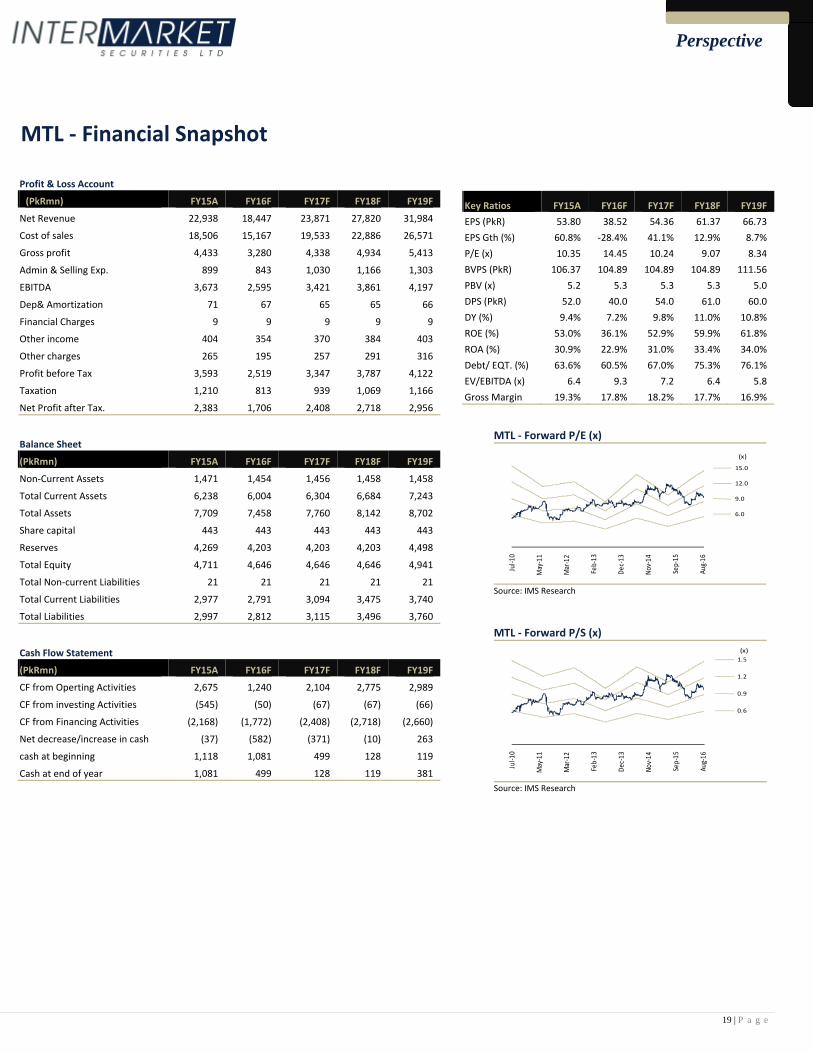
MTL ‐ Financial Snapshot
Profit & Loss Account
(PkRmn) FY15A FY16F FY17F FY18F FY19F
Net Revenue 22,938 18,447 23,871 27,820 31,984
Cost of sales 18,506 15,167 19,533 22,886 26,571
Gross profit 4,433 3,280 4,338 4,934 5,413
Admin & Selling Exp. 899 843 1,030 1,166 1,303
EBITDA 3,673 2,595 3,421 3,861 4,197
Dep& Amortization 71 67 65 65 66
Financial Charges 9 9 9 9 9
Other income 404 354 370 384 403
Other charges 265 195 257 291 316
Profit before Tax 3,593 2,519 3,347 3,787 4,122
Taxation 1,210 813 939 1,069 1,166
Net Profit after Tax. 2,383 1,706 2,408 2,718 2,956
Balance Sheet
(PkRmn) FY15A FY16F FY17F FY18F FY19F
Non‐Current Assets 1,471 1,454 1,456 1,458 1,458
Total Current Assets 6,238 6,004 6,304 6,684 7,243
Total Assets 7,709 7,458 7,760 8,142 8,702
Share capital 443 443 443 443 443
Reserves 4,269 4,203 4,203 4,203 4,498
Total Equity 4,711 4,646 4,646 4,646 4,941
Total Non‐current Liabilities 21 21 21 21 21
Total Current Liabilities 2,977 2,791 3,094 3,475 3,740
Total Liabilities 2,997 2,812 3,115 3,496 3,760
Cash Flow Statement
(PkRmn) FY15A FY16F FY17F FY18F FY19F
CF from Operting Activities 2,675 1,240 2,104 2,775 2,989
CF from investing Activities (545) (50) (67) (67) (66)
CF from Financing Activities (2,168) (1,772) (2,408) (2,718) (2,660)
Net decrease/increase in cash (37) (582) (371) (10) 263
cash at beginning 1,118 1,081 499 128 119
Cash at end of year 1,081 499 128 119 381
Key Ratios FY15A FY16F FY17F FY18F FY19F EPS (PkR) 53.80 38.52 54.36 61.37 66.73 EPS Gth (%) 60.8% ‐28.4% 41.1% 12.9% 8.7% P/E (x) 10.35 14.45 10.24 9.07 8.34 BVPS (PkR) 106.37 104.89 104.89 104.89 111.56 PBV (x) 5.2 5.3 5.3 5.3 5.0 DPS (PkR) 52.0 40.0 54.0 61.0 60.0 DY (%) 9.4% 7.2% 9.8% 11.0% 10.8% ROE (%) 53.0% 36.1% 52.9% 59.9% 61.8% ROA (%) 30.9% 22.9% 31.0% 33.4% 34.0% Debt/ EQT. (%) 63.6% 60.5% 67.0% 75.3% 76.1% EV/EBITDA (x) 6.4 9.3 7.2 6.4 5.8 Gross Margin 19.3% 17.8% 18.2% 17.7% 16.9%
MTL ‐ Forward P/E (x)
Jul‐1
0
May‐11
Mar‐12
Feb‐13
Dec‐13
Nov‐14
Sep‐15
Aug‐16
(x)
15.0
12.0
9.0
6.0
Source: IMS Research
MTL ‐ Forward P/S (x)
Jul‐1
0
May‐11
Mar‐12
Feb‐13
Dec‐13
Nov‐14
Sep‐15
Aug‐16
(x)1.5
1.2
0.9
0.6
Source: IMS Research

20 | P a g e
Perspective
Al‐Ghazi Tractors Ltd – The Cash Cow • We initiate coverage on AGTL with a Neutral rating where our TP of PkR448/sh
offers a total return of 13.7% including a 9.4%CY17F D/Y. We project AGTL to post 24%YoY growth in CY17F with 3yr earnings CAGR expected at 15%.
• AGTL has a cash rich balance sheet, which enabled the company to earn significant ‘other income’ and pay hefty dividends too (FY15 payout ratio: 309%); we believe abnormally high dividends are not sustainable in the long run but even so D/Y will remain attractive.
• Improving farmer economics and pro‐agri policies are expected to benefit AGTL as well, although with less intensity, since it has a lower market share. We flag that AGTL enjoys higher margins (AGTL GM: 26%, MTL GM: 19% in 2015) where volumetric growth over and above our estimates could lead to accelerate an already swift earnings growth forecasts.
Good times ahead With rising farmer incomes and favorable GST regime, AGTL is also expected to witness growth in sales, which is forecasted at a 5‐year CAGR of 15%. While competition in Sindh could intensify (from Orient Tractors) and dependence of revenue on a narrow range of products enhances vulnerability, we flag that AGTL enjoys superior margins (GMs: 26% vs. 16% for MTL). While AGTL’s lower market share (39%) could dilute the impact from the turnaround in industry dynamics, higher margins would magnify the earnings impact for AGTL particularly if our sales clock in higher than our expectations.
Strong foreign backing AGTL is a joint venture agreement between the Al‐Futtaim group of UAE and CNH Industrial, both giants have significant interests in auto industry globally. This unique edge opens doors for AGTL to leverage the technological advancement of its sponsors in future, but that may require an upsurge in quantity and quality of tractors demanded for better economics. Moreover, this affiliation can potentially result in an entry into the export market which can add a significant upside to earnings forecast.
What to do with all that cash? AGTL paid out a hefty PkR85/sh dividend during CY15 on EPS PkR27.5 (payout ratio: 309%). AGTL holds about PkR40/sh of cash & equivalents, income on which contributes about 15% to the bottom line. With strong cash position, the company is expected to continue a high payout policy; however, we expect payout to normalize to c.100% over the medium‐term as higher utilization levels enhance working capital needs.
Trading above mean multiples AGTL trades at a CY17F P/E of 10.7x and P/S of 1.8x vs. 5yr trailing P/E and P/S of 9.7x and 1.2x, respectively. Unlike MTL, AGTL already trades higher than its historical valuations, although this is some what mitigated by swift growth prospects. We have assumed a growth rate of 25%YoY% for CY17F sales – inline with the historical trend post reductions in applicable GST – and then take 2002‐2009 as a proxy for sales growth of the rest of the forecasting period.
The scrip is trading 1s.d above its mean P/E and P/S even though at a discount to regional peers we do not see much room for rerating however govt. contract or export exposure can act as trigger for expansion in valuations.
Risks: These include: (i) any fresh downturn in farmer incomes, (ii) adverse government policies e.g. increase in GST, (iii) advent of greater competition – either via imports or entry of new manufacturers in the market.
Al‐Ghazi Tractors Limited Price (PkR/sh) 429.6 TP (PkR/sh) 448.0 Stance Neutral Upside 4.3% Fwd D/Y 9.4% Total Return 13.7% Bloomberg / Reuters AGTL PA / ALGH.KA Mkt Cap (US$mn) 237.8 52wk Hi‐Low (PkR/sh) 505.07‐378.08 3m Avg. Daily Vol ('000 shrs) 11 3m Avg. Traded Val (US$mn) 0.04
Key Ratios CY15A CY16F CY17F CY18F EPS (PkR) 27.47 32.63 40.36 45.77 EPS Gth (%) 1.1% 18.8% 23.7% 13.4% P/E (x) 15.6 13.2 10.6 9.4 PBV (x) 4.3 5.2 5.2 5.2 DPS (PkR) 85.0 50.0 40.0 46.0 DY (%) 19.8% 11.6% 9.4% 10.7% ROE (%) 21.5% 39.2% 49.9% 56.4% EV/EBITDA (x) 9.3 8.5 6.9 6.2 Gross Margin 26.2% 26.0% 26.0% 25.3%
AGTL vs. KSE100 Index
‐30%
‐15%
0%
15%
30%
Sep‐15
Oct‐15
Dec
‐15
Jan‐16
Feb‐16
Apr‐16
May‐16
Jul‐1
6
Aug‐16
AGTL KSE100 Index
Source: IMS Research

21 | P a g e
Perspective
About the Company Al‐Ghazi tractors is the second largest manufacturer of tractors and farm equipment in Pakistan with an installed capacity of 30,000 units per annum and holds 39% market share. The company was established in 1983 and produces Fiat tractors under license from CNH industrial. Al‐Ghazi tractor offers 8 different models of tractors ranging from 55‐85HP, a range of implements as well as generators too.
Sponsors
Al‐Futtaim group: Al‐Futtaim is a UAE based conglomerate operating through 200 different companies all over the world and has interests in Automotive, Financial Services, Real Estate and Retail Sectors. The company has presence in about 30 countries and is involved in Joint‐Venture agreements with 29 leading Auto brands including Toyota, Lexus, Ford etc. for production and distribution of vehicles in the GCC Region. The company holds a controlling 50.02% stake in AGTL.
CNH Industrial: CNH industrial is a Netherlands based global giant involved in manufacturing and distribution of agricultural and construction equipment, trucks, commercial vehicles, busses and specialty vehicles. The company has 12 global brands including “Fiat” (AGTL markets this brand in Pakistan) and has 64 manufacturing units in 180 countries. It owns 43.17% stake in AGTL.
Pattern of Shareholding
Al‐Futtaim Industries 50.02%
CNH Industrial N.V 43.17%
General Public 4.75%
Companies and Corporations 2.06%
Strong Cash Position over the years
0
100
200
300
400
500
600
0
1,000
2,000
3,000
4,000
5,000
CY07 CY08 CY09 CY10 CY11 CY12 CY13 CY14 CY15
Other Income(PkR mn) AGTL Cash(PkR mn)
Source: Company Reports
Capacity Utilization
0%10%20%30%40%50%60%70%80%90%
2011
2012
2013
2014
2015
2016
2017
F
2018
F
2019
F
Source: Company Reports
Significant dependence on other income
0%
5%
10%
15%
20%
25%
30%
35%
CY07 CY08 CY09 CY10 CY11 CY12 CY13 CY14 CY15
Other income as % of PBT
Source: Company Reports

22 | P a g e
Perspective
AGTL ‐ Financial Snapshot
Profit & Loss Account
(PkRmn) CY15A CY16F CY17F CY18F CY19F
Net Revenue 9,636 11,338 14,146 16,467 19,004
Cost of sales 7,109 8,386 10,470 12,308 14,450
Gross profit 2,527 2,952 3,676 4,159 4,554
Admin & Selling Exp. 391 434 492 549 605
EBITDA 2,439 2,737 3,293 3,730 4,024
Dep& Amortization 46 36 36 37 38
Financial Charges 1 1 1 1 1
Other income 480 418 348 392 368
Other charges 177 199 239 271 293
Profit before Tax 2,392 2,700 3,255 3,692 3,985
Taxation 800 809 916 1,039 1,131
Net Profit after Tax. 1,592 1,891 2,340 2,653 2,854
Balance Sheet
(PkRmn) CY15A CY16F CY17F CY18F CY19F
Non‐Current Assets 615 636 658 678 698
Total Current Assets 5,789 5,659 5,890 6,097 6,336
Total Assets 6,404 6,295 6,548 6,776 7,034
Share capital 290 290 290 290 290
Reserves 5,499 4,492 4,492 4,492 4,492
Total Equity 5,789 4,781 4,781 4,781 4,781
Total Non current Liabilities 67 67 67 67 67
Total Current Liabilities 549 1,447 1,699 1,928 2,186
Total Liabilities 616 1,514 1,766 1,995 2,253
Cash Flow Statement
(PkRmn) CY15A CY16F CY17F CY18F CY19F
CF from Operting Activities 1,046 2,280 2,818 2,479 2,642
CF from investing Activities 1,735 (57) (58) (58) (58)
CF from Financing Activities (4,376) (2,898) (2,340) (2,653) (2,854)
Net decrease/increase in cash (1,595) (675) 421 (231) (270)
cash at beginning 3,925 2,330 1,655 2,076 1,844
Cash at end of year 2,330 1,655 2,076 1,844 1,575
Key Ratios CY15A CY16F CY17F CY18F CY19F EPS (PkR) 27.47 32.63 40.36 45.77 49.24 EPS Gth (%) 1.1% 18.8% 23.7% 13.4% 7.6% P/E (x) 15.6 13.2 10.6 9.4 8.7 BVPS (PkR) 99.9 82.5 82.5 82.5 82.5 PBV (x) 4.3 5.2 5.2 5.2 5.2 DPS (PkR) 85.0 50.0 40.0 46.0 49.0 DY (%) 19.8% 11.6% 9.4% 10.7% 11.5% ROE (%) 21.5% 39.2% 49.9% 56.4% 60.8% ROA (%) 24.9% 30.0% 35.7% 39.2% 40.6% Debt/ EQT. (%) 10.6% 31.7% 36.9% 41.7% 47.1% EV/EBITDA (x) 9.3 8.5 6.9 6.2 5.8 Gross Margin 26.2% 26.0% 26.0% 25.3% 24.0%
AGTL ‐ Forward P/E (x) ‐ CY16F
Jan‐11 Dec‐11 Nov‐12 Oct‐13 Sep‐14 Aug‐15 Aug‐16
(x)AGTL ‐PER (x) Band
20.0
15.0
10.0
5.0
Source: IMS Research
AGTL ‐ Forward P/S (x) ‐ CY16F
Jan‐11
Dec‐11
Nov‐12
Oct‐1
3
Sep‐14
Aug‐15
Aug‐16
(x)
3.5
2.5
1.5
0.5
Source: IMS Research

23 | P a g e
Perspective
I, Muneeb Naseem, certify that the views expressed in the report reflect my personal views about the subject securities. I also certify that no part of my compensation was, is, or will be, directly or indirectly, related to the specific recommendations made in this report. I further certify that I do not have any beneficial holding of the specific securities that I have recommendations on in this report.
Ratings Guide* Total ReturnBuy More than 15% Neutral Between 0% ‐ 15% Sell Below 0%
*Based on 12 month horizon unless stated otherwise in the report. Total Return is sum of any Upside/Downside (percentage difference between the Target Price and Market Price) and Dividend Yield.
Valuation Methodology: We use multiple valuation methodologies in arriving at a Target Price including, but not limited to, Discounted Cash Flow (DCF), Dividend Discount Model (DDM) and relative multiples based valuations.
Risks: Please refer to page no. 16
Disclaimer:Intermarket Securities Limited has produced this report for private circulation only. The information, opinions and estimates herein are not direct at, or intended for distribution to or use by, any person or entity in any jurisdiction where doing so would be contrary to law or regulation or which would subject Intermarket Securities Limited to any additional registration or licensing requirement within such jurisdiction. The information and statistical data herein have been obtained from sources we believe to be reliable where such information has not been independently verified and we make no representation or warranty as to its accuracy, completeness and correctness. This report makes use of forward looking statements that are based on assumptions made and information currently available to us and those are subject to certain risks and uncertainties that could cause the actual results to differ materially. No part of the compensation of the author(s) of this report is related to the specific recommendations or views contained in this report.
This report is not a solicitation or any offer to buy or sell any of the securities mentioned herein. It is meant for information purposes only and does not take into account the particular investment objectives, financial situation or needs of individual recipients. Before acting on any information in this report, you should consider whether it is suitable for your particular circumstances and, if appropriate, seek professional advice. Neither Intermarket Securities Limited nor any of its affiliates or any other person associated with the company directly or indirectly accepts any liability whatsoever for any direct or consequential loss arising from any use of this report or the information contained herein.
Subject to any applicable law and regulations, Intermarket Securities Limited, its affiliates or group companies or individuals connected with Intermarket Securities Limited directly or indirectly may have used the information contained herein before publication and may have positions in, or may from time to time purchase or sell or have a material interest in any of the securities mentioned or may currently or in future have or have had a relationship with, or may provide investment banking, capital markets and/or other services to, the entities mentioned herein, their advisors and/or any other connected parties.

24 | P a g e
Perspective
NOTICE TO US INVESTORS
This report was prepared, approved, published and distributed by Intermarket Securities Limited (IMS) located outside of the United States (a “non‐US Group Company”). This report is distributed in the U.S. by LXM LLP USA, a U.S. registered broker dealer, on behalf of IMS only to major U.S. institutional investors (as defined in Rule 15a‐6 under the U.S. Securities Exchange Act of 1934 (the “Exchange Act”)) pursuant to the exemption in Rule 15a‐6 and any transaction effected by a U.S. customer in the securities described in this report must be effected through LXM LLP USA.
Neither the report nor any analyst who prepared or approved the report is subject to U.S. legal requirements or the Financial Industry Regulatory Authority, Inc. (“FINRA”) or other regulatory requirements pertaining to research reports or research analysts. No non‐US Group Company is registered as a broker‐dealer under the Exchange Act or is a member of the Financial Industry Regulatory Authority, Inc. or any other U.S. self‐regulatory organization.
Analyst Certification. Each of the analysts identified in this report certifies, with respect to the companies or securities that the individual analyses, that (1) the views expressed in this report reflect his or her personal views about all of the subject companies and securities and (2) no part of his or her compensation was, is or will be directly or indirectly dependent on the specific recommendations or views expressed in this report. Please bear in mind that (i) IMS is the employer of the research analyst(s) responsible for the content of this report and (ii) research analysts preparing this report are resident outside the United States and are not associated persons of any US regulated broker‐dealer and that therefore the analyst(s) is/are not subject to supervision by a US broker‐dealer, and are not required to satisfy the regulatory licensing requirements of FINRA or required to otherwise comply with US rules or regulations regarding, among other things, communications with a subject company, public appearances and trading securities held by a research analyst account.
Important US Regulatory Disclosures on Subject Companies. This material was produced by Analysis of IMS solely for information purposes and for the use of the recipient. It is not to be reproduced under any circumstances and is not to be copied or made available to any person other than the recipient. It is distributed in the United States of America by LXM LLP USA and elsewhere in the world by IMS or an authorized affiliate of IMS. This document does not constitute an offer of, or an invitation by or on behalf of IMS or its affiliates or any other company to any person, to buy or sell any security. The information contained herein has been obtained from published information and other sources, which IMS or its Affiliates consider to be reliable. None of IMS accepts any liability or responsibility whatsoever for the accuracy or completeness of any such information. All estimates, expressions of opinion and other subjective judgments contained herein are made as of the date of this document. Emerging securities markets may be subject to risks significantly higher than more established markets. In particular, the political and economic environment, company practices and market prices and volumes may be subject to significant variations. The ability to assess such risks may also be limited due to significantly lower information quantity and quality. By accepting this document, you agree to be bound by all the foregoing provisions.
LXM LLP USA assumes responsibility for the research reports content in regards to research distributed in the U.S. LXM LLP USA or its affiliates has not managed or co‐managed a public offering of securities for the subject company in the past 12 months, has not received compensation for investment banking services from the subject company in the past 12 months, does not expect to receive and does not intend to seek compensation for investment banking services from the subject company in the next 3 months. LXM LLP USA has never owned any class of equity securities of the subject company. There are not any other actual, material conflicts of interest of LXM LLP USA at the time of the publication of this research report. As of the publication of this report LXM LLP USA, does not make a market in the subject securities.