Inter Connected Stock Exchange Ltd. - wirc-icai.org · Project Consultancy, ... Fundamental...
56
By CA Ashok Ajmera – CMD, Ajcon Global Services Ltd. Director – BSE Brokers Forum Ajcon Global Services Ltd. (SEBI Registered Research Analyst) Fundamental Analysis
Transcript of Inter Connected Stock Exchange Ltd. - wirc-icai.org · Project Consultancy, ... Fundamental...

By
CA Ashok Ajmera – CMD, Ajcon Global Services
Ltd.
Director – BSE Brokers Forum
Ajcon Global Services Ltd.
(SEBI Registered Research Analyst)
Fundamental Analysis

About Ajcon Global Services Ltd.
1) Well diversified financial services Company offering a whole gamut of
services such as Stock Broking, Commodity Broking, Depository Services,
Project Consultancy, Equity Research, Loan Syndication, Corporate Advisory
Services and Merchant Banking.
2) The Company went public in 1995 and its IPO was oversubscribed by over 25
times demonstrating the faith and confidence the investment community
reposed in the Company.
3) Member of National Stock Exchange, Bombay Stock Exchange, MCX – SX and
is a depository participant of CDSL.
4) Executed more than 300 assignments of Project Financing and Loan
Syndication and gained recognition as a leading project consultancy firm,
possessing strong implementation skills to transform corporate vision and
strategy into profitable reality

About CA. Ashok Ajmera – CMD
1) CA. Ashok Kumar Ajmera, aged 60, is a well known Chartered Accountant(1977) and a capital market expert with an experience of over 35 years.
2) Elected on the Board of Brokers Forum of India (BBF) for the term 2013 -15. Served as a Managing Committee member in BBF since 2011.
3) Served as an Independent Director on the board of Canara BankSecurities Ltd.(subsidiary of Canara Bank ) in 2004.
4) Significantly contributed to streamline operations and systems at NSEand has represented broker community. Worked closely with NSE forreplacing the then prevailing Badla system by introducing AutomatedLending and Borrowing Mechanism (ALBM). He chaired the NSEcommittees for resolving disputes of members. He addressed andresolved a large number of disputes over a 3-year term as the member ofDispute Resolution Committee (DRC).
5) Contributed several Articles and interviews in leading Newspapers &magazines. Leading media channels, namely, Doordarshan, B.B.C, Star,Zee, CNBC, NDTV, Sahara, Reuters, Awaaz, Aaj Tak, Headlines Today,Bloomberg UTV, India News, Times Now etc. interview him as a CapitalMarket Expert / Stock Analyst.
6) He also presented a well-researched paper on the 'Indian economy', witha foreword by the eminent tax expert and Supreme Court Advocate, Mr.Y.P Trivedi in Japan before 14,000 delegates in the year 1992, just afterthe second budget of Dr. Manmohan Singh as Finance Minister.

About Ajcon Research
1) Ajcon Global Services Ltd. is a SEBI Registered Research Analyst
2) Ajcon Research is headed by Mr. Akash Jain, MBA (Financial Markets) under
the mentorship of our CMD. – CA. Ashok Ajmera
3) The research team has introduced various products for its Institutional and
retail clients like Market Round up Report, Investor’s Delight, Xpress Idea, and
Weekly review .
4) The team also specializes on carrying out sectoral research and company
specific due diligence report.
5) The reports are published by Ajcon Research through leading portals like
Bloomberg, Moneycontrol and Researchbytes.
6) The reports are viewed by fund managers of around 500 institutions (domestic
and global).

What is Fundamental Analysis
1) Fundamental Analysis is an important pillar of long term investing. It’s a
broader concept and involves a) Economy Analysis, b) Industry Analysis and
c) Company Analysis
2) When talking about stocks, fundamental analysis is a technique that attempts
to determine a security’s value by focusing on underlying factors that affect a
company's actual business and its future prospects. On a broader scope, you
can perform fundamental analysis on industries or the economy as a whole.
3) Also known as quantitative analysis, this involves looking at revenue,
expenses, assets, liabilities and all the other financial aspects of a company.
Fundamental analysts look at this information to gain insight on a company's
future performance.
4) Fundamental analysis serves to answer questions, such as: Is the company’s
revenue growing? Is it actually making a profit? Is it in a strong-enough
position to beat out its competitors in the future? Is it able to repay its debts?
Is management trying to "cook the books"?

Economy Analysis

Economy Analysis - Fundamental Analysis
Economy analysis (global and domestic) involves analysis and implications of key macroeconomic indicators on the Company:
A) Domestic Economy Analysis
a) GDP
b) Monetary policy
c) Inflation
d) Economic policies
Import – Export policy
Interest rates
Exchange rates
Duty structure
Fiscal and Revenue Deficit
Foreign Investment policy
e) Employment data
a) Geo political situation

Ingredients – Macro Economic Factors
1) Global Economy Analysis
a) The Global Macroeconomic Analysis includes analysis of the major advancedeconomies and research on topical cross-country issues, such as the global businesscycle, capital flows to emerging markets, EM bank lending conditions and key riskfactors affecting the global economy.
b) Macroeconomic factors are national and global events which are out of your control.The recent ISIS attacks on France and France attacks in Syria, Nepal and JapanEarthquake crisis, concerns on US Fed rate hike, terrorists attack on IndianParliament, Indian September 11th terrorist attacks, the financial meltdown of 2008-2009 and the European sovereign debt crisis of 2009-2011 are prime examples ofmacro factors. Macro factors are dangerous and unpredictable, and a savvy managermust be agile to sidestep a cascading macroeconomic crisis to keep the companyintact.
c) Negative macro factors tend to occur in a cascading chain reaction. For example,increased unemployment in the United States may lead to lower consumer spending,which in turn leads to reduced imports from China, which also causes the ChineseGDP to decrease. A lowered Chinese GDP then leads to lowered expectations forgrowth, and leads to a decreased demand for natural resources, such as crude oil,iron or silver. This causes commodities to plummet globally, which can adverselyaffect the profits of miners in multiple countries.

Industry Analysis

Industry Analysis - Fundamental Analysis
1) Understand Industry Drivers:
a) Demand and Supply (current, future) of different products
b) Key raw materials
c) Global and domestic market
d) Business Cycles/Product Life Cycles/Seasonality
2) Understanding product mix in the sector
a) Applications of the products/users of products
b) Manufacturing processes (alternate processes)
c) Technical aspects
3) Current situation of the Industry and outlook
a) Key changes happening in the sector
b) Key drivers for the sector/products of the Company
c) Regulations, Regulatory authorities, key policy change in past
d) Policy changes expected in near future, regional politics
e) Key words, terminologies, jargons
f) International Scenario about the Company/Products
g) Key players (Market share, Brief Financials, Products)
h) Capacities, Common Size Statements, Stakeholders
Checklist for carrying out Industry analysis

Industry Analysis - Fundamental Analysis
4) Porter’s Five Forces Industry Analysis
a) Bargaining power of suppliers
b) Bargaining power of customers
c) Competitive Intensity
d) Barriers to entry
e) Threat of substitutes
5) Value chain analysis/relative position in the industry
a) Industry value chain
b) Differences between Industry Value chain and Company value chain with respect to selling pricesand costs of various activities
Checklist for carrying out Industry analysis

Industry Analysis - Fundamental Analysis
We believe one of the best methods to analyze an Industry is to apply Porter’s Five Forces Tool:

Industry Analysis - Fundamental Analysis
4) Bargaining power of Buyers & Sellers
Both buyers and suppliers tend to be powerful if:
a) They are few in numbers and large in size (Pidilite)
b) How painful will it be to lose that particular customer or supplier?
c) Switching costs are high
d) Can a Company do backward integration & reduce dependence on suppliers (Sangam India, MayurUniquoters)
Threat of Substitutes
a) Kodak was killed by Digital cameras – will be likely killed by mobile phones (future belongs toelectric cars)
Threat of New Entrants
a) Do the incumbents have an edge in any of the following – technology/brands/primelocations/distribution channels (WABCO/Colgate/Tata Steel/Asian Paints/HDFC Bank etc.)
b) Does government policy restrict or prevent new entrants? (No licenses for any new cigarette andliquor Company?
c) How large are the Capital and Recurring investments?
d) Does the value to a customer increase as more customer‟s use a Company‟s product?/Networkeffect? (Facebook)
Porter’s 5 Forces – Industry structure determines profitability

Industry Analysis - Fundamental Analysis
4) Rivalry among existing competitors
a) Lack of industry growth will lead to higher competition as Companies look at growing via marketshare gains
b) Is the industry leader rational? Often an industry leader has the ability to enforce practices thathelp the whole industry (Between 2000 – 2012, Parle and Eveready behaved irrationally inspite ofbeing market leaders.
c) High exit barriers – if Companies in a crowded industry have invested heavily (Textiles)
d) Irrational commitment to business. Company may feel its image requires a full product lineirrespective of ROI.
e) Price based competition is higher if the product has commoditized in nature (Pharma has R&Dbased competition, FMCG products have advertising based competition, however pricing basedcompetition is the worst.
f) Business dynamics are such that there are high fixed costs and low marginal costs, creating thepressure to drop prices because any new customer addition will contribute towards covering fixedoverhead costs.
g) Is the product perishable or going to lose its value/become obsolete if unused? (A restaurant table,hotel room, an airline seat, an unsold fashion garment – all are perishable)
Porter’s 5 Forces – Industry structure determines profitability

Industry Analysis - Fundamental Analysis
We have applied Porter’s Five Forces Tool to understand the paint industry:
1) Bargaining power of suppliers (moderate): Paint manufacturers depend on bothlocal and international suppliers and have a low bargaining power vis-à-vis prices ofsupplies. While some crude based materials are purchased from Indian suppliers likeHPCL and BPCL, others often have a wide international market with multiplesuppliers. Some key components like titanium dioxide are also in short supplyglobally
2) Bargaining power of buyers (moderate):
a) Buyers of decorative paints in the B2C market have low bargaining power. Volumes inthe industry are not materially affected by price hikes.
b) Buyer power is high for the industrial segment (B2B), especially auto OEMs andinfrastructure companies.
c) With increasing consumer awareness of decorative products, bargaining power ofbuyers is improving.
Industry Analysis - Fundamental Analysis
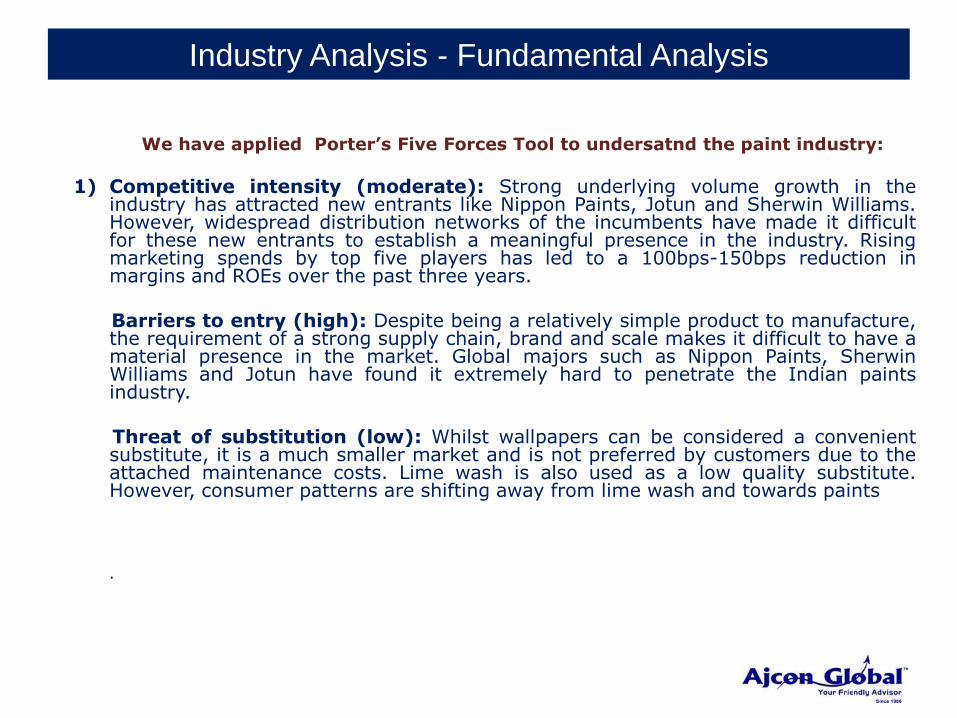
We have applied Porter’s Five Forces Tool to undersatnd the paint industry:
1) Competitive intensity (moderate): Strong underlying volume growth in theindustry has attracted new entrants like Nippon Paints, Jotun and Sherwin Williams.However, widespread distribution networks of the incumbents have made it difficultfor these new entrants to establish a meaningful presence in the industry. Risingmarketing spends by top five players has led to a 100bps-150bps reduction inmargins and ROEs over the past three years.
Barriers to entry (high): Despite being a relatively simple product to manufacture,the requirement of a strong supply chain, brand and scale makes it difficult to have amaterial presence in the market. Global majors such as Nippon Paints, SherwinWilliams and Jotun have found it extremely hard to penetrate the Indian paintsindustry.
Threat of substitution (low): Whilst wallpapers can be considered a convenientsubstitute, it is a much smaller market and is not preferred by customers due to theattached maintenance costs. Lime wash is also used as a low quality substitute.However, consumer patterns are shifting away from lime wash and towards paints
.

Industry Analysis - Fundamental Analysis
a) The sequence of activities a Company performs to design, produce, sell, deliver and support itsproducts is called the value chain.
b) Why does the value chain matter? The value chain is a powerful tool for disaggregating a Companyinto its strategically relevant activities that result in higher selling price or cost?
Key steps in value chain analysis
1) Start by laying out the industry value chain – Every industry has a dominant approach i.e scope &sequence of activities followed by majority of the Companies in that industry. The key here is to layout the major value creating activities specific to the industry
Value chain analysis
R&DSupply Chain Management
OperationsMarketing &
SalesAfter sales
service

Industry Analysis - Fundamental Analysis
a) How far backward or forward integration do the industry‟s activities extended? Eg. A car maker hasto decide if he wants to go in for backward integration into making tyres or other ancillary parts.Again he would have to decide if he wants to go in for forward integration by opening a car financeCompany
b) What are the key value creating activities at each step in the chain?
c) If there are competing business models, lay out the value chain for each one. Then look fordifferences among them to understand the difference in their costs and selling prices.
2) Compare your Company‟s value chain to the Industry‟s
3) Zero in on price drivers, those activities that have a high current or potential impact ondifferentiation
a) In order to provide superior quality products, Page Industries manufactures elastic – in house asagainst players like Rupa and VIP who outsource it from small cottage industries resulting in poorand in – consistent quality of products.
b) Zero in on cost drivers, paying special attention to activities that represent a large or growingpercentage of costs.
c) Watch out the differences between the Company and its rivals/peers.
Value chain analysis

Company Analysis

Company Analysis - Fundamental Analysis
We believe one of the best methods to analyze a Company’s business is to apply Porter’s Five Forces Tool:
• Understanding the Tool
Five Forces Analysis assumes that there are five important forces that determinecompetitive power in a business situation. These are:
Competitive rivalry: This force examines how intense the competition currently is
in the marketplace, which is determined by the number of existing competitors andwhat each is capable of doing.
Rivalry competition is high when there are just a few businesses equally selling aproduct or service, when the industry is growing and when consumers can easilyswitch to a competitors offering for little cost. When rivalry competition is high,advertising and price wars can ensue, which can hurt a business's bottom line.Rivalry is quantitatively measured by the Concentration Ratio (CR), which is thepercentage of market share owned by the four largest firms in an industry.

Company Analysis - Fundamental Analysis
Bargaining power of suppliers: This force analyzes how much power a business'ssupplier has and how much control it has over the potential to raise its prices, which,in turn, would lower a business's profitability. In addition, it looks at the number ofsuppliers available: The fewer there are, the more power they have. Businesses arein a better position when there are a multitude of suppliers. Sources of supplierpower also include the switching costs of firms in the industry, the presence ofavailable substitutes, and the supply purchase cost relative to substitutes.
Bargaining power of customers: This force looks at the power of the consumer toaffect pricing and quality. Consumers have power when there aren't many of them,but lots of sellers, as well as when it is easy to switch from one business's productsor services to another. Buying power is low when consumers purchase products insmall amounts and the seller's product is very different from any of its competitors.
Threat of new entrants: This force examines how easy or difficult it is forcompetitors to join the marketplace in the industry being examined. The easier it isfor a competitor to join the marketplace, the greater the risk of a business's marketshare being depleted. Barriers to entry include absolute cost advantages, access toinputs, economies of scale and well-recognized brands.

Company Analysis - Fundamental Analysis
Threat of substitute products or services. This force studies how easy it is for
consumers to switch from a business's product or service to that of a competitor. Itlooks at how many competitors there are, how their prices and quality compare tothe business being examined and how much of a profit those competitors areearning, which would determine if they have the ability to lower their costs evenmore. The threat of substitutes are informed by switching costs, both immediate andlong-term, as well as a buyer's inclination to change.

Management – Company analysis
a) A company relies upon management to steer it towards financial success.
b) It makes sense - even the best business model is doomed if the leaders of thecompany fail to properly execute the plan.
c) In order to execute a business plan, a company requires top-quality management.
d) Investors might look at management to assess their capabilities, strengths andweaknesses. Even the best-laid plans in the most dynamic industries can go to wastewith bad management.
Track record
a) A good way to get a feel for management capability is to check and see howexecutives have done at other companies in the past.
b) You can normally find biographies of top executives on company web sites.
c) Identify the companies they worked at in the past and do a search on thosecompanies and their performance.
Management – Company analysis
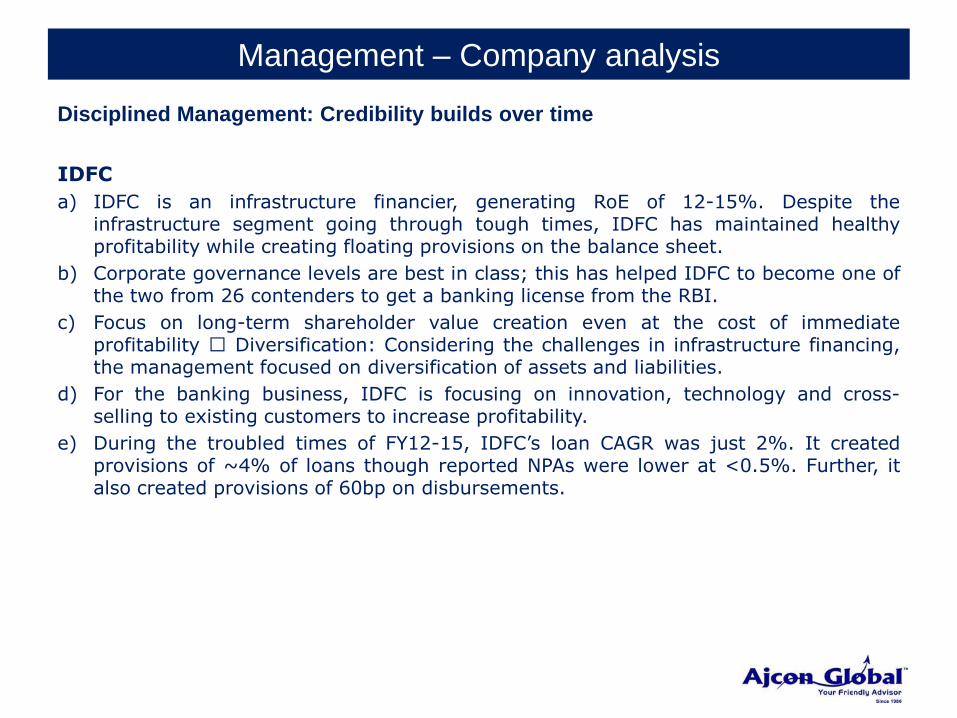
Disciplined Management: Credibility builds over time
IDFC
a) IDFC is an infrastructure financier, generating RoE of 12-15%. Despite theinfrastructure segment going through tough times, IDFC has maintained healthyprofitability while creating floating provisions on the balance sheet.
b) Corporate governance levels are best in class; this has helped IDFC to become one ofthe two from 26 contenders to get a banking license from the RBI.
c) Focus on long-term shareholder value creation even at the cost of immediateprofitability Diversification: Considering the challenges in infrastructure financing,the management focused on diversification of assets and liabilities.
d) For the banking business, IDFC is focusing on innovation, technology and cross-selling to existing customers to increase profitability.
e) During the troubled times of FY12-15, IDFC‟s loan CAGR was just 2%. It createdprovisions of ~4% of loans though reported NPAs were lower at <0.5%. Further, italso created provisions of 60bp on disbursements.

Management – Company analysis
Disciplined Management: Credibility builds over time
Indusind Bank
a) IndusInd Bank (IIB) is a classic case of management change (Mr Sobti and his teamtook charge in 2008) scripting a turnaround in fortunes.
b) The management targets to be a forerunner in terms of profitability (RoA best inclass at 1.9% in FY15; up from 35bp in FY08), productivity (profit/employee up 4xover FY08-15), and efficiency (C/I ratio down from 68% in FY08 to 46%).
c) In the current Three-year planning cycle (2014-17), management plans to: a) Focuson loan growth at double that of industry by capitalizing on niche areas (vehicleloans). b) Build at least 15 home markets (5%+ branch share) to sustain savingsaccounts.
d) Management plans to focus on high yielding retail loan portfolio by capitalizing onstrong presence in vehicle loans and addition of new retail products.
e) Increase share of low cost CASA deposits (15.5% in FY08 to 34%) through focusedbranch expansion and improving brand image.
f) Gain forex MS (from 1% in FY08 to ~4%) from state-owned banks, driven by lowerturnaround time.

Management – Company analysis
Disciplined Management: Credibility builds over time
ICICI Bank
a) Since Ms Kochhar took charge in 2009, ICICI Bank (ICICIBC) has focused onimproving profitability (16% PAT CAGR over FY10-15), with structural changes inALM profile (helping NIM to expand ~100bp) and strong cost control (700bp declinein cost-to-income ratio to 37%, the lowest since 2002), leading to RoA improvement(from 1% in FY09 to 1.6%).
b) Growth consolidation and profit focus has helped improve subsidiaries‟ performance.From a loss of INR6.7b in FY08, they posted a PAT of INR33.7b in FY15.
c) Focus on subsidiaries is now bearing fruits - have now started throwing back capital
d) Healthy retail loan growth: Retail loans have grown at a CAGR of 24% over FY13-15. The share of the retail segment has increased from 37% in FY12 to 42% inFY15. By moderating growth in loans to sensitive sectors (3% CAGR over FY13- 15),ICICIBC has gradually lowered its exposure to these sectors to ~16%.
e) ICICIBC has regularly repatriated capital (USD2b till date) from overseassubsidiaries and increased dividend payout from domestic subsidiaries (INR29b overFY13-15).
f) Focus on operating leverage: Employees/branch have halved to 16 since 2008,CASA ratio has doubled, and share of retail fees has grown from 33% in 2011 to52%.

Management – Company analysis
Disciplined Management: Credibility builds over time
Tata Motors
a) Recently, Mr. Cyrus Mistry took over as Chairman of Tata Motors (TTMT). Further,TTMT appointed Mr. Mayank Pareek (ex-Marketing Head of Maruti Suzuki) as Head –PV Business, to revive its lost franchise in PVs.
b) Since TTMT‟s acquisition of JLR, it has been investing aggressively in buildingcapabilities in products, capacity and global footprint.
c) India business has seen significant pressure on balance sheet due to continuedinvestments in products, impacting medium-term capital efficiency.
d) Focus on products: JLR has been focusing on filling gaps in its product portfolio.Similarly, India Passenger Vehicles business is focused on correcting under-investment in products.
e) Focus on modular platform: JLR is focused on improving its platform efficiency byincreasing model to platform ratio, in turn reducing capital intensity.
f) Focus on diversification of manufacturing footprint: JLR‟s manufacturing base isentirely located in UK, resulting in high cost structure and forex volatility onimports.

Management – Company analysis
1) Management
Succession Plan
a) Succession Planning is a process for identifying and developing internal people withthe potential to fill key business leadership positions in the company.
b) Succession Planning increases the availability of experienced and capable employeesthat are prepared to assume these roles as they become available.
c) It is a 5 step process which include identification of critical positions, identification ofcompetencies, identification of succession management strategies, document andimplement succession business plan, and evaluate effectiveness.

By
Mr. Akash Jain, MBA (Financial Markets)
Ajcon Research Team
Ajcon Global Services Ltd.
(SEBI Registered Research Analyst)
Fundamental Analysis

Valuation Techniques
1) Earnings basis
a) The routine and quick method used is to divide the Market Price by the latestpublished Earnings Per Share (EPS) to give the P/E ratio. You relate this to theIndustry average P/E ratio to determine if the share is undervalued or overvalued asthe case may be
b) Market Price: EPS * P/E Ratio or Market Price = EPS/Earning yield
c) Market Price/EPS = Actual P/E, Projected EPS* Industry P/E = Projected Price
d) General case: If actual P/E is lower than the Industry P/E, the scope for appreciationis computed at Projected Price
e) For a fair value, forecast of future earnings is necessary. A variation is of course tomark the Market Price against future EPS to give a more accurate P/E assessment.

Valuation Techniques
2) Discounted Cash Flow Method
a) Valuation using discounted cash flows is a method for determining the current valueof a Company OR Company‟s equity using future cash flows adjusted for time value.The future cash flow set is made up of the cash flows within the determined forecastperiod and a continuing value that represents the cash flow stream after the forecastperiod.
b) There are actually two types of DCF models: "free cash flow to equity" and "cash flowto the firm." The first involves counting just the cash flow available to shareholdersand is a bit easier to understand.
c) This method has gained general acceptability in recent years as it concerns itself withthe timing of cash flows and the cost of capital to give a fairer and truer valuation.
d) A widely practiced method in negotiating Acquisition Deals. It takes into account timevalue of cash flows and the cost of capital, both real life factors in Investmentdecisions.
e) It is a suitable method during an acquisition with an intention of making furtherinvestments to improve profits. It establishes the maximum price the buyer will bewilling to pay for the Target Company.

Valuation Techniques
2) Enterprise Value
a) Enterprise Value (EV) = Market Capitalisation + Debt – Cash or Equivalents
b) Market Capitalisation is arrived at by simply multiplying the market price by thenumber of outstanding equity shares. When you buy out the full Company at themarket capitalisation you also assume responsibility of the debt which adds to yourcost of buying. This cost is reduced by any cash or Cash Equivalents that you canuse.
c) The enterprise value (EV) measures the value of the ongoing operations of acompany. It attempts to measure the value of a company's business instead ofmeasuring the value of the company. It is the measure for calculating how much itwould cost to buy a company‟s business free of its debts and liabilities. It can bethought of as a theoretical takeover price of a company‟s business.
d) The enterprise value is used as an alternative to market capitalization. It is a moreaccurate estimate of the takeover price of a company than the market capitalization.
e) This tool useful to identify undervalued companies that could be a possible takeovertarget. This happens when the EV is significantly below the Value of the Company‟sassets.

Valuation Techniques
3) EV/EBITDA
a) The division of EV by EBITDA gives a good measure of value. It estimates thenumber of years in which the business will repay its acquisition cost to the buyerthrough its earnings. For example, if one is interested in buying a firm at an EV of Rs1,000 crore and its annual earning (EBITDA) is Rs 200 crore, the firm will repay itsentire acquisition cost to the buyer in cash in just five years.
b) The EV/EBITDA ratio is a better measure than the P/E ratio because it is notaffected by changes in the capital structure. Consider a scenario in which a companyraises equity finance and uses these funds to repay the loans. This will usually resultin a lower earnings per share (EPS) and therefore a higher P/E ratio. But theEV/EBITDA ratio will not be affected by this change in capital structure. This meansthat the EV/EBITDA ratio cannot be manipulated by the changes in capital structure.Another benefit of the EV/EBITDA ratio is that it makes possible fair comparison ofcompanies with different capital structures.
c) Another positive aspect to the EV/EBITDA ratio is that it removes the effect ofnon-cash expenses such as depreciation and amortization. These non-cashitems are of less significance to the investors because they are ultimately interestedin the cash flows.

Valuation Techniques
3) EV/EBITDA
The EV/EBITDA ratio is not usually appropriate for the comparison of companies indifferent industries. Capital requirements of other industries are different. Therefore,the EV/EBITDA ratio may not give reliable conclusions when comparing differentindustries.
a) How it differs from P/E ratio?
a) The PE ratio measures the money that investors are willing to pay for every rupee acompany earns. It is a metric used for valuing the firm's equity as it takes intoaccount the residual earning available to equity shareholders.
b) Though widely used, PE ratio has its limitations as it cannot be used for valuing lossmaking companies and fails to overcome the distortions caused by differentaccounting policies and capital structures.
c) The EV/EBITDA ratio is better as it values the worth of the entire company. PE ratiogives the equity multiple, whereas EV/EBITDA gives the firm multiple. The latter isbased on the notion of most successful investors, who propose that equity investingis not just buying/selling shares, but buying/selling the business.

Identifying Great, Good and Gruesome companies
Criteria Great Good Gruesome
Nature of Business Stable business. i.e. no rapid or continuous change
Subject to moderate change
Business likely to have rapid changes
Competitive Advantage
High and rising long term competitive advantage from brand/lowest – cost production
Steady competitive advantage
Low or nocompetitiveadvantage
Pricing Power High pricing power Moderate pricing
powerPricing power absent
Management Low dependence on greatness of management
Management, key success factor
High dependence on management
Growth Typically moderate
growth; high growthrates a rarity
Moderate-to-high
growth rateTypically high growth
rates
Capital Intensity Low capital intensity,high level of intangibleassets
Moderate-to-high capital intensity
Very high capital intensity

Identifying Great, Good and Gruesome companies
Criteria Great Good Gruesome
RoE Very high and rising RoE Stable and attractive RoE
Low/falling RoE
Dividend Payout Typically, high dividend payout
Reasonable dividend payout
Low or zero dividendpayout
Examples Nestle, GSK Consumer, Gillete, Eicher Motors, Gruh Finance, Page Industries
HDFC Bank, Larsen and Toubro
Tata Tele, Hindustan Motors, Arvind

Strengths of Fundamental Analysis

Strengths – Fundamental Analysis
Long term trends
a) Fundamental analysis is good for long-term investments based on very long-term trends.The ability to identify and predict long-term economic, demographic, technological orconsumer trends can benefit patient investors who pick the right industry groups orcompanies.
Value spotting
a) Sound fundamental analysis will help identify companies that represent a good value.Some of the most legendary investors think long-term and value. Graham and Dodd,Warren Buffett and John Neff are seen as the champions of value investing. Fundamentalanalysis can help uncover companies with valuable assets, a strong balance sheet, stableearnings, and staying power.
Business Acumen
a) One of the most obvious, but less tangible, rewards of fundamental analysis is thedevelopment of a thorough understanding of the business.
b) After such painstaking research and analysis, an investor will be familiar with the keyrevenue and profit drivers behind a company. Earnings and earnings expectations can bepotent drivers of equity prices.
c) A good understanding can help investors avoid companies that are prone to shortfalls andidentify those that continue to deliver. In addition to understanding the business,fundamental analysis allows investors to develop an understanding of the key valuedrivers and companies within an industry.
d) A stock's price is heavily influenced by its industry group. By studying these groups,investors can better position themselves to identify opportunities that are high-risk (tech),low-risk (utilities), growth oriented (computer), value driven (oil), non-cyclical (consumerstaples), cyclical (transportation) or income-oriented (high yield).

Weaknesses of Fundamental Analysis

Weakness – Fundamental Analysis
Time constraints
a) Fundamental analysis may offer excellent insights, but it can be extraordinarily time-consuming. Time-consuming models often produce valuations that are contradictoryto the prevailing current price . When this happens, the analyst basically claims thatthe whole street has got it wrong. This is not to say that there are not misunderstoodcompanies out there, but it is quite brash to imply that the market price is wrong.
Industry/Company Specific
a) Valuation techniques vary depending on the industry group and specifics of eachcompany. For this reason, a different technique and model is required for differentindustries and different companies. This can get quite time-consuming, which canlimit the amount of research that can be performed.
b) A subscription-based model may work great for an Internet Service Provider (ISP),but is not likely to be the best model to value an oil company.

Key mantra - Fundamental Analysis

Key Mantra – Fundamental Analysis
Price is not value
a) It is essential to differentiate value and price. The concept of price has theadvantages of availability, transparency and frequent changes. Functioning marketsand rapid reporting mean that we can all agree on the price of a security. Priceschange constantly, and those changes are updated instantly on a variety of pricingsources, widely available to professional and personal investors alike. The problemwith prices, is that they can be quite volatile.
b) Value, on the other hand, has the opposite attributes of price. Value is opaque,unavailable and stable, but it enjoys less volatility. Whereas an investor can watchthe price of a stock change throughout the course of a trading session, the value ofthe underlying company is only derived through patient and careful analysis and istherefore a far more robust notion than price.
c) A value can be defined as the worth of the business. A stock price is what isperceived by the investor as the value of the business but may differ in actual terms.To understand the real worth of the business it is important to assess the Intrinsicvalue of the business which is dependent on several factors.
d) For eg: One may see sudden rise in the stock price when being bid by an acquirer,who generally has to pay something closer to its intrinsic value. Investors shouldunderstand that the share price is like the tip of iceberg – you can see it, but youhave no idea how big or small the iceberg is below the surface unless you put a divesuit.

Key Mantra – Fundamental Analysis
Price is not value
a) The true value of a business is known as its „intrinsic‟ value and is difficult, thoughnot impossible, to ascertain.
b) Most investors preoccupy themselves with measures of „relative‟ value whichcompare a valuation ratio for the company (perhaps the price-to- earnings, price-to-book or price-to-sales ratio) with its industry peer group or the market as awhole. Inevitably though, something that appears to be relatively cheap on that basiscan still be overvalued in an absolute sense, and that‟s bad news for the ValueInvestor who prefers to tie his sense of value to a mast in stormy waters. Intrinsicvaluation looks to measure a company on its economics, assets and earningsindependently of other factors.
• As Ben Graham has observed: “the price is what you pay, value is what you get”, meaning that big swings in the market don’t necessarily mean big
swings in value.

Key Mantra – Fundamental Analysis
Investors must know what they own
a) To avoid any risk of permanent impairment to capital, the investor should actuallyassess the risk and value which requires deep study of the Company.
b) There are at least two strong implications that follow from the idea of knowing whatyou own. First, it does not make sense to invest in securities or portfolios where youdon‟t have visibility into the investment rationale, process or holdings. Whenperformance is weak and very little is known about the underlying causes, what is aninvestor to do? Buy more because it‟s cheap? Sell before it falls further? Ignorance ofthe underlying fundamentals leaves only emotion as a driver of action, and hope andfear make for poor investment strategies. We prefer to rely on analysis andconviction when others are buying and selling based on emotion.
c) Second, holding too many investments prevents an investor from knowing them wellenough. Portfolios should be appropriately diversified, but they can easily becomeover-diversified, thereby introducing the risk of not acquiring knowledge of andconviction in what is owned. Maintaining fewer investments allows investors to digdeeper into each one, which will serve them well when price volatility inevitably teststheir convictions.

Key Mantra – Fundamental Analysis
Markets are always irrational
a) Market prices are inefficient because of investors‟ behavioral biases, exuberance andirrationality which drive prices away from fair value.
b) Don’t panic –
a) People tend to invest based on psychological biases rather than analysis of marketfundamentals. They buy when the price of a particular stock is rising or when thevalue of the market as a whole appears to be rising. On the flip side, when the priceof a particular stock is declining or when the value of the market as a whole appearsto be falling, myopic loss aversion forces most people to sell their stocks. Instead ofkeeping their losses on paper and waiting for the market to change directions, theysell.
b) The early 2000‟s tech bubble and the mid-2000‟s housing bubble were fueled bydramatic levels of overinvestment that bid up the prices of tech stocks and realestate beyond what the underlying companies and properties were worth. When theunsustainable highs began to fall, investors panicked and a crash ensued, causingsome stocks to be priced closer to their true values and others to fall below their truevalues.

Key Mantra – Fundamental Analysis
Herd behavior is common, hence – “Stand out”a) The tendency of human beings to be swayed by crowds has been long documented
and used by tyrants over time to impose their will on us. The desire to be part of thecrowd is due to more than peer pressure. While there is a tendency to describe herdbehavior as irrational, it is worth noting that you can have the same phenomenaoccur in perfectly rational markets through a process called information cascade.
b) All to often, in investing, investors at early stages in the process (initial publicoffering) pile into specific initial public offerings and push their prices up. Other initialpublic offerings are ignored and languish at low prices. It is entirely possible that thefirst group of stocks will be overvalued, while the latter are undervalued. Since herdbehavior is made worse by rumors by the spreading of rumors, you could argue thatthe coming together of the available data and news channels has made it morepossible for herd behavior to spend and not less.
• The madness of growth
a) Is the name even important? This is not a one off case. Look for any company –good, bad or ugly. If the company shows a couple of quarter of growth, the stockprice shoots up with no link to valuation, quality or sanity. On the other hand if themusic stops, even for 1-2 quarters, the response is brutal. The herd which rushed inblindly, now heads for the exit.
b) I don‟t think this can be called investing – it‟s a mad hunt for growth.

Key Mantra – Fundamental Analysis
Preservation of Capital
a) Preservation of capital should be the highest priority goal of asset allocation
investing. Unfortunately, despite a great deal of lip service, preservation of capital isone of the most neglected aspects of most asset allocation plans.
b) Warren Buffett‟s „First Rule of Investing‟ is never lose money. Rule No. 2 is neverforget rule No. 1. The priority of managing a portfolio is to minimize losses and try toavoid exposure to equities as much as possible in a correction.
c) The bear markets of 2000-02 and 2008-09 have proven investors accept too muchrisk and most of the time do not understand compounding and the importance ofexponential growth. This is a failure of the financial services industry and an excellentreason for investors to consider self-directed investing.
d) The laws of compounding make risk management a crucial part of investmentmanagement. If an investor loses 50% of a portfolio, a 100% gain is required to getback to break even. An investor that loses 10% of a portfolio requires only an 11%gain to get back to break even. Losing a large portion of a portfolio can wipe outmany years of positive gains

Key Mantra – Fundamental Analysis
Only buy with “Margin of Safety”a) Margin of safety is achieved when securities are purchased at prices sufficiently
below underlying value to allow for human error, bad luck or extreme volatility. Inother words, once you are certain that you have a fair estimate of a share‟s intrinsicvalue, you must only buy the share when you are offered a price at such a discountto that value that you are safe from all unknowns.
b) The difference between the price paid and intrinsic value is margin of safety. For thedisciplined investor, volatility is an essential contributor to investment success. Pricevolatility creates the opportunity for a patient investor to acquire a security at anappropriate discount to intrinsic value. That discount creates a margin ofsafety should unanticipated changes occur, either at the level of the company orissuer or in the broader investment environment.
c) At the same time, upside price volatility requires the discipline to sell securities –even ones with good fundamentals – if a rally pushes the price beyond the intrinsicvalue of the asset.
d) As Warren Buffett once opined “When you build a bridge, you insist it can carry30,000 pounds, but you drive 10,000 pound trucks across it. In the same way, youdon‟t try and buy businesses worth US$ 83 million for US$ 80 mn. You leave yourselfan enormous margin.

Key Mantra – Fundamental Analysis
Big potential in small names
a) Everyone wants to invest in the next big thing or even the current big thing. Butthat‟s when herd mentality kicks in and ruins everyone‟s chances.
b) Look for companies that might sell for less than they‟re worth because they‟re underthe radar. Small cap stocks, foreign stocks, and any other stocks that aren‟t in theheadlines or aren‟t household names sometimes offer great potential but don‟t getthe attention they deserve.

Pitfalls to avoid – Fundamental Analysis
a) Overlooking Extraordinary Gains or Losses
Some years, companies will experience unusually large losses or gains from events such asnatural disasters, corporate restructuring or unusual lawsuits and will report these on theincome statement under a label such as “extraordinary item – gain” or “extraordinary item– loss.” When making your calculations, it is important to remove these financial anomaliesfrom the equation to get a better idea of how the company might perform in an ordinaryyear.
b) Listening to Your Emotions
Once you have purchased the stock, you may be tempted to sell it if the price falls. You
must remember that to be a value investor means to avoid the herd-mentality investmentbehaviors of buying when a stock‟s price is rising and selling when it is falling.
c) Not Comparing Apples to Apples
• Comparing a company‟s stock to that of its competitors is one way value investors analyze their potential investments. However, companies differ in their accounting policies in ways that are perfectly legal. When you‟re comparing one company‟s P/E ratio to another‟s, you have to make sure that EPS has been calculated the same way for both companies.

1) Wealth Creation is the process by which a company enhances the market value
of the capital entrusted to it by its shareholders.
2) It is a basic measure of success for any commercial venture. Wealth Creation is
achieved by the rational actions of a company in a sustained manner
3) Every year, legendary investor Warren Buffett personally writes the Chairman’s
annual letter to shareholders of his diversified company, Berkshire Hathaway
Inc.
4) His 2007 letter has a section on “Businesses – The Great, the Good and the
Gruesome", where he discusses what kind of companies Berkshire likes and
what it wishes to avoid.
Wealth creation through capital markets

Buffett equates the Great, the Good and the Gruesome companies to threetypes of bank savings accounts, where the interest rate is RoE (return onequity).
He says, “Think of three types of savings accounts. The Great one pays anextraordinarily high interest rate that will rise as the years pass. The Goodone pays an attractive rate of interest that will be earned also on depositsthat are added. Finally, the Gruesome account both pays an inadequateinterest rate and requires you to keep adding money at those disappointingreturns.”
Wealth creation

The capital appreciation via Infosys shares is out of this world. But, let’s go down the history lane to find out how it all originated
a) In 1982, Infosys opened an office in Bangalore which soon became its headquarters.
b) Infosys made an initial public offer at Rs. 95 a share in February 1993 and was listed on stock exchanges in India in June 1993
c) Interestingly, Infosys IPO was undersubscribed but Morgan Stanley bailed it put by picking up 13% of equity at the offer price of Rs. 95 per share
d) The trading opened at Rs.145 a share, almost a 60% premium on the day of listing.
e) The share price surged to Rs. 8,100 by 1999 making it the costliest share on the market at the time. 6 years and the share multiplied 85 times
f) According to Forbes magazine, since listing on the Bombay Stock Exchange till the year 2000, Infosys’ sales and earnings compounded at more than 70% a year.
g) Your head spinning as yet!! Wait before I tell you the numbers that are hair raising.
h) Infosys is currently trading at ~37 times of its IPO price – But more than that it has given handsome dividends quarter on quarter. And don‟t forget the bonuses and splits that this share has gone through.
Story of Infosys

By harnessing the power of your logic and combining it with a bit of
the business study, you can make enormous wealth too in stock
markets. All you have to do is create enough discipline and have
the required conviction in your mind.
Worst times would always provide the chances of making best of
returns in the better period.
Key takeaways

Disclaimer
Ajcon Global Services Ltd. is a fully integrated investment banking, merchant banking, corporate advisory, stock broking,commodity and currency broking. Ajcon Global Services Ltd. research analysts responsible for the preparation of the researchreport may interact with trading desk personnel, sales personnel and other parties for gathering, applying and interpretinginformation.
Ajcon Global Services Ltd. is a SEBI registered Research Analyst entity bearing registration Number INH000001170 under SEBI(Research Analysts) Regulations, 2014.
Individuals employed as research analyst by Ajcon Global Services Ltd. or their associates are not allowed to deal or trade insecurities that the research analyst recommends within thirty days before and five days after the publication of a research reportas prescribed under SEBI Research Analyst Regulations.Subject to the restrictions mentioned in above para,We and our affliates, officers, directors, employees and their relative may:(a) from time to time, have long or short positions acting as a principal in, and buy or sell the securities or derivatives thereof, ofCompany mentioned herein or (b) be engaged in any other transaction involving such securities and earn brokerage.
Ajcon Global Services Ltd. or its associates may have commercial transactions with the Company mentioned in the research report with respect to advisory services.
The information and opinions in this report have been prepared by Ajcon Global Services Ltd. and are subject to change withoutany notice. The report and information contained herein is strictly confidential and meant solely for the selected recipient andmay not be altered in any way, transmitted to, copied or distributed, in part or in whole, to any other person or to the media orreproduced in any form, without prior written consent of Ajcon Global Services Ltd. While we would endeavour to update theinformation herein on a reasonable basis, Ajcon Global Services Ltd. is under no obligation to update or keep the informationcurrent. Also, there may be regulatory, compliance or other reasons that may prevent Ajcon Global Services Ltd. from doing so.This report is based on information obtained from public sources and sources believed to be reliable, but no independentverification has been made nor is its accuracy or completeness guaranteed. This report and information herein is solely forinformational purpose and shall not be used or considered as an offer document or solicitation of offer to buy or sell or subscribefor securities or other financial instruments. Though disseminated to all the customers simultaneously, not all customers mayreceive this report at the same time. Ajcon Global Services Ltd. will not treat recipients as customers by virtue of their receivingthis report. Nothing in this report constitutes investment, legal, accounting and tax advice or a representation that anyinvestment or strategy is suitable or appropriate to your specific circumstances. The securities discussed and opinions expressedin this report may not be suitable for all investors, who must make their own investment decisions, based on their owninvestment objectives, financial positions and needs of specific recipient. This may not be taken in substitution for the exercise ofindependent judgment by any recipient. The recipient should independently evaluate the investment risks. The value and returnon investment may vary because of changes in interest rates, foreign exchange rates or any other reason. Ajcon Global ServicesLtd. accepts no liabilities whatsoever for any loss or damage of any kind arising out of the use of this report. Past performance isnot necessarily a guide to future performance. Investors are advised to see Risk Disclosure Document to understand the risksassociated before investing in the securities markets. Actual results may differ materially from those set forth in projections.Forward-looking statements are not predictions and may be subject to change without notice.

Ajcon Global Services Ltd. or its associates might have managed or co-managed public offering of securities for the subjectcompany or might have been mandated by the subject company for any other assignment in the past twelve months.
Ajcon Global Services Ltd. encourages independence in research report preparation and strives to minimize conflict inpreparation of research report. Ajcon Global Services Ltd. or its analysts did not receive any compensation or other benefits fromthe companies mentioned in the report or third party in connection with preparation of the research report. Accordingly, neitherAjcon Global Services Ltd. nor Research Analysts have any material conflict of interest at the time of publication of this report.
It is confirmed that Akash Jain – MBA (Financial Markets) or any other Research Analysts of this report has not received anycompensation from the company mentioned in the report in the preceding twelve months. Compensation of our ResearchAnalysts is not based on any specific merchant banking, investment banking or brokerage service transactions.
Ajcon Global Services Ltd. or its subsidiaries collectively or Directors including their relatives, Research Analysts, do not own 1%or more of the equity securities of the Company mentioned in the report as of the last day of the month preceding thepublication of the research report.It is confirmed that Akash Jain – MBA (Financial Markets) research analyst or any other Research Analysts of Ajcon Global do notserve as an officer, director or employee of the companies mentioned in the report.
Ajcon Global Services Ltd. may have issued other reports that are inconsistent with and reach different conclusion from theinformation presented in this report.
Neither the Research Analysts nor Ajcon Global Services Ltd. have been engaged in market making activity for the companiesmentioned in the report.
We submit that no material disciplinary action has been taken on Ajcon Global Services Ltd. by any Regulatory Authorityimpacting Equity Research Analysis activities.
Disclaimer