intended f - Forsideprojekter.aau.dk/projekter/files/259868149/Michaela_Mihaylova_Master... · vi...
100
Semester: ICTE4 Title: System for Reducing the Risk of Mortality due to Ischemic Heart Disease among the Elderly Project Period: 1 February 2017 – 30 June 2017 Semester Theme: Master Thesis Supervisor(s): Per Lynggaard Project group no.: 4SER 4.8 Members (do not write CPR.nr.): Michaela Mihaylova Mihaylova Pages: 82 Finished: 8 June 2017 Abstract: The world’s population is currently experiencing a trend towards ageing. People now live longer than ever before and it is expected that by 2050 one out of every five people will be at least 60-years-old. Respectively, of all age groups senior citizens experience the highest mortality rates. Among the global leading causes of death, the foremost is Ischemic Heart Disease. The focus of the current Thesis is to develop a system – hereafter referred to as Vixi - that would aid in reducing the risk of death due to the aforementioned ailment. In order to do so, research is conducted into the nature of Ischemic Heart Disease, specifically the exact conditions that can lead to a fatal outcome, along with their pathology, as well as the technologies that can detect them. From the discovered diagnostic tools, the non- invasive ones are extracted so as to be applied within the service – these are preferred because the Vixi is intended for continuous daily monitoring. The Vixi system is based on the utilization of the following two devices: the smartwatch and the wearable ECG. The data gathered via their various sensors serves as input for Vixi’s main algorithm. The aforementioned algorithm is designed by the author; it can interpret sensor and user input in order to determine at any given moment whether its user is experiencing an ischemia-induced cardiac event that can lead to a fatal outcome. Additionally, within the current report a proposal for the accompanying system architecture is also provided. Aalborg University Copenhagen A.C. Meyers Vænge 15 2450 København SV Semester Coordinator: Henning Olesen Secretary: Maiken Keller When uploading this document to Digital Exam each group member confirms that all have participated equally in the project work and that they collectively are responsible for the content of the project report. Furthermore each group member is liable for that there is no plagiarism in the report.
Transcript of intended f - Forsideprojekter.aau.dk/projekter/files/259868149/Michaela_Mihaylova_Master... · vi...
Semester: ICTE4
Title:
System for Reducing the Risk of Mortality due to Ischemic
Heart Disease among the Elderly
Project Period: 1 February 2017 – 30 June 2017
Semester Theme:
Master Thesis
Supervisor(s):
Per Lynggaard
Project group no.:
4SER 4.8
Members
(do not write CPR.nr.):
Michaela Mihaylova Mihaylova
Pages: 82
Finished: 8 June 2017
Abstract: The world’s population is currently experiencing a
trend towards ageing. People now live longer than
ever before and it is expected that by 2050 one out of
every five people will be at least 60-years-old.
Respectively, of all age groups senior citizens
experience the highest mortality rates. Among the
global leading causes of death, the foremost is
Ischemic Heart Disease. The focus of the current
Thesis is to develop a system – hereafter referred to
as Vixi - that would aid in reducing the risk of death
due to the aforementioned ailment. In order to do so,
research is conducted into the nature of Ischemic
Heart Disease, specifically the exact conditions that
can lead to a fatal outcome, along with their
pathology, as well as the technologies that can detect
them. From the discovered diagnostic tools, the non-
invasive ones are extracted so as to be applied within
the service – these are preferred because the Vixi is
intended for continuous daily monitoring.
The Vixi system is based on the utilization of the
following two devices: the smartwatch and the
wearable ECG. The data gathered via their various
sensors serves as input for Vixi’s main algorithm.
The aforementioned algorithm is designed by the
author; it can interpret sensor and user input in order
to determine at any given moment whether its user is
experiencing an ischemia-induced cardiac event that
can lead to a fatal outcome. Additionally, within the
current report a proposal for the accompanying
system architecture is also provided.
Aalborg University Copenhagen A.C. Meyers Vænge 15 2450 København SV Semester Coordinator: Henning Olesen Secretary: Maiken Keller
When uploading this document to Digital Exam each group member confirms that all have
participated equally in the project work and that they collectively are responsible for the
content of the project report. Furthermore each group member is liable for that there is no
plagiarism in the report.
i
Table of Contents
1 Introduction ................................................................................................................................................................ 1
1.1 Background ....................................................................................................................................................... 1
1.2 Motivation .......................................................................................................................................................... 1
2 Problem Formulation ............................................................................................................................................. 3
2.1 Research Question .......................................................................................................................................... 3
2.2 Objectives ........................................................................................................................................................... 3
2.3 Delimitations .................................................................................................................................................... 4
3 Methodology ............................................................................................................................................................... 5
3.1 Qualitative and Quantitative Research .................................................................................................. 5
3.2 Primary and Secondary Research ............................................................................................................ 5
4 Ischemic Heart Disease .......................................................................................................................................... 7
4.1 Overview of the Human Vascular System ............................................................................................. 7
4.2 Ischemic Heart Disease ............................................................................................................................. 10
4.2.1 Angina ..................................................................................................................................................... 10
4.2.2 Acute Myocardial Infarction .......................................................................................................... 11
4.2.3 Sudden Cardiac Death ...................................................................................................................... 13
4.3 Overview of Ischemic Heart Disease and Accompanying Symptoms .................................... 14
5 State of The Art ....................................................................................................................................................... 16
5.1 Positioning Methods ................................................................................................................................... 16
5.1.1 Global Navigation Satellite Systems ........................................................................................... 16
5.1.2 NLOS Positioning Methods ............................................................................................................. 17
5.1.3 Indoor Positioning Methods .......................................................................................................... 19
5.2 Measuring an Electrocardiogram and Heart Rate .......................................................................... 20
5.2.1 Measuring an Electrocardiogram ................................................................................................ 20
5.2.2 Measuring Heart Rate ....................................................................................................................... 22
5.3 Fall Detection ................................................................................................................................................. 23
5.3.1 Existing Solutions ............................................................................................................................... 23
5.4 Smartwatch Capabilities ........................................................................................................................... 28
6 Analysis ...................................................................................................................................................................... 31
6.1 Integration of parameters to be measured Within the Intended devices ............................ 31
6.1.1 Detecting Alarming Pulse Patterns through a PPG .............................................................. 31
6.1.2 Diagnosing an AMI through an ECG ............................................................................................ 32
6.1.3 Vixi Devices and the User ................................................................................................................ 34
6.2 Elderly Survey ............................................................................................................................................... 34
6.2.1 Hypotheses ........................................................................................................................................... 35
ii
6.2.2 Contents and Results from the Survey ...................................................................................... 35
6.2.3 Revised Hypotheses .......................................................................................................................... 45
6.3 Expert Interview .......................................................................................................................................... 48
6.4 Scenarios ......................................................................................................................................................... 50
6.5 System Context Diagram ........................................................................................................................... 52
6.6 Use Cases ......................................................................................................................................................... 53
6.7 Requirements Specification ..................................................................................................................... 56
6.7.1 Functional Requirements ............................................................................................................... 57
6.7.2 Nonfunctional Requirements ........................................................................................................ 58
7 Design and Implementation .............................................................................................................................. 60
7.1 System Architecture ................................................................................................................................... 60
7.2 Algorithm for Detecting a Critical Event ............................................................................................ 63
7.2.1 Fall Detection Algorithm ................................................................................................................. 63
7.2.2 Sensor Thresholds ............................................................................................................................. 66
7.2.3 State Classification and Overall System Algorithm .............................................................. 68
7.3 Device Applications .................................................................................................................................... 71
7.3.1 Smartwatch Application .................................................................................................................. 72
7.3.2 Smartphone Application ................................................................................................................. 73
8 Testing........................................................................................................................................................................ 74
9 Discussion ................................................................................................................................................................. 76
10 Conclusion ........................................................................................................................................................... 79
11 Future Recommendations ............................................................................................................................. 80
11.1 Wearable ECG Variability ......................................................................................................................... 80
11.2 Include Personal Physicians as Stakeholders within the System ............................................ 80
11.3 Devise a Hospital Recommender System .......................................................................................... 81
11.4 Utilize Fall Detection Tools to Differentiate between Various Activities ............................. 82
12 Bibliography ....................................................................................................................................................... 83
iii
Table of Figures
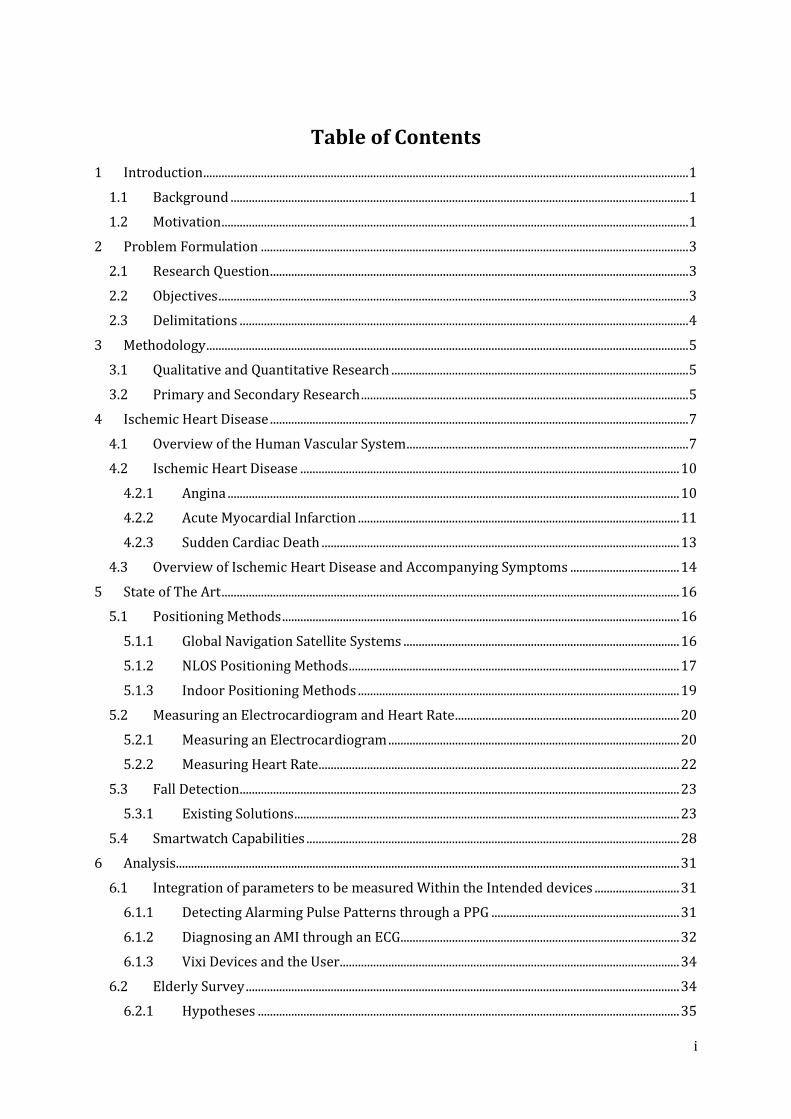
Figure 1: Vascular system[22] ...................................................................................................................................... 8 Figure 2: Anatomy of the human heart[25] ............................................................................................................ 9 Figure 3: Basic Cellular Network Configuration[71] ........................................................................................ 17 Figure 4: Indoor Positioning Methods[78] ........................................................................................................... 19 Figure 5: Overview of Fall Detection Algorithms[107] ................................................................................... 23 Figure 6: Blood Flow Rate Patterns[115] ............................................................................................................. 27 Figure 7: ECG complex[140] ....................................................................................................................................... 32 Figure 8: Cardiac conduction system workings reflected on ECG [141] .................................................. 33 Figure 9: Overview of devices in relation to the user's body ........................................................................ 34 Figure 10: Establishing particiant age .................................................................................................................... 36 Figure 11: Participant age distribution .................................................................................................................. 36 Figure 12: History of CVD ............................................................................................................................................ 37 Figure 13: History of CVD – answers ...................................................................................................................... 37 Figure 14: Gauging the participant's mindset ..................................................................................................... 38 Figure 15: Gauging the participant's mindset – answers ............................................................................... 38 Figure 16: Gauging the technical competency of the participant................................................................ 39 Figure 17: Gauging the technical competency of the participant– answers ........................................... 39 Figure 18: Verifying the participant's willingnes to wear a smartwatch................................................. 40 Figure 19: Verifying the participant's willingnes to wear a smartwatch – answers ........................... 40 Figure 20: Verifying the participant’s willingness to wear an ECG (1) ..................................................... 41 Figure 21: Verifying the participant’s willingness to wear an ECG (1) – answers ............................... 41 Figure 22: Verifying the participant’s willingness to wear an ECG (2) ..................................................... 42 Figure 23: Verifying the participant’s willingness to wear an ECG (2) – answers ............................... 42 Figure 24: Verifying the desired involvement of a physician ....................................................................... 43 Figure 25: Verifying the desired involvement of a physician – answers ................................................. 43 Figure 26: Identifying desired emergency contacts ......................................................................................... 44 Figure 27: Identifying desired emergency contacts – answers ................................................................... 44 Figure 28: System context diagram ......................................................................................................................... 52 Figure 29: Use case diagram ....................................................................................................................................... 54 Figure 30: System block diagram ............................................................................................................................. 60 Figure 31: Fall detection algorithm ......................................................................................................................... 64 Figure 32: Process accelerometer data .................................................................................................................. 64 Figure 33: Suspected fall .............................................................................................................................................. 65 Figure 34: State machine diagram ........................................................................................................................... 70 Figure 35: Smartwatch application class diagram ............................................................................................ 72 Figure 36: Smartphone application class diagram ............................................................................................ 73

iv
List of Tables
Table 1: Overview of ischemic heart disease....................................................................................................... 14 Table 2: Smartwatch features overview ................................................................................................................ 28 Table 3: Relevant answers according to group type ........................................................................................ 46 Table 4: Threshold overview ..................................................................................................................................... 68 Table 5: System states overview............................................................................................................................... 69 Table 6: State transition table .................................................................................................................................... 70
v
List of Abbreviations
ACS – Acute Coronary Syndrome
AMI – Acute Myocardial Infarction
ATL - Arrhythmia Time Limit
AV – Atrioventricular
BDS - BeiDou Navigation Satellite System
BTS - Base Transceiver Station
CPR - Cardiopulmonary Resuscitation
CVD – Cardiovascular Disease
ECG – Electrocardiogram
EENA - European Emergency Number Association
FDMA - Frequency Division Multiple Access
GLONASS - Global Navigation Satellite System
GNSS - Global Navigation Satellite Systems
GPS - Global Positioning System
HCL - Higher Count Limit
HHL - Higher Heart Limit
IHD – Ischemic Heart Disease
LCL - Lower Count Limit
LFT - Lower Fall Threshold
LHL - Lower Heart Limit
LOS - Line-of-sight
MI - Myocardial Infarction
MS - Mobile Station
NB - Node B
NLOS - Non-line-of-sight
NSTEMI – Non-ST-segment elevation myocardial infarction
vi
PEA - Pulseless Electrical Activity
PPG - Photoelectric Photoplethysmogram
RFID - Radio Frequency Identification
RHR – Resting Heart Rate
RSS - Received Signal Strength
RSSI - Received Signal Strength Indicator
RTT - Round Trip Time
SA – Sinoatrial
SCD – Sudden Cardiac Death
STEMI – ST-segment elevation myocardial infarction
TA - Timing Advance
TDMA - Time Division Multiple Access
UFT - Upper Fall Threshold
UML - Unified Modeling Language
UMTS - Universal Mobile Telecommunications System
UWB - Ultra Wideband
VF – Ventricular Fibrillation
VT – Ventricular Tachycardia
WCDMA - Wideband Code Division Multiple Access
1
1 INTRODUCTION
The current chapter is dedicated to providing an overall impression of the topic area of this
Master Thesis, as well as to present the reasoning behind the specifics of the problem
formulation that will be presented in the subsequent chapter.
1.1 BACKGROUND
We are now in the midst of an ageing global society. The population ageing trend is
due to two complementary phenomena: the first being a decline in fertility rates and the
second – reduced mortality[1]. As of 2015, the number of people aged 60 and over was 901
million[2]. Additionally, it has been estimated that by the year 2030 that number will rise to
the astounding 1.4 billion[2]. People now live longer and healthier than ever before; so much
so, that the elderly population itself is also growing older: in 2015 there were 125 million
people worldwide that were at least 80-years-old (what a United Nations report terms “oldest-
old”)[2]. By 2050 that number is expected to rise more than three-fold and reach 434
million[2]. To put this in perspective, it is expected that by 2050 twenty percent of the global
population will be at least 60-years-old.
As stated above, older people are becoming a significant part of the populace worldwide. This
demographic trend shines a light on life as a senior citizen, which comes with its own
challenges and difficulties. Perhaps the most severe consequence of the globally increasing
life expectancy is that it also naturally leads to changes in the age-specific mortality rates. The
average age at death has increased significantly over the last century, with demographic
studies confirming this being carried out in a number of countries, such as Canada[3],
France[3], Japan[3], the USA[3], Australia[4] and Finland[5]. Considering the results of these
studies, it can be seen that in the past decade, in a number of developed countries with
increased life expectancies, people that have died were mostly senior citizens – as the authors
of a 2001 report put it: “Today, death…is largely reserved for the elderly”[6]. That is why the
focus of the current Master Thesis will be on providing a system, which would be able to
potentially prolong and improve the lives of elderly people by helping to avoid life-
threatening events.
1.2 MOTIVATION
Given the purpose of the current Thesis that has been stated above, what has to be
addressed first is what ailments constitute the primary causes of death among senior citizens.
According to the latest data from the World Health Organization, the leading top five causes
of death globally, ranked from highest to lowest, are as follows: ischemic heart disease,
stroke, lower respiratory infections, chronic obstructive pulmonary disease, as well as trachea,
bronchus and lung cancers[7]. Of the aforementioned conditions, ischemic heart disease is the
topmost leading cause of death[8]. As such it can be considered to be the primary concern for
senior citizens and, therefore, it will also be the focus of the current Master Thesis.
If this matter were to be evaluated strictly based on the concept of risk, then attention
should be turned to what exactly constitutes risk. Although the concept of “risk” can be

2
somewhat fluid (ex. objective vs. perceived risk[9]), there is an overall agreement as to what
constitutes risk. In more general terms, risk has been accepted to have two dimensions -
probability and consequences. That is to say, the risk of a specific event/action/etc. is tied to
the uncertainty of said event/action/etc. ever occurring, as well the severity of its
consequences[10]. A certain event can have a very high probability of occurring but the
severity of its consequences - very low and vice versa[10]. Given the context of the current
Thesis, where the focus is on ischemic heart disease-related death, it can be acknowledged
that the risks that are to be reduced have a very high severity of their consequences. The same
cannot be said for the element of uncertainty – cardiovascular disease for the elderly can
include a wide variety of conditions, each one carrying its own level of uncertainty for every
individual person.
Having gone through the comprising elements of the concept of risk, it can be
concluded that in order to reduce a given risk, it would be necessary to reduce, either the
correlating probability, the severity of the accompanying consequences, or perhaps both.
Specifically for this Thesis, reducing the uncertainty of the risk would be expressed in the act
of prevention – individuals would be monitored in order to look out for any warning signs of a
life-threatening event. The alternative possibility is to reduce the severity of the
consequences, after such a critical event has taken place – in the given context that would
entail ensuring that the senior citizen in question promptly receives the necessary help as soon
as possible. This is a service function that could prove to be essential, since 40% of
individuals, aged 60 and over, live on their own[1]. This means that if they are physically or
mentally incapacitated, they might not be able to get the help that they need, in the expedient
manner that is necessary. Throughout the length of the current Thesis the goal will be to
mitigate, both the likelihood of a life-threatening event, as well as the harshness of its
aftermath.
3
2 PROBLEM FORMULATION
The current chapter will be dedicated to the establishing of a clear and concise research
question. Additionally, accompanying objectives will be provided, so as to guide the
completion of this Master Thesis towards answering the abovementioned research question.
The final section of the chapter is focused on formulating the delimitations that will be
implemented in order to further narrow down the focus of the current Master Thesis.
2.1 RESEARCH QUESTION
In this section the main research question, which would be answered by the conclusion of the
Thesis, is to be presented. It is the following:
How can a system be designed so that it would reduce the risk of death for elderly individuals
caused by ischemic heart disease?
Additionally, a number of sub-questions will be utilized in order to get a more detailed
perspective into the main research question:
1. What conditions constitute ischemic heart disease? Which of them can lead to a fatal
outcome?
2. What physiological or environmental parameters should be monitored in order to
detect the onset of the established conditions?
3. What devices should be utilized in order to measure the aforementioned parameters?
4. How should the system respond when an established condition has been detected?
5. How can the proposed solution be made to suit the needs of the target population
segment?
2.2 OBJECTIVES
The subsequent section of this chapter is dedicated to formulating the objectives that have to
be fulfilled along the course of the current Master Thesis and they are the following:
1. Find the top causes of death among the elderly, including their pathology and
symptoms.
2. Get in contact with professionals in the field of medicine or medically-relevant areas
so as to discuss and affirm the discoveries, regarding the physiological aspects of the
system.
3. Conduct research into the existing relevant algorithms and technologies that are
currently on the market.
4. Determine what devices would be necessary so as to fulfill the functionalities of the
system.
5. Get in contact with potential representatives of the target customer segment so as to
gain insight into their needs and interests regarding the service.
6. Produce a valid Requirements Specification.
7. Devise an algorithm for detecting critical ischemic heart disease-related conditions.
8. Provide a design of the necessary device applications.
9. Devise protocols for testing the designed system.

4
2.3 DELIMITATIONS
The purpose of this section of the chapter is to establish the delimitations, necessary for the
completion of the Thesis. Although the research question formulated at the beginning of the
present chapter, is delimitation in itself, considering further delimitations can be useful
towards the additional clarification of the direction that will be taken within this Master
Thesis. The delimitations set here are as follows:
1. Due to the overwhelming task of accounting for local specifics worldwide, the service
proposed in the current Thesis will be aimed at individuals from the Western world (in
the sense of similar socioeconomic backgrounds) - those that live within European
continent, the United States of America and Canada.
2. Within the limits of this Master Thesis the smartphone operating system to be taken
into consideration will be Android, given that it has the largest market share[11]. It
ought to be noted that in some Western countries, the market share of iOS-based
smartphones is comparable to that of Android[12][13].
3. Due to the previous delimitation, only Android Wear smartwatches will be taken into
consideration, given their compatibility with Android and iOS-based smartphones[14].
4. Due to time constraints the wearable ECG component will not be implemented as a
proof of concept.

5
3 METHODOLOGY
Research methodology can generally be divided into two main categories: qualitative research
and quantitative research. Additionally, research can be defined as primary or secondary. Due
to the fact that all of the aforementioned research types are to be utilized towards the
completion of the current Thesis, a brief overview of the differentiating methodologies will be
provided in the following sub-sections.
3.1 QUALITATIVE AND QUANTITATIVE RESEARCH
In general, research can be, either quantitative, or qualitative[15]. Qualitative research is used
for examining an individual’s (or a group’s) behavioral, cultural and societal nature[16]. The
results of qualitative research do not have numerical equivalents; rather they are more abstract
and immeasurable[16]. Qualitative research can take various forms – especially during
today’s digital age – including: interviews, focus groups, online chats, text messages, emails
and so on[16]. What should be noted is that, although qualitative research can involve the
personalized thoughts and opinions of interviewees (focus group participants, etc.), the
research itself must be objective and not subjected to the bias of the researcher[16].
Qualitative research is complementary to quantitative research.
Quantitative research presents information in a numerical manner[17]. Quantitative data, as
well as qualitative, are gathered in order to solve a problem but in the case of the former it is
“quantifiable”, i.e. it can be expressed through numbers and processed via mathematical
methods[17]. Although the two seem mutually exclusive, there are such situations where
qualitative information can be gathered in a quantitative manner[17]. An example would be
surveys – although the gathered data relies on personal opinions and beliefs, it can be
processed via various data analysis tools[17]. A part of this toolset is the element of statistics
– statistics are mathematically-based methods of data analysis[17].
3.2 PRIMARY AND SECONDARY RESEARCH
Primary research consists of a researcher collecting information firsthand[15]. It refers to the
type of research, where information is gathered directly from the real world by the
author/researcher him/herself[18]. Surveys are an example of primary research and they are
among the most often implemented[15]. They can be especially versatile in nature, thus
making them suitable for the variety of target audience[15]. Other instances of primary
research can include interviews, observations and analysis[18].
There are various interpretations of the term “secondary research”. In general, secondary
research is collected by third-party persons and for goals different than those of the one
performing the research[15]. Secondary research involves utilizing information that has
already been published by another searcher[19]. It is not one’s own original work but rather
the application of someone else’s research so as to contribute to one’s own.
Both the primary and secondary research methods have been utilized towards the fulfillment
of the current Thesis. Secondary research was heavily relied upon during the pre-study phase,
as well as for the completion of the Ischemic Heart Disease1 and State of The Art chapters.
1 Cross-references are market in blue.

6
Primary research has also been conducted within the confines of the Thesis. It has mainly
been conducted within the form of a survey and an interview. The aforementioned primary
research methods are introduced and discussed in sections 6.2 and 6.3 of the Analysis chapter.
7
4 ISCHEMIC HEART DISEASE
As it was mentioned in the Introduction chapter, the leading cause of death worldwide is
ischemic heart disease, which is a facet of cardiovascular disease. The current chapter is
dedicated to providing answers to the first two sub-questions in section 2.1 of the Problem
Formulation chapter, which are the following:
What conditions constitute ischemic heart disease? Which of them can lead to a fatal
outcome?
&
What physiological or environmental parameters should be monitored in order to detect the
onset of the established conditions?
Additionally, in order to provide context for the diseases being reviewed, the first section of
the current chapter will be dedicated to an introduction to the biological workings behind the
human cardiovascular system.
4.1 OVERVIEW OF THE HUMAN VASCULAR SYSTEM
A simplified diagram of the human vascular system (often noted as “circulatory system”) can
be seen on Figure 1. It is made up of the following: the heart, blood, blood vessels, neuro-
humoral influences, as well as the lymphatic system[20][21]. The blood that circulates
throughout the body consists of formed elements within a liquid, called plasma (which is
mostly water)[21]. Blood and its formed elements serve three main purposes: (1) to transport
oxygen, carbon dioxide, nutrients, etc, (2) to regulate temperature, pH, etc, and (3) to protect
against disease, loss of blood (clotting), etc[21]. The elements within the blood are platelets
(that play a major role in clotting), white blood cells (which are used in immune responses)
and red blood cells[21]. The latter constitute the majority of all blood cells (~99%) and serve
as a transportation tool to deliver oxygen to the rest of the body[21].
Blood travels via blood vessels, which include arterial systems, venous systems and
microcirculatory systems[20]. Blood vessels branch out throughout the human body - starting
from larger ones, such as arteries/veins down to the smallest blood vessels, known as
capillaries - and all of them effectively form a closed loop[21]. The previously-mentioned
closed loop can also be viewed as two complementary loops: (1) the pulmonary circulation
and (2) the systemic circulation[21]. The former serves to transport deoxygenated blood from
the right heart (via the two main pulmonary arteries) to the lungs, where it becomes enriched
with oxygen and is then transported to the left heart(via the pulmonary vein)[21]. The latter’s
purpose is to transport oxygenated blood from the left heart to the rest of the body (via the
aorta) and to transport deoxygenated blood to the right heart via the superior and inferior vena
cava[20][21].

8
FIGURE 1: VASCULAR SYSTEM[22]
The heart is what keeps the circulation in motion – it pumps oxygenated blood through the
arteries and receives carbon dioxide-rich blood from the veins[21]. A diagram of the human
heart can be found in Figure 2, where it can be seen that it consists of four chambers, the
upper two being the atria and the lower two - the ventricles[23]. The atria collect blood, while
the ventricles pump it out[23]. The right atrium and the right ventricle (collectively known as
the right heart) serve to collect the deoxygenated blood from the body and then pump it to the
lungs[23]. The left atrium and the left ventricle are utilized so as to collect the oxygenated
blood from the lungs and to send it out to the rest of the body[23]. In order to maintain the
directionality of the blood flow, as well as to prevent leakage, the heart contains four valves:
the atrioventricular (AV) valves (tricuspid and mitral) that regulate the flow between the atria
and ventricles, and the semilunar valves (pulmonary and aortic) that control the flow between
the ventricles and the major arteries[23]. Although the heart is full of de-oxygenated and
oxygenated blood, it doesn’t receive its oxygen and necessary nutrients directly but rather
through the so-called coronary artery circuit[24]. It consists of three main arteries (left
coronary artery, right coronary artery and the conus artery), the extramural coronary system

9
(the accompanying blood vessels, situated on the surface of the myocardium2) and the
intramural coronary system (the blood vessels within the myocardium)[24].
FIGURE 2: ANATOMY OF THE HUMAN HEART[25]
As it has already been mentioned, the heart serves as a pump of sorts, which maintains
circulation throughout the human body. In order to collect and pump blood, the four chambers
of the heart contract sequentially in an established order and that activity is controlled by the
cardiac conduction system[26]. This system consists of altered cardiac muscle cells; some of
them are the so-called pacemaker cells – they generate electrical activity. The rest are
conductive cells, which serve to spread the created electrical impulses to the rest of the
designated areas within the heart[26]. These electrical impulses disperse throughout the heart
in a specific order[26]:
1) A spontaneous depolarization wave starts up from the sinoatrial node 3(SA), which is
located around the top of the right atrium;
2 Myocardium – constitutes most of the heart wall; contains cardiac muscle[59]. 3 The SA node is the natural pacemaker of the human heart, it dictates the normal sinus rhythm[26].
10
2) The depolarization wave spreads throughout both atria, causing them to contract;
3) The wave reaches the AV node, which lays at the bottom of the right atrium;
4) The AV node relays the depolarization wave with a delay on to the right and left
ventricles, causing them to contract;
4.2 ISCHEMIC HEART DISEASE
As is the case with the rest of the human body, cardiac tissue requires oxygen, as well.
Ischemia defines the restriction of blood flow to tissues that leads to a deficiency in the
oxygen and energy substrates being delivered[27]. Therefore, ischemic heart disease (IHD)
refers to the restriction of blood flow to the heart, which means restriction of the blood flow
within the coronary artery circuit (due to the blood delivery system being specifically
dedicated to the heart itself). The condition that results in the abovementioned restrictions is
called “atherosclerosis” – it is a progressive disease that includes the build-up of lipids and
fibrous components[24][28]. These lipids and fibers can accumulate into plaques that protrude
on the inside of blood vessels, effectively narrowing the corresponding lumens 4of said blood
vessels, which in turn limits the amount of blood that can flow through them[24].
Additionally, atherosclerosis can lead to the creation of blood clots (thrombi), which can
travel to smaller arteries and completely occlude them[24]. Keeping in mind the significance
that atherosclerosis has on the development of IHD, it would be therefore beneficial to be able
to detect its presence in an individual. However, diagnosing atherosclerosis can be
challenging – currently the preferred method is catheterization, which is highly invasive and
is only performed in a medical environment[28]. Risk factors for atherosclerosis and IHD in
general seem to be a combination of genetic predisposition and environmental
conditions[24][28]. However, significant risk factors seem to be smoking (cause of 36% of
IHD[24]), obesity (cause of 20% of IHD[24]), gender (bellow the age of 60, men develop
atherosclerosis twice as often as women[28]), sedentary lifestyle[24] and age[24]. In general,
IHD can be divided into two main conditions: (1) stable angina and (2) the so-called acute
coronary syndrome (ACS)[29]. ACS is considered the more significant of the two and it
includes the following three conditions: (1) unstable angina, (2) ST-elevation myocardial
infarction (STEMI), and (3) Non-ST-elevation myocardial infarction (NSTEMI)[29].
4.2.1 ANGINA
The most common symptom of IHD is angina pectoris, which can also be referred to as stable
angina[24][30]. It can demonstrate as chest pain, pressure or a squeezing sensation in the
chest area; the discomfort can also travel to the back, shoulder, arm, neck or jaw[30].
However, women may also experience nausea, vomiting, shortness of breath, sharp chest pain
or abdominal pain[31]. Angina pectoris typically manifests itself during physical exertions,
cold weather and during emotional or stressful episodes[24][30], but it is notable that angina
pectoris flare-ups usually do not last longer than 5 minutes and can be treated with rest or
medicine (such as nitroglycerin)[30]. Additionally, it usually occurs at higher heart rates[32].
Angina pectoris, by itself, is purely a symptom of IHD and does not indicate damage to the
heart. However, its own existence signifies the presence of IHD, which puts the individual
experiencing it at higher risk of suffering from other, more hazardous, instances of IHD[30].
4 Lumen – the interior section of a membrane-covered entity[161]; not to be confused with the SI unit for Luminous Flux[162].
11
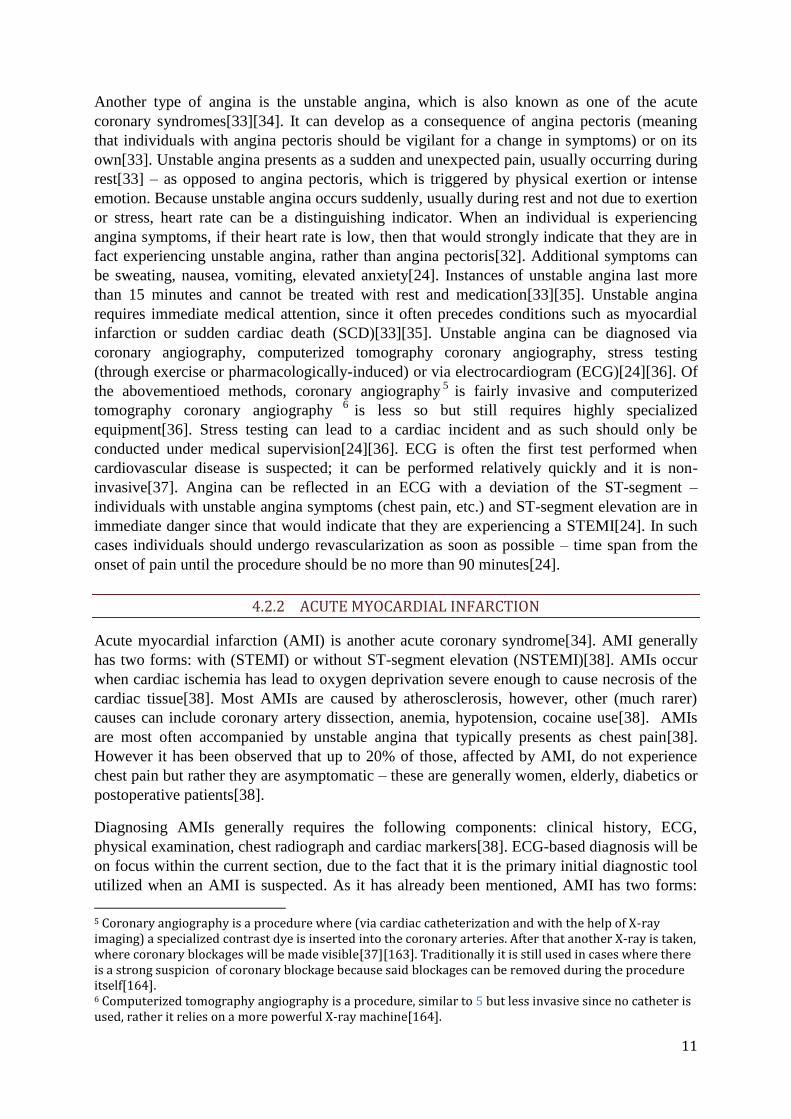
Another type of angina is the unstable angina, which is also known as one of the acute
coronary syndromes[33][34]. It can develop as a consequence of angina pectoris (meaning
that individuals with angina pectoris should be vigilant for a change in symptoms) or on its
own[33]. Unstable angina presents as a sudden and unexpected pain, usually occurring during
rest[33] – as opposed to angina pectoris, which is triggered by physical exertion or intense
emotion. Because unstable angina occurs suddenly, usually during rest and not due to exertion
or stress, heart rate can be a distinguishing indicator. When an individual is experiencing
angina symptoms, if their heart rate is low, then that would strongly indicate that they are in
fact experiencing unstable angina, rather than angina pectoris[32]. Additional symptoms can
be sweating, nausea, vomiting, elevated anxiety[24]. Instances of unstable angina last more
than 15 minutes and cannot be treated with rest and medication[33][35]. Unstable angina
requires immediate medical attention, since it often precedes conditions such as myocardial
infarction or sudden cardiac death (SCD)[33][35]. Unstable angina can be diagnosed via
coronary angiography, computerized tomography coronary angiography, stress testing
(through exercise or pharmacologically-induced) or via electrocardiogram (ECG)[24][36]. Of
the abovementioed methods, coronary angiography5 is fairly invasive and computerized
tomography coronary angiography 6
is less so but still requires highly specialized
equipment[36]. Stress testing can lead to a cardiac incident and as such should only be
conducted under medical supervision[24][36]. ECG is often the first test performed when
cardiovascular disease is suspected; it can be performed relatively quickly and it is non-
invasive[37]. Angina can be reflected in an ECG with a deviation of the ST-segment –
individuals with unstable angina symptoms (chest pain, etc.) and ST-segment elevation are in
immediate danger since that would indicate that they are experiencing a STEMI[24]. In such
cases individuals should undergo revascularization as soon as possible – time span from the
onset of pain until the procedure should be no more than 90 minutes[24].
4.2.2 ACUTE MYOCARDIAL INFARCTION
Acute myocardial infarction (AMI) is another acute coronary syndrome[34]. AMI generally
has two forms: with (STEMI) or without ST-segment elevation (NSTEMI)[38]. AMIs occur
when cardiac ischemia has lead to oxygen deprivation severe enough to cause necrosis of the
cardiac tissue[38]. Most AMIs are caused by atherosclerosis, however, other (much rarer)
causes can include coronary artery dissection, anemia, hypotension, cocaine use[38]. AMIs
are most often accompanied by unstable angina that typically presents as chest pain[38].
However it has been observed that up to 20% of those, affected by AMI, do not experience
chest pain but rather they are asymptomatic – these are generally women, elderly, diabetics or
postoperative patients[38].
Diagnosing AMIs generally requires the following components: clinical history, ECG,
physical examination, chest radiograph and cardiac markers[38]. ECG-based diagnosis will be
on focus within the current section, due to the fact that it is the primary initial diagnostic tool
utilized when an AMI is suspected. As it has already been mentioned, AMI has two forms:
5 Coronary angiography is a procedure where (via cardiac catheterization and with the help of X-ray imaging) a specialized contrast dye is inserted into the coronary arteries. After that another X-ray is taken, where coronary blockages will be made visible[37][163]. Traditionally it is still used in cases where there is a strong suspicion of coronary blockage because said blockages can be removed during the procedure itself[164]. 6 Computerized tomography angiography is a procedure, similar to 5 but less invasive since no catheter is used, rather it relies on a more powerful X-ray machine[164].

12
STEMI and NSTEMI. The former is named after its most significant ECG indicator and that
is elevation within the ST-segment[39]. Meanwhile, individuals with a suspected NSTEMI
often manifest with ST-segment depression, T-wave inversion, flat T-waves or with no
significant tracings at all[39]. To be more specific, it is considered that a MI is occurring
when there is new ST-elevation above 0.1 mV at the J-point in two contiguous leads 7, i.e. all
leads but V2 and V3, where the cutoff points are 0.20 mV for men over 40-years-old and 0.15
mV for women[40]. Also, new ST depressions ≥0.05 mV in two contiguous leads and/or T-
wave inversion ≥0.1 mV in two contiguous leads with an R/S ratio above 1[40]. Another MI
indicator is the presence of new pathologic Q waves – pre-existing pathological Q waves are
to be excluded as a diagnostic method since they are indicators of a prior MI[40]. Reinfarction 8can be diagnosed in the presence of ST elevation ≥0.1 mV or of new pathologic Q waves in
two contiguous leads, especially when accompanied by symptoms that last for more than 20
minutes[40]. Pathologic Q waves are those that last longer than 0.04 seconds or that have an
amplitude at least a third of that of the accompanying R wave[41]. The reason why AMI
symptoms are looked for in any two contiguous leads is that, depending on which section of
the coronary artery system is affected, various sections of the myocardium could be damaged.
Different ECG leads present different views of the heart; therefore specific sections of the
heart (and their possible damage) are visible via specific ECG leads[42].
Identifying the presence of an AMI based on pulse is not as precise a method as when using
an ECG. What is known is that the higher the resting heart rate (RHR), the more likely that an
incident MI or total death will occur[43]. Bradyarrhythmia is a known complication for 25%-
30% of AMI cases[44]. It generally manifests within the first 6 hours of the MI, ranging from
sinus bradycardia (40% of bradyarrhythmias) to AV blocks[44]. Traditionally,
bradyarrhythmia is considered to constitute a heart rate, lower than 60 bpm[44][45].
Bradyarrhythmias often lead to dizziness and even to a syncope9– specifically, they are the
cause of 3% - 10% of all syncope cases[46]. It ought to be noted that for some people –
usually young adults and professional athletes - an RHR below 60 bpm can be a regular
rhythm, not an arrhythmia[47]s. Additionally, ischemic damage to parts of the cardiac
conductive system can lead to electrical re-entry, causing tachyarrhythmias[44]. These
include ventricular tachycardia (VT) and ventricular fibrillation (VF)[44]. The former can be
nonsustained (less than 30 seconds) - occurs in 67% of AMIs within the first 12 hours – and
sustained (longer than 30 seconds)[44]. Nonsustained VT does not correlate with increased
mortality but sustained VT does[44]. In the presence of sustained VT, one’s heart rate is
above 100 bpm. VT’s ECG tracings can be somewhat distinctive – wide complexes (with a
QRS complex longer than 0.12 second or an RS interval longer than 0.1 seconds in at least
one precordial lead), with no preceding P waves[48][49]. Sustained VT leads to reduced
perfusion and can have similar symptoms to those of bradyarrhythmia: dizziness, palpitations
and loss of consciousness. If left untreated, sustained VT can turn into VF[50]. VF is a type of
arrhythmia where rapid and irregular electrical impulses spread throughout the heart, causing
the myocardium to quiver rather than actually pump blood. VF can be treated via
cardiopulmonary resuscitation (CPR) and by shocking the heart with electricity with a
defibrillator[51]. The outward symptoms preceding VF coincide with those of VT,
7 Contiguous leads are leads that belong together in one of the following groupings: anterior leads (V1-V6), inferior leads (II, III, aVF), lateral leads (I, aVL)[40]. 8 Reinfarction is the occurrence of a second MI within 28 days of the initial one[40]. 9 Syncope – loss of consciousness, fainting[47].
13
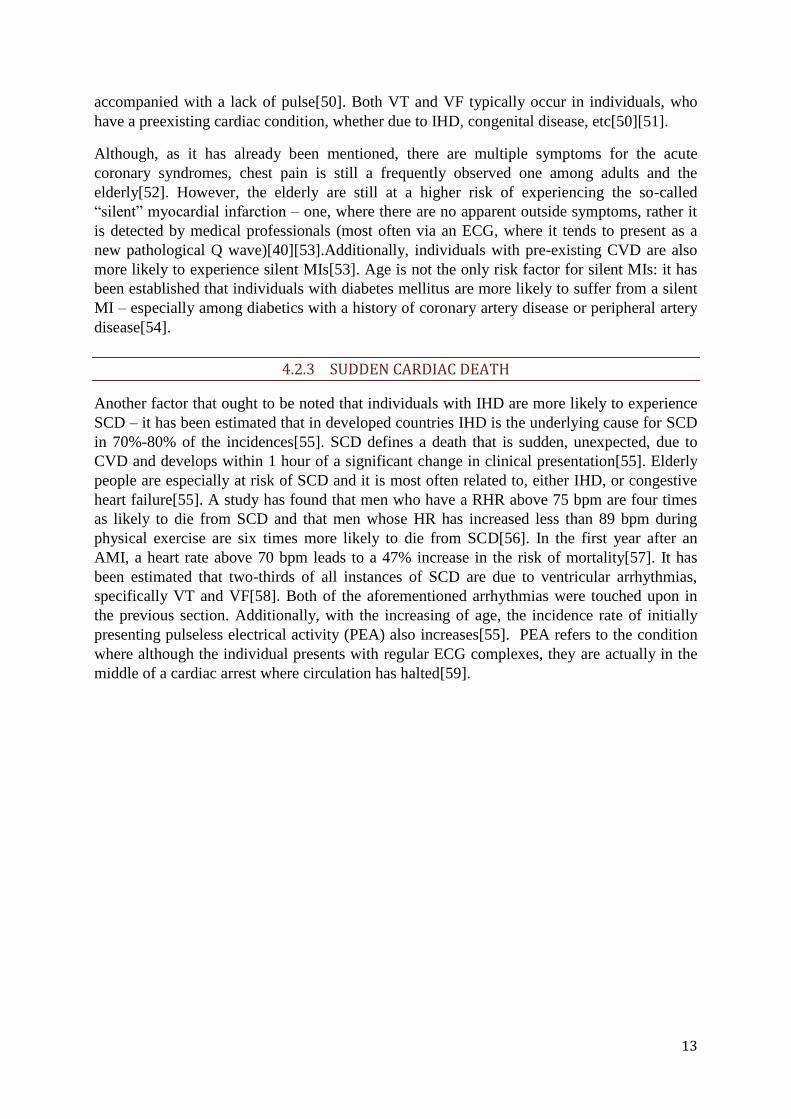
accompanied with a lack of pulse[50]. Both VT and VF typically occur in individuals, who
have a preexisting cardiac condition, whether due to IHD, congenital disease, etc[50][51].
Although, as it has already been mentioned, there are multiple symptoms for the acute
coronary syndromes, chest pain is still a frequently observed one among adults and the
elderly[52]. However, the elderly are still at a higher risk of experiencing the so-called
“silent” myocardial infarction – one, where there are no apparent outside symptoms, rather it
is detected by medical professionals (most often via an ECG, where it tends to present as a
new pathological Q wave)[40][53].Additionally, individuals with pre-existing CVD are also
more likely to experience silent MIs[53]. Age is not the only risk factor for silent MIs: it has
been established that individuals with diabetes mellitus are more likely to suffer from a silent
MI – especially among diabetics with a history of coronary artery disease or peripheral artery
disease[54].
4.2.3 SUDDEN CARDIAC DEATH
Another factor that ought to be noted that individuals with IHD are more likely to experience
SCD – it has been estimated that in developed countries IHD is the underlying cause for SCD
in 70%-80% of the incidences[55]. SCD defines a death that is sudden, unexpected, due to
CVD and develops within 1 hour of a significant change in clinical presentation[55]. Elderly
people are especially at risk of SCD and it is most often related to, either IHD, or congestive
heart failure[55]. A study has found that men who have a RHR above 75 bpm are four times
as likely to die from SCD and that men whose HR has increased less than 89 bpm during
physical exercise are six times more likely to die from SCD[56]. In the first year after an
AMI, a heart rate above 70 bpm leads to a 47% increase in the risk of mortality[57]. It has
been estimated that two-thirds of all instances of SCD are due to ventricular arrhythmias,
specifically VT and VF[58]. Both of the aforementioned arrhythmias were touched upon in
the previous section. Additionally, with the increasing of age, the incidence rate of initially
presenting pulseless electrical activity (PEA) also increases[55]. PEA refers to the condition
where although the individual presents with regular ECG complexes, they are actually in the
middle of a cardiac arrest where circulation has halted[59].
14
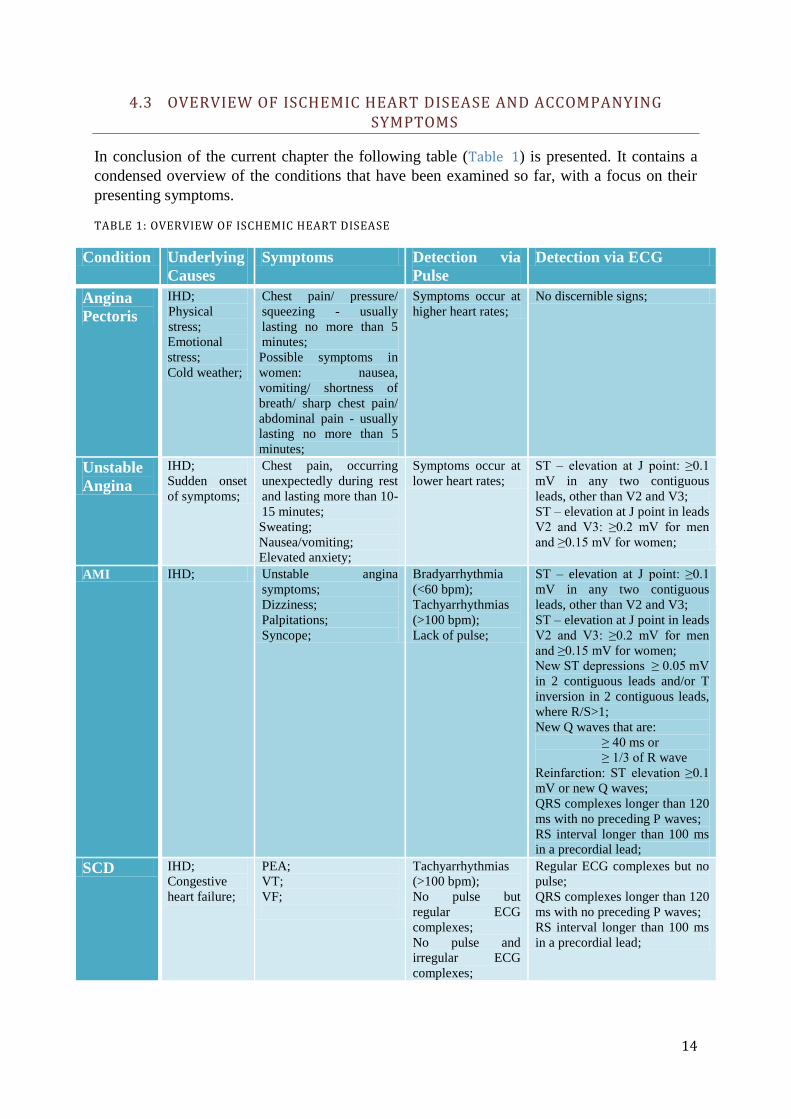
4.3 OVERVIEW OF ISCHEMIC HEART DISEASE AND ACCOMPANYING SYMPTOMS
In conclusion of the current chapter the following table (Table 1) is presented. It contains a
condensed overview of the conditions that have been examined so far, with a focus on their
presenting symptoms.
TABLE 1: OVERVIEW OF ISCHEMIC HEART DISEASE
Condition Underlying
Causes
Symptoms Detection via
Pulse
Detection via ECG
Angina
Pectoris
IHD;
Physical
stress;
Emotional
stress;
Cold weather;
Chest pain/ pressure/
squeezing - usually
lasting no more than 5
minutes;
Possible symptoms in
women: nausea,
vomiting/ shortness of
breath/ sharp chest pain/
abdominal pain - usually
lasting no more than 5
minutes;
Symptoms occur at
higher heart rates;
No discernible signs;
Unstable
Angina
IHD;
Sudden onset
of symptoms;
Chest pain, occurring
unexpectedly during rest
and lasting more than 10-
15 minutes;
Sweating;
Nausea/vomiting;
Elevated anxiety;
Symptoms occur at
lower heart rates;
ST – elevation at J point: ≥0.1
mV in any two contiguous
leads, other than V2 and V3;
ST – elevation at J point in leads
V2 and V3: ≥0.2 mV for men
and ≥0.15 mV for women;
AMI IHD; Unstable angina
symptoms;
Dizziness;
Palpitations;
Syncope;
Bradyarrhythmia
(<60 bpm);
Tachyarrhythmias
(>100 bpm);
Lack of pulse;
ST – elevation at J point: ≥0.1
mV in any two contiguous
leads, other than V2 and V3;
ST – elevation at J point in leads
V2 and V3: ≥0.2 mV for men
and ≥0.15 mV for women;
New ST depressions ≥ 0.05 mV
in 2 contiguous leads and/or T
inversion in 2 contiguous leads,
where R/S>1;
New Q waves that are:
≥ 40 ms or
≥ 1/3 of R wave
Reinfarction: ST elevation ≥0.1
mV or new Q waves;
QRS complexes longer than 120
ms with no preceding P waves;
RS interval longer than 100 ms
in a precordial lead;
SCD IHD;
Congestive
heart failure;
PEA;
VT;
VF;
Tachyarrhythmias
(>100 bpm);
No pulse but
regular ECG
complexes;
No pulse and
irregular ECG
complexes;
Regular ECG complexes but no
pulse;
QRS complexes longer than 120
ms with no preceding P waves;
RS interval longer than 100 ms
in a precordial lead;

15
In conclusion to the current chapter it ought to be noted that, although an individual’s heart
rate is the most easily accessible, it also does not provide distinguishingly pathological
information. Data extracted solely from heart rate measurements, are not sufficient in order to
yield a reliable diagnosis as to one’s health status. Meanwhile, ECG readings provide much
more insight into a person’s cardiac activity and as such are considered a necessary
component of Vixi – especially during the first year after an IHD incident, when people are
exposed to a higher risk of morbidity.

16
5 STATE OF THE ART
The current chapter will be dedicated to fulfilling the following objective from section 2.2 of
the Problem Formulation chapter:
Conduct research into the existing relevant algorithms and technologies that are currently on
the market.
5.1 POSITIONING METHODS
An essential component to the service being developed is accurate positioning – this is
necessary in order to provide users in need with assistance as soon as possible. Positioning
technologies are generally divided into three groups: (1) satellite-based, (2) terrestrial-radio-
based, and (3) standalone[60]. Of the abovementioned groups, the most preferred are the
satellite-based positioning systems, which is why the following brief section is dedicated to
them.
5.1.1 GLOBAL NAVIGATION SATELLITE SYSTEMS
In recent years satellite-based positioning systems, the so-called Global Navigation Satellite
Systems (GNSS), such as the American Global Positioning System (GPS), the Russian Global
Navigation Satellite System (GLONASS), the Chinese BeiDou Navigation Satellite System
(BDS) or the European Union’s Galileo, have gained popularity. Of these systems, BDS is
currently servicing primarily the Asian-Pacific region[61] and Galileo will not be fully
functional until 2020[62]. GLONASS and GPS have somewhat similar accuracies (the former
being ~ 5-10 m[63][64] and the latter being up to 4.9 m [65]) and both have global coverage.
Additionally, both have augmented versions deployed for smartphones, which allow for faster
start-up times by making use of the additional network connectivity. Although one does not
have much advantage over the other, it has been discovered that the combination of the two,
with a combined (55) satellites, can provide a more complete global coverage[66][67][68] and
- with more satellites being visible to users’ devices – provide an improved accuracy of up to
2m.
While GPS and GLONASS are fairly accurate, these positioning systems both have a
significant flaw: they require line-of-sight (LOS). This can be a hindrance in two main
situations: (1) when the device is within urban canyons, or (2) when the device is located
indoors. This can be a problem, given that there has been a trend of population transference
towards urban areas in recent years and the fact that these senior citizens mostly live within
cities. The second situation is especially detrimental since, as stated previously in Problem
Formulation chapter, a large portion of elderly people live on their own and the purpose of
this service is to provide them with help when they are unobserved (which is more likely to be
indoors at home, rather than outside in a public place). Although the effect of non-line-of-
sight (NLOS) signals can be diminished by using dual-polarization antennas, most
smartphones are equipped with linearly polarized antennas, which cannot discriminate
between NLOS and direct signals[69].
In order to manage the problems with this kind of situations, many positioning services are
actually hybrid systems that combine GNSSs with systems that can work better with NLOS

17
signals. These other positioning methods can be utilized when LOS signals cannot be attained
and these will be explored in the following section.
5.1.2 NLOS POSITIONING METHODS
Cell ID Positioning
Cell ID positioning is a network-based positioning method, meaning that the mobile Station
(MS) segment does not need to have any special hardware of software components, rather the
burden of additional resources falls on the network infrastructure[70]. In order to understand
how this positioning method is executed, a brief overview of cellular technology is necessary.
Cellular technology is based on the principle of dividing geographical coverage into
individual areas, called “cells” (Figure 3). This rather simple idea solves a number of
problems, including: (1) the limits of the RF spectrum, (2) the high power requirements for
the UE segment, as well as for the network transceivers, (3) the limited capacities tied to
using small numbers of network transceivers in order to cover larger geographical areas.
FIGURE 3: BASIC CELLULAR NETWORK CONFIGURATION[71]
Whenever an individual wants to make use of the connectivity features of their MS (such as a
mobile phone or a smartphone), then their MS would send to and receive the data in question
from the Base Transceiver Station (BTS) that is servicing the cell, in which the individual is
located. The Cell ID positioning method entails approximating a user’s location to that of the
cell that they are in and that is achieved by identifying the BTS that is servicing them[72, p.
49]. This localization method hails from the time of the second generation cellular network
but is still very much in use today - a testament to this is a 2014 report from the European
Emergency Number Association (EENA), titled “Caller Location in Support of Emergency
Services”[73]. In it they include a small sample data on the success rate of network providers

18
providing the location of their customers that make emergency calls. With Cell ID they have a
success rate of up to 97.4%, while GPS positioning had its highest success rate at 24.6%[73,
p. 16]. Meanwhile, within Europe, of the 27 of the 30 countries listed in the report, still rely
on Cell ID positioning[73, pp. 18–19]. An advantage to this method is that it is actually more
accurate within urban environments[72, p. 49]. This is due to the fact that in cities, where
population density is higher, individual cell geographical coverage tends to be smaller in
order to compensate for the higher amounts of traffic. In this way, a network can
accommodate, both picocells 10, as well as macrocells 11 [60]. Due to the somewhat limited
accuracy of this method – especially given the imposed requirements for USA’s E911 (50 m
for 67% of calls[73]) and EU’s112 (30 m for 67% of calls[73]) – there have been a multitude
of proposed additional methods and algorithms to improve it.
Cell ID based positioning methods
One such method is the Cell ID Timing Advance (TA). The TA parameter is tied to the nature
of GSM network, which utilizes Frequency Division Multiple Access (FDMA) alongside
Time Division Multiple Access (TDMA)[74]. There is a necessity for the synchronicity
between the MS and the BTS and there are mechanisms for achieving it, both frequency- and
time-wise[74]. Specifically, in order to properly maintain time synchronization, there has to
be a negation to the various time delays between the MS and the BTS. These delays stem
from the fact that an MS is mobile and at any point in time can be at various positions within
its cell, at differing distances from its servicing BTS[75, Sec. 5.3]. To counteract the
aforementioned lagging problem, the start time of data sent from the MS is moved forward
(“advanced”) and this is done proportionally to the distance from the BTS[75, Sec. 5.3].
Applying the TA parameter in the context of positioning, it enables the placing of an MS
within a specific annulus that has the corresponding BTS at its center[74]. Cell ID and Cell
ID+TA may only provide ambiguous locations, but both of these positioning methods do not
require any additions to the existing infrastructure, which is what makes them such attractive
options to network providers. There are other methods that can be used alongside them in
order further improve accuracy – Received Signal Strength (RSS), Angle of Arrival (AOA),
Uplink Time Difference of Arrival (U-TDOA), etc[73][74]. However, these techniques
require additional investments in the infrastructure[74], which means that it is up to each
network provider to decide how to allocate its resources in order to appease the requirements
set forth by American government and the EU[73].
The implementation of Wideband Code Division Multiple Access (WCDMA) that came with
the addition of Universal Mobile Telecommunications System (UMTS) on top of the
previously deployed 2G cellular network led to the possibility of utilizing another technique.
The method in question is the Round Trip Time (RTT) positioning one – it requires measuring
the time it takes radio waves to travel from a Node B (NB - the UMTS equivalent of BTS) to
the MS and back[76]. From this time-of-flight measurement, approximations of distance
between the NB and the MS, as well as of the direction of the MS, can be made[76]. Ideally
the MS would be in range of more than one NB in order to get a more accurate position.
However additional algorithms have been proposed in order to compensate for this deficiency
in accuracy in case there is only one NB available (e.g. [76], [77]).
10 Picocell – a cell dedicated to a smaller physical area; picocells can have a radius of up to 200 m[165] 11 Macrocell – a cell utilized so as to provide coverage for areas of up to 10 km[165]

19
5.1.3 INDOOR POSITIONING METHODS
Indoor positioning methods mainly consist of three major groups: scene analysis,
triangulation and proximity(Figure 4)[78][79]. What makes these specific groups so
favourable is that they can be used in a manner that would compensate for the difficulties,
related to anticipating wave propagation indoors, such as floor plans, shifting positions of
objects, the effects of multipath and NLOS[79]. Scene analysis involves the collection of data
on specific features of scenes - this data can be in the form of radio waves, acoustics, visual
data, etc.[78]. The collected data is then mapped to the physical environment and the
observed specific features are used to approximate the positioning of individual devices[78].
An example of a scene analysis techniques is the so-called “location fingerprinting”[78].
Triangulation involves utilizing the characteristics of triangles in a geometric context[78].
Triangulation methods can be divided in two overall groups: (1) ones, based on angulation
(that use angle measurements), and (2) those that use lateration (which utilize distance
measurements)[78]. It ought to be noted that with lateration, it is not the distance that is
directly measured; rather it is deduced from the measurement of other parameters – mainly
the time it takes a signal to travel between an observed device and some reference points, as
well as the signal phase of a received signal[78]. Proximity techniques involve the assignment
of a location of a device to the location of a reference point that has detected its presence –
and example is positioning via radio frequency identification (RFID)[78]. The Cell ID
method, discussed in the previous section, is based on the same working principle only on a
larger geographical scale[78].
Existing positioning solutions from the abovementioned groups include RFID, Wi-Fi,
Bluetooth and Ultra Wideband (UWB) among others[79]. Of the listed systems, Wi-Fi-based
ones have been preferable and so the remainder of the current section is dedicated to them.
FIGURE 4: INDOOR POSITIONING METHODS[78]
20
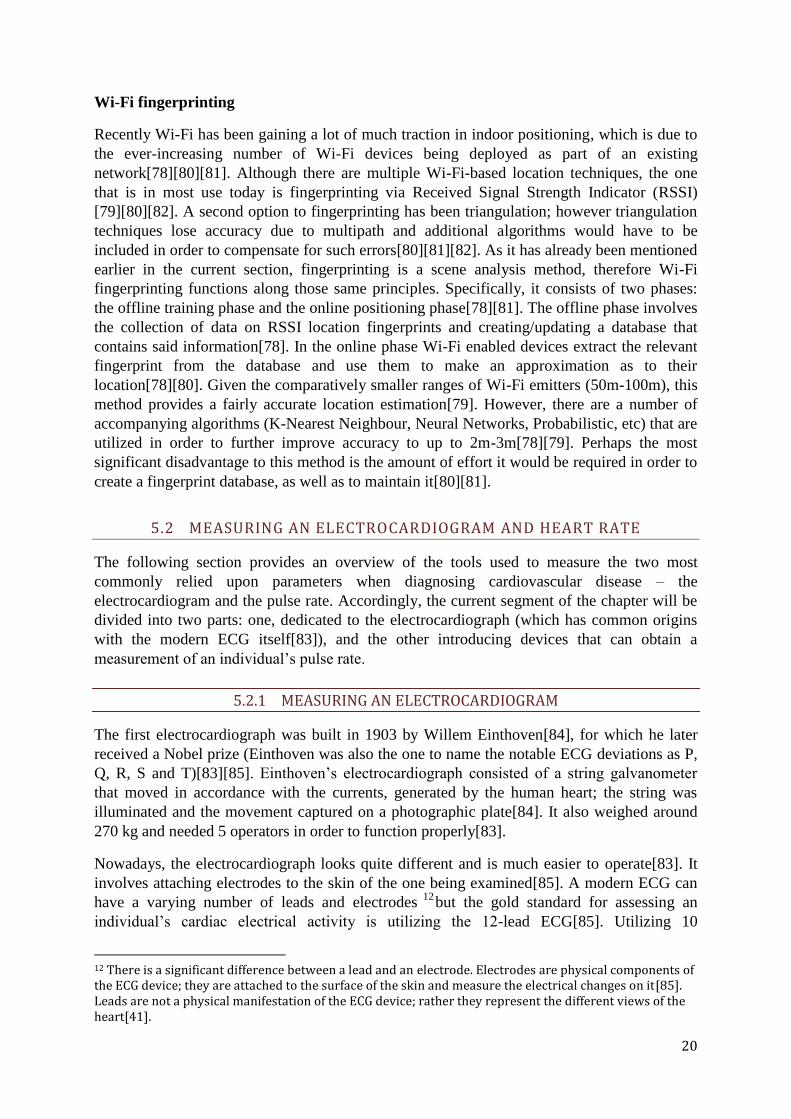
Wi-Fi fingerprinting
Recently Wi-Fi has been gaining a lot of much traction in indoor positioning, which is due to
the ever-increasing number of Wi-Fi devices being deployed as part of an existing
network[78][80][81]. Although there are multiple Wi-Fi-based location techniques, the one
that is in most use today is fingerprinting via Received Signal Strength Indicator (RSSI)
[79][80][82]. A second option to fingerprinting has been triangulation; however triangulation
techniques lose accuracy due to multipath and additional algorithms would have to be
included in order to compensate for such errors[80][81][82]. As it has already been mentioned
earlier in the current section, fingerprinting is a scene analysis method, therefore Wi-Fi
fingerprinting functions along those same principles. Specifically, it consists of two phases:
the offline training phase and the online positioning phase[78][81]. The offline phase involves
the collection of data on RSSI location fingerprints and creating/updating a database that
contains said information[78]. In the online phase Wi-Fi enabled devices extract the relevant
fingerprint from the database and use them to make an approximation as to their
location[78][80]. Given the comparatively smaller ranges of Wi-Fi emitters (50m-100m), this
method provides a fairly accurate location estimation[79]. However, there are a number of
accompanying algorithms (K-Nearest Neighbour, Neural Networks, Probabilistic, etc) that are
utilized in order to further improve accuracy to up to 2m-3m[78][79]. Perhaps the most
significant disadvantage to this method is the amount of effort it would be required in order to
create a fingerprint database, as well as to maintain it[80][81].
5.2 MEASURING AN ELECTROCARDIOGRAM AND HEART RATE
The following section provides an overview of the tools used to measure the two most
commonly relied upon parameters when diagnosing cardiovascular disease – the
electrocardiogram and the pulse rate. Accordingly, the current segment of the chapter will be
divided into two parts: one, dedicated to the electrocardiograph (which has common origins
with the modern ECG itself[83]), and the other introducing devices that can obtain a
measurement of an individual’s pulse rate.
5.2.1 MEASURING AN ELECTROCARDIOGRAM
The first electrocardiograph was built in 1903 by Willem Einthoven[84], for which he later
received a Nobel prize (Einthoven was also the one to name the notable ECG deviations as P,
Q, R, S and T)[83][85]. Einthoven’s electrocardiograph consisted of a string galvanometer
that moved in accordance with the currents, generated by the human heart; the string was
illuminated and the movement captured on a photographic plate[84]. It also weighed around
270 kg and needed 5 operators in order to function properly[83].
Nowadays, the electrocardiograph looks quite different and is much easier to operate[83]. It
involves attaching electrodes to the skin of the one being examined[85]. A modern ECG can
have a varying number of leads and electrodes 12
but the gold standard for assessing an
individual’s cardiac electrical activity is utilizing the 12-lead ECG[85]. Utilizing 10
12 There is a significant difference between a lead and an electrode. Electrodes are physical components of the ECG device; they are attached to the surface of the skin and measure the electrical changes on it[85]. Leads are not a physical manifestation of the ECG device; rather they represent the different views of the heart[41].
21
electrodes, the 12-lead ECG provides a more thorough view of the electrical activity in
question due to the multitude of angles and planes being observed[85]. The ten electrodes are
in the following configuration: 1 on each wrist, 1 on each ankle and 6 on the chest[41].
Combining the readings from these electrodes, the following 12 leads are extracted[41]:
1) 3 standard bipolar leads (I, II, III), which reflect the difference in electrical potential
between two electrodes of opposite polarity. The electrodes utilized are the ones on
both wrists and the one on the left ankle.
2) 3 augmented unipolar leads (aVR, aVF, aVL), which reflect the potential at one
positive electrode, with regard to the two remaining leads. The electrodes used here
are the same ones utilized for the standard leads.
3) 6 precordial unipolar leads (V1, V2, V3, V4, V5, V6) that provide a view of the cardiac
electrical activity in the horizontal plane.
Wearable Long-term Counterparts
While the 12-lead ECG provides the most detailed and accurate information, other
configurations are also feasible solutions. Some might include simply not utilizing all 10
electrodes on a standard ECG (for example using all limb electrodes, but only one precordial
electrode[85]), while others might involve reshaping the ECG as a device. There are four
main kinds of long-term wearable ECGs and they are the following: (1) implanted ones, (2)
those that record events only, (3) ones those that continuously recording data, and (4) ones
that monitor health status in real-time [85]. Implanted recorders are placed underneath the
skin and can stay there for a number of years[85]. There are a number of models with varying
features, which can include storing data when arrhythmias are detected or recording events
triggered by the user when they start experiencing symptoms[85]. It should be noted that these
types of devices are mostly used on individuals that are difficult to diagnose[85]. The second
of the aforementioned types of ECG, the event recorders, are used in order to record data only
at certain times, which are selected based on prompts from the user[85]. Meanwhile the third
type of ECGs records data constantly but for predetermined periods of time, usually
amounting to 24-to-48 hours[85]. Lastly, the fourth type of ECG device is used for real-time
monitoring, meaning that data is constantly being collected but, rather than being recorded
within the device itself, it is being sent to a second location where it is consequently
stored[85]. Generally, these devices can have a number of leads (and therefore multiple
accompanying electrodes) - such as the Holter monitor – but frequently they only have one
lead (single-lead ECG). Single-lead ECGs most often make use of the standard leads (I, II,
III) or modified precordial leads (MCL1, MCL6)[86].
Focusing on non-invasive devices, examples of wearable ECGs that are available on the
market or about to be released are the following:
The QardioCore single-channel wearable ECG[87]
The Shimmer3 ECG Unit, which utilizes four precordial leads (with a choice from V1
to V6)[88];
iRhythm’s Zio[89];
The crowdfunded CALM.[90];

22
5.2.2 MEASURING HEART RATE
Among the most commonly referenced vital signs are temperature, respiratory rate, urine
output, heart rate and blood pressure[91]. Of the aforementioned vital signs, the ones that are
directly related to the cardiovascular system are the heart rate and blood pressure. However,
from research conducted in the Ischemic Heart Disease chapter is it known that although blood
pressure is not an indicative symptom to the onset of an ACS, heart rate can be.
An individual’s heart rate can be measured via a number of non-invasive methods. In fact it is
often measured merely by using one’s fingers and a watch – the most accurate measure would
be taken by placing the fingers on one of the parts of the human body where the pulse could
reliably be monitored, such as the side of the neck, the wrist, the inside of the elbow or the top
of the foot[92]. The one executing the measurement would then count the palpable beats for a
period of 60 seconds and the resulting number would be the observed pulse, expressed in
beats-per-minute, i.e. bpm[92]. Although this method is considered to be reliable, it can turn
into a challenging task when an individual has to be monitored for longer periods of time. To
solve this problem, among others, automated devices have been developed that are capable of
detecting the human heart rate.
Wearable Counterparts
There are various methodologies behind heart rate measuring devices but generally they are
either electronically-based or optically-based; with the former being more accurate but also
less affordable[93]. An electronically-based example is the focus of the previous section
(5.2.1) – the ECG – it detects the electrical impulses that guide the contractions of the heart
and the heart rate itself. The optically-based technology most often used is the one utilizing
pulse oximetry[94].
Pulse oximetry is a technology developed as a non-invasive method for measuring the oxygen
saturation levels of arterial blood[95]. It is based on utilizing the varying capabilities between
oxygenated and deoxygenated blood, concerning light absorption. To be more precise, the
hemoglobin within the blood reacts to infrared and red light differently, depending on how
much oxygen it is bound to[95]. Pulse oximetry devices generate light and use it on the
human skin; the light itself is emitted in two wavelengths – 660 nm and 940nm – which
correspond to infrared and red light, respectively[94]. The devices then detect the light
absorption at both wavelengths in order to estimate the arterial oxygen absorbance rate[94].
What is of interest, however, is that pulse oximetry can also be utilized so as to measure heart
rate, as well. In essence, the output of a pulse oximetry device is a photoelectric
photoplethysmogram (PPG)[96]. PPGs can be used so as to gain a measure of a number of
bodily functionalities, among which are: an assessment of venous function, blood vessel
viscosity, cardiac output and, most significantly, heart rate[96].
Because of its relatively low production cost and non-invasive nature, the PPG sensor can
often be found among consumer goods that utilize heart rate for various reasons, depending
on the purpose of the product. Such products have taken the form of rings[97][98], chest
straps[99][100] and smartwatches[101][102], among others.
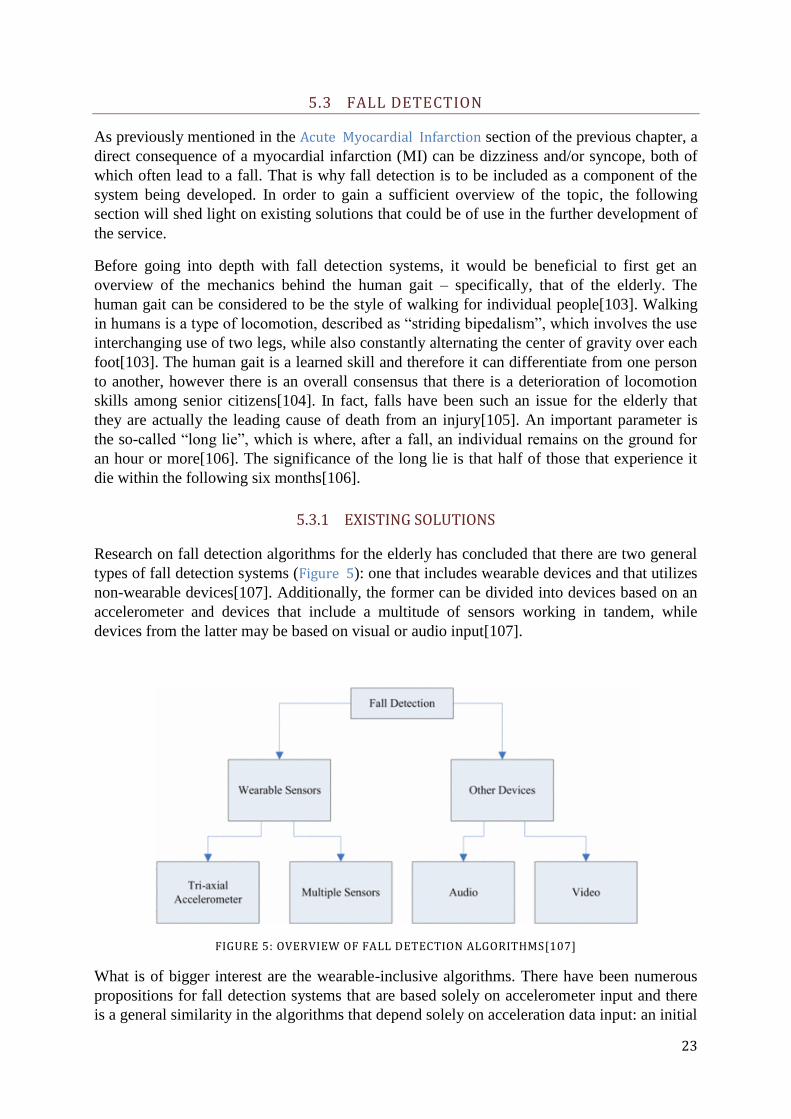
23
5.3 FALL DETECTION
As previously mentioned in the Acute Myocardial Infarction section of the previous chapter, a
direct consequence of a myocardial infarction (MI) can be dizziness and/or syncope, both of
which often lead to a fall. That is why fall detection is to be included as a component of the
system being developed. In order to gain a sufficient overview of the topic, the following
section will shed light on existing solutions that could be of use in the further development of
the service.
Before going into depth with fall detection systems, it would be beneficial to first get an
overview of the mechanics behind the human gait – specifically, that of the elderly. The
human gait can be considered to be the style of walking for individual people[103]. Walking
in humans is a type of locomotion, described as “striding bipedalism”, which involves the use
interchanging use of two legs, while also constantly alternating the center of gravity over each
foot[103]. The human gait is a learned skill and therefore it can differentiate from one person
to another, however there is an overall consensus that there is a deterioration of locomotion
skills among senior citizens[104]. In fact, falls have been such an issue for the elderly that
they are actually the leading cause of death from an injury[105]. An important parameter is
the so-called “long lie”, which is where, after a fall, an individual remains on the ground for
an hour or more[106]. The significance of the long lie is that half of those that experience it
die within the following six months[106].
5.3.1 EXISTING SOLUTIONS
Research on fall detection algorithms for the elderly has concluded that there are two general
types of fall detection systems (Figure 5): one that includes wearable devices and that utilizes
non-wearable devices[107]. Additionally, the former can be divided into devices based on an
accelerometer and devices that include a multitude of sensors working in tandem, while
devices from the latter may be based on visual or audio input[107].
FIGURE 5: OVERVIEW OF FALL DETECTION ALGORITHMS[107]
What is of bigger interest are the wearable-inclusive algorithms. There have been numerous
propositions for fall detection systems that are based solely on accelerometer input and there
is a general similarity in the algorithms that depend solely on acceleration data input: an initial

24
extraction of the magnitude of its acceleration vector and, consequently, of the amplitude of
the differential acceleration[107]. The first thing to monitor is the acceleration vector (5.1),
since it symbolizes the intensity of exertion of the body – during falls this parameter increases
significantly and for longer periods of time[107]. After that the amplitude of the differential
acceleration is calculated for the acceleration vector’s high-value groupings (5.2) – a
significant increase in the amplitude would implicate a fall[107]. After these two steps
individual algorithms have had different additional steps that are often used to further improve
accuracy[107].
(5.1)
(5.2)
A team from Australia presented a solution that consists of placing a singular 2-axes
accelometer on the hips of elderly individuals[108]. The placement of the device was such
that it was aligned with the vertical and anterior-posterior axe of the human body. The
Australians concluded that different fall types had different prediction accuracy, but they also
found out that results improve by, not only measuring the magnitude of acceleration, but also
its sign change[108]. Another study, conducted by a team in Germany, proposes the
implementation of the accelerometer at head level (specifically within a hearing aid
housing)[109]. The study results in the conclusion that there are three trigger thresholds for
fall detection: (1) the acceleration sum-vector of the xy-plane (where x-axis denotes the
frontal axis and the y-axis denotes the sagittal axis) is higher than 2g, (2) the velocity sum-
vector of all axes right before initial contact is higher than 0.7 m/s-1
, and (3) the acceleration
sum-vector of all axes is higher than 6g[109]. The first threshold is related to the direction a
person’s head was facing – they analyze the x-axis since the eyes are usually aimed at the
ground during the fall itself and the y-axis because after the fall the eyes are generally pointed
to the side[109]. The z-axis (the vertical axis) was ignored in order to eliminate false alarms
from running or sitting down, which cause high accelerations in that specific direction[109].
The second threshold being a velocity sum-vector from all three axes was chosen in order to
minimize the incidences of false alarms that would have occurred whenever a user laid their
head down on a bed. Velocity was calculated via the following integral:
(5.3)
In essence, it is the same as the one in (5.2) with different annotations. In the equation above
t0 is the moment of impact and t1 is 1500 ms later – the period of 1500 ms was extracted
empirically, as it was observed that 1500 ms after initial impact there were no significant
changes along the different axes since at that point the person’s body is immobile[109]. The
third parameter, the acceleration sum-vector threshold was used because it was not reached in
any of the daily life simulations, only with the intentional falls. What is also significant is the
fact that by utilizing the acceleration sum-vector they were able to identify dangerous falls
such as those on staircases, which could be missed by the first two thresholds[109]. A few
years later a team from Taipei proposed a similar solution, where they used a 6-axes
accelerometer, placed at head level[110]. The parameters they utilized in their algorithm were
then the sum-vector of all axes, the sum-vector of the horizontal plane, the timestamps for the
falling body at rest and for its initial impact with the ground, as well as the reference velocity,
25
which similarly to [109] has not been measured but extracted from the acceleration
measurements[110].
In 2005 a team from the Swiss Federal Institute of Technology published and article
describing a fall detector within a wrist watch that they dubbed “Speedy”[111]. They chose
wrist watches as target devices due to their ubiquity and unobtrusiveness and the sensors
integrated were two accelerometers to measure along the three main axes[111]. Their
detection algorithm included three thresholds, calculated not unlike the ones in [109]: (1) the
first one they call the “norm”, which is the acceleration sum-vector of all axes, (2) the second
is a velocity (5.4), calculated via integration of the norm, while also compensating for the
Earth’s gravitational acceleration (9.8 m/s2), and (3) the third is a second velocity (5.5),
calculated similarly to the previous one, only the separate axis parameters are integrated
separately and the Earth’s gravitational acceleration is also subtracted separately.
(5.4)
(5.5)
Calculated as in (5.1), the norm indicates the intensity of body movement, regardless of
orientation, used to indicate a possible significant event. The first velocity parameter (5.4) is
used to eliminate significant movements along the horizontal plane where the Earth’s
gravitational acceleration would be constant. The second velocity (5.5) is used so as to
account for fast accelerations in the vertical plane, where velocity would be inaccurately
estimated via the first velocity parameter[111]. The Swiss team demonstrated that their
algorithm could handle situations such as handshakes without raising false alarms (which can
be challenging due to the placement of the device on the wrist) and detect forward-facing falls
100% of the time. However, the algorithm had difficulty detecting backward-facing and
sideway falls, bringing the overall success rate down to 65%[111].
Another accelometer-based fall detection system to be reviewed here was introduced by a
team from Australia[112]. The proposed system consisted of 3 main elements: the
PreventaFall ambulatory monitor, the MiiLink data portal and a remote data server[112]. The
PreventaFall monitor contains a tri-axial accelometer that the user wears at their waist – the
monitor rests in a charger overnight, in the morning the user puts it on and in the evening they
let it charge again. While the monitor is active, it continuously sends data to the MiiLink
where the data is stored to a Secure Data memory card. Once every day this data is
transmitted to the remote server via a Local Area Network or by dial-up[112]. The novel
approach to this system is that every day the user is tasked with performing a risk assessment
of sorts – they perform a number of actions according to instructions and their performance is
monitored by the PreventaFall and related to the MiiLink[112]. In the event of a fall a two-
way audio channel is established from the PreventaFall, via the MiiLink, with the appropriate
responder[112]. Additionally, there are alternatives as to who that responder could be – if
after the fall the user recovers and is active the call would be to a neighbour/friend/family
member, otherwise emergency services would be contacted[112]. Another element of the
service relies on remote processing - as it has already been mentioned at the end of each day,
the recorded data by the MiiLink is sent to e remote server[112]. These servers keep track of

26
the longitudinal records 13of every user, which are constantly updated with daily ambulatory
data, as well as the data from the self-assessments and are re-examined, in order to attempt to
establish any long-term patterns[112]. Lastly, the data on these remote servers is made
accessible to relevant third parties, such as physicians[112].
The final purely accelerometer-based solution is one proposed as recently as 2016 by a team
from Switzerland who based their algorithm on using a smartwatch[113]. With a 40 Hz
sampling rate of the three axes of the onboard accelerometer (that discounts the gravity
component); they again calculate the norm according to (5.1). They identified an upper
threshold of 10-to-18 m/sec2
and a lower threshold of 2-to-7 m/sec2
[113].Incoming data is
sifted through searching for values above the upper threshold. When such an event is detected
they then look for a vale bellow the lower threshold within 0.5 seconds after the upper
threshold has been crossed – if that has also been detected then a fall is suspected[113]. In
order to confirm whether a fall has actually taken place, they analyze data in 6-second-
windows, within which a count is kept of suspected fall events: X≤ counter <Y, where X = 1
and Y = (5÷10)[113]. If the counter value is less than 1 then this would indicate that the user
has possibly made some sudden movement; if the counter value equals or is larger than Y
then that would point to a different type of activity, e.g. running[113].
There is a consensus that fall detection systems, which depend purely on accelerometers, can
have a higher risk of false alarms (largely due to the sensitivity of the results to the chosen
thresholds); however, their implementation in conjunction with other sensor can significantly
reduce said risk[107]. An example of such a system is that of the French TIMS-IMAG lab,
which employs the so-called “actimeter” that incorporates three different sensors: an
accelerometer to measure vertical acceleration, a position tilt switch to indicate the orientation
of the wearer’s body and a vibration sensor to measure the surface vibrations of the
body[114]. Their detection algorithm consists of two considerations: (1) whether any
vibrations been detected, and if so (2) if the body in a “laying” orientation and the vertical
acceleration limit has been exceeded, then the person has indeed suffered a fall[114].
Meanwhile, a team from the Shibaura Institute of Technology in Tokyo has proposed a
solution that involves the use of an Android smartphone, along with an external pulse wave
sensor[115]. Up until the moment of publishing their paper the team had not yet connected the
two components so, in effect, they had developed two separate systems, dedicated to fall
detection – one, consisting of a smartphone application, and the other – a ubiquitous pulse
wave sensor that they developed themselves, that nevertheless were supposed to function in
tandem[115]. The first steps in their algorithm were at the application level, where the
accelerations and angular velocities are monitored. Two thresholds are set for each of the
parameters: (1) the acceleration for all three axes is below ±3 m/s2, and (2) angular velocity is
above ±30 deg/s[115]. The team investigated different placements of the smartphone along
the user’s body, including back pocket, chest, thigh, waist[115]. Among these four placements
it was observed that the thigh location produced the most inaccurate results (from 20%
detection rate in the applications first iteration, to 90% in its second)[115]. If the
abovementioned thresholds have been reached, then the next step would be to confirm the
suspected fall by measuring the pulse wave pattern with their own developed device. They
tested the pulse wave patterns of 15 people across 150 falls (including incidences where the
person would stumble but not fall)[115]. It was observed that at the beginning of a fall there is
13 Longitudinal record – data about an individual, collected over long durations of time[166]

27
a drop in blood flow, after which two major patterns emerged [Figure 6]: (1) if the blood flow
rate returned to its previous equilibrium then there had not been a fall, and (2) if the pulse rate
remained decreased then a fall had occurred. However, as it can be seen in Figure 6 there have
also been blood flow patterns that could not be attributed to either pattern.
FIGURE 6: BLOOD FLOW RATE PATTERNS[115]
Additionally, the paper [115] does not provide accurate data as to what a significant decrease
in pulse rate constitutes and after how long should the pulse rate return to normal in order to
be identified as a non-fall (or if it is indeed a fall).
A joint team from the USA and Vietnam proposed a fall detection algorithm that utilized data
from an accelerometer and a gyroscope, housed within a sensor placed at chest level[116].
Their results achieved a sensitivity 14
of 96.3% and a specificity 15
of 96.2% - a definitive high
among the rest of the solutions examined in the current section. Their algorithm starts off with
calculating the acceleration sum vector according to (5.1) with data from the accelerometer, as
well as the calculation of the sum vector of the angular velocity following the same
calculation principle, based on data acquired from the gyroscope.
(5.6)
They noted that when the device is stationary, the acceleration sum vector equals +1g and
angular velocity is 0°[116]. They have also determined two different acceleration thresholds –
a lower (0.30-0.35 g) and an upper (2.4 g) fall threshold – as well as an angular velocity
threshold (240°). Their algorithm depended on sifting through the incoming data for a sum
acceleration vector value below that of the lower fall threshold. When one is detected they
then examine the following 0.5 seconds looking for acceleration above the higher fall
threshold and angular velocity above the angular velocity threshold. If both of those incidents
are detected within the abovementioned time period, then a fall has been detected[116].
14 Sensitivity – also referred to as true positive rate or recall; it is utilized in order to evaluate how many positives were correctly identified as such, e.g. how many of all falls were successfully detected[167]. 15 Specificity – also referred to as the true negative rate; it is utilized so as to measure how many negatives have been correctly been identified as such, i.e. how “few” false alarms have been detected[167].
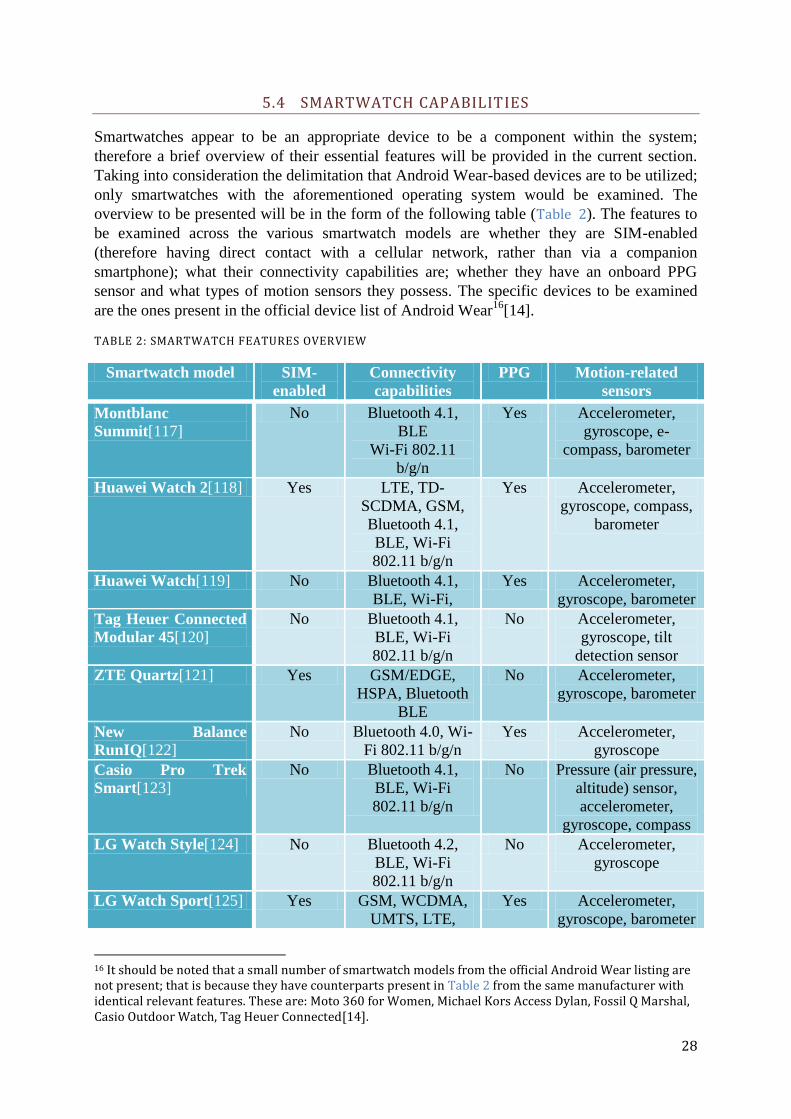
28
5.4 SMARTWATCH CAPABILITIES
Smartwatches appear to be an appropriate device to be a component within the system;
therefore a brief overview of their essential features will be provided in the current section.
Taking into consideration the delimitation that Android Wear-based devices are to be utilized;
only smartwatches with the aforementioned operating system would be examined. The
overview to be presented will be in the form of the following table (Table 2). The features to
be examined across the various smartwatch models are whether they are SIM-enabled
(therefore having direct contact with a cellular network, rather than via a companion
smartphone); what their connectivity capabilities are; whether they have an onboard PPG
sensor and what types of motion sensors they possess. The specific devices to be examined
are the ones present in the official device list of Android Wear16
[14].
TABLE 2: SMARTWATCH FEATURES OVERVIEW
Smartwatch model SIM-
enabled
Connectivity
capabilities
PPG Motion-related
sensors
Montblanc
Summit[117]
No Bluetooth 4.1,
BLE
Wi-Fi 802.11
b/g/n
Yes Accelerometer,
gyroscope, e-
compass, barometer
Huawei Watch 2[118] Yes LTE, TD-
SCDMA, GSM,
Bluetooth 4.1,
BLE, Wi-Fi
802.11 b/g/n
Yes Accelerometer,
gyroscope, compass,
barometer
Huawei Watch[119] No Bluetooth 4.1,
BLE, Wi-Fi,
Yes Accelerometer,
gyroscope, barometer
Tag Heuer Connected
Modular 45[120]
No Bluetooth 4.1,
BLE, Wi-Fi
802.11 b/g/n
No Accelerometer,
gyroscope, tilt
detection sensor
ZTE Quartz[121] Yes GSM/EDGE,
HSPA, Bluetooth
BLE
No Accelerometer,
gyroscope, barometer
New Balance
RunIQ[122]
No Bluetooth 4.0, Wi-
Fi 802.11 b/g/n
Yes Accelerometer,
gyroscope
Casio Pro Trek
Smart[123]
No Bluetooth 4.1,
BLE, Wi-Fi
802.11 b/g/n
No Pressure (air pressure,
altitude) sensor,
accelerometer,
gyroscope, compass
LG Watch Style[124] No Bluetooth 4.2,
BLE, Wi-Fi
802.11 b/g/n
No Accelerometer,
gyroscope
LG Watch Sport[125] Yes GSM, WCDMA,
UMTS, LTE,
Yes Accelerometer,
gyroscope, barometer
16 It should be noted that a small number of smartwatch models from the official Android Wear listing are not present; that is because they have counterparts present in Table 2 from the same manufacturer with identical relevant features. These are: Moto 360 for Women, Michael Kors Access Dylan, Fossil Q Marshal, Casio Outdoor Watch, Tag Heuer Connected[14].

29
Bluetooth 4.2,
BLE, Wi-Fi
802.11 b/g/n
LG Watch Urbane 2nd
Ed. LTE[126]
Yes GSM, HSPA,
LTE, Bluetooth
4.1, BLE, Wi-Fi
802.11 b/g/n
Yes Accelerometer,
gyroscope, compass,
barometer
LG Watch
Urbane[127]
No Bluetooth 4.0, Wi-
Fi
Yes Accelerometer,
gyroscope, compass,
barometer
Polar M600[128] No Bluetooth 4.2, Wi-
Fi 802.11 b/g/n
Yes Accelerometer,
gyroscope
Michael Kors Access
Bradshaw
Smartwatch[129]
No Bluetooth 4.1, Wi-
Fi 802.11 b/g/n
No Accelerometer,
gyroscope
Fossil Q Wander[130] No Bluetooth 4.1,
BLE, Wi-Fi
802.11 b/g/n
No G-sensor, gyroscope
Fossil Q Founder[131] No Bluetooth 4.1,
BLE, Wi-Fi
802.11 b/g/n
No Accelerometer,
gyroscope
The Mission, by
Nixon[132]
No Bluetooth 4.1,
BLE, Wi-Fi
802.11n
No Accelerometer,
gyroscope, altimeter,
barometer, compass
Asus Zenwatch 3[133] No Bluetooth 4.1,
BLE, Wi-Fi b/g/n
No Accelerometer,
gyroscope
Asus Zenwatch 2[134] No Bluetooth 4.1, Wi-
Fi b/g/n
No Accelerometer,
gyroscope
Moto 360[101] No Bluetooth 4.0,
BLE, Wi-Fi b/g
Yes Accelerometer,
gyroscope
Moto 360 Sport[135] No Bluetooth 4.0,
BLE, Wi-Fi b/g
Yes Accelerometer,
gyroscope,
barometric altimeter
A few observations can be made while examining Table 2:
1) Concerning motion-related sensors, all of the examined watches contained at least a
gyroscope and almost all had an accelerometer. The exceptions were two Fossil
models that nonetheless contained a G-sensor, which still measures acceleration, only
it does so with the gravitational component[136].
2) Of the listed 20 devices in Table 2, half of them contain an integrated optical heart rate
sensor. Overall, of the 25 officially listed Android Wear devices, 11 have a PPG
sensor, i.e. 44% of official Android Wear devices have an optical heart rate sensor.
3) All Android Wear devices have Bluetooth and Wi-Fi capabilities.
4) Among all of the 25 Wear devices, only 4 (16%) have incorporated SIM capability
and the accompanying network access, such as GSM/LTE/etc. However, it ought to be
noted that before the release of Android Wear 2.0 earlier in 2017 Wear-based
smartwatches were not able to support standalone applications, rather they had to rely

30
on companion smartphone apps[137]. However, the aforementioned 4 devices are
among the 7 (57%) smartwatches released to the market with pre-installed Android
Wear 2.0 have integrated SIM. Having SIM-integration rate jump from 0% during pre-
Wear 2.0 to 57% within the Wear 2.0 era, would suggest that now that Android Wear
smartwatches can function independently from smartphones, independent network
capabilities would become more common among future devices.
It ought to be noted that the abovementioned devices are constrained when it comes to power
performance: they can typically have a battery life of up to a day-and-a-half with mixed
use[101] [122][138][128].
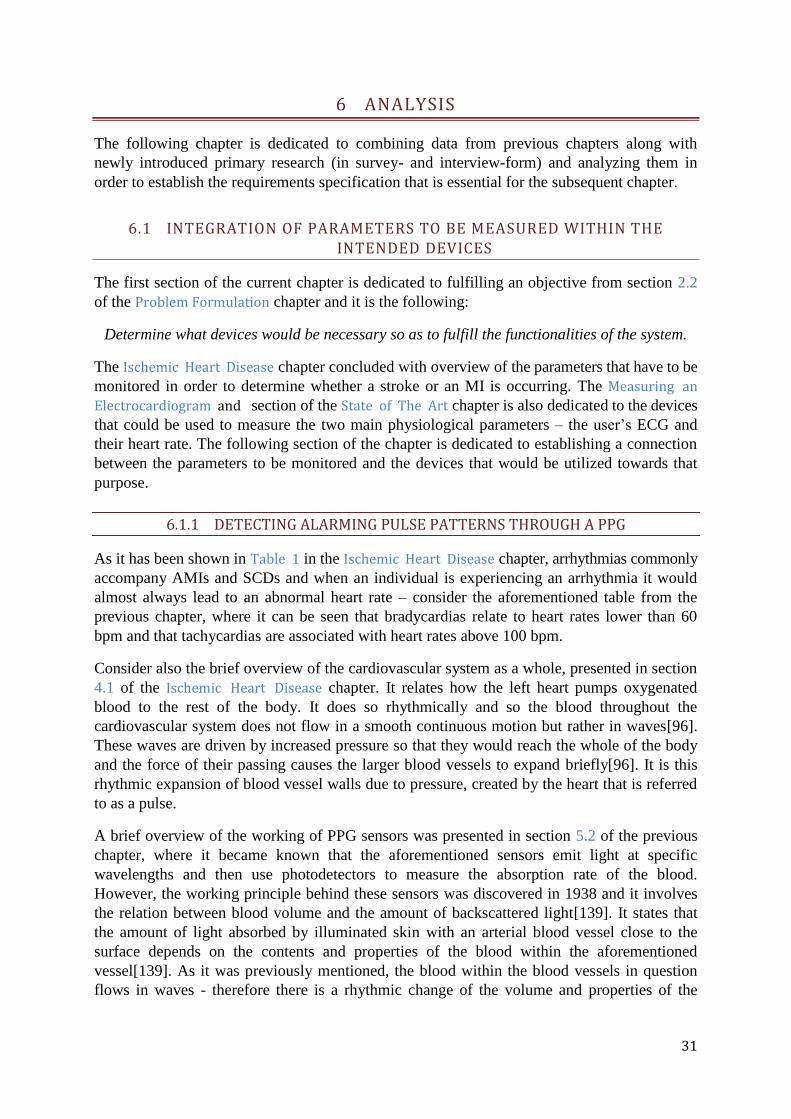
31
6 ANALYSIS
The following chapter is dedicated to combining data from previous chapters along with
newly introduced primary research (in survey- and interview-form) and analyzing them in
order to establish the requirements specification that is essential for the subsequent chapter.
6.1 INTEGRATION OF PARAMETERS TO BE MEASURED WITHIN THE INTENDED DEVICES
The first section of the current chapter is dedicated to fulfilling an objective from section 2.2
of the Problem Formulation chapter and it is the following:
Determine what devices would be necessary so as to fulfill the functionalities of the system.
The Ischemic Heart Disease chapter concluded with overview of the parameters that have to be
monitored in order to determine whether a stroke or an MI is occurring. The Measuring an
Electrocardiogram and section of the State of The Art chapter is also dedicated to the devices
that could be used to measure the two main physiological parameters – the user’s ECG and
their heart rate. The following section of the chapter is dedicated to establishing a connection
between the parameters to be monitored and the devices that would be utilized towards that
purpose.
6.1.1 DETECTING ALARMING PULSE PATTERNS THROUGH A PPG
As it has been shown in Table 1 in the Ischemic Heart Disease chapter, arrhythmias commonly
accompany AMIs and SCDs and when an individual is experiencing an arrhythmia it would
almost always lead to an abnormal heart rate – consider the aforementioned table from the
previous chapter, where it can be seen that bradycardias relate to heart rates lower than 60
bpm and that tachycardias are associated with heart rates above 100 bpm.
Consider also the brief overview of the cardiovascular system as a whole, presented in section
4.1 of the Ischemic Heart Disease chapter. It relates how the left heart pumps oxygenated
blood to the rest of the body. It does so rhythmically and so the blood throughout the
cardiovascular system does not flow in a smooth continuous motion but rather in waves[96].
These waves are driven by increased pressure so that they would reach the whole of the body
and the force of their passing causes the larger blood vessels to expand briefly[96]. It is this
rhythmic expansion of blood vessel walls due to pressure, created by the heart that is referred
to as a pulse.
A brief overview of the working of PPG sensors was presented in section 5.2 of the previous
chapter, where it became known that the aforementioned sensors emit light at specific
wavelengths and then use photodetectors to measure the absorption rate of the blood.
However, the working principle behind these sensors was discovered in 1938 and it involves
the relation between blood volume and the amount of backscattered light[139]. It states that
the amount of light absorbed by illuminated skin with an arterial blood vessel close to the
surface depends on the contents and properties of the blood within the aforementioned
vessel[139]. As it was previously mentioned, the blood within the blood vessels in question
flows in waves - therefore there is a rhythmic change of the volume and properties of the

32
aforementioned blood. It is these changes that the PPG sensor measures and from which the
heart rate is extracted.
6.1.2 DIAGNOSING AN AMI THROUGH AN ECG
As it has already been mentioned in the Ischemic Heart Disease chapter, the human heart has
its own conduction system, which serves to regulate the contractions of its four chambers via
alternating depolarizations and repolarizations. It is exactly these changes in potential that are
detected via an electrocardiograph. An ECG complex of sinus rhythm, i.e. regular heart
rhythm, dictated by the SA node[59], is shown in Figure 7.
FIGURE 7: ECG COMPLEX[140]
The figure above includes the annotations of the various components and segments of the
sinus ECG complex, where the vertical deflections depict voltage variations and the
horizontal axis reflects time. Section 4.1 of the Ischemic Heart Disease chapter included a
brief description of the usual way electrical impulses travel throughout the cardiac conduction
system, starting with the spontaneous depolarization of the SA node and ending with the
depolarization of both ventricles. The aforementioned vertical deflections of ECG readings
reflect the depolarization and repolarization processes that take place within the various
sections of the heart at any given moment - the figure bellow (Figure 8) illustrates this exact
connection.
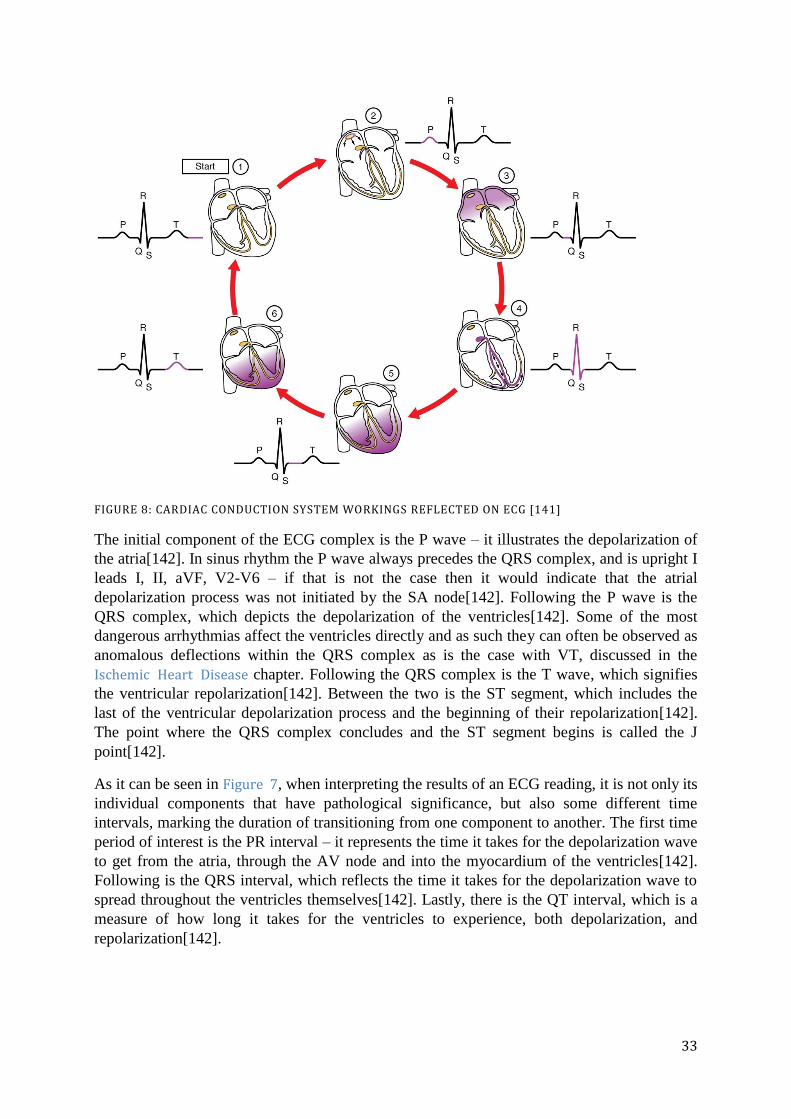
33
FIGURE 8: CARDIAC CONDUCTION SYSTEM WORKINGS REFLECTED ON ECG [141]
The initial component of the ECG complex is the P wave – it illustrates the depolarization of
the atria[142]. In sinus rhythm the P wave always precedes the QRS complex, and is upright I
leads I, II, aVF, V2-V6 – if that is not the case then it would indicate that the atrial
depolarization process was not initiated by the SA node[142]. Following the P wave is the
QRS complex, which depicts the depolarization of the ventricles[142]. Some of the most
dangerous arrhythmias affect the ventricles directly and as such they can often be observed as
anomalous deflections within the QRS complex as is the case with VT, discussed in the
Ischemic Heart Disease chapter. Following the QRS complex is the T wave, which signifies
the ventricular repolarization[142]. Between the two is the ST segment, which includes the
last of the ventricular depolarization process and the beginning of their repolarization[142].
The point where the QRS complex concludes and the ST segment begins is called the J
point[142].
As it can be seen in Figure 7, when interpreting the results of an ECG reading, it is not only its
individual components that have pathological significance, but also some different time
intervals, marking the duration of transitioning from one component to another. The first time
period of interest is the PR interval – it represents the time it takes for the depolarization wave
to get from the atria, through the AV node and into the myocardium of the ventricles[142].
Following is the QRS interval, which reflects the time it takes for the depolarization wave to
spread throughout the ventricles themselves[142]. Lastly, there is the QT interval, which is a
measure of how long it takes for the ventricles to experience, both depolarization, and
repolarization[142].

34
6.1.3 VIXI DEVICES AND THE USER
FIGURE 9: OVERVIEW OF DEVICES IN RELATION TO THE USER'S BODY
The figure above (Figure 9) is presented in order to provide an overall view of the Vixi
devices when it comes to their relation with the user and their placement on the user’s body.
From the previous section of the current chapter and from the Ischemic Heart Disease chapter
it has become apparent that an ECG can provide a multitude of information as to the workings
of the human heart, making it an incredibly useful tool in detecting signs of IHD. From the
State of The Art chapter it is also known that there are long-term wearable versions of the ECG
machine on the market. Therefore it has deemed necessary that a wearable ECG will be a part
of the Vixi system. Additionally, the Ischemic Heart Disease chapter has shed light on the fact
that pulse rate can be used as an indicator for certain IHD conditions. From the State of The
Art chapter it is known that a wearable realization of a pulse rate sensor is the smartwatch,
which is a proposed component of the system. Lastly, the user’s smartphone would also be a
component of the Vixi system.
6.2 ELDERLY SURVEY
The present section of the chapter is intended to fulfill the following objective of section 2.2
of the Problem Formulation chapter:
Get in contact with potential representatives of the target customer segment so as to gain
insight into their needs and interests regarding the service.
Thus gathering information towards the answering of one of the subquestions from section 2.1
of the aforementioned chapter:
How can the proposed solution be made to suit the needs of the target population segment?
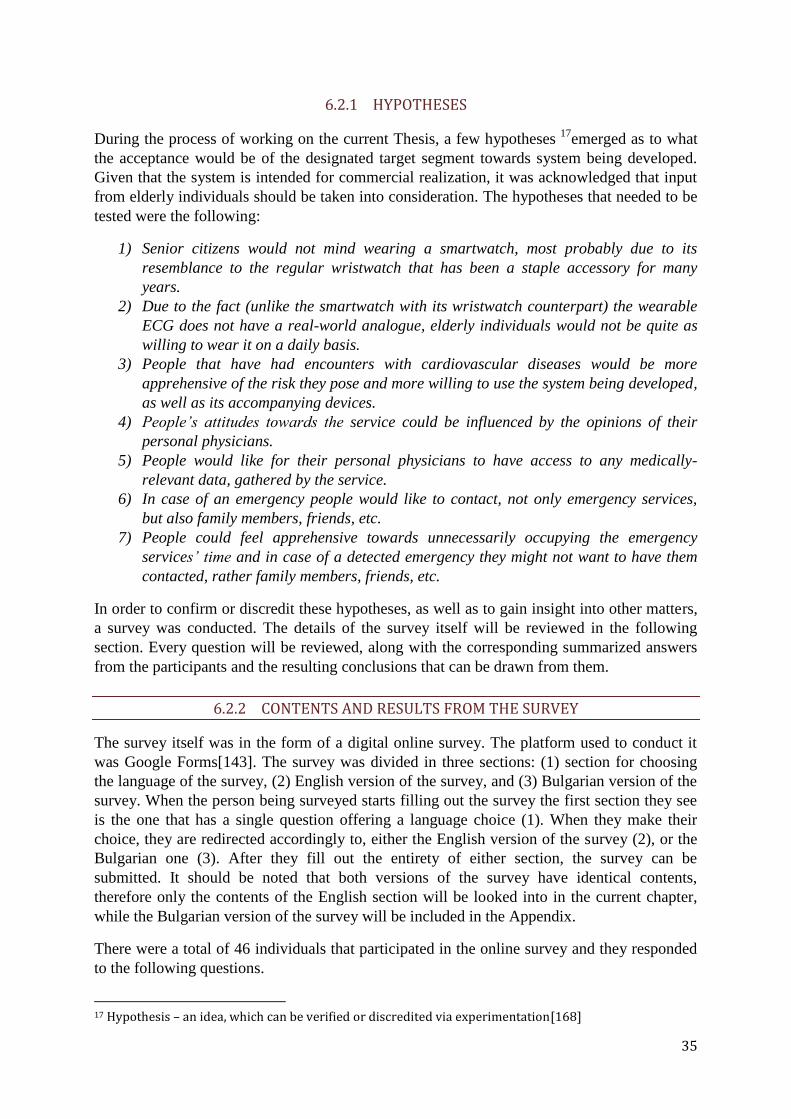
35
6.2.1 HYPOTHESES
During the process of working on the current Thesis, a few hypotheses 17
emerged as to what
the acceptance would be of the designated target segment towards system being developed.
Given that the system is intended for commercial realization, it was acknowledged that input
from elderly individuals should be taken into consideration. The hypotheses that needed to be
tested were the following:
1) Senior citizens would not mind wearing a smartwatch, most probably due to its
resemblance to the regular wristwatch that has been a staple accessory for many
years.
2) Due to the fact (unlike the smartwatch with its wristwatch counterpart) the wearable
ECG does not have a real-world analogue, elderly individuals would not be quite as
willing to wear it on a daily basis.
3) People that have had encounters with cardiovascular diseases would be more
apprehensive of the risk they pose and more willing to use the system being developed,
as well as its accompanying devices.
4) People’s attitudes towards the service could be influenced by the opinions of their
personal physicians.
5) People would like for their personal physicians to have access to any medically-
relevant data, gathered by the service.
6) In case of an emergency people would like to contact, not only emergency services,
but also family members, friends, etc.
7) People could feel apprehensive towards unnecessarily occupying the emergency
services’ time and in case of a detected emergency they might not want to have them
contacted, rather family members, friends, etc.
In order to confirm or discredit these hypotheses, as well as to gain insight into other matters,
a survey was conducted. The details of the survey itself will be reviewed in the following
section. Every question will be reviewed, along with the corresponding summarized answers
from the participants and the resulting conclusions that can be drawn from them.
6.2.2 CONTENTS AND RESULTS FROM THE SURVEY
The survey itself was in the form of a digital online survey. The platform used to conduct it
was Google Forms[143]. The survey was divided in three sections: (1) section for choosing
the language of the survey, (2) English version of the survey, and (3) Bulgarian version of the
survey. When the person being surveyed starts filling out the survey the first section they see
is the one that has a single question offering a language choice (1). When they make their
choice, they are redirected accordingly to, either the English version of the survey (2), or the
Bulgarian one (3). After they fill out the entirety of either section, the survey can be
submitted. It should be noted that both versions of the survey have identical contents,
therefore only the contents of the English section will be looked into in the current chapter,
while the Bulgarian version of the survey will be included in the Appendix.
There were a total of 46 individuals that participated in the online survey and they responded
to the following questions.
17 Hypothesis – an idea, which can be verified or discredited via experimentation[168]

36
The first question of the section is used to establish the age of the participant, where
participants are allowed to choose from four age categories (Figure 10). Although people are
considered “elderly” when they are at least 60-years-old, the additional age groups were
included because of the supposition that those close to the target age are of a similar mindset.
The age distribution among the participants can be found in Figure 11. As it can be seen, 21
out of 46 participants were at least 60-years-old, meaning that almost half of those surveyed
are within the desired market segment. Among the remaining age groups there is downward
trend of, both the number of participants, and the corresponding ages – the second largest
group are the 55-to-60-year-olds, followed by the 50-to-55-year-olds and lastly there are the
45-to-50-year-olds.
FIGURE 10: ESTABLISHING PARTICIANT AGE
FIGURE 11: PARTICIPANT AGE DISTRIBUTION
The second question is related to the 3rd
hypothesis, presented in the previous sub-section.
The question is aimed at establishing the mindset of the participant when it comes to CVD –
this is an attempt to establish if people that have chosen one of the first two options show a
larger concern for the dangers of CVD (Figure 14) or if they are more willing to wear the

37
proposed devices (Figure 18, Figure 20, Figure 22). The participant’s responses are shown in
Figure 13, where a somewhat equal distribution among the available responses can be seen.
FIGURE 12: HISTORY OF CVD
FIGURE 13: HISTORY OF CVD – ANSWERS
The third question (Figure 14) of the survey has a two-fold significance. Firstly, it is tied to
the previous question, meaning that it could reveal if there is a correlation between a
participant’s history of CVD (or lack thereof) and their apprehension towards the dangers of
CVD. Additionally, it will serve to verify whether a higher level of concern on the part of the
participant is tied to a higher probability that the participant would be willing to use the
proposed devices. The results from the question can be seen in Figure 15. As it can be seen in
the abovementioned figure, the majority of participants demonstrated an above-average
concern towards the health risks that the current Thesis is trying to address.

38
FIGURE 14: GAUGING THE PARTICIPANT'S MINDSET
FIGURE 15: GAUGING THE PARTICIPANT'S MINDSET – ANSWERS
The fourth question (Figure 16) was utilized in order to estimate the digital literacy of the
participants, specifically when it comes to smartphones. Given the fact that the survey was
disseminated digitally, it is acknowledged that a judgment of the overall computer literacy
would be a skewed estimation. However, the question is targeted towards the participant’s
familiarity with smartphones specifically, due to the fact that the smartphone is a proposed
component of the Vixi system. Additionally, smartwatch interfaces somewhat resemble those
of smartphones. That is also especially relevant in the case of Android Wear, which extremely
similar to its originator – the Android OS, which has been the prevalent smartphone OS leader
on the global market (reaching a high of 87% in 2016[144]). Summarized results from the
question can be seen on the following figure (Figure 17), where an overwhelming majority of
the participants responded that they had owned a smartphone at the moment of completing the
survey. Additionally, a minority of 4% has never had one but do have some experience, while
a distinctive 15% of participants have never had a smartphone and have never worked with
one before.

39
FIGURE 16: GAUGING THE TECHNICAL COMPETENCY OF THE PARTICIPANT
FIGURE 17: GAUGING THE TECHNICAL COMPETENCY OF THE PARTICIPANT– ANSWERS
The fifth question within the section (Figure 18) serves to test the participant’s willingness to
use a smartwatch. This is relevant to the first of the hypotheses, expressed earlier in the
current chapter. In order to be as close to a real-life scenario as possible, an Android Wear
smartwatch had to be depicted. There are a number of brands with Android Wear watches,
therefore the one chosen for the survey image is the one to be utilized as a proof-of-concept
and that is the Moto 360. Due to the unpredictable economic backgrounds and privacy
concerns of the participants, these potential concerns are addressed within the premise of the
question. Additionally, in the case that any other participant concerns were not addressed in
the premise of the question, other than the Yes/No options the participants were presented
with the possibility to supply their own unique answer (“Other”). The responses for this
question are shown in Figure 19, which shows that an overwhelming majority – 91% - of the
participants expressed a willingness to wear a smartwatch.

40
FIGURE 18: VERIFYING THE PARTICIPANT'S WILLINGNES TO WEAR A SMARTWATCH
FIGURE 19: VERIFYING THE PARTICIPANT'S WILLINGNES TO WEAR A SMARTWATCH – ANSWERS
The sixth question (Figure 20) is relevant to the second hypothesis, wherein the willingness of
the participant to use a wearable ECG is questioned. As in the previous question, privacy and
financial concerns are addressed within the question, in order not to receive a more direct
answer from the participant without it being distorted by them. Additionally, the open “Other”
answer option was again also included. The wearable ECG depicted in the survey is the
QardioCore, which is among the most recently developed products of this type[87]. The
resulting answers to the question are shown in Figure 21, where it can be seen that 67% of

41
participants answered positively. A single participant could not make a definitive decision and
indicated that their choice would depend on the condition of their health.
FIGURE 20: VERIFYING THE PARTICIPANT’S WILLINGNESS TO WEAR AN ECG (1)
FIGURE 21: VERIFYING THE PARTICIPANT’S WILLINGNESS TO WEAR AN ECG (1) – ANSWERS
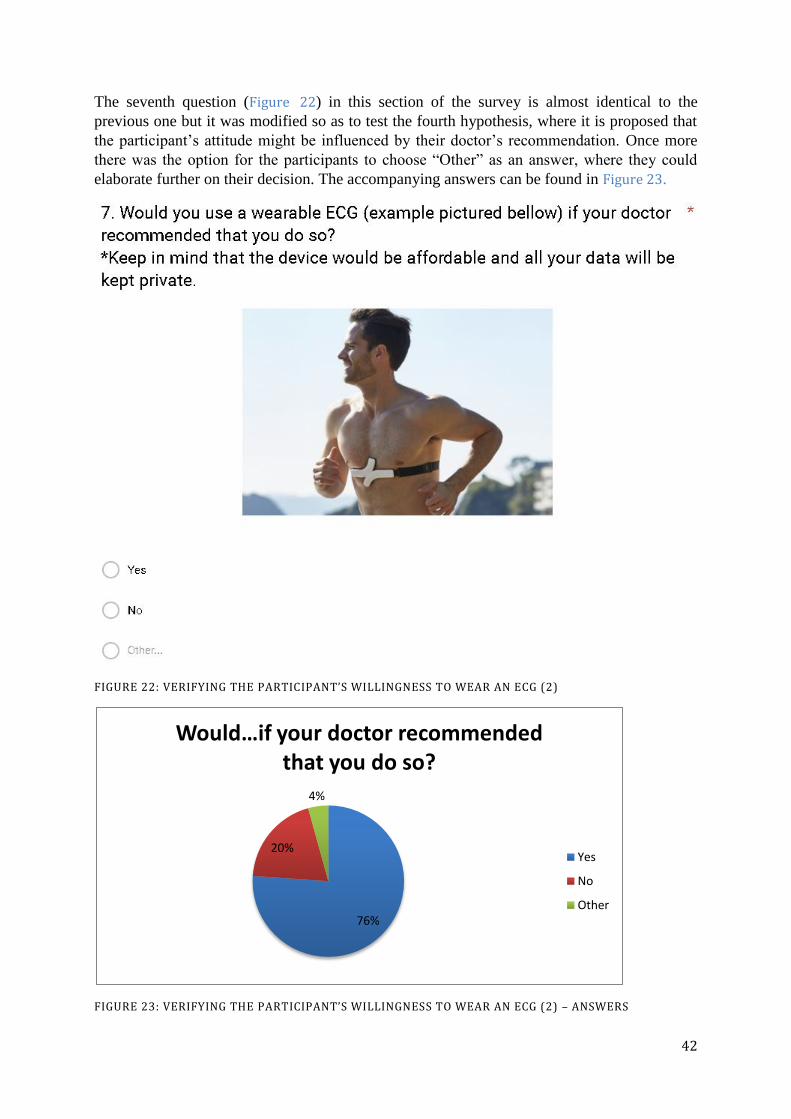
42
The seventh question (Figure 22) in this section of the survey is almost identical to the
previous one but it was modified so as to test the fourth hypothesis, where it is proposed that
the participant’s attitude might be influenced by their doctor’s recommendation. Once more
there was the option for the participants to choose “Other” as an answer, where they could
elaborate further on their decision. The accompanying answers can be found in Figure 23.
FIGURE 22: VERIFYING THE PARTICIPANT’S WILLINGNESS TO WEAR AN ECG (2)
FIGURE 23: VERIFYING THE PARTICIPANT’S WILLINGNESS TO WEAR AN ECG (2) – ANSWERS
76%
20%
4%
Would…if your doctor recommended that you do so?
Yes
No
Other
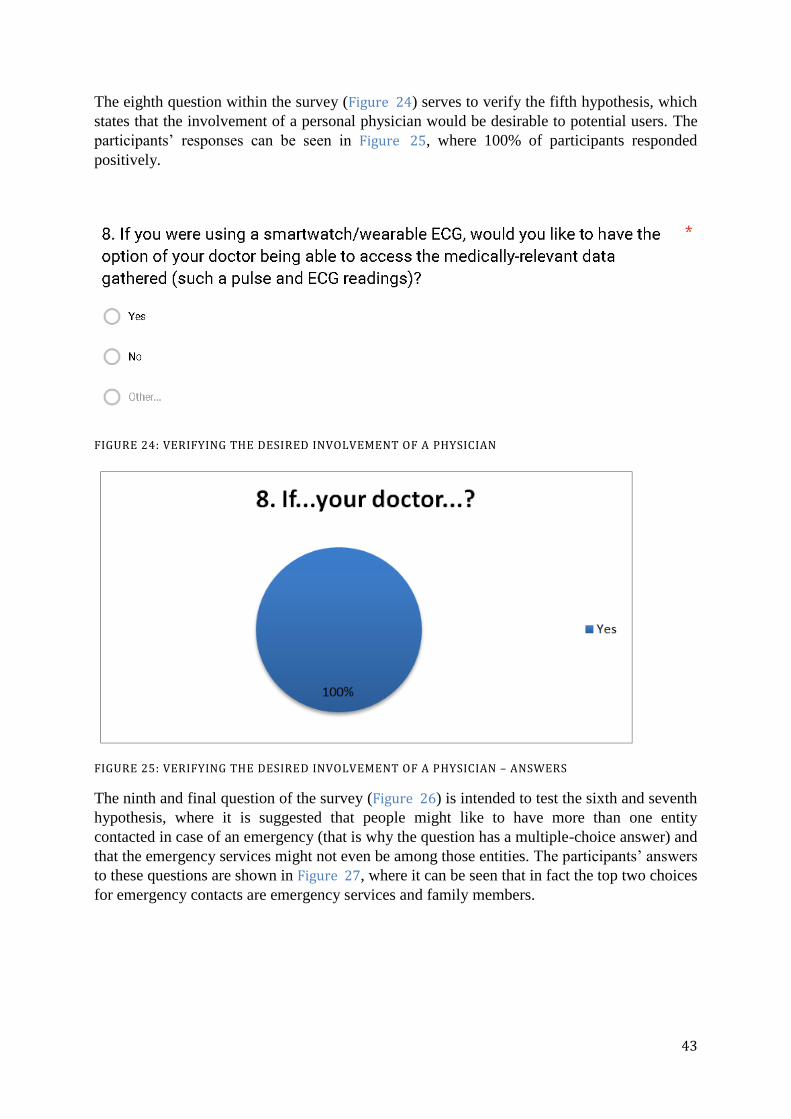
43
The eighth question within the survey (Figure 24) serves to verify the fifth hypothesis, which
states that the involvement of a personal physician would be desirable to potential users. The
participants’ responses can be seen in Figure 25, where 100% of participants responded
positively.
FIGURE 24: VERIFYING THE DESIRED INVOLVEMENT OF A PHYSICIAN
FIGURE 25: VERIFYING THE DESIRED INVOLVEMENT OF A PHYSICIAN – ANSWERS
The ninth and final question of the survey (Figure 26) is intended to test the sixth and seventh
hypothesis, where it is suggested that people might like to have more than one entity
contacted in case of an emergency (that is why the question has a multiple-choice answer) and
that the emergency services might not even be among those entities. The participants’ answers
to these questions are shown in Figure 27, where it can be seen that in fact the top two choices
for emergency contacts are emergency services and family members.
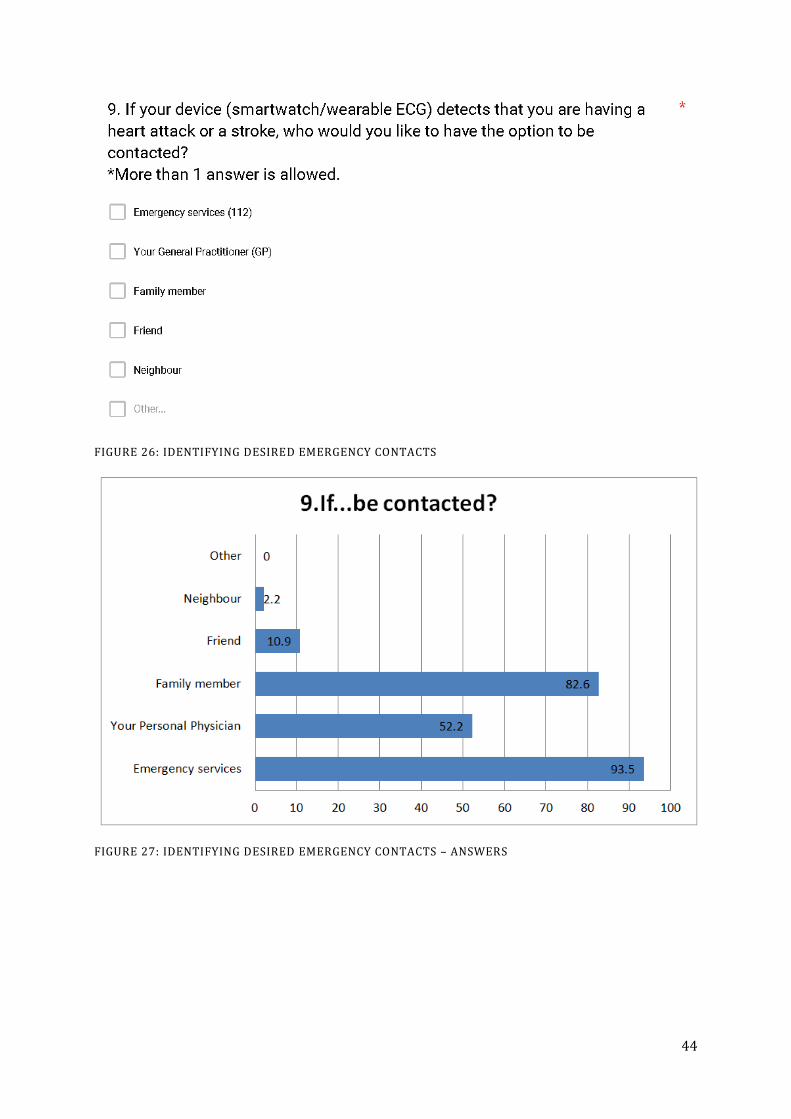
44
FIGURE 26: IDENTIFYING DESIRED EMERGENCY CONTACTS
FIGURE 27: IDENTIFYING DESIRED EMERGENCY CONTACTS – ANSWERS
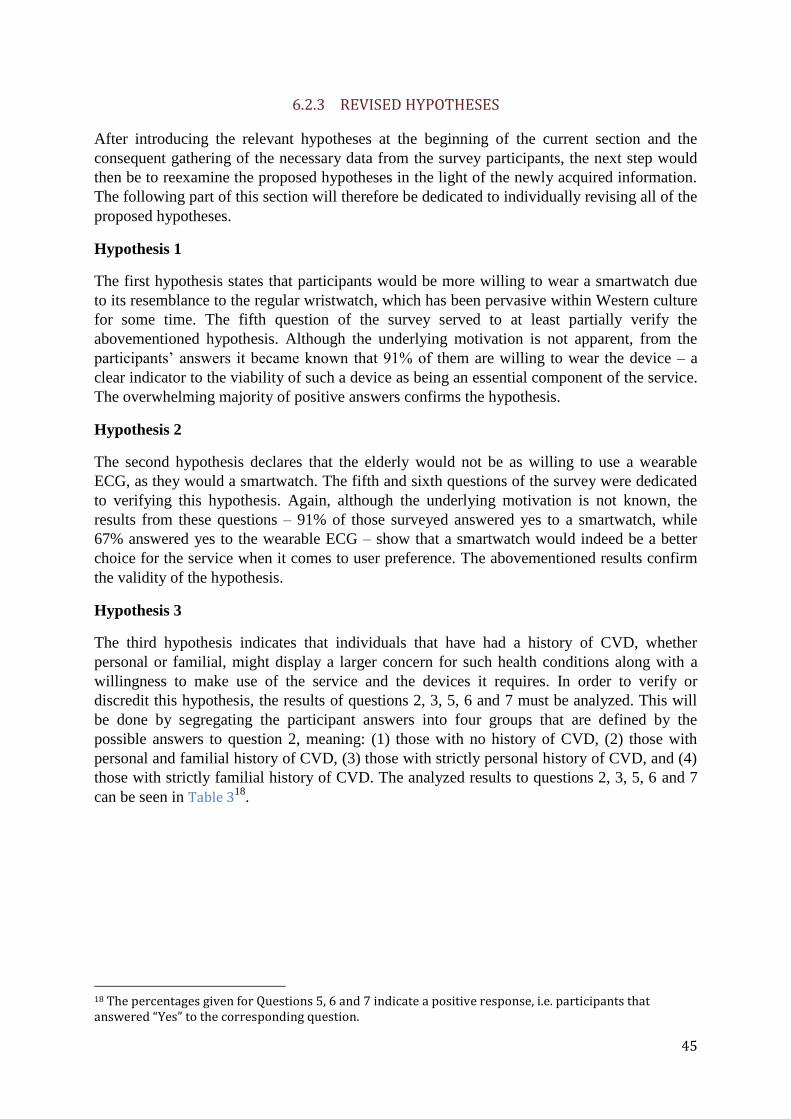
45
6.2.3 REVISED HYPOTHESES
After introducing the relevant hypotheses at the beginning of the current section and the
consequent gathering of the necessary data from the survey participants, the next step would
then be to reexamine the proposed hypotheses in the light of the newly acquired information.
The following part of this section will therefore be dedicated to individually revising all of the
proposed hypotheses.
Hypothesis 1
The first hypothesis states that participants would be more willing to wear a smartwatch due
to its resemblance to the regular wristwatch, which has been pervasive within Western culture
for some time. The fifth question of the survey served to at least partially verify the
abovementioned hypothesis. Although the underlying motivation is not apparent, from the
participants’ answers it became known that 91% of them are willing to wear the device – a
clear indicator to the viability of such a device as being an essential component of the service.
The overwhelming majority of positive answers confirms the hypothesis.
Hypothesis 2
The second hypothesis declares that the elderly would not be as willing to use a wearable
ECG, as they would a smartwatch. The fifth and sixth questions of the survey were dedicated
to verifying this hypothesis. Again, although the underlying motivation is not known, the
results from these questions – 91% of those surveyed answered yes to a smartwatch, while
67% answered yes to the wearable ECG – show that a smartwatch would indeed be a better
choice for the service when it comes to user preference. The abovementioned results confirm
the validity of the hypothesis.
Hypothesis 3
The third hypothesis indicates that individuals that have had a history of CVD, whether
personal or familial, might display a larger concern for such health conditions along with a
willingness to make use of the service and the devices it requires. In order to verify or
discredit this hypothesis, the results of questions 2, 3, 5, 6 and 7 must be analyzed. This will
be done by segregating the participant answers into four groups that are defined by the
possible answers to question 2, meaning: (1) those with no history of CVD, (2) those with
personal and familial history of CVD, (3) those with strictly personal history of CVD, and (4)
those with strictly familial history of CVD. The analyzed results to questions 2, 3, 5, 6 and 7
can be seen in Table 318.
18 The percentages given for Questions 5, 6 and 7 indicate a positive response, i.e. participants that answered “Yes” to the corresponding question.
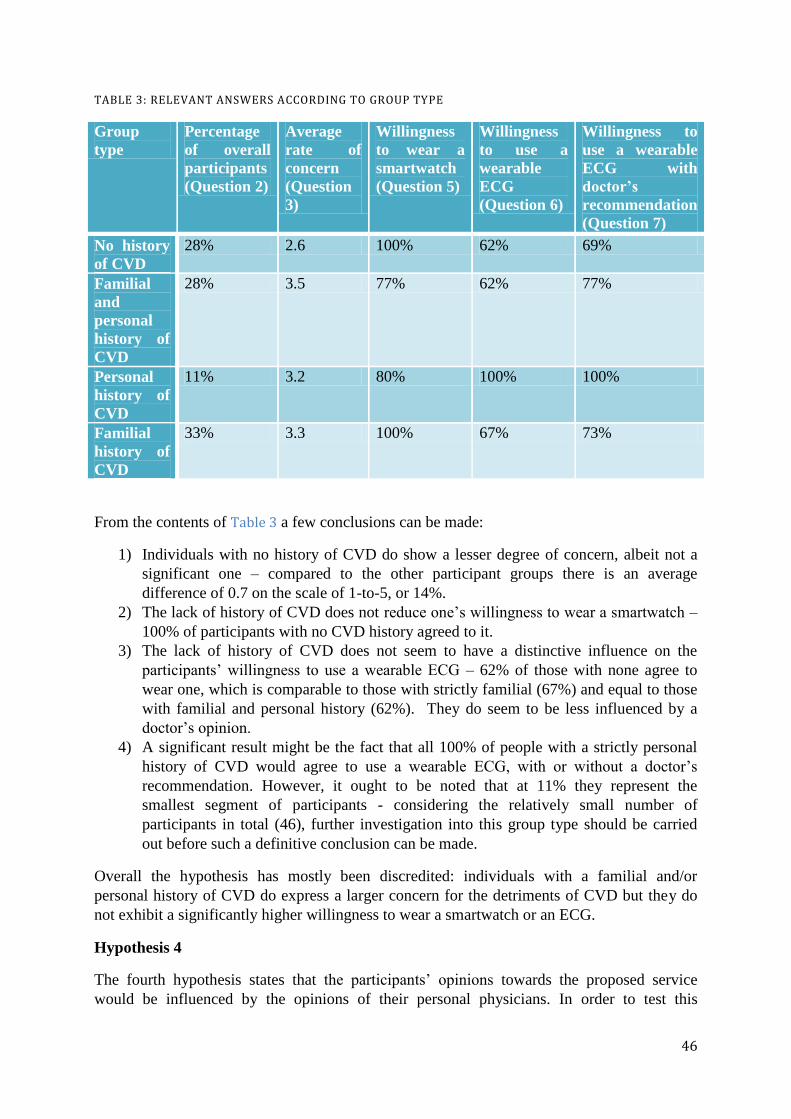
46
TABLE 3: RELEVANT ANSWERS ACCORDING TO GROUP TYPE
Group
type
Percentage
of overall
participants
(Question 2)
Average
rate of
concern
(Question
3)
Willingness
to wear a
smartwatch
(Question 5)
Willingness
to use a
wearable
ECG
(Question 6)
Willingness to
use a wearable
ECG with
doctor’s
recommendation
(Question 7)
No history
of CVD
28% 2.6 100% 62% 69%
Familial
and
personal
history of
CVD
28% 3.5 77% 62% 77%
Personal
history of
CVD
11% 3.2 80% 100% 100%
Familial
history of
CVD
33% 3.3 100% 67% 73%
From the contents of Table 3 a few conclusions can be made:
1) Individuals with no history of CVD do show a lesser degree of concern, albeit not a
significant one – compared to the other participant groups there is an average
difference of 0.7 on the scale of 1-to-5, or 14%.
2) The lack of history of CVD does not reduce one’s willingness to wear a smartwatch –
100% of participants with no CVD history agreed to it.
3) The lack of history of CVD does not seem to have a distinctive influence on the
participants’ willingness to use a wearable ECG – 62% of those with none agree to
wear one, which is comparable to those with strictly familial (67%) and equal to those
with familial and personal history (62%). They do seem to be less influenced by a
doctor’s opinion.
4) A significant result might be the fact that all 100% of people with a strictly personal
history of CVD would agree to use a wearable ECG, with or without a doctor’s
recommendation. However, it ought to be noted that at 11% they represent the
smallest segment of participants - considering the relatively small number of
participants in total (46), further investigation into this group type should be carried
out before such a definitive conclusion can be made.
Overall the hypothesis has mostly been discredited: individuals with a familial and/or
personal history of CVD do express a larger concern for the detriments of CVD but they do
not exhibit a significantly higher willingness to wear a smartwatch or an ECG.
Hypothesis 4
The fourth hypothesis states that the participants’ opinions towards the proposed service
would be influenced by the opinions of their personal physicians. In order to test this

47
hypothesis, the sixth question (regarding the wearable ECG) was repeated in place of the
seventh question, only it was modified so as that it would include the involvement of a doctor.
Comparing the results from the sixth and the seventh questions, it can be seen that the
segment of participants willing to use an ECG rises from 67% to the more substantial 76%.
Additionally, two of the participants chose “Other” as an answer to the seventh question – it
should be noted that both of them conveyed that they would be willing to wear such a device
after they got a second opinion from another doctor. Nevertheless, the overall results serve as
validation for the hypothesis.
Hypothesis 5
The fifth hypothesis proposed that elderly individuals that make use of the service would want
their personal physicians to have access to their medically-relevant data. This hypothesis is
verified by the eighth question of the survey with extremely positive results – with 100% of
those surveyed answering yes, this is the only question on which all participants agreed fully.
The unified response serves to validate this hypothesis.
Hypothesis 6
The sixth hypothesis introduces the idea that in emergency situations individuals would want
to contact more than just emergency services. This hypothesis was verified with the ninth
question of the survey, which showed that most participants do want to contact emergency
services (93.5%), however almost as many (82.6%) want a family member involved.
Additionally, half of the participants (52.2%) indicated that they also wanted their personal
physician to be contacted. The results above stated confirm the validity of the hypothesis.
Hypothesis 7
The seventh and last hypothesis states that elderly individuals might not feel comfortable with
contacting emergency services upon the detection of an event. This was tested with the ninth
question of the survey, where 93.5% of participants indicated that they wanted to make use of
emergency services. This would mean that only 6.5% of participants rejected emergency
services as a potential contact, thus discrediting the proposed hypothesis.
Additional conclusions
The results from the survey have also lead to some additional conclusion. To start with, the
initial overview of the devices within the Vixi system (Figure 9) has to be reexamined. It is
significant that even with the verification of Hypothesis 2 and with an accompanying
recommendation from their personal physician a quarter of participants did not answer
positively to the notion of a wearable ECG. Considering the conclusions from the Ischemic
Heart Disease chapter, these results can prove to be detrimental to the overall accuracy of
Vixi. Therefore, it is proposed that Vixi should be able to function in two different system
configurations. The first configuration would include the user’s smartwatch (to which the
participants of the survey demonstrated an almost unanimous approval and willingness to
wear), as well as their smartphone. This would be a more appealing option to a wider
customer base but the loss of data input from the wearable ECG is also accompanied by a loss
of diagnostic precision. However, there are some certain additional facts, which would allow
for the improvement of the diagnostic precision of the smartwatch-based solution. To begin
with, research within the Ischemic Heart Disease chapter, concluded that among the possible
48
symptoms for AMI are dizziness and even syncope. Although a syncope presenting in
children in young adults does not necessarily signify a life threatening condition[145], when it
comes to the elderly it can be an indicator to a critical cardiac event[146]. Being aware of the
falls that often accompany dizziness and syncope episodes, especially among the elderly, it is
proposed that fall detection should be incorporated within the service. What is more, the
presence of fall detection could help distinguish between sustained arrhythmias at RHR and
arrhythmias that are due to physical exertions – sports activities, for example, can require an
increase of oxygen intake which would come across as a tachyarrhythmia. This will also
create additional value to the service, given that falls themselves in general are a substantial
cause for concern among the elderly. It is estimated that up to 35% of people above 65-years-
old and up to 42 % of those aged over 70 suffer from falls[147]. Elderly individuals that have
experienced a fall often require hospitalization (more than 50% of hospitalization cases
among the elderly are due to falls[147]) and are a major cause of injury-related death with
death rates due to falls tending to rise with the increase of age[147]. From the Smartwatch
Capabilities section of the State of The Art chapter it is known among the onboard sensors of
most available smartwatches is the accelometer and that it is almost always accompanied by
the presence of a gyroscope, as well. The Fall Detection section of the aforementioned chapter
introduced the fact that there are a number of existing fall detection solutions that rely purely
on data from accelometers or that are accelometer based. Therefore, it is proposed that fall
detection would be incorporated within the smartwatch via the utilization of its onboard
accelometer and gyroscope.
It ought to be noted that despite the added value to the service, fall detection contributes to the
detection of cardiac events when they have already had a significant enough of an impact on
the human body, i.e. when the brain has suffered from a lack of oxygen. In order to prevent
events from progressing to such an extent, as well as the possible accompanying injuries, a
wearable ECG should still be a part of Vixi. An ECG would also be able to detect cardiac
events that do not result in syncope, or even ones that seemingly have no outward
symptomatic manifestation. To iterate once more, the participants of the survey showed some
unwillingness towards the ECG, indicating that a scenario where users would be willing to
wear it on a daily basis for an indefinite amount of time cannot be relied upon to have
credibility in real world exploitation. However, the participants’ apprehension was somewhat
eased by the potential recommendation of a doctor. Additionally, research conducted in the
Ischemic Heart Disease chapter indicated that within the first year after an ACS incident there
is a significantly higher risk of morbidity. It is therefore proposed that the wearable ECG
component of the system be available for all potential users but that it should be marketed
more aggressively to elderly individuals that have had an ACS episode, preferably with the
involvement of medical professionals.
6.3 EXPERT INTERVIEW
The current segment of the Analysis chapter will be dedicated to the fulfillment of one of the
objectives, presented in section 2.2 of the Problem Formulation chapter:
Get in contact with professionals in the field of medicine or medically-relevant areas so as to
discuss and affirm the discoveries, regarding the physiological aspects of the system.
An important component of the algorithm being developed is medical research. Given the
strictly engineering background of the developer it was deemed necessary that an interview
49
with an expert in the medical or biological field ought to be conducted. Towards the
fulfillment of that goal, a number of potential experts were contacted. This included reaching
out via online communication to several hospitals within the Greater Copenhagen Area (they
can be found in the Appendix), as well as to the official representatives of the Danish
Cardiovascular Research Academy (DaCRA). As a result of these efforts an interview was
arranged - via the chairman of DaCRA - with Jens Jacobsen, an associate professor with the
Department of Biomedical Sciences of the University of Copenhagen. The interview began
with a brief introduction into the topic of the Thesis project, along with some details about the
system being designed. This information had to be shared in order to provide context for the
other party, since the topic overview was only succinctly described in the contact email for
the sake of brevity. Although a number of questions had been prepared beforehand in
expectation of the interview, the interview itself was in the form of a free flowing
conversation. Some of the prepared questions were asked at appropriate times during the
conversation, whenever they were touched upon thematically and some were asked at the end
of the interview. The following section provides an overview of the topics discussed in the
interview, along with the resulting information from the interview itself.
Leading causes of death and IHD
The premise of the current Thesis – regarding what the leading causes of death among the
elderly are, about the nature of IHD, etc - relies heavily on results from secondary research.
As it is necessary, only reliable sources were utilized for secondary research. However, there
was a concern that the Engineering background of the author and the lack of experience in the
medical sciences would lead to possible misinterpretation of the information available.
Starting with the leading causes of death among the elderly, the interviewee confirmed that
they are indeed IHD and stroke. Additionally it was confirmed that the dangerous IHD
conditions that generally lead to death are the ACSs, i.e. unstable angina, AMI and SCD.
Another key component behind the motivation of the Thesis also received affirmation and that
is the presence of the problem with the long lie among elderly individuals and the severity of
its consequences.
Sudden Cardiac Death
Of all the ACSs, perhaps the most severe one is Sudden Cardiac Death. The concern of the
author was that, given the nature of the condition, it would require the most immediate
medical attention. A discussion with the interviewee revealed that that was the case, however,
there is one significant consideration that has to be taken into account. SCD results in the
cessation of blood circulation throughout the body, therefore depriving the body’s organs of
oxygen. Perhaps the most significant impact of that lack of oxygen is on the brain - it can take
only three to four minutes of lack of oxygen before brain damage sets in. Once that happens,
brain damage can be a substantial burden and a great detriment to the quality of life to an
oxygen deprivation survivor. Even discounting the effects of brain damage, a SCD victim still
has only a few minutes where they can successfully be resuscitated. It was concluded that,
outside of a hospital, a SCD victim would have a chance of survival if, either there was
someone with them who was capable of performing CPR on them until medical help was
available, or if there was an automated external defibrillator nearby that another person could
use on the affected party.

50
Possible actions until receiving access to medical help
During the pre-study research phase, among other information gathered regarding the leading
causes of death, was also data as to the emergency medical protocols into their treatment.
Among the prescribed medication in the instance of MI is aspirin. Given that aspirin can
nearly be considered a household item, two possibilities came into question: 1) should
individuals be instructed to take the aforementioned medicine if it is available in their home
and 2) are there any other actions that individuals can take before emergency services arrive
or before they reach a hospital. Regarding both of these notions, the expert related that it
would be inadvisable for an individual to do anything else then to get access to professional
medical help. It is a matter of expediency, once an individual becomes aware that they are
experiencing an emergency situation, their primary goal ought to be to get themselves to a
medical establishment.
Sensitivity of single-lead ECGs
As it has already been remarked upon in section 5.2.1, a number of the wearable ECGs
available on the market rely on the utilization of only one lead, i.e. they are single-lead ECGs.
This has lead to a concern that the symptoms to look for in suspected ACSs may not be as
visible on a single-lead ECG as they are on a standard 12-lead device. The interviewee did
agree that this could present as a challenge when attempting to detect dangerous patterns.
More on this topic is presented in the Future Recommendations chapter because due to time
constraints this matter is considered out of scope. The interviewee did suggest that even
though there is a possibility that even though a wearable ECG would not provide the same
detailed readings as a standard 12-lead, it would still be capable of detecting the various
arrhythmias that can accompany ACSs.
6.4 SCENARIOS
Scenarios are useful tools for depicting situations where a product or a service can be of use.
Not only that, but they allow for utilizing simple stories in order to get into the mindset of the
everyday user[148]. Scenarios provide a usability context to a product in development, so that
the end result of the development process does not provide only functionality, but also an ease
of use which is a desirable feature for the average potential user. That is especially valid for
the algorithm being developed here, whose target population segment can have difficulty
handling newer technologies – consider the results of the survey that has been carried out:
close to 20% of those surveyed had never owned a smartphone and 15% overall had never
even worked with one before. While taking usability into account is one benefit to utilizing
scenarios in any development process, another is that they illustrate what the product being
developed would consist of, in the sense that the various stakeholders with various technical
competences would be able to fully comprehend it[148]. Scenarios can also be a constructive
step on the way to determining what requirements have to be fulfilled[148]. Two scenarios
will be presented within the current section, each one describing the regular activities of a
different senior citizen as an actor over the course of a single day.
51
Scenario 1
The first scenario will follow “a day in the life” of a 65-year-old woman, named Jane who
lives on her own. Jane is having a busy day because she has to get to work by 8 o’clock;
therefore she gets up at half past 6 in the morning. The first thing she does is to reach over to
her nightstand, where her smartwatch has been charging while she was sleeping. She puts it
on and then starts her day – this includes taking a shower, getting dressed, having breakfast.
By a quarter past 7 she has left her apartment, after which she gets on her bike and rides it to
work, where she continues to spend most of her day. After lunch she starts to sweat and she is
feeling nauseous. Jane does not get too concerned, she thinks she just has not gotten over the
flu she had a few days ago so she decides to go home early. After Jane gets home she still
does not feel any better, in fact she starts to feel more and more anxious. Suddenly her
smartwatch starts sounding an alarm; she does not turn it off because needs help. Her
daughter calls her on the phone, asking her if anything’s the matter – Jane relates her
symptoms, expressing her worry and anxiety. Her daughter comes by as soon as possible in
order to take her to the hospital, where they discover that Jane was having unstable angina
that has been developing into an AMI.
Scenario 2
The second scenario will focus on John, an 80-year-old retiree who lives on his own. He
suffers from atherosclerosis, as well as diabetes. Lately he has been having some trouble
sleeping so he is usually up by 6 o’clock and today is no different. The first thing he does is to
get a shower and get dressed. While he is doing that he notices that the wearable ECG is still
stuck on his chest (his doctor recommended that he wear the ECG after his MI) but he realizes
he forgot to put on his smartwatch when he first got up. He corrects this mistake and keeps
going with his day. He eats some breakfast, takes his medications and then decides to watch
some television. While he is watching he suddenly hears the alarm on his smartwatch – he
feels fine so he turns the alarm off. Later on he hears the alarm again – at this moment John
starts to get concerned so he decides to call a cab and goes to the hospital, where he is
diagnosed as having a silent MI.
Scenario 3
The third scenario to be introduced revolves around Jill, a 75-year-old woman who lives with
her husband of the same age. Although she is a retiree, she likes to keep herself busy and so
she works part-time. Today is another usual day for Jill: she wakes up at 7 o’clock in the
morning, puts on her smartwatch, which has been charging all night, gets ready for the day
and by 8 o’clock she has left for work. By early afternoon she has finished working and
decides to walk home since the weather is nice. As she is walking she suddenly starts to have
trouble catching her breath; a few minutes later she starts to feel dizzy and not long after that
she faints. Jill does not live in a busy neighbourhood and at this time of the day there is no one
in sight. A few minutes later she is suddenly aware of a siren sounding in the distance – it is
an ambulance coming to pick her up and take her to a hospital, where it is discovered that she
is experiencing ventricular tachycardia. While she was unconscious Vixi contacted the
emergency services to notify them of Jill’s critical condition, along with her current position,
where she can be located.
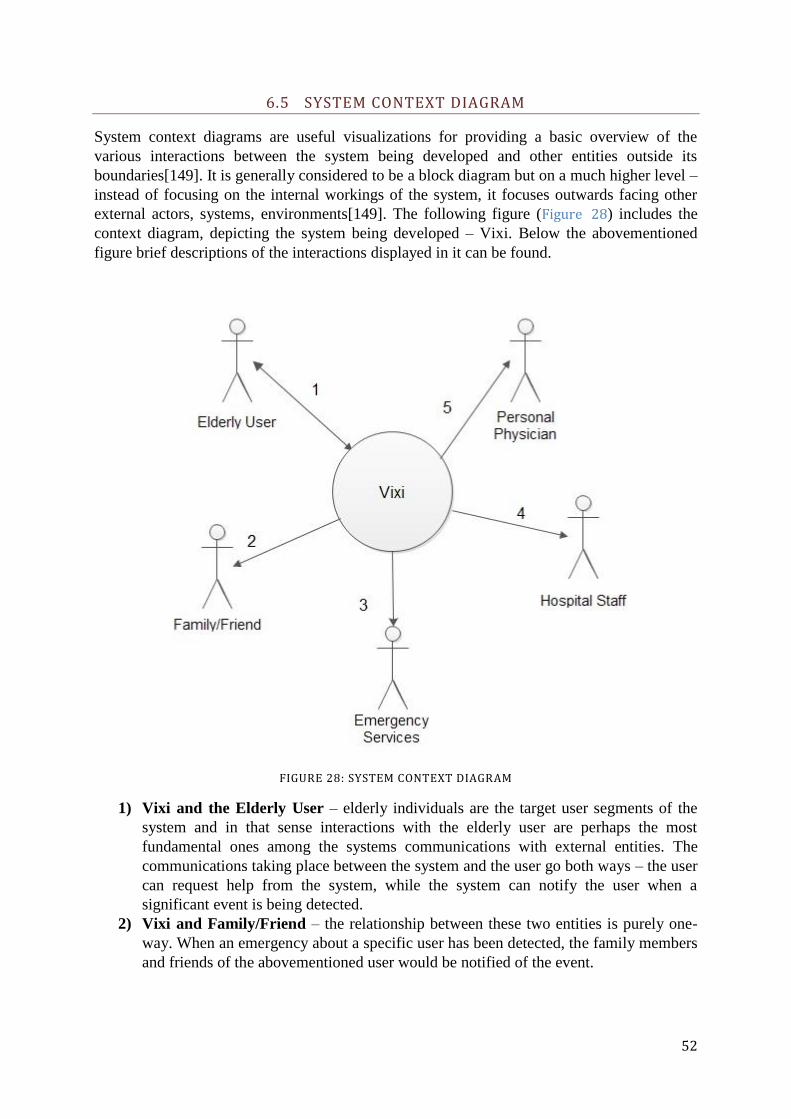
52
6.5 SYSTEM CONTEXT DIAGRAM
System context diagrams are useful visualizations for providing a basic overview of the
various interactions between the system being developed and other entities outside its
boundaries[149]. It is generally considered to be a block diagram but on a much higher level –
instead of focusing on the internal workings of the system, it focuses outwards facing other
external actors, systems, environments[149]. The following figure (Figure 28) includes the
context diagram, depicting the system being developed – Vixi. Below the abovementioned
figure brief descriptions of the interactions displayed in it can be found.
FIGURE 28: SYSTEM CONTEXT DIAGRAM
1) Vixi and the Elderly User – elderly individuals are the target user segments of the
system and in that sense interactions with the elderly user are perhaps the most
fundamental ones among the systems communications with external entities. The
communications taking place between the system and the user go both ways – the user
can request help from the system, while the system can notify the user when a
significant event is being detected.
2) Vixi and Family/Friend – the relationship between these two entities is purely one-
way. When an emergency about a specific user has been detected, the family members
and friends of the abovementioned user would be notified of the event.

53
3) Vixi and the Emergency Services – these interactions are also unidirectional. In
certain critical situations emergency services could be contacted so as to provide the
most immediate medical attention.
4) Vixi and Hospital Staff – although out-of-scope for the current project, a full-scale
solution would include the possibility of hospital staff members being able to access
the recorded by the system medically-relevant data, such as pulse and ECG readings.
This will be elaborated on in the Future Recommendations chapter.
5) Vixi and the Personal Physician – another segment of the full-scale solution that is
mostly out-of-scope for the current project. Included is the option to notify a user’s
personal physician whenever an emergency is underway. What will be elaborated on
in the Future Recommendations chapter is the functionality of the physicians being
able to access their patients’ medically-relevant data.
6.6 USE CASES
Among the various benefits of utilizing scenarios during the development process is that they
can be used to extract use cases[148]. Where scenarios are beneficial for providing a
comprehensive overview of the functionalities of the product being developed to all
stakeholders, regardless of their technical background and preexisting knowledge; use cases
are the tools of more advanced stakeholders[150]. In other words, use cases are scenarios
looked at through the prism of a developer’s point of view. Use cases provide an overview of
the interactions taking place between the product being developed and other outside entities,
such as actors or other products/systems[151]. The system being developed is considered as a
black box, meaning that its internal workings are not the focus of the use case, but rather the
way it interacts with a given actor/system[151]. The figure below depicts a use case diagram
(Figure 29). It is a visual representation of the various use cases along with the actors that are
associated with them. The figure consists of a Use Case Diagram, which is one of the many
tools of the Unified Modeling Language (UML). UML is a part of the current development
process due to its general popularity among the developer community. Additionally, brief
descriptions of the use cases seen in the figure are provided below it.

54
FIGURE 29: USE CASE DIAGRAM
1) Register as a User
The first use case to be discussed is the one, taking place whenever an elderly user would
initially register to Vixi service. Due to the personalized nature of the Vixi service, each user
would have to create his/her own individual account. This would involve choosing a
username, a password, as well as some basic personal information such as their name.

55
Additional information would include age, preexisting medical conditions and emergency
contacts.
2) Initial Setup
The second use case to be examined is the “Initial Setup”. Given that different people have
differentiating physiologies, what constitutes as “regular” vital signs - such a variation can be
observed with the resting heart rate, which was noted upon in the Ischemic Heart Disease
chapter – can be a very singular in nature. In order to improve the overall accuracy of the
service, it would be extremely beneficial if the RHR of the individual user was accounted for.
The RHR can be measured by two of the components of the system – the smartwatch and the
ECG. Given the higher accuracy of the ECG, if a given user is utilizing both devices then the
RHR will be extracted from it. However, if that is not the case, then the RHR will be
measured directly by the smartwatch. Other possible additional input could be data on pre-
existing conditions, etc.
3) Login
The third use case that can be seen in the figure above is the one, titled “Login”. This use case
is used to depict the process of when the various users would try to login into their account.
As it has been mentioned in the summary of the first use case, upon registering with the
service all users have to provide a personalized username and password. It is that username
and that password in question that will be provided by the stakeholders in order to log into
their own personal account. This process is intended to take place locally, on the user’s
smartphone, where after logging in they would have access to their logged data about their
personal health.
4) Backup Medical Data
The “Backup Medical Data” use case is mostly connected to the ongoing functionalities of the
service but also to potential emergency situations. During the everyday usage of the service,
all medically-relevant data (such as pulse and ECG readings) that has been collected about the
user will be stored continuously so that later it could possibly be used for diagnosing
purposes. Data will be stored on the user’s smartwatch, as well as backed-up on their
smartphone. The users themselves would be able to review their own personal data at any
time.
5) Continuous monitoring
The current use case constitutes the ongoing processes of the smartwatch application. It is
constantly receiving input about the user’s status from its own sensors, possibly from the
wearable ECG as well. Via its internal algorithm that includes a number of thresholds, the
application will continuously be updating its user’s status by referring to them being in one of
a set of predetermined states.
6) View recorded data
This “View Recorded Data” use case includes the functionalities involved with enabling the
user to access the medically-relevant data, recorded about them by the Vixi application. Users
will be able to view the data logs of their heart rate and ECG readings. In order to be more
visually comprehensive, the abovementioned logs will be accessible through the smartphone
56
application. However, at any point in time the user will be able to view their current heart
rate, ECG readings or status on their smartwatch.
7) Emergency Alert
The “Emergency Alert” use case has perhaps the most significant weight when it comes to it
providing the most beneficial functionalities for the target user, i.e. the elderly. This use case
also includes a multitude of processes within itself. When it comes to the interactions with the
different actors, they are the following:
i. User – this interaction can start in two ways – either when the system determines that
the user requires emergency help and it notifies him/her, or when the user activates the
emergency alert himself/herself. In both cases if there is a “false alarm” the user
should be able to deactivate the alert before any further interactions with other actors
take place.
ii. Emergency services (112) – if the user has not turned off the alert and if the system
has determined that the emergency event taking place is severely critical, then
emergency services would immediately be contacted. If that is not the case, then the
system should notify one of the other two following actors.
iii. Personal Physician – if the user has not turned off the alert after a certain period of
time then, depending on what emergency situation has been detected, their personal
physician could be notified of the situation. The role of this actor in this use case could
be eliminated if the user had not already indicated who their personal physician is in
their account, prior to the emergency event.
iv. Family member / Friend – much like with the actor discussed above, the current one
can be contacted if the alert has not been disabled by the user and depending on the
emergency event that has triggered the alert. Once more, if such an actor has not been
indicated in the user’s account prior to the emergency event then would not play a role
in the current use case.
6.7 REQUIREMENTS SPECIFICATION
The current segment of the chapter is intended to fulfill the following objective from section
2.2 of the Problem Formulation chapter:
Produce a valid Requirements Specification.
An essential element of the development process is the requirements specification. It contains
the so-called “requirements”, i.e. features that the product being developed has to possess.
The requirements to be featured in the following section are to be extracted from the previous
sections of this chapter, including the survey disseminated among elderly individuals, the
expert interview, the scenarios and use cases. To be more precise, there is a more direct
connection to the latter two: one of the purposes of scenarios is to extract relevant use cases;
from these use cases requirements can be discovered[148]. A requirements specification
contains two types of requirements – functional and nonfunctional – and both of them will be
presented in the following sections. All requirements listed in the following two sections are
accompanied with brief descriptions, their origin, as well as their prioritization. It ought to be
noted that the prioritization technique utilized in this chapter is the MoSCoW method. It
allows for the division of requirements into four levels of “importance” and they are the

57
following: (1) Must (M) – requirements of the highest priority that have to be fulfilled, (2)
Should (S) – requirements that have a high priority but which may not necessarily be fulfilled,
(3) Could (C) – requirements of a lower priority that would be fulfilled if there are resources
available, and (4) Won’t (W) – requirements that would not be implemented during the
current development stage but rather at a potential future point in time[152].
6.7.1 FUNCTIONAL REQUIREMENTS
Functional requirements describe the functionality of the developed product, that is what it
can do for the user[151].
№ Name Description Origin19
Priority
F1 Register
username
The user will be able to register their own
chosen username.
1) S
F2 Register
password
The user will register their own password. 1) S
F3 Registration
notification
The user will be notified whether the
registration process has been successful or not.
1) S
F4 Login The user will be able to login to their
smartphone application.
3) S
F5 Request for
permissions
The Vixi application will ask the user for the
necessary permissions upon installation time.
1) S
F6 Measure RHR Upon initialization of Vixi, either the ECG, or
the smartwatch will be used to measure the
initial RHR of the user.
2) S
F7 Measure heart
rate
The system will be able to measure the user’s
heart rate.
5) M
F8 Measure ECG The system will be able to measure the user’s
electrocardiogram.
5) W
F9 Input pre-
existing
conditions
The user will have the option of inputting
information of pre-existing medical
conditions.
2) C
F10 Display
current heart
rate
The smartwatch application will be able to
show the user their current heart rate.
6) M
F11 Display heart
rate logs
The smartphone application will be able to
show the user logs of their previously
recorded heart rates.
6) S
F12 Display
current ECG
readings
The smartwatch application will be able to
show the user their current ECG readings.
6) W
F13 Display ECG
readings logs
The smartphone application will be able to
show the user logs of their previously
recorded ECG readings.
6) W
F14 Notify user of Once a certain state has been established, the 7) M
19 The numbers that can be seen in the “Origin” column refer to the heading numbers of the sections within the report being referenced.

58
alert smartwatch application will notify the user.
F15 Turn off alert The user will be able to turn of the alert. 7) M
F16 Notify
emergency
contacts
If the user has not turned off the emergency
alert their emergency contacts will be notified
of the alert.
7) S
F17 Notify
emergency
services
If the user has not turned off the emergency
alert and their status is sufficiently severe,
then emergency services will be notified.
7) S
F18 Educate user The system will inform the user as to the
nature of symptomatic manifestations of
relevant conditions that cannot be detected by
the system itself.
4.2 S
F19 Activate alert The user will be able to initiate the emergency
alert on their own.
7) M
F20 Fall detection The smartwatch will be able to detect when
the user has suffered a fall
4.3 M
6.7.2 NONFUNCTIONAL REQUIREMENTS
Nonfunctional requirements are somewhat complementary to the functional ones in the sense
that, while functional requirements describe what functions a product/system should perform,
nonfunctional requirements describe how they should be performed so that a certain quality-
of-service is maintained[151].
№ Name Description Origin Priority
NF1 Backup data The smartwatch application will periodically
backup its logs to the smartphone application.
4) S
NF2 Hub-and-
spoke
topology
The data flow between the different devices
will follow the hub-and-spoke model with the
smartwatch acting as the hub[153].
6.2.3 M
NF3 Smartphone
platform
The smartphone application will be available
for Android and iOS.
2.3 W
NF4 Smartwatch
platform
The smartwatch application will be available
for Android Wear and watchOS.
2.3 W
NF5 Access to
GSM
networks
The smartwatch will be able to establish a
connection with a GSM network.
5.1 S
NF6 Pulse
detection
capability
The smartwatch will be able to measure the
user’s pulse.
6.1 M
NF7 Network fault
tolerance
The smartwatch application will be able to fail
gracefully if there is a signal drop or a
significant signal strength reduction.
7) C
NF8 Prioritize
thresholds
Due to the power constraints on the
smartwatch, it will prioritize the utilizing of
5.4 M

59
thresholds above machine learning in order to
spare CPU and memory resources.
NF9 Acquire
position
The smartwatch will be able to discover its
user’s current physical location.
6.4 S

60
7 DESIGN AND IMPLEMENTATION
The current chapter is dedicated to answering the main research question via the completion
of a number of objectives as to be presented in the individual section of the chapter.
7.1 SYSTEM ARCHITECTURE
The first section of the design chapter is dedicated to Vixi’s system architecture. This is so as
to fulfill the following objective from section 2.2 of the Problem Formulation chapter:
Determine what devices would be necessary so as to fulfill the functionalities of the system.
The Analysis chapter included a survey among potential users, an interview with an expert,
day in the life scenarios that illustrate how Vixi would function, use cases to provide more
detail. All these components were utilized as source material for the crafting of a requirements
specification, with which the chapter was concluded. The proposed architecture within the
current section is based on that exact requirements specification. What is more, whereas the
specification takes on the form of a list of individual requirements for the various facets of the
system, the system architecture provided in the current section aims to provide an overall
view of the Vixi system as a whole.
The figure bellow (Figure 30) depicts a block diagram that includes all possible components
of the Vixi system.
FIGURE 30: SYSTEM BLOCK DIAGRAM
61
The block diagram that can be seen in Figure 30 illustrates the three devices that would
participate within Vixi. The data flow between the devices follows two point-to-point
connections with a common end point – the smartwatch - which essentially constitutes a hub-
and-spoke topology, thus satisfying requirement NF2 from the requirements specification.
Given that the wearable ECG device can be an optional component of Vixi (as concluded in
section 6.2.3 of the previous chapter), any essential processes have been moved to the
smartwatch. The ECG device itself is only utilized in order to gather data about the electrical
activity of the user’s heart and to send its ECG readings to the smartwatch.
The user’s smartphone is the second component of the system, as it can be seen in Figure 30.
So as to satisfy requirement NF3 of the requirement specification, the aforementioned
smartphone can have one of two operating systems – either Android, or iOS. The
accompanying Vixi smartphone application will be utilized so that data from the smartwatch
can be transferred to the smartphone, which will act as a backup. The information to be stored
within the smartphone will be pulse rate readings from the smartwatch, the ECG readings
from the wearable ECG device (if there is any) and information on detected falls (if any had
taken place). Additionally, the data that has been backed up within the smartphone will be
available for viewing via the smartphone application. This would also be a beneficial
contribution towards improving usability, given that generally the smartphone screen sizes are
larger than those of a smartwatch, meaning that the visual representation of the data would be
more comprehensive.
The results from the Elderly Survey that had been conducted varied among the different
questions asked. However, a notable result was the unanimous response to the question
regarding the possible involvement of a personal physician within the service – 100% of users
agreed that they would like their doctor to have access to their medically relevant data.
Nevertheless, in order to appease potential privacy concerns due to the personal nature of the
recorded information it has been decided that user data will be stored locally, on the user’s
devices. It is also because of this that data from the user’s smartwatch is also stored within
their smartphone – this serves as a backup. Therefore, the inclusion of medical professionals
within the system is left for a latter development process stage, but what is known is that such
an extension to the system would include the sharing of sensitive information between two
entities. However this information is being delivered it would require some form of
authentication and because of this the establishing of some basic credentials – such as
username and password - upon the initialization of the service is proposed (F1, F2, F3 and
F4). Given that smartwatches are generally designed for hands free use, it is proposed that
these extensibility provisions take place within the smartphone application. The final element
of the smartphone application presented in the system block diagram is the one regarding
“Educational notifications”. It is related to the research conclusions of the Ischemic Heart
Disease chapter and the fact that users would potentially be taking advantage of the service
without utilizing the wearable ECG device. Upon examination of Table 1 while excluding any
ECG input it becomes apparent that the system would not be able to detect come ACSs. An
example is unstable angina – it tends to manifest itself during times at rest, therefore it would
not be reflected in the heart rate readings. It also does not generally lead to syncope and
therefore relying on fall detection solely is unadvisable. It can also present itself with a variety
of symptoms (not only the traditional chest pain), especially among women. It is then a point
of concern that, due to their inability to recognize significant symptoms, users would dismiss

62
them thus adding the risk of the unstable angina further deteriorating into an MI. Therefore
push notifications with information regarding ACS symptoms are to be issued on a periodic
basis. As was the case with viewing stored data, the reason the notifications are to be
displayed on the users’ smartphones is related to their generally larger screen sizes, making
them more suitable for displaying longer forms of text.
The last component of the Vixi system is the smartwatch. Requirement NF4 of the
requirements specification stated that the smartwatch application should be available for
Android Wear and watchOS – a requirement that is necessary, given that the smartwatch
should be able to function along with Android- and iOS-based smartphones. An advantage of
using a block diagram is that it can provide a high-level view of the system being developed
and that is also how it has been utilized in the current chapter. That is what makes the diagram
on Figure 30 equally relevant for the Android Wear and the watchOS version of the Vixi
smartwatch application. As it has already been established, of two main Vixi devices –
smartwatch and wearable ECG – only the former will always be present. The user’s
smartphone is also a component of Vixi but it ought to be considered that the user might not
have their smartphone with them at all times, whereas this would not be true for their
smartwatch. Therefore, all core system processes are to be concentrated within the
smartwatch application itself. When it comes to sensory input, the smartwatch will
continuously collect data from two of its onboard sensors and those are its PPG sensor and its
accelometer. What is more, if the user is also utilizing an ECG device, then additional sensor
input in the form of ECG readings will be received from the ECG device. The combined
sensor input will then be processed by the application’s algorithm for detecting critical events.
The output of the algorithm has a two-fold purpose. Firstly, the state of the user will be
updated, based on the outcome of the algorithm. Additionally, some of the data will be stored
on the smartwatch, such as the heart rate and ECG readings, along with information on any
detected falls.
If a critical event has been detected by Vixi then the user’s state will be updated accordingly.
Once such a significant state has been indicated, then the user will be notified of the event.
After the user has been alerted of their situation they would be given the opportunity to turn
off the alarm - as it has been dictated by requirement F15 – thus essentially manually
modifying their own state. If the user does not reject the alert, then action will be taken to
notify their emergency contacts. Part of the information to be shared will include the user’s
physical location, meaning that location services will be utilized in this situation. The
aforementioned services will acquire the user’s current position, which will then be sent,
along with other necessary information, to their emergency contact. An existing possibility is
that the user will have symptoms that are undetectable by the system (such as the previously
mentioned example with unstable angina). For such situations it is proposed that the user
should be able to initiate the emergency alert (F19), even when the system has not detected a
significant event. This could also provide additional value to the system, given that potentially
users could utilize this functionality when they are experiencing other, non-IHD-related health
emergencies, such as a stroke.

63
7.2 ALGORITHM FOR DETECTING A CRITICAL EVENT
The current section of the chapter will be dedicated to the fulfillment of the following
objective, presented in the Problem Formulation chapter:
Devise an algorithm for detecting critical ischemic heart disease-related conditions.
The algorithm to be developed has a vital role within the Vixi service. The previous section
clarified the proposed overall system architecture for Vixi. From the aforementioned
architecture an overview of Vixi’s comprising components was provided, as well as their
relation to one another. What still has to be clarified, however, is how these components work
together in order to detect dangerous ischemic heart disease conditions, i.e. how can Vixi
determine whether its user is experiencing an emergency or not. This will be looked into
within the following sections.
7.2.1 FALL DETECTION ALGORITHM
As it has already been discussed in the System Architecture section of the current chapter, the
inclusion of fall detection within the smartwatch application is a necessity in order to improve
the precision of the service when detecting potentially fatal cardiac conditions. Research,
conducted in the State of The Art on the matter revealed that - largely due to the significant
threat that falls pose for the elderly by themselves - there are a number of solutions, dedicated
to fall detection. From the aforementioned research it became apparent that the majority of
them rely on acceleration data. This is extremely beneficial for the current development
process since the Smartwatch Capabilities section of the State of The Art chapter related that
accelometers are a common feature among smartwatches. Of the fall detection algorithms,
examined in the abovementioned chapter, there are two - proposed by two different Swiss
teams - that involve devices placed on the user’s wrist. These two solutions are of a larger
significance since fall detection algorithms rely strongly on the physics behind body motion.
From a purely biological perspective, different body parts would behave differently during a
fall. Additionally, they also have varying behaviour during everyday activities, meaning that it
is inadvisable to depend on equivalent detection requirements for different body placements.
Of the two aforementioned solutions, one uses a simple wristwatch (“Speedy”[111]) and the
other (F2D) a smartwatch[113] – the wristwatch naturally has more limited capabilities,
however at the time of publishing the smartwatches available also had extremely limited
capabilities. The Speedy solution achieved an overall sensitivity of only 68%, while the F2D
solution achieved a much higher sensitivity of 93%. What is of interest is that F2D does not
rely on a different way of data processing – in fact, while Speedy calculates the norm (sum
acceleration vector) from which it calculates two different velocities, F2D only calculates the
norm. The team behind Speedy concluded that they had to further refine the accepted
threshold values; given that from their testing phase they did not encounter any false
positives, it seems as if they could have sacrificed detection sensitivity for the sake of
specificity. The F2D algorithm included the extraction of the sum acceleration vector only;
however the resulting values are compared to, not only one, but two separate thresholds. It is
this approach that would be utilized in Vixi since not only did it achieve a higher accuracy
rate, but it can be argued that it puts a lesser strain on computational resources because the
continuous computations are reduced from performing three simultaneous calculations at a
time to one. The complete fall detection algorithm is depicted via a flow chart in Figure 31,
however in order to reduce the complexity of the flow chart, two distinct processes within it -

64
“Process accelerometer data” and “Suspected fall” - are illustrated separately in Figure 32 and
Figure 33, respectively.
FIGURE 31: FALL DETECTION ALGORITHM
FIGURE 32: PROCESS ACCELEROMETER
DATA
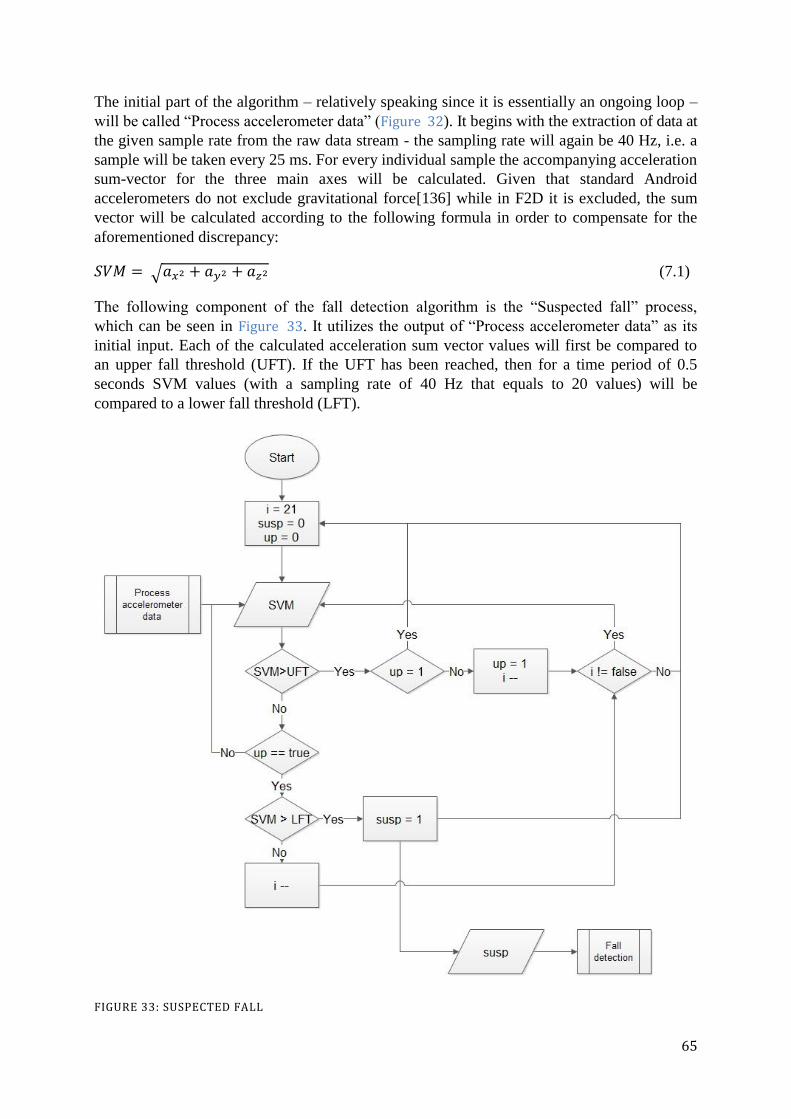
65
The initial part of the algorithm – relatively speaking since it is essentially an ongoing loop –
will be called “Process accelerometer data” (Figure 32). It begins with the extraction of data at
the given sample rate from the raw data stream - the sampling rate will again be 40 Hz, i.e. a
sample will be taken every 25 ms. For every individual sample the accompanying acceleration
sum-vector for the three main axes will be calculated. Given that standard Android
accelerometers do not exclude gravitational force[136] while in F2D it is excluded, the sum
vector will be calculated according to the following formula in order to compensate for the
aforementioned discrepancy:
(7.1)
The following component of the fall detection algorithm is the “Suspected fall” process,
which can be seen in Figure 33. It utilizes the output of “Process accelerometer data” as its
initial input. Each of the calculated acceleration sum vector values will first be compared to
an upper fall threshold (UFT). If the UFT has been reached, then for a time period of 0.5
seconds SVM values (with a sampling rate of 40 Hz that equals to 20 values) will be
compared to a lower fall threshold (LFT).
FIGURE 33: SUSPECTED FALL

66
If an SVM value has reached the LFT within the aforementioned time interval, then the
possibility of a fall is registered and this output is passed along as input for the “Fall
detection” algorithm (Figure 31). Afterwards, for all the following 5.5 seconds the consequent
220 SVM values are examined for fall possibilities according to the same manner explored
above, while a running count of the possible fall events is being maintained. At the conclusion
of these combined 6 seconds, the total count of possible falls is compared to a predetermined
set of values, which will be labeled lower count limit (LCL) and higher count limit (HCL). If
the counter value is simultaneously: (1) equal or higher than the LCL, and (2) lower than the
HCL, then a fall will be registered and the device will notify the user that an alert is to be sent
out to their emergency contacts and the user will have 30 seconds to turn of the alert.
The specific values of the UFT and LFT thresholds still have to be determined. In [113] the
both thresholds had somewhat flexible values, rather than a specific one – the developers
chose these in order to increase accuracy. However, these flexible values are dependent on the
user’s profile and information as to what constitutes a user’s profile and its relation to the
aforementioned thresholds is not provided. The values they provide for the UFT are (10-18)
m/s2
and for the LFT – (2-7) m/s2. The team behind F2D had previously introduced another
paper about the same system[154]. Within it they utilize the more rigid thresholds of 7 m/s2
for the LFT and 18 m/s2
for the UFT[154]. Given that the fall detection algorithm still retained
a 92% accuracy rate, these values will be utilized in the current algorithm. In both papers the
LCL is accepted to be 1 and that is the value to be utilized here. However, in [113] they
improved on the HCL, going from a value of 14[154] to a range of (5-10). In order to improve
on sensitivity, the value of the higher end of the range is selected, i.e. 10 (Table 4).
7.2.2 SENSOR THRESHOLDS
As it has been stated in NF8 in the Nonfunctional Requirements section of the previous
chapter, the proposed solution ought to rely on a more simplistic algorithm, one that would
rely on thresholds where possible, rather than lean on machine learning algorithms which
could prove to be too taxing on the constrained resources of the smartwatch, where the
continuous monitoring and status assessment will be taking place. The main argument behind
the reasoning that utilizing thresholds is a viable possibility lies in the findings of the Ischemic
Heart Disease chapter, as well as the Fall Detection section of the State of The Art chapter, as
well as the fall detection algorithm, discussed in the previous section. The former was
concluded with Table 1, which relayed an overview of the relevant IHD conditions, their
symptomatic manifestations and how to detect them – if possible - via the utilizing of an ECG
or depending on heart rate. From the State of The Art chapter it is known that a number of
existing algorithms rely on utilizing thresholds in order to detect a fall and based on the
abovementioned solutions a proposal for Vixi will be made within the following text. The
current section will conclude with an overview of the decisions made in the form of Table 4. It
should be noted that the threshold values, examined in the following text, are tied to the
individual sensors utilized within Vixi. That is to say that if a given sensor threshold has been
reached it might not be of particular significance unless another threshold(s) – possibly for
another sensor entirely - has also been reached.
1) Heart Rate Thresholds
From the conclusions of the Ischemic Heart Disease chapter it is known that in general the
acceptable RHR limits are from 60 bpm up to 100 bpm[155]. However, it is noted that with
67
athletes those limits can be significantly lower, such as 40 bpm to 60 bpm[155]. These will be
referred to as Lower Heart Limit (LHL) and Higher Heart Limit (HHL). In some cases, most
notably with adult well-trained athletes, one’s RHR can be bellow 60 bpm, even reaching as
low as 40 bpm. Although senior citizens cannot be considered to be in the same physical
conditions as with professional athletes, there can still be individual variations from user to
user, not only from the perspective of fitness level but also based on effects from certain
medications, as well[155]. That is where recommendation F6 from the requirements
specification gains its significance from – it is proposed that upon the initialization of the
smartwatch application, the user’s RHR will be measured by the onboard PPG sensor in order
to verify that it is within the generally accepted limits. If that is not the case then the LHL will
be adjusted accordingly. Additionally, if the only anomalous indication encountered by Vixi
at a given moment is LHL or HHL – because the arrhythmia cannot be detected via an ECG
or because the user is utilizing the smartwatch only - then the system should compensate for
the possibility that these fluctuations could be momentary deviations due to everyday
activities. Of the ACSs, AMIs develop gradually over a matter of hours – given that there
must be a compromise between specificity and sensitivity, it is proposed that upon first
registering either threshold, the system should await a certain amount of time, after which it
ought to notify the user of the suspected emergency and allow the user the opportunity to turn
off the alert. Additionally, it ought to be taken into account that arrhythmias could be
triggered by short-term exertions and not last more than a few minutes. It is therefore
proposed that the system include an arrhythmia time limit (ATL) of 5 minutes. Upon first
registering the presence of an arrhythmia, the system would count down until the ATL is
reached. During this countdown the system would be monitoring for two types of input –
whether the arrhythmia has normalized, or if the fall detection algorithm has detected a fall. In
the case of the former then the system ought to return to its regular monitoring activities. If it
is the latter, then the alert should be enabled. If none of the aforementioned input is registered
before the ATL is reached, then the user would be notified of the alert and they should be
given the opportunity to disable it. Taking into consideration the case of sporting activities,
the user should be able to, not only disable the alert for the moment, but also to instruct the
system that for the following X-amount of time they would be performing strenuous activities
and that the system should ignore heart rate input.
2) ECG Thresholds
Within the Ischemic Heart Disease chapter it was acknowledged that an important diagnostic
tool for identifying a suspected ACS is the ECG. Of the examined IHD conditions, the only
one that is undetectable via an ECG is angina pectoris. It can be argued that - since it does not
indicate any actual cardiac damage but rather it is a symptom – the fact that angina pectoris is
unobservable on an ECG is not detrimental to the overall service. Additionally, unstable
angina is also mostly undetectable on an ECG, except in its most dangerous form, when it can
lead to a STEMI. More significant ACS incidents, such as STEMI, NSTEMI and SCD can be
identified more clearly via an electrocardiograph. The ECG thresholds presented in the
current chapter in Table 4 have been extracted from the summary table within section 4.3 of
the Ischemic Heart Disease chapter.
3) Accelerometer Thresholds
The accelerometer has a significant role for the examined fall detection algorithm examined in
the previous section (7.2.1). The significant accelerometer values – UFT and LFT - have
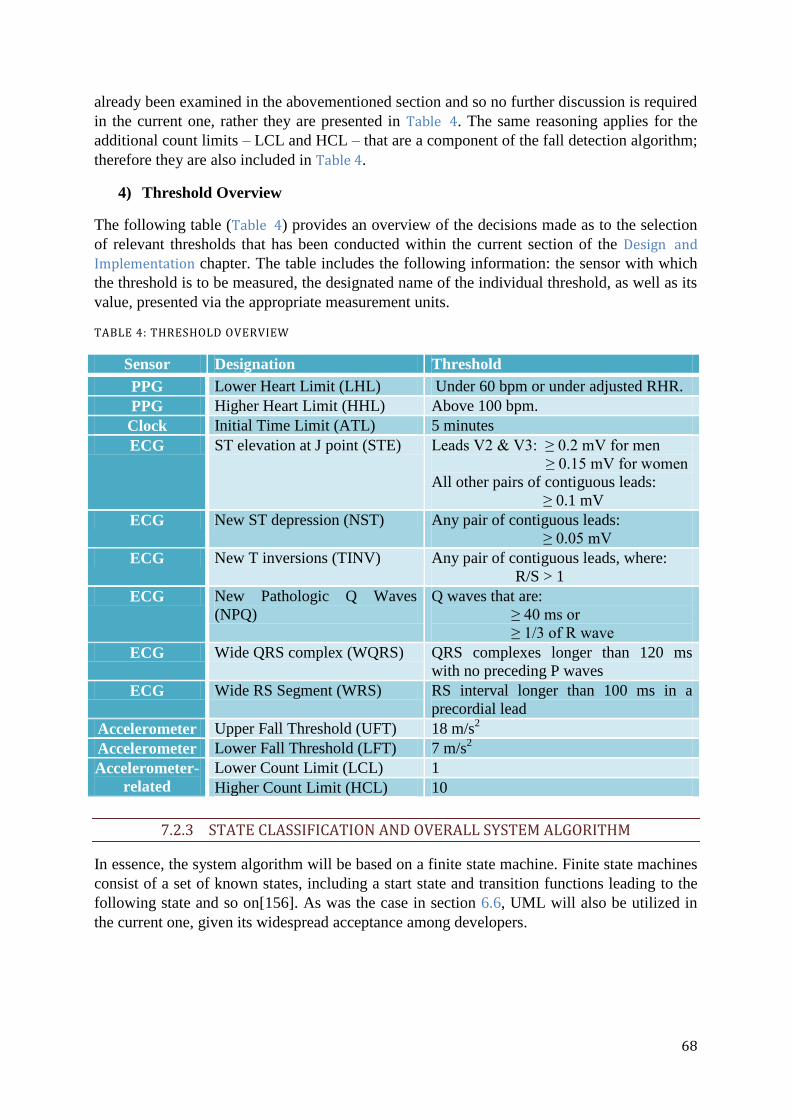
68
already been examined in the abovementioned section and so no further discussion is required
in the current one, rather they are presented in Table 4. The same reasoning applies for the
additional count limits – LCL and HCL – that are a component of the fall detection algorithm;
therefore they are also included in Table 4.
4) Threshold Overview
The following table (Table 4) provides an overview of the decisions made as to the selection
of relevant thresholds that has been conducted within the current section of the Design and
Implementation chapter. The table includes the following information: the sensor with which
the threshold is to be measured, the designated name of the individual threshold, as well as its
value, presented via the appropriate measurement units.
TABLE 4: THRESHOLD OVERVIEW
Sensor Designation Threshold
PPG Lower Heart Limit (LHL) Under 60 bpm or under adjusted RHR.
PPG Higher Heart Limit (HHL) Above 100 bpm.
Clock Initial Time Limit (ATL) 5 minutes
ECG ST elevation at J point (STE) Leads V2 & V3: ≥ 0.2 mV for men
≥ 0.15 mV for women
All other pairs of contiguous leads:
≥ 0.1 mV
ECG New ST depression (NST) Any pair of contiguous leads:
≥ 0.05 mV
ECG New T inversions (TINV) Any pair of contiguous leads, where:
R/S > 1
ECG New Pathologic Q Waves
(NPQ)
Q waves that are:
≥ 40 ms or
≥ 1/3 of R wave
ECG Wide QRS complex (WQRS) QRS complexes longer than 120 ms
with no preceding P waves
ECG Wide RS Segment (WRS) RS interval longer than 100 ms in a
precordial lead
Accelerometer Upper Fall Threshold (UFT) 18 m/s2
Accelerometer Lower Fall Threshold (LFT) 7 m/s2
Accelerometer-
related
Lower Count Limit (LCL) 1
Higher Count Limit (HCL) 10
7.2.3 STATE CLASSIFICATION AND OVERALL SYSTEM ALGORITHM
In essence, the system algorithm will be based on a finite state machine. Finite state machines
consist of a set of known states, including a start state and transition functions leading to the
following state and so on[156]. As was the case in section 6.6, UML will also be utilized in
the current one, given its widespread acceptance among developers.

69
To begin with, the following table (Table 5) contains the possible states of the user, as well as
the corresponding response from the system.
TABLE 5: SYSTEM STATES OVERVIEW
State System Response
Norm Continue monitoring status
Acceptable Await additional input
Warning Notify user and contact emergency contacts
Critical Notify user and contact Emergency services (112)
At any moment in time the system will keep track of the current state of the user, which as it
is shown in Table 5 can be one of the following:
1) Norm – this state would indicate that all measurable parameters are within their
accompanying limits, none of the thresholds, presented in Table 4 have been reached
or crossed;
2) Acceptable – this state will be utilized in order to represent the situation, where one or
more thresholds have been reached or crossed but it is not enough for the system
determine whether a significant event is in fact taking place, i.e. it is suspected but
Vixi cannot determinately assert that that is the case. When the system is within this
state it would await for additional input so as to either return to the Norm, or to
transition to one of the other two states (“Warning” and “Critical”);
3) Warning – this state specifies the situation where the threshold(s) that have been
crossed are sufficient so as to determine that the user is currently experiencing a
critical event. In this state the user and their emergency contacts would be notified of
the situation;
4) Critical – this state indicates that the user is in a physical condition that requires
immediate medical attention;
As it has previously been declared, a finite state machine model will be utilized so as to
illustrate they way that the different states relate to each other and transition into one another.
In order to provide context to the state machine diagram, the following state transition table
(Table 6) is presented so as to clarify the transitions between the states and the events that
trigger the aforementioned transitions.

70
TABLE 6: STATE TRANSITION TABLE
Current
State
Action № Event Next State
Norm Continue monitoring
indefinitely until a
change of state.
1 - Norm
2 LHL or HHL Acceptable
3 STE/NST/TINV/NPQ/WQRS/
WRS
Warning
4 Detection of a fall Warning
Acceptable Wait for normalization
of arrhythmia, the
detection of a fall or
until ATL is reached.
5 Heart rate normalization before
ATL
Norm
6 ATL Warning
7 Fall detected Critical
Warning Notify user of alert and
enable them to disable
it, otherwise notify
emergency contacts.
8 User input Norm
9 Fall detected with a preceding
ECG threshold
Critical
Critical Contact emergency
services (112).
10 User input Warning
The figure bellow (Figure 34) is presented so as to visually illustrate the states and the
transitions between them that have been described in Table 6.
FIGURE 34: STATE MACHINE DIAGRAM

71
The aforementioned state transitions can follow along these action flows:
When Vixi is in its Norm state it continuously monitors the incoming information
from its sensors, including ECG readings, heart rate input, and acceleration data. If no
threshold has been reached, then the state would remain the same, i.e. Norm (№1).
If Vixi is in its Norm state and one of the heart rate thresholds has been reached, then
the system would transition into the Acceptable state (№2) where it will await until
one of the following things happen:
o If the heart rate input is normalized before the ATL is reached, then the system
would transition back to the Norm (№5).
o If the ATL is reached and the heart rate has not normalized, then Vixi
transitions to the Warning state (№6).
While in its Warning state, if the user disables the alert Vixi transitions
to the Norm (№8).
If the user does not disable the alert, then emergency contacts will be
notified.
o If a fall has been detected before the ATL has been reached, then the system
transitions to the Critical state (№7).
While in Critical, if the user disables the alert, then Vixi transitions
back to Warning (№10).
If Vixi is in its Norm state and an ECG threshold has been reached, then it transitions
to Warning (№3).
o While in Warning, emergency contacts are notified.
o If Vixi also detects a fall, then it transitions into Critical (№9).
While in Critical, if the user disables the alert, then Vixi transitions
back to Warning (№10).
If Vixi is in its Norm state and a fall is detected, then it transitions into the Warning
state (№4).
7.3 DEVICE APPLICATIONS
The final section of the current chapter will be dedicated to fulfilling the following objective,
presented in the Problem Formulation chapter:
Provide a design of the necessary device applications.
As to the devices in question, these will be the smartwatch and the smartphone. The wearable
ECG device is acknowledged as a component of the system; however, since no processing
will be conducted within the aforementioned device it is deemed that it does not warrant its
own application at this stage of the development process - as it can be seen in Figure 30, the
sole functionality of the wearable ECG device is to send its ECG readings to the smartwatch.
It should be noted that Figure 30 and its accompanying description in section 7.1 already
provides an overview of Vixi as a whole. The aforementioned section gives insight into what
functionalities are implemented within the system, along with their distribution across the
different components of the aforementioned system. However, it has been deemed necessary
that further clarification as to the workings of the two Vixi applications (smartwatch and
smartphone-based) ought to be included within the limits of the Thesis. Once more, UML
methods will be utilized in order to illustrate the details of the proposed design. To be precise,

72
the UML method to be used will be class diagrams, which are often utilized for the purpose of
describing a design in finer detail[157]. As per general class diagram instructions, scaffolding
code will be avoided so as to simplify the diagrams in the following sections in order to focus
on more significant operations[157].
7.3.1 SMARTWATCH APPLICATION
The class diagram for the smartwatch application can be seen in Figure 35:
FIGURE 35: SMARTWATCH APPLICATION CLASS DIAGRAM
The figure above includes six classes that have varying connections with each other. Input
data from three different sensors is processed within this application. From section 7.2 it is
known that the measured values from the different sensors have to constantly be monitored
and compared to predetermined thresholds. For that purpose there is a separate class for every
type of sensor input (accelerometer-based, ECG-based and PPG-based), within which the
necessary continuous monitoring is conducted. The three classes are generalized by a
common superclass. If a threshold has been reached, the State class is notified. The state class
is responsible for handling the state transitions, described in Table 6. If Vixi transitions to the
Warning or Critical state, then the Alert class is utilized.
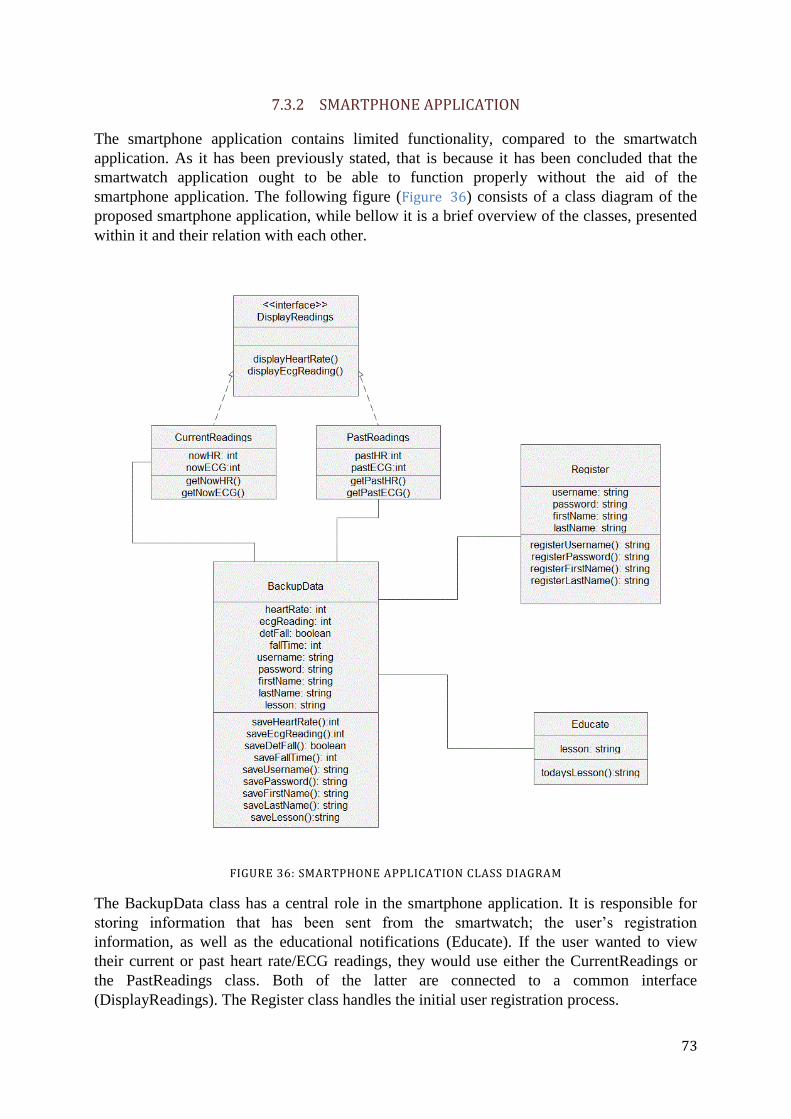
73
7.3.2 SMARTPHONE APPLICATION
The smartphone application contains limited functionality, compared to the smartwatch
application. As it has been previously stated, that is because it has been concluded that the
smartwatch application ought to be able to function properly without the aid of the
smartphone application. The following figure (Figure 36) consists of a class diagram of the
proposed smartphone application, while bellow it is a brief overview of the classes, presented
within it and their relation with each other.
FIGURE 36: SMARTPHONE APPLICATION CLASS DIAGRAM
The BackupData class has a central role in the smartphone application. It is responsible for
storing information that has been sent from the smartwatch; the user’s registration
information, as well as the educational notifications (Educate). If the user wanted to view
their current or past heart rate/ECG readings, they would use either the CurrentReadings or
the PastReadings class. Both of the latter are connected to a common interface
(DisplayReadings). The Register class handles the initial user registration process.

74
8 TESTING
The current chapter is dedicated to fulfilling the following objective that has been presented in
section 2.2 of the Problem Formulation chapter:
Devise protocols for testing the designed system.
A full implementation of Vixi was not achievable in the limited time reserved for the
execution of the Thesis project; therefore system testing was not executed. However, a fully-
realized project would warrant the inclusion of a testing phase. The following chapter serves
to provide a brief overview of what testing procedures would have to be utilized in relation to
the proposed Vixi system. The testing efforts will be divided between two major foci: (1)
functionality and (2) usability.
Testing functionality
Functionality testing is an essential segment of the testing phase as it is necessary in order to
obtain a measure as to how well – if at all – the various functions of the system perform after
having been implemented. Naturally, all of the implemented functionalities of the system
would not be considered to be implemented if they do not perform their assigned tasks,
however functionality performance can vary among the different devices and users.
A functionality that should be tested is the fall detection algorithm; more specifically its
sensitivity and specificity rates. Given that the fall detection algorithm proposed in the current
document has been acquired from an outside source, then if that algorithm is to be
implemented in the final version of the service its validity would first have to be confirmed by
the Vixi development team. It should be noted that the thresholds that have been chosen for
that algorithm were selected based on empirical data, therefore there is the possibility that the
aforementioned thresholds might need to be adjusted, depending on differences between the
devices utilized in Vixi and the F2D team’s equipment.
During the secondary research phase, conducted in relation to section 5.4 of the State of The
Art chapter, it became apparent that various smartwatches seem to have different performance
accuracies when it comes to their heart rate measuring capabilities. Therefore, it is
recommended that the Vixi development team compare the accuracies of these devices
firsthand. If an accuracy discrepancy does indeed exist; then by discovering it the Vixi team
could use acquired results in order to recommend specific smartwatch models to their users. If
it does not, then it will formally be established that Vixi would perform equally well on all
tested smartwatch models20
.
Testing usability
Another essential aspect of the system that ought to be taken into consideration is its usability.
When examining the usability of a product/system, one has to consider the various aspects of
the concept, i.e. its usefulness, efficiency, effectiveness, learnability and satisfaction[158].
Naturally, all the facets of usability should be dealt with, however of more learnability is of a
more particular interest as it relates to Vixi. Consider the results from the survey carried out
among potential users, presented in section 6.2 of the Analysis chapter. Among all those
20 That is not to say all smartwatch models available on the market. A recommendation would be to first test available Android Wear models.
75
surveyed, 19% of them had never owned a smartphone, meaning that one out of five people
does not have any reliable experience with smartphones. Even acknowledging that the overall
participant base for the survey was somewhat limited in scope, this kind of data can be
indicative of a trend that might be observed on a larger scale. The aforementioned lack of
experience therefore could translate into difficulties with learnability, which could then prove
to be detrimental to the effectiveness of the product/system. Therefore a few
recommendations can be made as to the testing of the usability aspect of Vixi.
Firstly, it is recommended that the smartphone and smartwatch applications’ user interfaces
be designed with a specific persona in mind. That is to say, one that is presumed to have
extremely limited digital skills. Secondly, the applications ought to be developed according to
an Agile framework. The iterative nature of Agile would allow for the implementation of
usability testing during the development process, which would then grant the opportunity for
the development team to make adjustments accordingly[159]. Although more than a single
usability test could seem unnecessary, it can be extremely beneficial due to the disparity of
digital literacy between the development team and the intended users. Lastly, when selecting
test participants, the ones with the least amount of technical skills ought to be selected.
76
9 DISCUSSION
Within the Problem Formulation chapter the main research question governing the direction of
the current Thesis was introduced. Along with the research question stated above, five
additional subquestions were presented so as to further expand on the main question and to
provide clarification for the objectives that were to be fulfilled throughout the length of the
Thesis. Within the following chapter the abovementioned subquestions will be examined
individually with the purpose of exploring how they have been addressed within the previous
chapters and their accompanying subsequent results.
What conditions constitute ischemic heart disease? Which of them can lead to a fatal
outcome?
The first subquestion is actually a composite of two questions. The reason that they are
introduced simultaneously is because of their closely associated semantics. Indeed the two
have both been addressed within the limits of the Ischemic Heart Disease chapter. Research
into the matter revealed that IHD as a whole can encompass two main conditions: stable
angina and ACS. It was discovered that of the two, only the latter is connected to actual tissue
decay (and possibly leading to a fatal outcome). However, the former is considered to be a
possible precursor to ACS, meaning that it ought to not be discounted.
In addition to the secondary research, conducted in order to answer the first subquestion,
primary research was also executed. The specific nature of the necessary information - i.e. the
fact that it is rooted in the medical field – along with the author’s experience in the
engineering field, led to the necessity of outside evaluation of the achieved results from the
secondary research, performed by an expert. For this purpose that a number of institutions
were contacted with a request for an interview. These efforts resulted in an interview with an
expert from the Department of Biomedical Sciences of Copenhagen University. The outcome
of the interview was favourable as to the aforementioned research results, which were
confirmed.
The second subquestion is the following:
What physiological or environmental parameters should be monitored in order to detect the
onset of the established conditions?
It has partially been answered within the Ischemic Heart Disease chapter. After finding the
answers for the first subquestion and recognizing on what the sought-after conditions are, the
chapter continues on in examining them individually in more detail. This allowed for further
determining how they present themselves symptomatically, as well as how they are detected
and diagnosed by medical professionals. The diagnostic tools utilized by the aforementioned
medical experts were discovered to be numerous; however a distinction was made between
invasive and non-invasive methods. In order to further narrow down which parameters were
to be utilized by the service, it was essential to consider the purpose of the system being
developed, i.e. that it is intended to be used on a daily basis for prolonged periods of time.
Therefore, it was decided that the focus ought to be on the non-invasive methods, specifically
on measuring the user’s heart rate and their electrocardiogram. These might not be as
conclusive when it comes to presenting a certain diagnosis of the user’s health status, however
they would prove to be sufficient in the sense that they would provide a significant enough
suspicion that it would warrant emergency treatment. Given that the various facets of ACS

77
have various presentations relating to heart rate and ECG, Table 1 was included as a
conclusion of the aforementioned chapter in order to provide a brief overview of all of them.
As to the achieving a more precise estimation of the user’s overall health statues, it was
concluded that they ought to be monitored if they had suffered a fall. This was due to the
observation made that as an ACS progresses, it leads to an increasing lack of oxygen to the
whole body – when the brain itself experiences a significant enough amount of oxygen
deprivation, it can often result in dizziness or even a syncope. Often the former – and always
the latter – would lead to a fall. Therefore it was observed that, along with any indications of
heart rate and ECG anomalies, the presence of a fall would signify a stronger severity of the
user’s condition.
The third subquestion to be examined is the following:
What devices should be utilized in order to measure the aforementioned parameters?
From the answers to the previous subquestion the parameters that the system should monitor
became known. The State of The Art chapter was then dedicated to discovering how these
parameters could be monitored. From section 5.2 it was concluded that a user’s heart rate
could be measured by a PPG sensor and that their ECG could be monitored via a wearable
electrocardiograph. Additionally, section 5.3 focused on examining existing algorithms for
fall detection and it was observed that the common denominator between them (sensor-wise)
was the accelerometer. Consequently, it was observed that a smartwatch might be a suitable
device to be utilized within the service as it had been present in both sections 5.2 and 5.3 as an
example of existing technologies on the market that contain PPG sensors, as well as
accelerometer. Section 5.4 was then introduced in order to attempt to verify the
abovementioned observation and indeed it was confirmed. Therefore, it was concluded that
the devices to be utilized so as to monitor the user’s heart rate and ECG would be a
smartwatch and a wearable ECG.
The fourth subquestion is the following:
How should the system respond when an established condition has been detected?
Considering the different facets of the ACS and their contrasting severity and progression
rates it was observed that they would therefore warrant different responses. Section 7.2.3 of
the Design and Implementation chapter proposed that the system should transition between
four pre-determined states. Each state would be triggered by different events and would elicit
a specific response from the system. The “Norm” would be the state the user is in when there
are no abnormalities detected – here the system would not have any remarkable response, it
would merely continue monitoring the user’s condition. The “Acceptable” state is where an
abnormality has been detected but it is not deemed significant enough as to warrant additional
response. Instead the system would await further input so as to determine which state it ought
to transition to next. The “Warning” state is one, where the system has detected abnormalities
that are of sufficient significance to warrant a consultation with a medical professional and so
the user and their appointed emergency contacts would be notified by the system. The
“Critical” state is one where according to the system it is deemed necessary for the user to
receive immediate medical attention and so emergency services would be notified of the
user’s condition.
The fifth and final subquestion to be examined is the following:
78
How can the proposed solution be made to suit the needs of the target population segment?
An essential aspect of the development process is to design a product that would fulfill its
purpose but whether it would be accepted by potential users also needs to be given significant
consideration. Therefore, it was deemed necessary that primary research ought to be
conducted on this matter - this was done in survey form in order to reach a wider participant
base. Section 6.2 of the Analysis chapter was dedicated to providing an overview of the
contents of the survey in question, as well as to analyze its results by verifying or discounting
previously suggested hypotheses. It was concluded that of the two necessary devices –
smartwatches and wearable ECGs – users were more willing to utilize the former, rather than
the latter. However, they seemed to favour the wearable ECG more when input from a
personal physician was involved. Additionally, there was a unanimous agreement among
participants that they would like their personal physicians to have access to the medically-
relevant data, collected by the service. Lastly, observations could be made as to the nature of
the users’ potential emergency contacts, the most common being emergency services,
followed by family members and personal physicians. This would also serve to indicate that
users would not feel apprehensive towards the capability of the system to involve emergency
services on their behalf.
Aside from answering the subquestions, discussed above, a few other observations have also
been made along the course of the Thesis. One of these was the benefit of introducing
positioning capabilities to the system. The system is designed mainly to solve the problem of
senior citizens – most probably being in their own homes - requiring emergency medical
attention when they are not able to call for help on their own. However a few possible
situations have to be considered. The first one being that the user might not even be in their
abode when they would require medical attention – if the user is not capable of contacting
anyone for help, then they would also not be able to relay their location either. Secondly, if
the user was at home at the time, then their designated emergency contacts would most
probably be aware of their home address but that would not be valid for the emergency
services that would potentially have to be contacted. Therefore, it has been deemed necessary
that the system ought to have positioning capabilities. Given that the smartwatch component
of Vixi can possess the necessary functionalities, it has been determined that the inclusion of
the positioning functionality would be an acceptable proposition.
Another observation is related to the already discussed results of the survey. It was noted that
even with a recommendation from a personal physician, users were still apprehensive towards
the wearable ECG. Therefore it was concluded that the wearable ECG would not be a suitable
long-term component of the system. However, it does provide essential data, as it allows for
an earlier detection of ACS – without it the system would be able to detect it at a later stage of
its progression. It is therefore proposed that the smartwatch component (which includes all
essential system functionalities) be presented to the users as a more long-term solution. The
wearable ECG, however, ought to be intended for users that have already suffered through an
ACS. Research from the Ischemic Heart Disease chapter has indicated that people that have
already experienced an ACS are more likely to have another one, especially during the first
year after the initial one, where the risk of mortality is significantly higher. Accordingly, it is
proposed that the wearable ECG be utilized by individuals that have had an ACS for a period
of up to 12 months after the initial incident.

79
10 CONCLUSION
The previous chapter was dedicated to reviewing the various subquestions presented in
section 2.1, along with examining the manner that they have been addressed throughout the
course of the current Thesis. The focus of the present chapter is on the main research
question, posed in 2.1 and it was the following:
How can a system be designed so that it would reduce the risk of death for elderly individuals
caused by ischemic heart disease?
Given the positive outcomes to its accompanying subquestions, along with the overall results
of the Thesis, it can be concluded that the main research question has been answered in
sufficient detail. Firstly, in the Introduction chapter it was proposed that it is possible to
reduce the risk of a fatal outcome of an IHD incident via reducing the severity of its
consequences or even the possibility of it ever occurring. From the Ischemic Heart Disease
chapter it became apparent that risk factors for IHD include aspects such as smoking, lack of
exercise, etc. Compensating for the aforementioned risk factors would depend more on a
change of lifestyle and even if those changes are implemented, there is simply no guarantee
that it would sufficient for avoiding dangerous IHD incidences. Additionally, there are some
risk factors that cannot be affected, such as sex, the presence of diabetes and even age.
Therefore, in order to achieve the desired outcome, the focus was shifted on to reducing the
severity of the consequences of an IHD event that is already taking place. Research from the
aforementioned chapter revealed that time is a common factor that greatly influences the
outcomes of such situations. Consequently, it was determined that early detection of an ACS
in its initial stages would be the most effective way of increasing the possibility of a positive
non-fatal outcome.
Once the relevant aspects of IHD became known, it was then necessary to discover what
devices should be utilized within the system so as to allow for the automated detection of the
onset of an ACS. The State of The Art chapter was used towards that goal, from where it was
acknowledged that it is feasible to utilize existing hardware products that are already on the
market, in the form of smartwatches and wearable ECGs. Upon closer examination of their
software capabilities it was also determined that concerning the software aspect of the service,
it was also possible to make use of existing market solutions. Additionally, an algorithm was
devised that would be utilized so as to combine the various sensor input included in the
system and to interpret it in a manner that would allow to determine whether an ACS is
occurring or not. What is more, potential user needs were also addressed by conducting a
survey among representatives of the target age group and then applying the consequent results
and conclusions from it to the overall design of the system.
In conclusion, the current Thesis has successfully answered its main research question. A
design for a system that would reduce the risk of mortality due to ischemic heart disease has
been proposed – one that would not rely on producing specialized equipment, but rather make
use of existing devices already on the market.
80
11 FUTURE RECOMMENDATIONS
Throughout the various stages of fulfillment of the current Thesis, a number of challenges
have been encountered. Some have been resolved within the confines of the report. Others
have been deemed to be too significant to be undertaken at the current stage of development;
perhaps even warranting a dedicated project of their own. It is the aforementioned challenging
tasks that are to be briefly introduced within the following sections, along with
recommendations for future research and development.
11.1 WEARABLE ECG VARIABILITY
As it has already been established, ECG input is an essential component of Vixi, especially
when it comes to predicting critical cardiac events before their actual onset. Research,
conducted in the Ischemic Heart Disease chapter, led to the specification of a number of ECG-
associated thresholds, accompanied by the leads where they ought to be detected (Table 1).
What is of significance, however, as it has also been concluded in section 4.2 of the
aforementioned chapter, is that depending on the position of the ischemic damage to the heart,
different leads would be able to detect it. This is of some importance, since in section 5.2.1 of
the State of The Art chapter, it was also noted that existing wearable ECG devices are often
single-channel. The limited number of leads, available to wearable ECGs, seems to be a
constraint on their effectiveness. However, it is known that even in hospital conditions it can
be common to not utilize all 12 leads of the standard ECG (5.2.1). Manufacturers also appear
to have overcome this difficulty, since some of these devices are listed as providing medical-
grade monitoring (e.g. the QardioCore[87]). What is of concern, however, is that research into
specific examples of the abovementioned devices revealed that manufacturers do not list the
leads that they are utilizing within their solutions (among the encountered examples, there
was only one exception – the Shimmer3[88]).
Android-based smartwatches were chosen as one of the other system components partly
because of Android’s openness towards third-party developers. In contrast, wearable ECGs
and their accompanying algorithms tend to be proprietary in nature, which can be a hindrance
when trying to integrate them within a third-party system. It is therefore recommended that
further research be conducted into the specific nature and functionalities (such as which leads
are being utilized) of the wearable ECG devices on the market. A positive outcome to such an
undertaking would be to produce a list of wearable ECG devices, compatible to Vixi. Another
possibility is to involve specific wearable ECG manufacturer(s) as stakeholders within the
Vixi system. Such a collaboration would ensure a compatibility between the specific ECGs
and the rest of the system that would increase its overall reliability.
11.2 INCLUDE PERSONAL PHYSICIANS AS STAKEHOLDERS WITHIN THE SYSTEM
The current recommendation is related to two of the hypotheses that were tested and verified
via a survey disseminated among representatives of the target age group of the service being
developed. The fifth hypothesis, presented in section 6.2.1 of the Analysis chapter, states that
senior citizens would like to have their personal physicians involved in the services, in the
sense that they ought to have access to the medically-relevant data that has been collected by
the Vixi. This ought to be taken into consideration as it would add significant value to the
81
service given that there was unanimous affirmation from survey participants on this matter.
However, upon the designing of this additional system functionality, a number of challenges
have to be dealt with among which is protecting the user’s privacy. At the current
development phase of the system, all of the user’s data is stored in their smartwatch and
further backed up in their smartphones, i.e. it does not leave their devices. Allowing the users’
personal physicians access to their medical data would mean that the data itself would have to
traverse through networks in order to get to the intended endpoints. Given the sensitive nature
of such information, this would warrant data encryption, along with the implementation of
authentication methods. It would also require a dedicated server(s), which would create new
operational costs.
11.3 DEVISE A HOSPITAL RECOMMENDER SYSTEM
Given the relatively free form of conversation that constituted the interview with the expert in
section 6.3 of the Analysis chapter, a few unpredicted notions were touched upon. These,
although out of scope of the current Thesis, could nevertheless prove to be of substantial
significance for any future research. One of these topics was regarding the dilemma as to
which hospital should someone go to, when they are experiencing a complex condition such
as an ACS, stroke, etc. These types of ailments require specialized medical equipment and -
perhaps more importantly - medical professionals that possess the necessary skills for the
specific medical field. It appears that there has been some debate among representatives of the
medical profession as to whether a patient in such a critical situation ought to go the nearest
medical establishment, or if they should spend an additional 30-60 minutes in transit, in order
to get to hospital that is further away but better equipped to help them in their current
situation. Apparently there is a consensus that the former can be a better alternative and there
are studies that support the assertion that the nearest hospital is not necessarily the best
option[160], however this does raise the question how to best deliver a recommendation about
the optimal choice of a hospital in an emergency. This type of functionality would warrant its
own dedicated recommender system that would have to simultaneously consider: (1) the
user’s location in relation to available hospitals; (2) the facilities and personnel of the hospital
in relation to the specific critical condition of the user, and (3) the progression rate of the
user’s condition, i.e. in the situation where a better option is further away, could the user
afford to waste that additional time on the road or do they require more immediate attention.
The difficulty with designing such a recommender system would be in the adequate
approximation of the user’s condition. More precisely, how accurate the system’s estimation
will be regarding how long the user would be able to spend on the road without a significant
worsening of their condition or even a fatal outcome. If the system underestimates the time
available, then it would probably send the user to a hospital located closer to the user. This
would not cause the user additional harm but it would reduce the value of the recommender
system as a whole. However, if the system overestimates the time limit, then there would be a
risk of the user being directed to a hospital that is further away but which they might not be
able to reach at all. In such a situation the recommender system could potentially be
detrimental to its user’s health and wellbeing. Therefore, further study has to be conducted
into collecting relevant hospital data, classifying the aforementioned data according to
relevant conditions and establishing a more precise estimation of a user’s condition when it
comes to the time variant.

82
11.4 UTILIZE FALL DETECTION TOOLS TO DIFFERENTIATE BETWEEN VARIOUS ACTIVITIES
From the Ischemic Heart Disease chapter it is known that arrhythmias are almost always
present in the manifestation of an ACS. Tachycardia or bradycardia can both signal the onset
of a critical event: irregular heart rhythms that accompany AMIs can lead to cardiac arrest or
even SCD. Detecting the presence of arrhythmias is already a significant component of the
system; however there is still the issue of distinguishing between dangerous arrhythmias and
those triggered by exercise. Currently, the user would have to momentarily deactivate the
application during sport activities in order to avoid an onslaught of alarms. Given that there is
already a motion detection component within the system – in the form of fall detection - it is
proposed that the abovementioned functionality be further developed. Vixi should be able to
automatically detect activities that could raise the user’s heart rate in order to reduce the risk
of false alarms.

83
12 BIBLIOGRAPHY
[1] U. Nations, “WorldPopulationAgeing2013.”
[2] “World Population Ageing 2015,” United Nations, Dep. Econ. Soc. Aff. Popul. Div.
(2015). World Popul. Ageing, vol. United Nat, no. (ST/ESA/SER.A/390, p. 164, 2015.
[3] N. Ouellette and R. Bourbeau, “Changes in the age-at-death distribution in four low
mortality countries: A nonparametric approach.”
[4] “Age at death (AIHW).” [Online]. Available: http://www.aihw.gov.au/deaths/age-at-
death/. [Accessed: 08-Mar-2017].
[5] “Statistics Finland - Deaths 2015.” [Online]. Available:
http://www.stat.fi/til/kuol/2015/01/kuol_2015_01_2016-10-28_tie_001_en.html.
[Accessed: 08-Mar-2017].
[6] N. R. Sahyoun, H. Lentzner, D. Hoyert, and K. N. Robinson, “Trends in Causes of
Death Among the Elderly,” 2001.
[7] “WHO | The top 10 causes of death,” WHO, 2017.
[8] C. F. Jackson and N. K. Wenger, “Cardiovascular Disease in the Elderly,” Rev.
Española Cardiol. (English Ed., vol. 64, no. 8, pp. 697–712, Aug. 2011.
[9] J. Adams, Risk. Taylor and Francis, 2002.
[10] T. Aven, Misconceptions of Risk. Chichester, UK: John Wiley & Sons, Ltd, 2010.
[11] “Smartphone OS global market share 2009-2017 | Statistic.” [Online]. Available:
https://www.statista.com/statistics/266136/global-market-share-held-by-smartphone-
operating-systems/. [Accessed: 06-Jun-2017].
[12] “US mobile smartphone OS market share 2012-2017 | Statistic.” [Online]. Available:
https://www.statista.com/statistics/266572/market-share-held-by-smartphone-
platforms-in-the-united-states/. [Accessed: 06-Jun-2017].
[13] “Denmark Mobile Market Overview.”
[14] “Android Wear.” [Online]. Available: https://www.android.com/wear/. [Accessed: 29-
May-2017].
[15] S. Nair, Marketing Research. Global Media, 2008.
[16] P. Dolan and P. Donnelly, Approaches to Qualitative Research. Oak Tree Press, 2011.
[17] D. Mujis, Daniel, Doing Quantitative Research in Education. SAGE Publications,
2004.
[18] “What is Primary Research and How do I get Started? | Purdue OWL.” [Online].
Available: https://owl.english.purdue.edu/owl/owlprint/559/. [Accessed: 05-Jun-2017].
[19] S. Crouch and M. Housdden, “Marketing Research for Managers,” Google Books.
[Online]. Available:
https://books.google.dk/books?id=rpv_ez5cnkEC&dq=%22Desk+research%22&q=sec
84
ondary+research#v=snippet&q=secondary research&f=false. [Accessed: 05-Jun-2017].
[20] J. K.-J. Li, Dynamics of the Vascular System. World Scientific Publishing Company,
2004.
[21] P. A. Iaizzo, “General Features of the Cardiovascular System,” in Handbook of
Cardiac Anatomy, Physiology, and Devices, Cham: Springer International Publishing,
2015, pp. 3–12.
[22] “Image of the human circulatory system - Anatomy Chart Body.” [Online]. Available:
http://anatomybody-charts.us/image-of-the-human-circulatory-system/image-of-the-
human-circulatory-system-2/. [Accessed: 15-May-2017].
[23] A. J. Weinhaus, “Anatomy of the Human Heart.”
[24] D. C., “Introduction to Ischemic Heart Disease,” in Ischemic Heart Disease, InTech,
2013.
[25] “Anatomy of the Heart - Texas Heart Institute Heart Information Center.” [Online].
Available: http://www.texasheart.org/HIC/Anatomy/anatomy2.cfm. [Accessed: 15-
May-2017].
[26] T. G. Laske, M. Shrivastav, and P. A. Iaizzo, “The Cardiac Conduction System.”
[27] A. Mozzarelli and S. Bettati, Chemistry and Biochemistry of Oxygen Therapeutics.
Wiley, 2011.
[28] A. J. Lusis, “Atherosclerosis,” Nature, vol. 407, no. 6801, pp. 233–241, Sep. 2000.
[29] E. Getzik, “Acute Coronary Syndrome,” in Encyclopedia of Lifestyle Medicine &
Health, 2455 Teller Road, Thousand Oaks California 91320 United States of
America : SAGE Publications, Inc.
[30] “Angina Pectoris (Stable Angina),” American Heart Association. [Online]. Available:
http://www.heart.org/HEARTORG/Conditions/HeartAttack/DiagnosingaHeartAttack/
Angina-Pectoris-Stable-Angina_UCM_437515_Article.jsp. [Accessed: 30-Apr-2017].
[31] “Angina in Women Can Be Different Than Men,” American Heart Association.
[Online]. Available:
http://www.heart.org/HEARTORG/Conditions/HeartAttack/WarningSignsofaHeartAtt
ack/Angina-in-Women-Can-Be-Different-Than-Men_UCM_448902_Article.jsp.
[Accessed: 30-Apr-2017].
[32] Y. Wong, S. Stearn, S. Moore, and B. Hale, “Angina at Low heart rate And Risk of
imminent Myocardial infarction (the ALARM study): a prospective, observational
proof-of-concept study,” BMC Cardiovasc. Disord., Nov. 2015.
[33] “Unstable Angina,” American Heart Association. [Online]. Available:
http://www.heart.org/HEARTORG/Conditions/HeartAttack/SymptomsDiagnosisofHea
rtAttack/Unstable-Angina_UCM_437513_Article.jsp. [Accessed: 30-Apr-2017].
[34] J. Hill and E. Olson, Muscle 2-Volume Set. Elsevier Science, 2012.
[35] “Unstable Angina,” in Encyclopedia of Molecular Pharmacology, Berlin, Heidelberg:
Springer Berlin Heidelberg, 2008, pp. 1267–1267.

85
[36] Cardiovascular Disability. Washington, D.C.: National Academies Press, 2010.
[37] “Coronary Angiography - NHLBI, NIH,” National Heart, Lung and Blood Institute.
[Online]. Available: https://www.nhlbi.nih.gov/health/health-topics/topics/ca.
[Accessed: 30-Apr-2017].
[38] S. Boateng and T. Sanborn, “Acute myocardial infarction,” Disease-a-Month, vol. 59,
no. 3, pp. 83–96, 2013.
[39] C. A. Swenne, “Improved STEMI diagnosis by serial ECG analysis,” J.
Electrocardiol., vol. 48, no. 1, pp. 99–100, Jan. 2015.
[40] H. D. White, K. Thygesen, J. S. Alpert, A. S. Jaffe, M. L. Simoons, and B. R.
Chaitman, “Third universal definition of myocardial infarction,” Nat. Rev. Cardiol.,
vol. doi, no. 10, 2012.
[41] D. Davis, Quick and Accurate 12-lead ECG Interretation. Wolters Kluwer Health,
2004.
[42] A. Bayés de Luna, J. M. Cino, S. Pujadas, I. Cygankiewicz, F. Carreras, X. Garcia-
Moll, M. Noguero, M. Fiol, R. Elosua, J. Cinca, and G. Pons-Lladó, “Concordance of
Electrocardiographic Patterns and Healed Myocardial Infarction Location Detected by
Cardiovascular Magnetic Resonance,” Am. J. Cardiol., vol. 97, no. 4, pp. 443–451,
2006.
[43] M. Plichart, F. Thomas, J.-P. Empana, K. Bean, M.-C. Périer, D. S. Celermajer, O.
Hanon, N. Danchin, B. Pannier, and X. Jouven, “Gender-specific trends in heart rate in
the general population from 1992-2007: a study of 226,288 French adults.,” Eur. J.
Prev. Cardiol., vol. 20, no. 1, pp. 61–72, Feb. 2013.
[44] E. Falk, P. K. Shah, and P. J. de Feyter, Ischaemic Heart Disease | Medical 2011
Collection > Customer > Manson Publishing. .
[45] M. George and T. W. Greenwood, “RELATION BETWEEN BRADYCARDIA AND
THE SITE OF MYOCARDIAL INFARCTION,” Lancet, vol. 290, no. 7519, pp. 739–
740, Oct. 1967.
[46] E. Wyss and R. Candinas, “[Bradycardia-induced syncope].,” Ther. Umsch., vol. 54,
no. 3, pp. 144–50, Mar. 1997.
[47] “Bradycardia Symptoms - Mayo Clinic.” [Online]. Available:
http://www.mayoclinic.org/diseases-conditions/bradycardia/basics/symptoms/con-
20028373. [Accessed: 27-May-2017].
[48] E. Lader, Field Guide to the Arrhythmias. Wiley, 2013.
[49] P. Brugada, J. Brugada, L. Mont, J. Smeets, and E. W. Andries, “A new approach to
the differential diagnosis of a regular tachycardia with a wide QRS complex.,”
Circulation, vol. 83, no. 5, 1991.
[50] “Ventricular tachycardia Overview - Mayo Clinic.” [Online]. Available:
http://www.mayoclinic.org/diseases-conditions/ventricular-tachycardia/home/ovc-
20253531. [Accessed: 27-May-2017].

86
[51] “Ventricular fibrillation - Mayo Clinic.” [Online]. Available:
http://www.mayoclinic.org/diseases-conditions/ventricular-
fibrillation/basics/definition/con-20034473. [Accessed: 27-May-2017].
[52] F. Carmona, K. M., M. S., and S. G., “Myocardial Ischemia in Congenital Heart
Disease: A Review,” in Ischemic Heart Disease, InTech, 2013.
[53] P. Valensi, L. Lorgis, and Y. Cottin, “Prevalence, incidence, predictive factors and
prognosis of silent myocardial infarction: A review of the literature,” Arch.
Cardiovasc. Dis., vol. 104, no. 3, pp. 178–188, 2011.
[54] N. Arenja, C. Mueller, N. F. Ehl, M. Brinkert, K. Roost, T. Reichlin, S. M. Sou, T.
Hochgruber, S. Osswald, and M. J. Zellweger, “Prevalence, Extent, and Independent
Predictors of Silent Myocardial Infarction,” Am. J. Med., vol. 126, no. 6, pp. 515–522,
2013.
[55] P. Tung and C. M. Albert, “Causes and prevention of sudden cardiac death in the
elderly,” Nat. Rev. Cardiol., vol. 10, no. 3, pp. 135–142, Jan. 2013.
[56] B. Nogrady, “Heart rate predicts sudden MI death.” [Online]. Available:
http://www.lexisnexis.com.zorac.aub.aau.dk/hottopics/lnacademic/?verb=sr&csi=2791
53&sr=HEADLINE(Heart+rate+predicts+sudden+MI+death)%2BAND%2BDATE%2
BIS%2B2005. [Accessed: 27-May-2017].
[57] M. F. Seronde, R. Geha, E. Puymirat, A. Chaib, T. Simon, L. Berard, E. Drouet, V.
Bataille, N. Danchin, and F. Schiele, “Discharge Heart Rate and Mortality after Acute
Myocardial Infarction,” Am. J. Med., vol. 127, no. 10, pp. 954–962, 2014.
[58] A. Susie, R. Ritchie, and A. W., “Sex Differences in Sudden Cardiac Death,” in
Ischemic Heart Disease, InTech, 2013.
[59] E. A. Martin and T. A. McFerran, Eds., A Dictionary of Nursing. Oxford University
Press, 2014.
[60] Yilin Zhao, “Standardization of mobile phone positioning for 3G systems,” IEEE
Commun. Mag., vol. 40, no. 7, pp. 108–116, Jul. 2002.
[61] “BeiDou Navigation Satellite System — System Introduction.” [Online]. Available:
http://www.beidou.gov.cn/2012/12/14/2012121481ba700d7ca84dfc9ab2ab9ff33d2772.
html. [Accessed: 09-Apr-2017].
[62] “FAQ | European Global Navigation Satellite Systems Agency.” [Online]. Available:
https://www.gsa.europa.eu/european-gnss/galileo/faq#abletouse. [Accessed: 09-Apr-
2017].
[63] “Measurement accuracy of GLONASS pseudoranges.” [Online]. Available:
http://www.sdcm.ru/smglo/errs?version=eng&repdate&site=extern. [Accessed: 11-
Apr-2017].
[64] “Prediction of GNSS GLONASS navigation definition precision ( 2017.04.11 9:00 T
GLONASS ).” [Online]. Available:
http://www.sdcm.ru/smglo/precisions?version=eng&sist=glo&site=extern. [Accessed:
11-Apr-2017].
87
[65] “GPS.gov: GPS Accuracy.” [Online]. Available:
http://www.gps.gov/systems/gps/performance/accuracy/. [Accessed: 09-Apr-2017].
[66] “GPS availability ( 2017.04.11 9:00 T GLONASS ).” [Online]. Available:
http://www.sdcm.ru/smglo/zones?version=eng&sist=gps&site=extern. [Accessed: 11-
Apr-2017].
[67] “GLONASS availability ( 2017.04.11 9:00 T GLONASS ).” [Online]. Available:
http://www.sdcm.ru/smglo/zones?version=eng&sist=glo&site=extern. [Accessed: 11-
Apr-2017].
[68] “GLONASS+GPS availability ( 2017.04.11 9:00 T GLONASS ).” [Online]. Available:
http://www.sdcm.ru/smglo/zones?version=eng&sist=sum&site=extern. [Accessed: 11-
Apr-2017].
[69] “Multipath vs. NLOS signals | Inside GNSS.” [Online]. Available:
http://www.insidegnss.com/node/3789. [Accessed: 11-Apr-2017].
[70] K. Dufková, M. Ficek, L. Kencl, J. Novák, J. Kouba, I. Gregor, and J. Danihelka,
“Active GSM Cell-ID Tracking: ‘Where Did You Disappear?’”
[71] “Difference between Cellular network and Ad Hoc network.” [Online]. Available:
http://www.rfwireless-world.com/Terminology/Cellular-network-vs-Ad-Hoc-
network.html. [Accessed: 16-Apr-2017].
[72] A. LaMarca and E. de Lara, “Location Systems: An Introduction to the Technology
Behind Location Awareness,” Synth. Lect. Mob. Pervasive Comput., vol. 3, no. 1, pp.
1–122, Jan. 2008.
[73] “Caller Location in Support of Emergency Services,” 2014.
[74] M. N. Borenovic, M. I. Simic, A. M. Neskovic, and M. M. Petrovic, “Enhanced Cell-
ID + TA GSM Positioning Technique,” in EUROCON 2005 - The International
Conference on “Computer as a Tool,” 2005, pp. 1176–1179.
[75] J. Eberspacher, H.-J. Vogel, and C. Bettstetter, GSM Switching, Services and
Protocols, Second Edition -. John Wiley & Sons, Ltd, 2001.
[76] Jiyun Shen and Y. Oda, “Direction estimation for cellular enhanced cell-ID positioning
using multiple sector observations,” in 2010 International Conference on Indoor
Positioning and Indoor Navigation, 2010, pp. 1–6.
[77] T. Wigren and J. Wennervirta, “RTT Positioning in WCDMA,” in 2009 Fifth
International Conference on Wireless and Mobile Communications, 2009, pp. 303–
308.
[78] E. C. L. Chan and G. Baciu, Introduction to Wireless Localization. John Wiley & Sons,
Incorporated, 2012.
[79] H. Liu, H. Darabi, P. Banerjee, and J. Liu, “Survey of Wireless Indoor Positioning
Techniques and Systems,” IEEE Trans. Syst. Man Cybern. Part C (Applications Rev.,
vol. 37, no. 6, pp. 1067–1080, Nov. 2007.
[80] A. Makki, A. Siddig, M. Saad, and C. Bleakley, “Survey of WiFi positioning using

88
time-based techniques,” Comput. Networks, vol. 88, pp. 218–233, 2015.
[81] P. Zhang, Q. Zhao, Y. Li, X. Niu, and Y. Zhuang, “Collaborative WiFi Fingerprinting
Using Sensor-Based Navigation on Smartphones,” 2015.
[82] P. Bahl and V. N. Padmanabhan, “RADAR: an in-building RF-based user location and
tracking system,” in Proceedings IEEE INFOCOM 2000. Conference on Computer
Communications. Nineteenth Annual Joint Conference of the IEEE Computer and
Communications Societies (Cat. No.00CH37064), vol. 2, pp. 775–784.
[83] C. Fisch, “Centennial of the string galvanometer and the electrocardiogram,” J. Am.
Coll. Cardiol., vol. 36, no. 6, pp. 1737–1745, 2000.
[84] “The electrocardiograph,” Integrative Physiological & Behavioral Science, 1995.
[Online]. Available:
http://web.b.ebscohost.com.zorac.aub.aau.dk/ehost/pdfviewer/pdfviewer?sid=a82406a9
-433f-4fdf-bd07-9ed8aba24708%40sessionmgr102&vid=1&hid=123. [Accessed: 27-
Apr-2017].
[85] S. Vieau and P. A. Iaizzo, “Basic ECG Theory, 12-Lead Recordings, and Their
Interpretation.”
[86] ECG Interpretation. Wolters Kluwer Health, 2004.
[87] “Smart Wearable ECG EKG Monitor - QardioCore.” [Online]. Available:
https://www.getqardio.com/qardiocore-wearable-ecg-ekg-monitor-iphone/. [Accessed:
14-May-2017].
[88] “Wearable ECG Sensor | Wireless ECG sensor | Electrocardiogram.” [Online].
Available: http://www.shimmersensing.com/products/shimmer3-ecg-unit#features-tab.
[Accessed: 04-Jun-2017].
[89] “ZIO® XT | iRhythm.” [Online]. Available: http://www.irhythmtech.com/products-
services/zio-xt. [Accessed: 04-Jun-2017].
[90] “CALM. Wearable ECG sensor with sports and sleep analysis.” [Online]. Available:
https://calm-health.com/. [Accessed: 04-Jun-2017].
[91] V. P. Chaubey, K. B. Laupland, C. B. Colwell, G. Soriya, S. Magder, J. Ball, J. M.
DiCocco, T. C. Fabian, G. J. Moran, R. Easton-Carr, G. J. Moran, R. Easton-Carr, G. J.
Moran, R. Easton-Carr, G. J. Moran, R. Easton-Carr, G. J. Moran, R. Easton-Carr, G. J.
Moran, R. Easton-Carr, P. Squara, D. Burkhoff, R. Dembinski, E. H. Chen, A. D.
Yeoman, J. A. Wendon, E. R. Frykberg, J. P. Chou, T. Lim, A. G. Lee, C. H. Mody, G.
Ouellet, M. Leblanc, M. M. Levi, J. C. O’Neill, A.-C. J. M. Pont, W. L. Biffl, C. C.
Mechem, A. Velez, M. Tomblyn, H. Honda, D. K. Warren, L. Widdel, K. M.
Beauchamp, S. Y. Donati, L. Papazian, J. D. Chalmers, A. T. Hill, L. J. Moore, J. G.
Muscedere, C. C. Baker, J. A. Al-Tawfiq, Z. A. Memish, A. K. Roy, P. T. Murray, D.
J. Anjaria, E. A. Deitch, D. J. Anjaria, E. A. Deitch, G. A. Mecott, M. G. Jeschke, A.
M. Al-Mousawi, D. N. Herndon, A. Sanford, R. L. Gamelli, M. Dibildox, M. G.
Jeschke, D. N. Herndon, K. S. Akers, C. K. Murray, A. Sanford, R. L. Gamelli, J. S.
Glasser, C. K. Murray, C. M. Luna, A. Capdevila, B. K. Hogan, and C. K. Murray,
“Bedside Hemodynamic Monitoring,” in Encyclopedia of Intensive Care Medicine,
Berlin, Heidelberg: Springer Berlin Heidelberg, 2012, pp. 288–293.
89
[92] “All About Heart Rate (Pulse).” [Online]. Available:
http://www.heart.org/HEARTORG/Conditions/More/MyHeartandStrokeNews/All-
About-Heart-Rate-Pulse_UCM_438850_Article.jsp. [Accessed: 04-Jun-2017].
[93] M. M. A. Hashem, R. Shams, A. Kader, and M. A. Sayed, “Design and Development
of a Heart Rate Measuring Device using Fingertip.”
[94] A. Shah, K. H. Shelley, K. Hovhannisyan, A. Moller, A. Smith, and S. Lewis, “Is pulse
oximetry an essential tool or just another distraction? The role of the pulse oximeter in
modern anesthesia care,” J. Clin. Monit. Comput., vol. 27, no. 3, pp. 235–242, Jun.
2013.
[95] J. N. Amoore, “Pulse oximetry: an equipment management perspective,” in IEE
Colloquium on Pulse Oximetry: A Critical Appraisal, 1996, vol. 1996, pp. 1–1.
[96] M. Elgendi, “On the analysis of fingertip photoplethysmogram signals.,” Curr.
Cardiol. Rev., vol. 8, no. 1, pp. 14–25, Feb. 2012.
[97] “ŌURA | Sleep Tracker & Wellness Ring With A Heart Rate Monitor.” [Online].
Available: https://ouraring.com/. [Accessed: 05-Jun-2017].
[98] C.-Y. Huang, M.-C. Chan, C.-Y. Chen, and B.-S. Lin, “Novel Wearable and Wireless
Ring-Type Pulse Oximeter with Multi-Detectors,” Sensors, vol. 14, no. 9, pp. 17586–
17599, Sep. 2014.
[99] “H10 heart rate sensor | Polar USA.” [Online]. Available: https://www.polar.com/us-
en/products/accessories/h10_heart_rate_sensor. [Accessed: 05-Jun-2017].
[100] “TICKR X Heart Rate Monitor & Workout Tracker | Wahoo Fitness.” [Online].
Available: http://uk.wahoofitness.com/devices/heart-rate-monitors/wahoo-tickr-x-
heart-rate-strap. [Accessed: 05-Jun-2017].
[101] “moto 360 (2nd gen.) - android wear smartwatch | Motorola US.” [Online]. Available:
https://www.motorola.com/us/products/moto-360. [Accessed: 30-May-2017].
[102] “Your heart rate. What it means, and where on Apple Watch you’ll find it. - Apple
Support.” [Online]. Available: https://support.apple.com/en-us/HT204666. [Accessed:
05-Jun-2017].
[103] T. E. Lockhart, “Biomechanics of Human Gait – Slip and Fall Analysis,” Encycl.
Forensic Sci., vol. 2, pp. 466–476, 2013.
[104] F. Prince, H. Corriveau, R. Hébert, and D. A. Winter, “Gait in the elderly,” Gait
Posture, vol. 5, no. 2, pp. 128–135, Apr. 1997.
[105] T. E. Lockhart, J. L. Smith, and J. C. Woldstad, “Effects of aging on the biomechanics
of slips and falls.,” Hum. Factors, vol. 47, no. 4, pp. 708–29, 2005.
[106] S. Lord, C. Sherrington, and H. Menz, Falls in Older People. 2000.
[107] L. Zhu, P. Zhou, A. Pan, J. Guo, W. Sun, L. Wang, X. Chen, and Z. Liu, “A Survey of
Fall Detection Algorithm for Elderly Health Monitoring,” in 2015 IEEE Fifth
International Conference on Big Data and Cloud Computing, 2015, pp. 270–274.
[108] J. Boyle and M. Karunanithi, “Simulated fall detection via accelerometers,” in 2008

90
30th Annual International Conference of the IEEE Engineering in Medicine and
Biology Society, 2008, pp. 1274–1277.
[109] U. Lindemann, A. Hock, M. Stuber, W. Keck, and C. Becker, “Evaluation of a fall
detector based on accelerometers: A pilot study,” Med. Biol. Eng. Comput., vol. 43, no.
5, pp. 548–551, Oct. 2005.
[110] C.-C. Wang, C.-Y. Chiang, P.-Y. Lin, Y.-C. Chou, I.-T. Kuo, C.-N. Huang, and C.-T.
Chan, “Development of a Fall Detecting System for the Elderly Residents,” in 2008
2nd International Conference on Bioinformatics and Biomedical Engineering, 2008,
pp. 1359–1362.
[111] T. Degen, H. Jaeckel, M. Rufer, and S. Wyss, “SPEEDY:a fall detector in a wrist
watch,” in Seventh IEEE International Symposium on Wearable Computers, 2003.
Proceedings., pp. 184–187.
[112] M. R. Narayanan, S. R. Lord, M. M. Budge, B. G. Celler, and N. H. Lovell, “Falls
Management : Detection and Prevention , using a Waist- mounted Triaxial
Accelerometer,” IEEE Conf., pp. 4037–4040, 2007.
[113] P. Kostopoulos, A. I. Kyritsis, M. Deriaz, and D. Konstantas, “F2D: A Location Aware
Fall Detection System Tested with Real Data from Daily Life of Elderly People,”
Procedia Comput. Sci., vol. 98, pp. 212–219, 2016.
[114] N. Noury, “A smart sensor for the remote follow up of activity and fall detection of the
elderly,” in 2nd Annual International IEEE-EMBS Special Topic Conference on
Microtechnologies in Medicine and Biology. Proceedings (Cat. No.02EX578), pp. 314–
317.
[115] W. Azizul, S. Imai, and T. Hasegawa, “Fall detection using smart phone and ubiquitous
pulse wave sensor,” in 2014 14th International Conference on Control, Automation
and Systems (ICCAS 2014), 2014, pp. 782–785.
[116] Q. T. Huynh, U. D. Nguyen, L. B. Irazabal, N. Ghassemian, and B. Q. Tran,
“Optimization of an Accelerometer and Gyroscope-Based Fall Detection Algorithm,”
J. Sensors, vol. 2015, pp. 1–8, 2015.
[117] “Montblanc Summit.” [Online]. Available:
http://www.montblanc.com/en/discover/specials/summit.html. [Accessed: 30-May-
2017].
[118] “HUAWEI WATCH 2 | Wearables | HUAWEI Global.” [Online]. Available:
http://consumer.huawei.com/en/wearables/tech-specs/watch-2-en.htm. [Accessed: 30-
May-2017].
[119] “HUAWEI Watch | Specifications | Wearables | HUAWEI Global.” [Online].
Available: http://consumer.huawei.com/en/wearables/huawei-watch/specifications.htm.
[Accessed: 30-May-2017].
[120] “TAG Heuer Connected Modular 45, the new Smartwatch 2017.” [Online]. Available:
https://www.tagheuer.com/en/watches/tag-heuer-connected. [Accessed: 30-May-2017].
[121] “ZTE Quartz Smart Watch.” [Online]. Available: https://www.zteusa.com/zte-quartz.
[Accessed: 30-May-2017].

91
[122] “New Balance RunIQ - SmartWatch Specifications.” [Online]. Available:
http://smartwatchspecifications.com/Device/new-balance-runiq/. [Accessed: 30-May-
2017].
[123] “Products | PRO TREK Smart WSD-F20 | Smart Outdoor Watch | CASIO.” [Online].
Available: https://wsd.casio.com/us/en/wsd-f20/products/. [Accessed: 30-May-2017].
[124] “LG Smart Watch Style in Titanium(W270) With Android Wear 2.0 | LG USA.”
[Online]. Available: http://www.lg.com/us/smart-watches/lg-W270-Titanium-style.
[Accessed: 30-May-2017].
[125] “LG Smart Watch Sport for AT&T With Android Wear 2.0 | LG USA.” [Online].
Available: http://www.lg.com/us/smart-watches/lg-W280A-sport. [Accessed: 30-May-
2017].
[126] “LG W200: AT&T Watch Urbane 2nd Edition | LG USA.” [Online]. Available:
http://www.lg.com/us/smart-watches/lg-W200A-lg-watch-urbane-2nd-edition-att.
[Accessed: 30-May-2017].
[127] “LG WATCH URBANE.” [Online]. Available: http://www.lg.com/uk/smart-
watches/lg-W150. [Accessed: 30-May-2017].
[128] “Polar M600 | The waterproof Android Wear 2.0 smartwatch for fitness and sports |
Polar Global.” [Online]. Available: https://www.polar.com/en/products/sport/M600-
GPS-smartwatch. [Accessed: 30-May-2017].
[129] “Michael Kors Access Bradshaw - SmartWatch Specifications.” [Online]. Available:
http://smartwatchspecifications.com/Device/michael-kors-access-bradshaw/.
[Accessed: 30-May-2017].
[130] “Gen 2 Smartwatch - Q Wander Light Brown Leather - Fossil.” [Online]. Available:
https://www.fossil.com/us/en/products/gen-2-smartwatch-q-wander-light-brown-
leather-sku-ftw2102p.html. [Accessed: 30-May-2017].
[131] “Gen 1 Smartwatch - Q Founder Black Leather - Fossil.” [Online]. Available:
https://www.fossil.com/us/en/products/gen-1-smartwatch-q-founder-black-leather-sku-
ftw20031p.html. [Accessed: 30-May-2017].
[132] “Nixon Mission Specs - CNET.” [Online]. Available:
https://www.cnet.com/products/nixon-mission/specs/. [Accessed: 30-May-2017].
[133] “ASUS ZenWatch 3 (WI503Q) | ZenWatch | ASUS USA.” [Online]. Available:
https://www.asus.com/us/ZenWatch/ASUS-ZenWatch-3-WI503Q/specifications/.
[Accessed: 30-May-2017].
[134] “ASUS ZenWatch 2 (WI501Q) | ZenWatch | ASUS USA.” [Online]. Available:
https://www.asus.com/us/ZenWatch/ASUS_ZenWatch_2_WI501Q/specifications/.
[Accessed: 30-May-2017].
[135] “moto 360 sport - exercise & fitness watch | Motorola US.” [Online]. Available:
https://www.motorola.com/us/products/moto-360-sport. [Accessed: 30-May-2017].
[136] “Motion Sensors | Android Developers.” [Online]. Available:
https://developer.android.com/guide/topics/sensors/sensors_motion.html#sensors-

92
motion-grav. [Accessed: 30-May-2017].
[137] “Android Wear | Android Developers.” [Online]. Available:
https://developer.android.com/wear/index.html. [Accessed: 30-May-2017].
[138] “Asus Zenwatch 3 WI503Q - Full phone specifications.” [Online]. Available:
http://www.gsmarena.com/asus_zenwatch_3_wi503q-8271.php. [Accessed: 30-May-
2017].
[139] A. B. Hertzman, “THE BLOOD SUPPLY OF VARIOUS SKIN AREAS AS
ESTIMATED BY THE PHOTOELECTRIC PLETHYSMOGRAPHl.”
[140] L. Karasulu, L. Dalar, S. Sokucu, and S. Altin, “Heart rate variability analysis of single
channel electrocardiogram can help to differentiate high- risk patients with obstructive
sleep apnea syndrome - a study on diagnostic accuracy,” Anadolu Kardiyol.
Dergisi/The Anatol. J. Cardiol., Apr. 2012.
[141] “Human Biology Chapter 8.3: Cardiac Muscle and Electrical Activity.” [Online].
Available: http://archive.cnx.org/contents/b7eae756-f4d7-48ea-9af0-
2d682e653e2c@1/human-biology-chapter-8-3-cardiac-muscle-and-electrical-activity.
[Accessed: 15-May-2017].
[142] ECG Interpretation. Springhouse, 2004.
[143] “Google Forms - create and analyze surveys, for free.” [Online]. Available:
https://www.google.com/forms/about/. [Accessed: 12-May-2017].
[144] “Smartphone OS global market share 2009-2016 | Statistic,” statista.com. [Online].
Available: https://www.statista.com/statistics/266136/global-market-share-held-by-
smartphone-operating-systems/. [Accessed: 14-May-2017].
[145] “Syncope (Fainting) | American Heart Association.” [Online]. Available:
http://www.heart.org/HEARTORG/Conditions/Arrhythmia/SymptomsDiagnosisMonit
oringofArrhythmia/Syncope-Fainting_UCM_430006_Article.jsp. [Accessed: 28-May-
2017].
[146] P. Goyal and M. S. Maurer, “Syncope in older adults.,” J. Geriatr. Cardiol., vol. 13,
no. 5, pp. 380–6, Jul. 2016.
[147] “WHO Global report on falls Prevention in older Age.”
[148] I. Alexander and N. Maiden, Scenarios, Stories, Use Cases: Through the Systems
Development Life-Cycle. John Wiley & Sons, 2004.
[149] “Systems Context Diagrams | Johns Hopkins University Engineering for
Professionals.” [Online]. Available: https://ep.jhu.edu/about-us/news-and-
media/systems-context-diagrams. [Accessed: 24-May-2017].
[150] P. Laplante, Requirements Engineering for Software and Systems, Second Edition.
Auerbach Publications, 2014.
[151] H. Gomaa, Software Modeling and Design. Cambridge University Press, 2011.
[152] A Guide to the Business Analysis Body of Knowledge (BABOK Guide), Version 2.0.
International Institute of Business Analysis (IIBA), 2009.

93
[153] D. Ya-juan and H. Shao-rong, “Topology Characteristic of Hub-and-spoke
Transportation Network.”
[154] P. Kostopoulos, T. Nunes, K. Salvi, M. Deriaz, and J. Torrent, “Increased Fall
Detection Accuracy in an Accelerometer-Based Algorithm Considering Residual
Movement.”
[155] “Pulse: MedlinePlus Medical Encyclopedia.” [Online]. Available:
https://medlineplus.gov/ency/article/003399.htm. [Accessed: 29-May-2017].
[156] “Finite state machine,” NIST - National Institute of Standards and Technology.
[Online]. Available: https://xlinux.nist.gov/dads/HTML/finiteStateMachine.html.
[Accessed: 26-May-2017].
[157] S. Ambler, The Elements of UML 2.0 Style. Cambridge University Press, 2005.
[158] J. Rubin and D. Chisnell, “Handbook of UsabilityTesting: How to Plan, Design, and
Conduct EffectiveTests, Second Edition,” 2008. [Online]. Available:
http://library.books24x7.com.zorac.aub.aau.dk/assetviewer.aspx?bookid=25203&chun
kid=110897512&rowid=45. [Accessed: 07-Jun-2017].
[159] F. Fioravanti, Skills for Managing Rapidly Changing IT Projects. .
[160] K. E. Kocher, A. N. Haggins, A. K. Sabbatini, K. Sauser, and A. L. Sharp, “Emergency
department hospitalization volume and mortality in the United States.,” Ann. Emerg.
Med., vol. 64, no. 5, p. 446–457.e6, Nov. 2014.
[161] “Lumen,” in Encyclopedia of Genetics, Genomics, Proteomics and Informatics,
Dordrecht: Springer Netherlands, 2008, pp. 1125–1125.
[162] J. W. Gooch, “Lumen,” in Encyclopedic Dictionary of Polymers, New York, NY:
Springer New York, 2011, pp. 435–435.
[163] “Coronary Angiogram Overview - Mayo Clinic.” [Online]. Available:
http://www.mayoclinic.org/tests-procedures/coronary-angiogram/home/ovc-20262384.
[Accessed: 30-Apr-2017].
[164] “CT coronary angiogram - Mayo Clinic.” [Online]. Available:
http://www.mayoclinic.org/tests-procedures/ct-angiogram/basics/definition/prc-
20014596. [Accessed: 30-Apr-2017].
[165] Xiaoxin Wu, B. Mukherjee, and D. Ghosal, “Hierarchical architectures in the third-
generation-cellular Network,” IEEE Wirel. Commun., vol. 11, no. 3, pp. 62–71, Jun.
2004.
[166] “Oxford Dictionaries | Longitudinal - definition of longitudinal in English.” [Online].
Available: https://en.oxforddictionaries.com/definition/longitudinal. [Accessed: 27-
Apr-2017].
[167] T. Fawcett, “An introduction to ROC analysis,” 2006.
[168] A Dictionary of Plant Sciences. Oxford University Press, 2012.

Semester: ICTE4
Title:
System for Reducing the Risk of Mortality due to Ischemic
Heart Disease among the Elderly
Project Period: 1 February 2017 – 30 June 2017
Semester Theme:
Master Thesis
Supervisor(s):
Per Lynggaard
Project group no.:
4SER 4.8
Members
(do not write CPR.nr.):
Michaela Mihaylova Mihaylova
Pages: 82
Finished: 8 June 2017
Abstract: The world’s population is currently experiencing a
trend towards ageing. People now live longer than
ever before and it is expected that by 2050 one out of
every five people will be at least 60-years-old.
Respectively, of all age groups senior citizens
experience the highest mortality rates. Among the
global leading causes of death, the foremost is
Ischemic Heart Disease. The focus of the current
Thesis is to develop a system – hereafter referred to
as Vixi - that would aid in reducing the risk of death
due to the aforementioned ailment. In order to do so,
research is conducted into the nature of Ischemic
Heart Disease, specifically the exact conditions that
can lead to a fatal outcome, along with their
pathology, as well as the technologies that can detect
them. From the discovered diagnostic tools, the non-
invasive ones are extracted so as to be applied within
the service – these are preferred because the Vixi is
intended for continuous daily monitoring.
The Vixi system is based on the utilization of the
following two devices: the smartwatch and the
wearable ECG. The data gathered via their various
sensors serves as input for Vixi’s main algorithm.
The aforementioned algorithm is designed by the
author; it can interpret sensor and user input in order
to determine at any given moment whether its user is
experiencing an ischemia-induced cardiac event that
can lead to a fatal outcome. Additionally, within the
current report a proposal for the accompanying
system architecture is also provided.
Aalborg University Copenhagen A.C. Meyers Vænge 15 2450 København SV Semester Coordinator: Henning Olesen Secretary: Maiken Keller
When uploading this document to Digital Exam each group member confirms that all have
participated equally in the project work and that they collectively are responsible for the
content of the project report. Furthermore each group member is liable for that there is no
plagiarism in the report.