Intelligent Micro-grid Protection - Silicon Institute of...
76
Intelligent Micro-grid Protection Dr S R Samantaray School of Electrical Science IIT Bhubaneswar 20/02/2015 NWET-2015, Silicon Institute of Technology, Bhubaneswar 1
Transcript of Intelligent Micro-grid Protection - Silicon Institute of...

Intelligent Micro-grid Protection
Dr S R Samantaray
School of Electrical Science
IIT Bhubaneswar
20/02/2015 NWET-2015, Silicon Institute of Technology,
Bhubaneswar 1

Key points
• Introduction to micro-grid
• Issues involved in micro-grid
• Challenges in micro-grid protection
• Proposed Intelligent Relays
• Conclusion
20/02/2015 NWET-2015, Silicon Institute of Technology,
Bhubaneswar 2

What is a microgrid ?
NWET-2015, Silicon Institute of Technology, Bhubaneswar
Objective: •Facilitate penetration of Distributed Generators (DG) to the power distribution network at low or medium voltage •Provide high quality and reliable energy supply to critical loads
20/02/2015 3

Microgrid Architecture
NWET-2015, Silicon Institute of Technology, Bhubaneswar
•Microsource Controller: Uses local information to control the microsource and responds in milliseconds to events. •Energy Manager: Optimizes individual microsources to meet power supplier and customer needs by collecting system information and providing each microsource with its individual operating points (normally power and voltage set points); the time response of this function is measured in minutes. • Protection Coordinator: which rapidly isolates feeder faults within the Microgrid and communicates feeder status changes to the Energy Manager.
20/02/2015 4

Microgrid Components
NWET-2015, Silicon Institute of Technology, Bhubaneswar
•Distributed Generation (microsources) • Loads • Intermediate storage • Controller and protection elements • Point of common coupling
20/02/2015 5

IEEE Standards for Microgrid issues
NWET-2015, Silicon Institute of Technology, Bhubaneswar
IEEE 1547: Interconnection of Distributed Generation Guides and Test Protocols:
•1547.1 –Testing •P1547.2 –Guide for use of 1547 •1547.3 –Communication •P1547.4 –DR Islands •P1547.5 –Above10 MWs •P1547.6 –Meshed Networks
20/02/2015 6

Introduction to DG
•Power source connected directly to the primary or secondary distribution system.
•Power Production in Distribution Network
•Usually small scale
•Often but not necessarily renewable
•In the US and other western countriess, this is known as Distributed Energy Resources, Distributed Generation and Dispersed Generation. In British English Embedded Generation is more frequently used.
NWET-2015, Silicon Institute of Technology, Bhubaneswar
20/02/2015 7

Various Sources for DG
•Wind Power
•Combined heat and power plants (CHP)
•Hydro Power
•Photo Voltaic
•Fuel cells
NWET-2015, Silicon Institute of Technology, Bhubaneswar
20/02/2015 8

Energy Storage Converters
•Synchronous Generators
•Induction Generators
•Power Electronic Converters
NWET-2015, Silicon Institute of Technology, Bhubaneswar
20/02/2015 9

Issues Involved in microgrid
•Protection Issues
•Control of DG Units
•Coordination of DG unit Controllers
NWET-2015, Silicon Institute of Technology, Bhubaneswar
20/02/2015 10

Protection Issues:
•Islanding Detection
•Protection against Faulty situations
NWET-2015, Silicon Institute of Technology, Bhubaneswar
20/02/2015 11

Micro-grid Operation A micro-grid is a group of controllable interconnected loads and distributed generations (DGs) within a clearly defined electrical boundaries that acts as a single controllable entity with respect to the grid.
Distributed generations(DGs) DG Types-Induction, Synchronous, Inverter based.
Common distribution topology Radial grid structure, Loop grid structure
Mode of Operation
Grid Connected and Islanded :
• Unintentional (Failure in the upstream MV grid)
• Intentional (Maintenance actions) 20/02/2015 NWET-2015, Silicon Institute of Technology,
Bhubaneswar 12

Existing Micro-grid Protection Techniques
20/02/2015 NWET-2015, Silicon Institute of Technology,
Bhubaneswar 13

Micro-grid Protection Challenges
20/02/2015 NWET-2015, Silicon Institute of Technology,
Bhubaneswar 14

Grid connected mode (radial topology)
Islanded mode (radial topology)
Fault Current contributed in Grid connected and islanded mode (Radial topology)
20/02/2015 NWET-2015, Silicon Institute of Technology,
Bhubaneswar 15

DL1 DL2 DL3 DL4 DL50
2
4
6
8
Distribution line
Fault c
urr
ent
in p
u
Grid connected mode
Islanded mode8.08
1.06
8.41
1.83
4.64 4.67
2.01
3.12
2.211.69
Fault Current measured in Grid connected and islanded mode (Radial topology)
20/02/2015 NWET-2015, Silicon Institute of Technology,
Bhubaneswar 16

Islanded mode (radial topology)
Islanded mode (loop topology)
Fault Current contributed in Radial and Loop topology (islanded mode)
20/02/2015 NWET-2015, Silicon Institute of Technology,
Bhubaneswar 17

Fault Current measured in Radial and loop distribution network (islanded mode)
DL1 DL2 DL3 DL4 DL50.5
1
1.5
2
2.5
3
3.5
4
Distribution line
Fault c
urr
ent
in p
u
Radial topology
Mesh topology
1.06
1.31
1.83
3.16
2.01
2.88
1.89
2.56
2.21
1.69
20/02/2015 NWET-2015, Silicon Institute of Technology,
Bhubaneswar 18

Islanded mode (all DGs are present)
Islanded mode (DG1 is out)
Fault Current contributed when some DGs are Out (islanded mode)
20/02/2015 NWET-2015, Silicon Institute of Technology,
Bhubaneswar 19

DL1 DL2 DL3 DL4 DL50
0.5
1
1.5
2
2.5
3
Distribution line
Fault c
urr
ent
in p
u
All DGs are present
DG1 is out
1.832.01
0.92
1.69
1.181.031.06
0.92
0.17
2.21
Fault Current measured when DG1 is Out (islanded mode)
20/02/2015 NWET-2015, Silicon Institute of Technology,
Bhubaneswar 20

Grid connected (radial)
Islanded (radial)
Islanded, DG1is out
(radial)
Islanded, DG1 is out, (mesh)
End1 End2 End1 End2 End1 End2 End1 End2 DL1 8.08 2.44 1.06 3.31 0.92 0.05 0.26 1.98 DL2 8.41 2.06 1.83 2.12 0.17 1.62 0.89 1.29 DL3 4.64 1.08 2.01 1.38 0.92 1.36 0.41 1.85 DL4 4.67 1.84 2.21 1.24 1.18 1.39 1.17 0.89 DL5 3.12 2.21 1.69 1.76 1.03 1.81 0.43 1.98
End1 R1, R4, R6, R9, R11 (DL1, DL2, DL3, DL4, DL5 resp) End2 R2,R5, R7, R10, R12(DL1, DL2, DL3, DL4, DL5 resp)
Fault Current measured at Different Distribution Lines
20/02/2015 NWET-2015, Silicon Institute of Technology,
Bhubaneswar 21

1. Variations in fault currents • Different in grid connected and islanded mode
• Synchronous DG and DFIG contribute more fault current compare to inverter based DG
• Depends on short circuit level(presence and absence of DGs)
2. Impact of DGs on relay operation • Bidirectional power flow affect the relay operation (coordination)
3. Impact of network topology on relay operation • Thus over current relay(and directional relay) with fixed setting may
be ineffective when applied to microgrid. It does not guarantee fault sensitivity or selective operation for all possible faults.
4. Anti-islanding information
Micro-grid Protection Challenges
20/02/2015 NWET-2015, Silicon Institute of Technology,
Bhubaneswar 22

Motivation
• To overcome the following shortcoming in existing fault protection techniques. • Unreliable Over Current relay--- the fault current magnitude
vary over a wide range depending on the DGs present in the system and operating mode.
• The existing current differential protection work inefficiently as the current magnitude vary.
• Protection function must be selective depending upon the operating mode (grid connected or islanded mode)--- fault protection function must have prior islanding information.
20/02/2015 NWET-2015, Silicon Institute of Technology,
Bhubaneswar 23

• To provide anti-islanding protection with minimum NDZ. • Existing passive anti-islanding relays such as rate of change
of frequency (ROCOF) relay and rate of change of voltage (ROCOV) relay fails in lower end power mismatch (< 15%) i.e, higher non detection zone (NDZ). The proposed relay is aim to reduce NDZ.
• To develop a data-mining based intelligent anti-islanding
protection relay, which can work for mixed DGs including synchronous and inverter based DGs.
• To design a comprehensive protection scheme for safe and
secure micro-grid operation.
20/02/2015 NWET-2015, Silicon Institute of Technology,
Bhubaneswar 24

Proposed Protection Function for Micro-grid
20/02/2015 NWET-2015, Silicon Institute of Technology,
Bhubaneswar 25

Data Mining Based Anti-Islanding Relay
20/02/2015 NWET-2015, Silicon Institute of Technology,
Bhubaneswar 26

Islanding
That part of a power system consisting of one ore more power sources and load that is, for some period of time, separated from the rest of the system.”
NWET-2015, Silicon Institute of Technology, Bhubaneswar
20/02/2015 27

Effect of Islanding
•Islanding during a heavy load flow to or from the main grid necessarily causes an unbalance in production and load.
•If there is a surplus of active power in the island energy is stored in the rotating masses. The speed of the generators will increase and the frequency rises.
•In a PEC-unit the extra energy is stored in the DC-link, which leads to an increase of the DC-link voltage. Lack of active power in the island would obviously lead to the opposite.
NWET-2015, Silicon Institute of Technology, Bhubaneswar
20/02/2015 28

DG status during Islanding:
•Failure to trip islanded DG can lead to a number of problems for these resources and the connected loads, which includes power quality, safety and operation problems. •Therefore, the current industry practice is to disconnect all distributed resources (DRs) immediately after the occurrence of islands. •The disconnection is normally performed by a special protection scheme called islanding detection relays, which can be implemented using different techniques.
NWET-2015, Silicon Institute of Technology, Bhubaneswar
20/02/2015 29

Islanding Detection
Islanding detection is to detect the Loss of mains source connected to the grid ”. Antislanding protection and islanding protection are synonyms used around the world.
NWET-2015, Silicon Institute of Technology, Bhubaneswar
20/02/2015 30

Islanding Methods
•Passive method Make decisions based on the local measurements of voltage and current signals, under/over frequency, under/over voltage, rate-of-change of frequency, rate-of-change of power, vector surge and harmonic distortion indices •Active method In this technique, disturbances are injected locally into the system and responses of these disturbances are used to detect islanding conditions. Active schemes include impedance measurement, voltage phase jump, voltage shift, phase shift, frequency shift and harmonic distortion •Communications method Communication schemes are telecommunication devices that are designed to trip DR’s when islands are formed. These schemes include power line signaling and transfer trip
NWET-2015, Silicon Institute of Technology, Bhubaneswar
20/02/2015 31

•Active techniques introduce an external perturbation at the output of the inverter. These tend to have a faster response and a smaller non-detection zone compared to passive approaches. However, the power quality (PQ) of the inverter can be degraded by the perturbation.
•Reliability becomes a measure concern in Communication based Islanding detection using power line signaling and transfer trip
Difficulties in Active and Communication based Techniques
NWET-2015, Silicon Institute of Technology, Bhubaneswar
20/02/2015 32

Passive Islanding Detection Techniques
•Rate of Change of Power (ROCOF) •Rate of change of voltage •Rate of change in power factor •THD Voltage and Current •Vector Surge •Rate of Change of Power
The advantage of Passive techniques is that the implementation does not have an impact on the normal operation of the DG system
NWET-2015, Silicon Institute of Technology, Bhubaneswar
20/02/2015 33

NWET-2015, Silicon Institute of Technology, Bhubaneswar
20/02/2015
Most Effective Passive islanding detection technique
•P-f Droop •Active Power Mismatch and Frequency drift
•Q-V Droop
•Reactive Power Mismatch and Voltage drift
34

ROCOF for islanding conditions with active power imbalance from 5 to 80%.
NWET-2015, Silicon Institute of Technology, Bhubaneswar
Performance of ROCOF relays
20/02/2015 35

dv/dt for islanding conditions with reactive power imbalance from 5 to 80%.
NWET-2015, Silicon Institute of Technology, Bhubaneswar
Performance of dv/dt relays
20/02/2015 36

Limitations of Existing Passive methods
•The ROCOF relays, however, may become ineffective if the power imbalance in the islanded system is less than 15%, resulting in a high risk of false detection
• Vector surge relay is highly sensitive to load changes
•THD method suffers due to improper measurement at the PCC
NWET-2015, Silicon Institute of Technology, Bhubaneswar
20/02/2015 37

Motivation
The anti-islanding relay must work with
reduced Non-Detection-Zone. This is the
condition when the islanding occurs with
lower active and reactive power
mismatch.
NWET-2015, Silicon Institute of Technology, Bhubaneswar
20/02/2015 38

Proposed Data Mining Based Anti-Islanding Relay
Schematic diagram of the proposed data mining based anti-islanding relay
Training of DT
Testing for trip decision
20/02/2015 NWET-2015, Silicon Institute of Technology,
Bhubaneswar 39
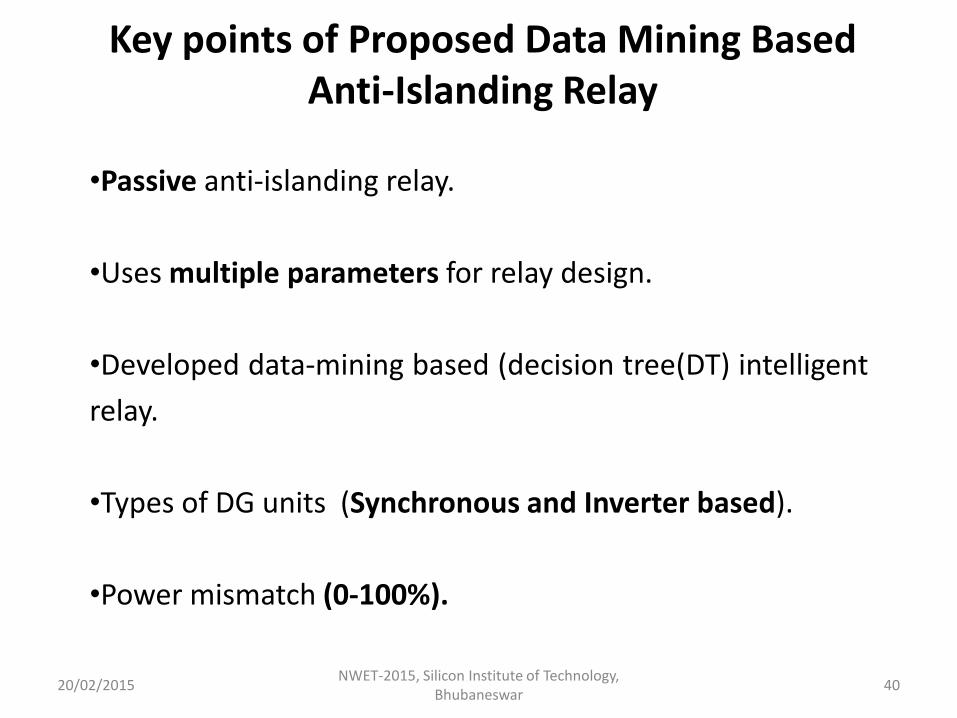
Key points of Proposed Data Mining Based Anti-Islanding Relay
•Passive anti-islanding relay.
•Uses multiple parameters for relay design.
•Developed data-mining based (decision tree(DT) intelligent
relay.
•Types of DG units (Synchronous and Inverter based).
•Power mismatch (0-100%).
20/02/2015 NWET-2015, Silicon Institute of Technology,
Bhubaneswar 40

Studied Micro-grid
20/02/2015 NWET-2015, Silicon Institute of Technology,
Bhubaneswar 41

Parameters of Studied Micro-grid
Line(Bus-Bus) R1(Ω) L1(mH)
1 DL1 4.856 34.525
2 DL2,DL7 1.238 11.18
3 DL3,DL8 0.7706 2.754
4 DL4,DL9 3.2552 9.081
5 DL5,DL10 1.701 15.36
6 DL6,DL11 0.1803 1.628
Line parameters
Load P(MW) Q(MVAR)
1 L1 1.50 0.70 2 L2 1.20 0.85 3 L3,L8 1.00 0.45 4 L4,L9 1.60 0.60 5 L5,L10 1.35 0.75 6 L6,L11 1.80 1.3 7 L7,L12 2.00 1.1
Load parameters
20/02/2015 NWET-2015, Silicon Institute of Technology,
Bhubaneswar 42
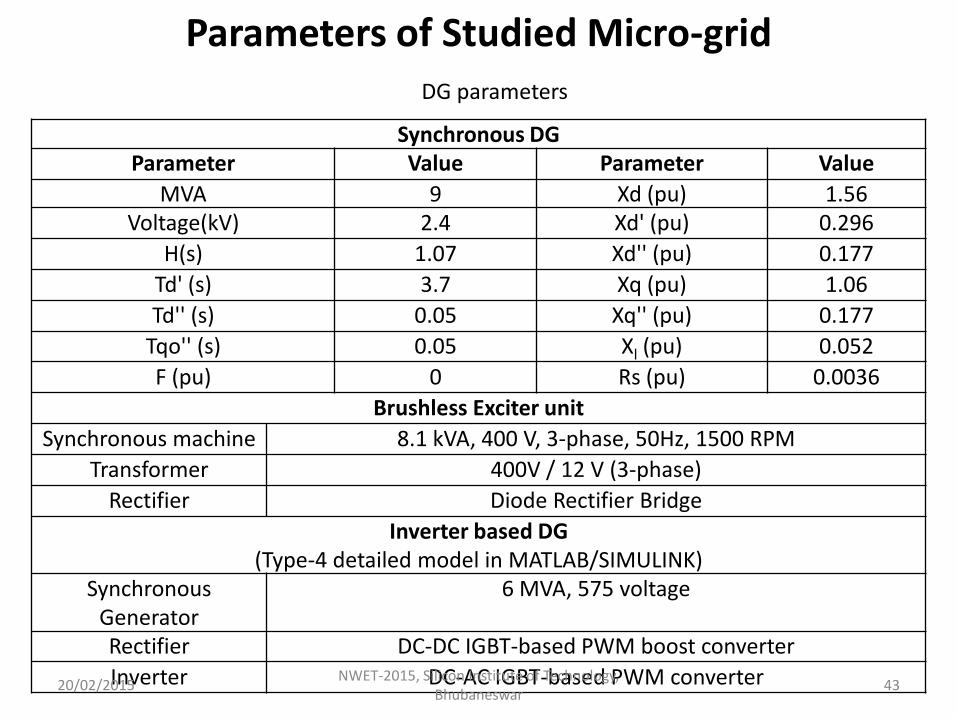
Synchronous DG Parameter Value Parameter Value
MVA 9 Xd (pu) 1.56 Voltage(kV) 2.4 Xd' (pu) 0.296
H(s) 1.07 Xd'' (pu) 0.177
Td' (s) 3.7 Xq (pu) 1.06
Td'' (s) 0.05 Xq'' (pu) 0.177
Tqo'' (s) 0.05 Xl (pu) 0.052
F (pu) 0 Rs (pu) 0.0036
Brushless Exciter unit
Synchronous machine 8.1 kVA, 400 V, 3-phase, 50Hz, 1500 RPM
Transformer 400V / 12 V (3-phase)
Rectifier Diode Rectifier Bridge
Inverter based DG (Type-4 detailed model in MATLAB/SIMULINK)
Synchronous Generator
6 MVA, 575 voltage
Rectifier DC-DC IGBT-based PWM boost converter
Inverter DC-AC IGBT-based PWM converter
DG parameters
Parameters of Studied Micro-grid
20/02/2015 NWET-2015, Silicon Institute of Technology,
Bhubaneswar 43

Features Extracted X1= ∆F, the frequency deviation (Hz).
X2= dF/dt, the rate-of-change of frequency ROCOF (Hz/s)
X3= V, the voltage in (pu).
X4= ∆V, the voltage deviation in (pu).
X5= dV/dt, the rate-of-change of voltage (pu/s).
X6= P, the DG active power output, pu (10MVA basis).
X7= dP/dt, the DG active power output change with time (pu/s).
X8= Q, the DG reactive power output (pu on 10 MVA basis).
X9= dQ/dt, the DG reactive power output change with time (pu/s).
X10= ∆Phi, change in the phase angle difference .
X11= dPhi / dt, the rate of change of phase angle difference .
X12= cos (phi), the power factor.
X13= d(cos (phi))/dt, the rate of change of power factor.
X14= CTHD , the total harmonic distortion of the current.
X15= dCTHD/dt, the rate of change of the total harmonic distortion of the current (pu/s).
20/02/2015 NWET-2015, Silicon Institute of Technology,
Bhubaneswar 44

Features Extracted X16= VTHD , the total harmonic distortion of the voltage (pu).
X17= dVTHD/dt, the rate of change of the total harmonic distortion of the voltage (pu/s).
X18= VNEG , the negative sequence voltage.
X19= dVNEG/dt , the rate of change negative sequence Voltage.
X20= INEG , the negative sequence current.
X21= dINEG/dt, the rate of change negative sequence current.
X22= PNEG , the negative sequence power, pu. (10MVA basis)
X23= dPNEG/dt, the rate of change negative sequence power (pu/s).
X24= (U.cos Phi), the absolute value of the phase voltage times power factor (pu)
X25= d(U.cos Phi)/dt , the gradient of the voltage times power factor (pu/s).
X26= dF/dP, the rate-of-change of frequency over active power (Hz/pu).
X27= dV/dQ , the rate-of-change of voltage over reactive Power.
20/02/2015 NWET-2015, Silicon Institute of Technology,
Bhubaneswar 45

The power system signal x(t) is represented as:
)2sin()(1
k
k
k kftAtx
Now, the three phase quantities (a, b, c) can be transformed in to d and q by d-q transformation as
where Ak , δk are amplitude and angle of kth order waveform and f is the power system real frequency
where ω0 =2ᴫ f0 and f0 is the power system nominal frequency
Now substituting the values of (1) in (2), at the mth order sample time , that is t=mTs (m=0,1,2…), where Ts is the sampling interval, results
1
0
1
0
])(2sin[
])(2cos[
2
3
)(
)(
k
ksk
k
ksk
q
d
mTfkfA
mTfkfA
mx
mx
c
b
a
q
d
x
x
x
tt
tt
x
x
2/32/30
2/12/11
)cos()sin(
)sin()cos(
00
00
(1)
(2)
(3)
DFT Based Pre-processor
20/02/2015 NWET-2015, Silicon Institute of Technology,
Bhubaneswar 46

For k=1, the fundamental quantities are given as
])(2sin[5.1)(
])(2cos[5.1)(
1011
1011
sq
sd
mTffAmx
mTffAmx
From the above d-q quantities, the amplitude (A1 ) ,phase (δ1 ) and frequency (f) are calculated as
12
12
13
2qd xxA
)]0(/)0(arctan[ 111 dq xx
011
2
)]()([f
pT
pmmf
s
DFT Based Pre-processor
. abc to dq transformation in simulink environment
Magnitude and phase estimation using dq-transformation
(4)
(5)
(6)
(7)
(8)
1
dqo
2/3
Gain4
2/3
Gain3
sqrt(3)/2
Gain2
2/3
Gain11/2
Gain
Demux1
abc
3
Magnitude
2
Phase1
Vpabc dqo
clarke V
1
SI(z)
Vq
1
CO(z)
Vd
1
SI(z)
Uq
1
CO(z)
Ud
Re
ImDemux
|u|
u
1
Vabc
20/02/2015 NWET-2015, Silicon Institute of Technology,
Bhubaneswar 47

Features Extraction
28
PandQ
27
dV/dQ
26
dF/dP
25
dUCPhi/dt
24
UCPhi
23
dPneg/dt
22
Pneg
21
dIneg/dt
20
Ineg
19
dVneg/dt
18
Vneg
17
dVTHD/dt
16
VTHD
15
dCTHD/dt
14
CTHD
13
dCPhi/dt
12
CPhi
11
dPhi/dt
10
∆ Phi
9
dQ/dt
8
Q
7
dP/dt
6
P
5
dV/dt
4
∆V
3
V
2
dF/dt
1
∆F 0
Xq
sqrt(eps+1e-6)
sqrt(eps+1e-6)
Signals Samples
Sampling V
Signals Samples
Sampling I
Rate Transition4
Rate Transition3
Rate Transition2
Rate Transition1
Vp
Ip
xq
F
V
∆V
∆F
Frequency Block
Vabc
Iabc
Vp
Ip
P
Q
CPhi
UCPhi
DFT Phasor
Iabc Ineg
Phase
Vabc Vneg
Phase
Iabc CTHD
Vabc VTHD
Pneg dPneg/dt
Ineg dIneg/dt
Vneg dVneg/dt
VTHD dVTHD/dt
CTHD dCTHD/dt
UCPhi dUCPhi/dt
CPhi dCPhi/dt
Phi
dPhi/dt
Q dQ/dt
P dP/dt
V dV/dt
F dF/dt
2
Iabc
1
Vabc
Phi
∆Phi
Phi
20/02/2015 NWET-2015, Silicon Institute of Technology,
Bhubaneswar 48

Number of events generated
Number of Events Synchronous DG(1&3) Inverter based DG(2&4) Total Islanding 164 170 334
Non-Islanding 106 100 206 Total 270 270 540
Events Generation and Data Mining
Event DG1 DG2 DG3 DG4
1 CB1 Open islanding islanding Islanding islanding
2 CB3 Open islanding Non-islanding Non-islanding Non-islanding
3 CB6 Open Non-islanding Non-islanding Non-islanding islanding
4 CB4 Open Non-islanding islanding Non-islanding Non-islanding
5 CB5 Open Non-islanding Non-islanding islanding Non-islanding
6 CB2 Open islanding islanding islanding islanding
7 Sudden load change at PCC Non-islanding (DG1,DG2,DG3,DG4)
8 Capacitor switching Non-islanding (DG1,DG2,DG3,DG4)
Some Sample Events
*All above events are considered under wide variations in active and reactive power mismatch varying between 0 - 100 %.
20/02/2015 NWET-2015, Silicon Institute of Technology,
Bhubaneswar 49

Events Generation and Data Mining
X1 X2 X3 X4 …. X25 X26 X27 Islanding=1,
non-islanding=0
0.02533014 0.00234216 1.02227909 0.00014694 …. 0.515873381 1.26267490 -0.00037 0
0.10104956 0.05020749 0.95246404 -0.03721791 …. -8.557069228 22.2106734 0.069447 1
0.24799979 0.12597821 0.96058803 -0.03237012 …. -27.16629357 -40.8684307 0.061323 1
-0.41279718 -0.20661342 0.99328937 -0.01792311 …. 290.4294997 2.36709369 0.028622 0
3.26806952 1.42538553 0.65418183 -0.22476201 … -20.10257667 -5.14555498 0.367729 1
Sample data set for training data mining model
20/02/2015 NWET-2015, Silicon Institute of Technology,
Bhubaneswar 50

Building the Data Mining Model (Decision Tree)
20/02/2015 NWET-2015, Silicon Institute of Technology,
Bhubaneswar 51

Decision Tree
• A flow-chart-like tree structure
• Internal node denotes a test on an attribute
• Branch represents an outcome of the test
• Leaf nodes represent class labels or class distribution
20/02/2015 NWET-2015, Silicon Institute of Technology,
Bhubaneswar 52
Advantages of Data Mining Model (Decision Tree)
• It promote decision making
• It can handle high dimension data
• It does not required any domain knowledge or parameter setting, and is therefore suitable for exploratory knowledge discovery
• Learning and classification steps are simple and fast
• Good accuracy
• It perform well despite noisy or missing data (robustness).
• It convert result to a set of easily interpretable rules
• Simple to understand and implement.
20/02/2015 NWET-2015, Silicon Institute of Technology,
Bhubaneswar 53

Decision Tree Learning Steps
Building a Decision Tree
1. First test all attributes and select the one that would function as the best root;
2. Break-up the training set into subsets based on the branches of the root node;
3. Test the remaining attributes to see which ones fit best underneath the branches of the root node;
4. Continue this process for all other branches until
a. all examples of a subset are of one type
b. there are no examples left (return majority classification of the parent)
c. there are no more attributes left (default value should be majority classification)
20/02/2015 NWET-2015, Silicon Institute of Technology,
Bhubaneswar 54

Decision Tree Learning Steps
Determining the best attribute (Entropy & Gain)
• Entropy E(S)
E(S) = ci=1 –pi log2 pi ,
– Where S is a set of training examples,
– c is the number of classes, and
– pi is the proportion of the training set that is of class i
For our entropy equation 0 log2 0 = 0
• The information gain G(S,A)
G(S,A) E(S) - v in Values(A) (|Sv| / |S|) * E(Sv)
where A is an attribute
20/02/2015 NWET-2015, Silicon Institute of Technology,
Bhubaneswar 55

DT Generated
Total 540 cases are considered. 70% data is used for training the DT and 30% for testing. 27 features are considered. Features taking part in DT construction are X4, X15, X1, X10, X27, X19, X6 (∆V, dCTHD/dt, ∆F, ∆Phi, dV/dQ , dVNEG/dt , P )
X15>=-0.081 X1>=-0.39
No
No
Yes
Yes
No
Yes
Yes
Yes
No
No
Yes
No
Yes
No
NoYes
Yes No
Yes N
o
Yes
No N
o
Yes
NoYes
No
Yes
X4<0.052
X1>=-0.93
X19<0.01
X1>=-0.8
X1<0.59
X27<1.8
X10<0.36 X1<0.19
X27<4.4
X10<0.27
X15>=-0.48 X6<0.39
IslandingNon-IslandingIslandingNon-Islanding Non-Islanding Non-Islanding
Islanding
Islanding
Islanding
Islanding Islanding
Islanding
Islanding
Islanding
Islanding
20/02/2015 NWET-2015, Silicon Institute of Technology,
Bhubaneswar 56

Performance Indices
Dependability: Total number of islanding cases predicted / Total number of actual islanding events. Security: Total number of non-islanding cases predicted / Total number of actual non-islanding cases. Accuracy: Total number of correctly predicted (islanding + non-islanding) cases/ Total numbers of actual (islanding + non-islanding) cases.
20/02/2015 NWET-2015, Silicon Institute of Technology,
Bhubaneswar 57

Performance comparison between proposed anti-islanding relays and ROCOF (with threshold of 0.1 Hz/s, 0.25 Hz/s) relay during active power mismatch for Synchronous DG.
Dependability Comparisons between Proposed and Conventional Relays
Performance comparison between proposed anti-islanding relays and ROCOV (with threshold of 0.1pu/s, 0.07 pu/s) relay for reactive power mismatch for Synchronous DG.
0 10 20 30 40 50 60 70 80 90 100 110
0
20
40
60
80
100
120
140
Active power mismatch%
De
pe
nd
ab
ility
%
DT based relay
ROCOF (Synchronous DG, Th=0.25 Hz/s)
ROCOF (Synchronous DG, Th=0.1 Hz/s)
0 10 20 30 40 50 60 70 80 90 100 110
0
20
40
60
80
100
120
140
Reactive power mismatch (%)
De
pe
nd
ab
ility
(%
)
DT based relay
ROCOV (Synchronous DG, Th=0.1 pu/s)
ROCOV (Synchronous DG, Th=0.07 pu/s)
20/02/2015 NWET-2015, Silicon Institute of Technology,
Bhubaneswar 58

Dependability Comparisons between Proposed and Conventional Relays
Performance comparison between proposed relay and ROCOF (with threshold of 0.1 Hz/s, 0.25 Hz/s) relay during active power mismatch for Inverter based DG.
Performance comparison between proposed relay and ROCOV (with threshold of 0.1 pu/s, 0.07 pu/s) relay during active power mismatch for Inverter based DG.
0 10 20 30 40 50 60 70 80 90 100 110
0
50
100
150
Active power mismatch (%)
De
pe
nd
ab
ility
(%
)
DT based relay
ROCOF (Inverter based DG, Th=0.1 Hz/s)
ROCOF (Inverter based DG, Th=0.25 Hz/s)
0 10 20 30 40 50 60 70 80 90 100 110
0
20
40
60
80
100
120
140
Rective power mismatch (%)
De
pe
nd
ab
ility
(%
)
DT based relay
ROCOV (Inverter based DG, Th= 0.07 pu/s)
ROCOV (Inverter based DG, Th= 0.1 pu/s)
20/02/2015 NWET-2015, Silicon Institute of Technology,
Bhubaneswar 59

Relays (Synchronous DG)
Dependability (%)
Security (%)
Accuracy (%)
DT 100 100 100 ROCOF(0.1 Hz/s) 35.90 100 67.95
ROCOF(0.25 Hz/s) 0 100 50 ROCOF(0.5 Hz/s) 0 100 50
Performance comparison between the proposed anti-islanding relays and conventional relay for 0-30 % active power mismatch
Results and Discussions
Relays (Inverter based DG)
Dependability (%)
Security (%)
Accuracy (%)
DT 100 98.34 99.18 ROCOF(0.1 Hz/s) 43.59 100 71.80
ROCOF(0.25 Hz/s) 0 100 50 ROCOF(0.5 Hz/s) 0 100 50
(Inverter based DG)
(Synchronous DG)
20/02/2015 NWET-2015, Silicon Institute of Technology,
Bhubaneswar 60

Relays (Synchronous DG)
Dependability (%) Security (%) Accuracy (%)
DT 100 98 99 ROCOV(0.1 V/s) 0 100 50
ROCOV(0.07 V/s) 62.50 100 81.25
Results and Discussions
Relays (Inverter based DG)
Dependability (%)
Security (%)
Accuracy (%)
DT 100 99 99.50 ROCOV(0.1 V/s) 0 100 50
ROCOV(0.07 V/s) 47.86 100 73.93
Performance comparison between the proposed anti-islanding relays and conventional relay for 0-30 % Reactive power mismatch
(Synchronous DG)
(Inverter based DG)
20/02/2015 NWET-2015, Silicon Institute of Technology,
Bhubaneswar 61
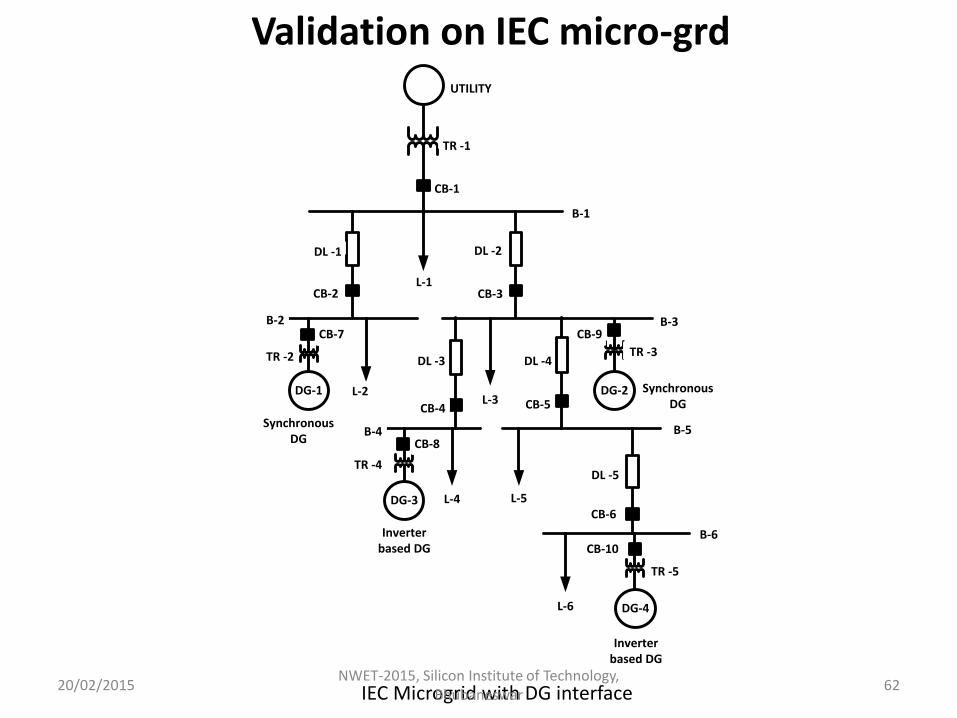
IEC Microgrid with DG interface
Validation on IEC micro-grd
TR -1
CB-1
L-2
L-4
L-6
L-5
B-1
CB-2 CB-3
CB-4 CB-5
CB-6
UTILITY
TR -5
TR -2
Synchronous DG
TR -4
Inverter based DG
B-2 B-3
B-4 B-5
B-6
DL -1
DL -4
DL -2
DL -3
DL -5
L-3
DG-4
DG-2DG-1
DG-3
TR -3
Inverter based DG
Synchronous DG
L-1
CB-7
CB-8
CB-10
CB-9
20/02/2015 NWET-2015, Silicon Institute of Technology,
Bhubaneswar 62

Parameters of the IEC Microgrid model
Proposed Scheme Validation
Transformer Voltage Capacity TR1 120kV-25kV 20 MVA
TR2, TR3 2.4kV-25kV 5 MVA TR4, TR5 575V-25kV 4 MVA
DG1, DG2 (Synchronous DG) 2.4 kV 4 MW DG3, DG4 (Inverter based DG) 575V 3 MW Load L1 L2 L3 L4 L5 L6
P(MW) 1.5 1.5 1.0 1.5 0.5 1.0 Q(MVAR) 0.6 0.3 0.2 0.6 0.1 0.3
Distribution Lines Line Paramètres DL1, DL2,DL3,DL4
DL5 R0 = 0.1153 ohms/km, R1 = 0.413 ohms/km, L0 = 1.05e-3 H/km, L1 = 3.32e-3 H/km, C0 = 11.33e-009 F/km, C1 = 5.01e-009 F/km, 20 km each.
DT Dependability (%) Security (%) Accuracy (%) Relay (Synchronous DG) 98.07 97.14 97.54
Relay (Inverter based DG) 100 97.2 98.3
Performance Test Results of the proposed anti-islanding relays in IEC microgrid
20/02/2015 NWET-2015, Silicon Institute of Technology,
Bhubaneswar 63

Conclusions
•It results a generalized relaying scheme for both synchronous and
inverter based DGs.
•Proposed data-mining based relays has dependability close to 100
%, and speed accuracy of 1 and ½ cycles.
•The proposed relay has negligible NDZ as its % dependability is
almost 100 in low active and reactive power mismatch (below 30
%), where exiting ROCOV and ROCOF fails.
•Robustness of the proposed technique for anti-islanding
protection is validated with standard IEC 61850-7-420 microgrid
•As DT is transparent and it can be implemented based on the set
thresholds of the decision variables. 20/02/2015
NWET-2015, Silicon Institute of Technology, Bhubaneswar
64
Data-mining based intelligent Differential Fault Protection Relay
20/02/2015 NWET-2015, Silicon Institute of Technology,
Bhubaneswar 65

Proposed Protection Scheme for Micro-grid
Key points of the proposed work •It uses multiple parameter •It uses differential protection •The relay work properly in grid connected as well as islanded mode. •The relay work properly in all possible network topology (radial and loop topology). 20/02/2015
NWET-2015, Silicon Institute of Technology, Bhubaneswar
66

System Studied
DG1 & DG2(Synchronous)
DG3 (DFIG)
DG4 (Inverter based)
MVA 9 MVA 9 MVA 6 MVA
Load L1 L2 L3 L4 L5 L6
P(MW) 4.8 5.0 3.5 4.8 4.5 4.4
Q(MVAR) 2.6 2 1.5 3 2.7 2.5
IEC Microgrid with DG interface.
System parameters
20/02/2015 NWET-2015, Silicon Institute of Technology,
Bhubaneswar 67

Features Extraction
7 differential features are derived as follows:
Xi= Xi,S - Xi,T
Where Xi is the differential feature, Xi,S is the ith feature estimated at bus S,
Xi,T is the ith feature estimated at bus T and S,T are the buses at end of the
target feeder.
X1= ∆( df/dt), the differential rate-of-change of frequency (Hz/s).
X2= ∆(dV/dt), the differential rate-of-change of voltage (pu/s).
X3=∆(dPhi/dt), the differential rate of change of power angle difference.
X4=∆(dP/dt), the differential active power output change with time (pu/s).
X5= ∆(dQ/dt), the differential reactive power output change with time (pu/s).
X6=∆(dVneg/dt), the differential rate of change negative sequence Voltage.
X7=∆(dIneg/dt), the differential rate of change negative sequence current. 20/02/2015
NWET-2015, Silicon Institute of Technology, Bhubaneswar
68

Fault Events Generation and Data Mining
Fault cases include :1020 Faults on different distribution line (DL1,DL2,DL3,DL4,DL5). Faults at different location of distribution line (10% - 90%). Variations in fault resistance varies Rf= 0.01 to 100 ohm. Types of shunt faults (LG,LLG,LL,LLL). Different operating modes : Grid-connected and Islanded) Topology of the network: Radial and Mesh. Variations in system loads. Faults with some DGs are out (e.g. DG1 out). Faults with some sections are out (e.g. DL3 is out and fault occurs at DL5).
No Fault cases include :415 Capacitor switching at PCC and load buses. Sudden load change at PCC and load buses (20 % overloading) Section cut-off (e.g. DL4 is isolated and micro-grid operating normally by
connecting through CB_LOOP1 and CB_LOOP2) DG outage (DG3 is out but no fault in any section of micro-grid )
Sample Operating conditions for Fault and No-Fault situation
20/02/2015 NWET-2015, Silicon Institute of Technology,
Bhubaneswar 69

DT Generated for Fault Detection
DT generated during training with 80% of the total data (1148)
Testing is done with rest unseen 20% (287) data of the total generated data set
Features participating in original decision making are X1= ∆( df/dt), X2=∆(dV/dt), X3=∆(dPhi/dt), and X5= ∆(dQ/dt), keeping other features redundant (X4, X6 and X7)
Confusion matrix (testing)
Fault No-Fault
Fault 221 1
No-Fault 1 74
Classification Accuracy = 99.11%
20/02/2015 NWET-2015, Silicon Institute of Technology,
Bhubaneswar 70

Performance Analysis
Events Grid Connected
Islanded
Fault 510 510
No-Fault 170 155
Events Radial Mesh
Fault 450 450
No-Fault 140 125
Performance of DT for fault detection in grid connected and islanded mode
Performance of DT for fault detection in radial distribution network and loop network
Number of events considered Number of events considered
Dependability Security Accuracy97
97.5
98
98.5
99
99.5
100
100.5
Perc
enta
ge
Grid connected mode
Islanded mode99.8%99.6%
98.24%
99.02%
99.475%99.35%
Dependability Security Accuracy97
97.5
98
98.5
99
99.5
100
Perc
enta
ge
Radial topology
Mesh topology
99.67%
98.49%
98.89%
99.2%99.08% 99.045%
20/02/2015 NWET-2015, Silicon Institute of Technology,
Bhubaneswar 71

Performance Comparisons with Over Current and Current Differential Scheme
Dependability (%) Grid connected Islanded
Proposed intelligent differential relay 99.8% 99.6%
Over current relay 79.63% 23.89%
Current differential relay 84.26% 93.5%
Dependability (%) Radial network Loop network
Proposed intelligent differential relay 99.67% 98.89%
Over current relay 60.42% 40.44%
Current differential relay 86.81% 91.67%
Dependability of proposed relay, over current relay and current differential relay (grid connected and islanded mode)
Dependability of proposed relay, over current relay and current differential relay (radial and loop distribution network)
20/02/2015 NWET-2015, Silicon Institute of Technology,
Bhubaneswar 72

Discussion
Fault conditions
Over current relay Grid connected mode Islanded mode
Relay at End-1
Relay at End-2
Relay at End-1
Relay at End-2
a-g fault on DL1 (radial) R1 Operates R2 Operates R1 Fails
R2 Operates
abc-g fault on DL2 (radial) R3 Operates R4 Operates R3 Fails
R4 Operates
ab fault on DL3 (mesh) R5 Operates R6 Operates R5 Operates R6 Operates
Current Differential current relay a-g fault on DL1 (radial) R1 Operates R2 Operates R1 Operates R2 Operate
abc-g fault on DL2 (radial) R3 Operates R4 Operates R3 Operates R4 Operates ab fault on DL3 (mesh) R5
Fails R6
Fails R5
Fails R6
Fails Proposed Data-Ming based Differential relay
a-g fault on DL1 (radial) R1 Operates R2 Operates R1 Operates R2 Operates abc-g fault on DL2 (radial) R3 Operates R4 Operates R3 Operates R4 Operates
ab fault on DL3 (mesh)
R5 Operates R6 Operates R5 Operates R6 Operates
Performance Assessment of the proposed DT based relay with the existing Over-current and Current-Differential Relay
20/02/2015 NWET-2015, Silicon Institute of Technology,
Bhubaneswar 73

Conclusions
The proposed differential protection scheme is more efficient
than existing over current and current differential scheme.
The proposed differential protection scheme for fault detection
is highly effective (accuracy more than 99%) in detecting faults
at different operating mode of micro-grid.
The proposed differential protection scheme for fault detection
is highly effective (accuracy more than 98%) in detecting faults
at different network topology.
Speed accuracy of the proposed technique is 1 and 1/2 cycles .
20/02/2015 NWET-2015, Silicon Institute of Technology,
Bhubaneswar 74

A person who never made a mistake never tried anything new.
20/02/2015 NWET-2015, Silicon Institute of Technology,
Bhubaneswar 75
Albert Einstein

THANK YOU
20/02/2015 NWET-2015, Silicon Institute of Technology,
Bhubaneswar 76