Intellectual Property Rights and Access to Innovation ... · Intellectual Property Rights and...
56
Intellectual Property Rights and Access to Innovation: Evidence from TRIPS * Margaret Kyle † and Yi Qian ‡ December 14, 2017 Abstract We examine the effect of pharmaceutical patent protection on the speed of drug launch, price, and quantity in 60 countries from 2000-2013. The World Trade Organization required its member countries to implement a minimum level of patent protection within a specified time period as part of the TRIPS Agreement. However, members retained the right to impose price controls and to issue compulsory licenses under certain conditions. These countervailing policies were intended to reduce the potential static losses that result from reduced competition during the patent term. Using detailed patent data at both the product and country levels, we exploit the fact that selection into “treatment” with a post-TRIPS patent is exogenously determined by compliance deadlines that vary across countries. We find that patents have important consequences for access to new drugs: in the absence of a patent, launch is unlikely. That is, even when no patent barrier exists, generic entry may not occur. Conditional on launch, patented drugs have higher prices but higher sales as well. The price premium associated with patents is smaller in poorer countries. Price discrimination across countries has increased for drugs patented post-TRIPS and prices are negatively related to the burden of disease, suggesting that countervailing policies to offset expected price increases may have had the intended effects. * We thank Tahir Amin, Pierre Azoulay, Iain Cockburn, Carsten Fink, Craig Garthwaite, Zorina Khan, Intan Hamdan-Livramento, Petra Moser, Bhaven Sampat, Mark Schankerman, Ted Sichelman, Tavneet Suri, and seminar participants at the ASSA meetings, CERGE-EI, Copenhagen Business School, CPIP Thomas Edison meetings, DIW Berlin, Duke, KU Leuven, Mannheim, MINES ParisTech, Northwestern, and the NBER Summer Institute, Peking University, Queens University, Tsinghua University, the University of Hong Kong, and WIPO for useful comments and suggestions. Intan Hamdan-Livramento, Sumner LaCroix, and Walter Park generously shared their datasets on IPRs at the country level. Kyle thanks Pfizer for access to the IMS data used. The views expressed in this paper are entirely those of the authors, and we are responsible for all errors. † MINES ParisTech (CERNA), PSL Research University and CEPR ([email protected] ) ‡ Sauder School of Business at University of British Columbia and NBER ([email protected]) 1
Transcript of Intellectual Property Rights and Access to Innovation ... · Intellectual Property Rights and...

Intellectual Property Rights and Access to Innovation: Evidence
from TRIPS∗
Margaret Kyle†and Yi Qian‡
December 14, 2017
Abstract
We examine the effect of pharmaceutical patent protection on the speed of drug launch,
price, and quantity in 60 countries from 2000-2013. The World Trade Organization required
its member countries to implement a minimum level of patent protection within a specified
time period as part of the TRIPS Agreement. However, members retained the right to impose
price controls and to issue compulsory licenses under certain conditions. These countervailing
policies were intended to reduce the potential static losses that result from reduced competition
during the patent term. Using detailed patent data at both the product and country levels,
we exploit the fact that selection into “treatment” with a post-TRIPS patent is exogenously
determined by compliance deadlines that vary across countries. We find that patents have
important consequences for access to new drugs: in the absence of a patent, launch is unlikely.
That is, even when no patent barrier exists, generic entry may not occur. Conditional on launch,
patented drugs have higher prices but higher sales as well. The price premium associated with
patents is smaller in poorer countries. Price discrimination across countries has increased for
drugs patented post-TRIPS and prices are negatively related to the burden of disease, suggesting
that countervailing policies to offset expected price increases may have had the intended effects.
∗We thank Tahir Amin, Pierre Azoulay, Iain Cockburn, Carsten Fink, Craig Garthwaite, Zorina Khan, IntanHamdan-Livramento, Petra Moser, Bhaven Sampat, Mark Schankerman, Ted Sichelman, Tavneet Suri, and seminarparticipants at the ASSA meetings, CERGE-EI, Copenhagen Business School, CPIP Thomas Edison meetings, DIWBerlin, Duke, KU Leuven, Mannheim, MINES ParisTech, Northwestern, and the NBER Summer Institute, PekingUniversity, Queens University, Tsinghua University, the University of Hong Kong, and WIPO for useful commentsand suggestions. Intan Hamdan-Livramento, Sumner LaCroix, and Walter Park generously shared their datasets onIPRs at the country level. Kyle thanks Pfizer for access to the IMS data used. The views expressed in this paper areentirely those of the authors, and we are responsible for all errors.†MINES ParisTech (CERNA), PSL Research University and CEPR ([email protected] )‡Sauder School of Business at University of British Columbia and NBER ([email protected])
1

1 Introduction
Intellectual property rights (IPRs) attempt to balance static and dynamic efficiency. By allowing
innovators to block competition and therefore appropriate a greater share of the value of their ideas,
IPRs can create incentives for investment in research and development (R&D). However, IPRs can
also lead to static inefficiencies in the form of monopoly prices. This tradeoff is especially acute in
the case of pharmaceuticals for developing countries. Incentives for drug development are critical,
since many diseases prevalent in developing countries lack appropriate treatments, but the prices
of innovative drugs in the absence of generic competition make them unaffordable to most people
there. The effects of IPRs on access and affordability are important for researchers, policymakers,
and firms.
IPRs have expanded considerably in recent years as a consequence of the 1994 Trade-Related
Intellectual Property Rights Agreement (TRIPS), negotiated at the end of the Uruguay Round of
the General Agreement on Tariffs and Trade (GATT). TRIPS requires members of the World Trade
Organization (WTO) to implement minimum standards for intellectual property (IP) protection.
For most developing countries, complying with TRIPS involved substantial changes to their IPR
policies, especially for pharmaceuticals. Supporters of TRIPS asserted that IPRs should benefit
developing countries in several ways. First, IPRs create incentives for innovation and technology
transfer that can benefit both rich and poor countries. Second, IPRs can promote domestic in-
novation in developing countries. And third, IPRs may increase the availability of new drugs, if
innovative pharmaceutical companies find markets with IPRs more attractive for launch. The Office
of the Trade Representative of the United States explicitly states that “Stronger patent and data
protection increases the willingness of companies to release innovative drugs in free trade partners’
markets, potentially increasing, rather than decreasing, the availability of medicines.”1 However,
developing and least-developed countries have argued that patents reduce access to new drugs, since
IPRs grant monopolistic positions to pharmaceutical companies and allow them to charge higher
prices. HIV treatments are the most prominent example: competition from generic firms for the
supply of antiretroviral drugs in developing countries has been credited with substantial reductions
in price (Waning et al. (2010)).
If IPRs make a market more attractive to innovators, either through increased pricing power
or because they do not share the market with imitators, then we should observe an increase in
product launches by innovator firms following a country’s introduction of patents. In the presence
of competitors, firms may fear creating spillover benefits for their rivals; a monopoly position
would therefore increase investment in country-specific marketing and distribution channels. These
investments may have implications for all products the firm sells within a country, regardless of
their individual patent protection status. However, we should observe an effect on pricing only for
1http://www.ustr.gov/about-us/press-office/fact-sheets/archives/2004/july/us-morocco-free-trade-agreement-access-medicine
2

those drugs eligible for patent protection in the country. Higher prices would also be expected to
reduce quantities sold.
We evaluate the effect of patent protection on three measures of access (new drug launches,
prices and sales) across 60 countries of varying levels of development. We explain why patent
protection may shift the equilibrium speed of launch, price and quantity. We then empirically
examine these outcomes using data that allows us to compare patent protection in countries of
different income levels.
Our key contribution is the combination of the TRIPS “experiment” with detailed informa-
tion on each product’s patent status within a large set of countries to isolate the effect of patent
protection. Most previous work on IPRs and pharmaceutical access has examined country-level
patent policies, which are likely to be endogenous. Developing countries were required by TRIPS
to implement a minimum level of patent protection within a specified time period, and we argue
that this requirement creates a natural experiment. Importantly, the changes to patent policies
required by TRIPS did not affect all products within a country at the same time or in the same
way. Selection into patent treatment is exogenous at the product level, for reasons we explain in
detail below. Essentially, we can compare the same drug with and without patent protection across
countries, as well as groups of drugs with and without patents within the same country, controlling
for unobservable drug- and country-specific characteristics.
Our results suggest that the consequences of TRIPS-required patents on access have not been
as negative as predicted by many in the global health community. Patents are generally associated
with earlier launch of new products and higher sales. The effect of a patent on an innovator’s
launch incentive appears to be greater than the effect of removing this barrier to entry for generics,
on average. This finding suggests the existence of other important barriers, some of which may be
directly linked to regulatory policies. Surprisingly, we find a decrease in the price premium enjoyed
by drugs with patents in the post-TRIPS era, although patented drugs are nevertheless still more
expensive. Countervailing policies such as price controls or the threat of compulsory licensing may
be responsible, either directly or indirectly by inducing different pricing behavior from originators.
We summarize related literature in the next section, with a discussion of important institutional
details and existing theory to motivate our empirical study. Section 3 explains our empirical model,
and Section 4 describes the data. Results are presented in Section 5, and we conclude in Section 6.
2 Background and literature
2.1 The impact of IPRs
IPRs potentially have both static and dynamic effects. Standard theory models predict negative
static effects, as patents allow inventors to block imitation. This monopoly position usually leads
to higher prices and lower consumption. However, these static losses can be offset by increased
3

incentives for inventors, leading to higher rates of innovation in the long run. There are some
notable exceptions to these predictions, including Boldrin & Levine (2002) and others who are
critical of IPRs as a mechanism to induce innovation. We focus here on the empirical evidence,
and specifically the pharmaceutical sector.
A number of papers have examined the effect of IPRs on pharmaceutical innovation, an industry
setting in which patents are especially important (Cohen et al. (2000)). In a study of 26 countries,
Qian (2007) suggested that IP implementation increased domestic innovation only if accompanied
by high levels of development, educational attainment, and economic freedom. Arora et al. (2008)
found that patent applications associated with process innovations increased in India after its
compliance with TRIPS in 2005. Lanjouw & Cockburn (2001) investigated the impact of TRIPS
on pharmaceutical innovations for diseases most prevalent in developing countries, but concluded
that too little time had elapsed by the time of their study to observe large changes. Ten years later,
Kyle & McGahan (2012) examined whether TRIPS compliance stimulated R&D activities for new
drugs across the world. They found that TRIPS has strengthened research on global diseases that
affect both high-income as well as developing countries, but it has not increased R&D activities for
diseases that almost exclusively affect low-income countries.2
Other papers have focused on how IPRs have affected access to new treatments. The most im-
portant study in this area is Chaudhuri et al. (2006), who focused on a single category of antibiotics
in India prior to the introduction of pharmaceutical product patents. Using counterfactual wel-
fare calculations derived from structural estimation, they concluded that the introduction of IPRs
would reduce social welfare, because of the increase in price a reduction in generic competition
would cause both for new treatments and their older substitutes. In addition, domestic producers
had an advantage in distribution, so that total consumption would fall substantially if the sole
supplier was a foreign innovator firm. Given the importance of Indian generic firms in supplying
low-cost treatments for HIV in developing countries (Waning et al. (2010)), the Chaudhuri et al.
(2006) results have important implications for other countries as well. However, Duggan et al.
(2014) find that product patents in India are not associated with large price increases between
2005 and 2008. In studies covering a large number of developed as well as developing countries,
Lanjouw (2005) and Cockburn et al. (2014) found that stronger patent protection increased the
speed of new drug launches in rich countries, but the effect in lower income countries was ambigu-
ous. Borrell (2005), examining HIV treatments, found that patents were associated with faster
launch in developing countries with relatively low levels of income inequality.
2There are also studies on related topics of technology transfer and trade as impacted by IPR. For exam-ple,Branstetter et al. (2006) find that multinational corporations transfer more technology to developing countriesafter their compliance with TRIPS, and Maskus & Penubartib (1995) indicate that increasing patent protection hasa positive impact on bilateral manufacturing imports into both small and large developing economies.
4

2.2 The TRIPS Agreement
The TRIPS Agreement specifies the minimum levels and enforcement of IPRs, including patents,
trademarks and copyright, that are a condition of membership in the World Trade Organization
(WTO). TRIPS compliance requires patent terms of at least 20 years for products and processes.
Two features of TRIPS are of particular importance here.
First, the introduction of product patents for pharmaceuticals was a major change for many
countries. Product patents on pharmaceuticals allow the originator to protect the active chemical
ingredient in a drug. This is considered the strongest form of protection, because no other firm
can produce or import that chemical during the period of patent protection. LaCroix & Liu (2008)
note that in 1960, very few countries allowed pharmaceutical product patents, but more than 95%
did so by 2005; TRIPS is responsible for much of this shift.
Second, the WTO established a process of dispute resolution between member states. If a
country fails to comply with TRIPS, other member states may use this process to impose trade
penalties on the offending country. To the extent that this gave patentholders (or at least their
representatives in the governments of member states) greater enforcement power, we would expect
TRIPS to strengthen patent protection in practice, even in the absence of a legislative change to
patent law.
Developing and least-developed countries generally objected to some terms of TRIPS, and
specifically to pharmaceutical product patents. To alleviate their concerns, poorer countries were
permitted a transition period to comply with TRIPS. While developed countries had one year
after joining the WTO to conform, most developing countries were required to implement TRIPS
by 2000, and least-developed countries (LDCs) by 2006. However, countries that did not grant
patents in a particular technology area in 1995 were given 10 years to comply. India, for instance,
had until 2005 to introduce pharmaceutical product patents. The transition period for LDCs was
later extended to 2016 for pharmaceutical product patents. Further details are provided in Section
4.3.
Several other exemptions that weaken the strength of pharmaceutical patents were included in
TRIPS to accommodate the concerns of developing countries as well as developed countries.3 The
2002 Doha Declaration first outlined the conditions under which countries may issue compulsory
licenses; these conditions include limiting the use of the licensed product to the domestic market,
restricting the use of compulsory licenses to cases of national health emergencies and providing
“reasonable” compensation to the patent holder. Since many countries lack domestic manufacturing
capacity and were therefore unable to use compulsory licenses, they negotiated the ability to import
compulsory-licensed products from foreign markets (parallel imports) in 2003. Several countries
have issued compulsory licenses, mainly for HIV treatments, although Thailand and India have also
3For example, the patent law of many developed countries includes a “Bolar provision,” which permits researchusing a patented pharmaceutical during the term of patent protection if the purpose of the research is compliancewith regulatory requirements for market approval.
5

done so for other diseases such as hypertension and cancer. Several developed countries, including
the United States, threatened compulsory licensing during public health scares such as flu outbreaks
(Beall & Kuhn (2012)).
Both developed and developing countries may impose price controls on pharmaceuticals under
the TRIPS Agreement (discussed below). The combination of price controls and compulsory li-
censing, or the merely the threat of using either, may serve as an important check on the market
power granted by pharmaceutical patents. These countervailing policies, which are challenging to
account for in an empirical model, are critical for interpreting our results.
2.3 Pharmaceutical regulation
The pharmaceutical sector is highly regulated. Most countries require proof of safety and efficacy
before permitting a drug to be sold, and many also regulate the prices that firms can charge for
pharmaceuticals; see Scott Morton & Kyle (2012) for an overview. Across developed and developing
countries, there is variation in the regulation of market entry and in the use of price controls. Price
controls may offset the expected effects of IPRs, since patent holders may be forced to charge lower
prices (thus reducing the incentives for innovation) and access may be higher as a result (thus
reducing the static inefficiencies associated with patents).
Danzon et al. (2005), Kyle (2006), Kyle (2007) and Cockburn et al. (2014) all examine the
relationship between price controls and the speed of access to new drugs. If country markets were
completely independent and firms faced no capital constraints in product launch, we would expect
firms to launch a new drug in all markets immediately, especially considering the limited term of
patent protection (if applicable). In general, marginal costs of production are fairly low relative
to the fixed cost of developing a drug, at least for small molecule drugs. So long as a firm can
cover the marginal cost of producing the drug, the firm should be willing to sell. However, all these
papers find that the reality is more complicated.
First, firms must incur country-specific entry costs. In countries such as the US and EU member
states, the first firm to introduce a new chemical or biological entity must document the drug’s
safety and efficacy through clinical trial evidence. Most developing countries have regulatory agen-
cies charged with granting marketing authorizations, though some allow firms to rely on dossiers
provided to other countries. The process of price negotiation with particular governments can be
time-consuming, generating further launch delays. This is a purely bureaucratic delay, although it
may be increasing in regulators’ preferences for low prices.
In addition, country markets are not truly independent. Many governments use “external
reference pricing” when setting the local price, meaning that they base the local price on that
observed in other countries. Thus, launching a new drug at a very low price in one country can
reduce the price the firm receives in other countries, if initial low price is referenced. Country
markets can also be linked through parallel trade, which is legal between European Union member
6

states and has been considered by the US. Parallel trade amounts to arbitrage of price differences
between countries, which again means that launch in a low-price market is less attractive than
would be the case with independent country markets. The general finding from the literature cited
above is that price controls are associated with launch delays. Whether the cost-savings generated
by the use of price controls outweigh the delay in access is unresolved, as is the effect on dynamic
incentives for investment in innovation.
With patent protection, the innovator may block entry by generic firms. Without patent pro-
tection, both innovators and generic firms are eligible to launch a new drug. Their incentives to
do so depend on other policies, in particular regarding data exclusivity and the requirements for
subsequent entrants. For example, many countries (including the US and EU member states) allow
generic firms seeking regulatory approval to rely on the clinical data provided by the first entrant.
They need only demonstrate that their product is bioequivalent to that of the first entrant’s. The
difference in regulatory treatment of first entrants and followers is considered vital for assuring
generic competition, since it drastically lowers the entry costs for the latter.4 However, the first
entrant may be granted a period of data exclusivity over its clinical trial evidence, during which
time generic firms must either independently provide similar evidence to the regulator or wait for
its expiration. Even in the absence of a patent, therefore, potential entrants may not launch due
to the high costs of acquiring clinical data for regulatory approval.
2.4 Summary of theoretical predictions
We assume firms (either innovators or generic producers) launch products when they expect positive
expected profits. If subsequent entrants can rely on the clinical trial evidence of the first entrant
and there is no period of data exclusivity, the first entrant may not be able to recoup the fixed costs
of launch. With a period of data exclusivity, both the innovator and generic firms may be willing
to launch. If it has already conducted clinical trials for regulatory approval in other countries, the
innovator may have a cost advantage in doing so. With patent protection and no data exclusivity,
then only the innovator has the right to launch the product. The innovator may choose not to
launch because of the regulatory spillovers discussed above, or because the fixed costs of launch
exceed the expected revenues.
In the absence of price regulation, the theoretical effect of IPRs on price, conditional on launch,
is fairly clear: the price with IPRs should be at least as high as that without IPRs.5 With price
regulation, the theoretical effect is less obvious, and depends on regulators’ willingness to reward
innovators, attract entry, control expenditures, etc.
In the case of total quantity sold (conditional on launch and price), the expected effect of
4The 1984 Hatch-Waxman Act established the regulatory pathway for generic approval, after which generic entryincreased substantially.
5An exception might occur if firms use price to signal quality when there are multiple producers of the same drugand no reliable government certification of quality.
7

IPRs depends on the importance of country and product specific investments. Examples of such
investments include educating medical professionals about the existence, use and benefits of a new
drug; establishing distribution networks; ensuring the provision of complements such as diagnostics,
etc. If competitors can free-ride on those investments, then generic competition in the absence of
IPRs might result in lower levels of investment and lower quantities sold. On the other hand,
generic firms may sell a larger portfolio of products than innovator firms and therefore have greater
incentive to invest in distribution. In this case, removing generic firms from the market may reduce
quantity sold via inferior distribution.
To summarize, the theoretical impact of IPRs on launch, price and quantity is ambiguous.
Under regulatory conditions that require firms to provide clinical evidence of safety and efficacy
(information that is a public good), IPRs are likely to result in faster launch. In markets with free
pricing, IPRs are likely to result in higher prices; in markets with price controls, the effect may
depend on relative bargaining power. For products that require substantial country-level investment
in education and infrastructure, IPRs may encourage such investments and lead to higher quantities
sold. Chaudhuri et al. (2006) suggest instead that generic producers have superior distribution,
so that IPRs that block them from the market yield reduced quantities. Conditions may vary
substantially across countries and products, so effects may be heterogeneous.
3 Empirical model
In this section, we describe our estimation methods for evaluating the effects of IPRs on the time
to launch, price and quantity sold. We use data at the country-molecule-quarter level, which allows
us to control for molecule and country effects and to use within-molecule, between-country and/or
within-country, between-molecule comparisons in evaluating the effects of IPRs.
3.1 Endogeneity of patent protection
IPRs exist at the country level, and change for a subset of countries as a result of the TRIPS
Agreement. One estimation of the effect of IPRs is a comparison of the overall launch speed,
price level and quantity sold within countries following the introduction of IPRs, compared with
those that did not. If adoption of IPRs is driven by time-varying unobservables, however, this
difference-in-difference will yield biased results.
One could argue that the TRIPS-required changes to IPR policies in developing countries were
exogenous, as developing countries generally opposed them (Hamdan-Livramento (2009), LaCroix
& Liu (2008)). As discussed above, the timing of these changes was not random, but rather varied
by level of income. At the time of the WTO’s establishment, member countries that declared
themselves as “developed” had one year to bring their IPRs up to the minimum standards specified
by TRIPS. Developed countries that joined after 1995 were required to be compliant at the date
8

their WTO membership began. Original WTO members that declared themselves as “developing”
were permitted a transition period for TRIPS implementation, with a deadline of 2000. A longer
transition period, until 2005, was permitted for countries that did not grant pharmaceutical product
patents, such as India. These countries were required to provide a “mailbox provision” until then,
i.e. accept patent applications even while deferring decisions until 2005, and to grant applicants
five years of marketing exclusivity during the transition period. 6 Least- developed countries,
designated as such by the United Nations, had the longest transition period: initially the deadline
was January 1, 2006, and this was extended to 2016 as a result of the Doha round of negotiations in
2002. Some countries complied well before their deadlines, while others took maximum advantage
of extensions. An instrument for the year of actual compliance is the year by which a country
was required to implement TRIPS under WTO rules. One possible instrument for IPRs at the
country-year level is the WTO’s deadline for TRIPS compliance. However, it is correlated with the
level of development, and has only cross-country variation. Commonly used instrumental variables
for a country’s IPR policy, such as legal origin and ethno-linguistic fractionalization, have similar
limitations.
We adopt an approach that exploits our country-molecule-quarter level information on patents.
Novelty is a criterion for patents, so products already brought to market do not qualify for patents
since they are no longer “new” from the perspective of a patent examiner; usually, the key invention
behind these products occurred many years ago, followed by lengthy clinical trials to establish safety
and efficacy. Following changes to patent law in accordance with TRIPS, only a subset of products
within a country qualifies for strengthened patent protection and any associated pricing power.
This is the “experiment” that we use, and it requires a detailed explanation.
When an innovator discovers a drug candidate, it files for patent protection as soon as it has
sufficient evidence to show that it has met key criteria concerning utility, usefulness and nonob-
viousness. Because of the lengthy clinical development required for drugs, this first application is
typically 8-10 years prior to product launch, and establishes a priority date for patent examination.
This priority date is the cutoff for establishing novelty in a patent application.7 If this date falls af-
ter the country’s TRIPS compliance, the application and patent grant are treated with post-TRIPS
patent law. A priority date prior to TRIPS compliance means that the pre-TRIPS legal regime
applies. The innovator must subsequently apply for patent protection in other countries within a
short window of time. Specifically, the innovator has 12 months from the initial priority date to
file applications, or 30 months for countries that are signatories to the Patent Cooperation Treaty.
Applications filed within that window are evaluated based on the prior art that existed as of the
priority date, so applications with priority dates that fall just before a country’s TRIPS compliance
deadline also qualify for post-TRIPS patents since the innovator can wait to file until the country’s
6The US challenged India’s compliance with these terms in a WTO trade dispute.7Prior to the change from first-to-invent to first-to-file required by the 2011 America Invents Act, the US used the
invention date as critical date for prior art. This small difference is not important for our empirical analysis.
9

laws are fully compliant. Delaying the application beyond this window would result in rejection by
patent examiners, because the application would no longer meet the requirement of novelty.
Within a country, therefore, we can compare a set of pre-TRIPS treated products with a post-
TRIPS set. We argue that this subset of post-TRIPS treated products is exogenously determined.
The research process yields drug candidates that arrive randomly around a country’s TRIPS com-
pliance date, and the country would have limited scope for manipulating that compliance date in
response to a specific application that might reach the market with only a small probability (given
the high failure rates in drug development) many years off. Similarly, within a molecule, the coun-
tries in which a drug qualifies for a patent is exogenously determined by the date its priority patent
application was filed. This is illustrated in the figure below for a hypothetical patent application for
a single product in two countries with different compliance deadlines. This hypothetical product
would be in the post-TRIPS treated group in country A, but pre-TRIPS in country B.
Country A
Priority
established
TRIPS
compliance
TRIPS-30 months
Country B
TRIPS
compliance
TRIPS-30 months
For our empirical analysis, we define a “Post-TRIPS treated” group of products within a country,
composed of molecules whose patent priority dates allows them to apply for a patent under a TRIPS-
compliant legal regime in a country. Within each country, we can compare treated and untreated
subsets. Within each drug, we can compare outcomes with and without patent treatment across
countries.
Most molecules have multiple associated patents, covering the molecule itself, a use of the
molecule, manufacturing processes, etc.8 Despite some harmonization of IP laws, the same molecule
might be eligible for a different number of patents in different countries, or different breadth of cov-
erage. We focus on the first and legally strongest type of patent, the product patent, for which the
inventive step is unambiguous. TRIPS specifically requires that countries provide pharmaceutical
product patents. Our experiment is cleanest for this subset, because of the limited scope for legal
8For example, the HIV treatment markted as EPZICOM in the United States is a combination of abacavir (soldunder the brand name ZIAGEN) and lamivudine (sold as EPIVIR). Patents protecting one of the individual moleculesmay block entry into the combination product, and there is also a patent on the combination. A process patent forthe preparation of optically active cis-nucleosides that specifically mentions abacavir and lamivudine could protecteach of the single-molecule products.
10

interpretations across countries. Product patents are thus very comparable across countries.
We estimate separate regressions for each of our dependent variables of interest, i.e. the speed
of launch, price, and quantity sold. With this approach, we are assuming that firms first choose
whether (and how quickly) to launch, which may depend on the existence of IPRs. Given launch,
we examine whether prices are higher in the presence of IPRs and whether the quantity sold changes
in the presence of IPRs.
To be clear, we are not estimating structural demand and supply equations. Our claim is only
that IPRs may shift the equilibrium levels of these outcomes. A more complete analysis would
estimate systems of demand in each country-disease market, as Chaudhuri et al. (2006) did for
a single class of antibiotics in India. The enormous differences in pharmaceutical markets across
countries and across diseases present considerable challenges in implementing such an analysis,
and we believe that our paper constitutes an important first step. While we cannot estimates
the total welfare effects of patent protection using this approach, which would also require serious
consideration of the dynamic effects on incentives for innovation, we can offer some evidence for
how patents have affected key outcomes of interest in the short to medium run.
We use a discrete-time model of firms’ launch decisions, assuming that we observe launch if firms
expect positive profits from market entry. The latent variable for profit Πijt denotes the profit from
the launch of drug j in country i and in quarter t, and we specify the following reduced-form profit
function conditional on drug launch:
Πijt = α0 + α1ExpiredPatentijt
+ α2OnPatentijt
+ Xijtµ+ τit + ψj + εijt,
where ExpiredPatentijt is a dummy variable equal to one if drug j has no remaining patent
protection in country i in quarter t, and OnPatentedijt is a dummy variable equal to one if drug
j has an active patent (i.e., granted and not yet expired) in quarter t. The omitted category is
the case of a drug that was never patented in country i. Xijt is a vector of other variables that
may affect the launch probability (market size, GDP levels, the number of previously launched
substitute pharmaceutical treatments for drug j in country i, etc.), τit is the time elapsed since the
first international launch for drug j in country i at time t, ψi is the disease category fixed-effect,9
and εijt is the unobserved error term. We estimate this using a discrete-time hazard with a logit
link. This estimation largely replicates that of Cockburn et al. (2014), except that we consider
patents at the drug level rather than the country level.
The theoretical effect of IPRs is ambiguous in the launch equation. We simply estimate whether
9We chose to use disease fixed-effects rather than drug due to the computational burden of estimating more than700 fixed-effects in a non-linear model.
11
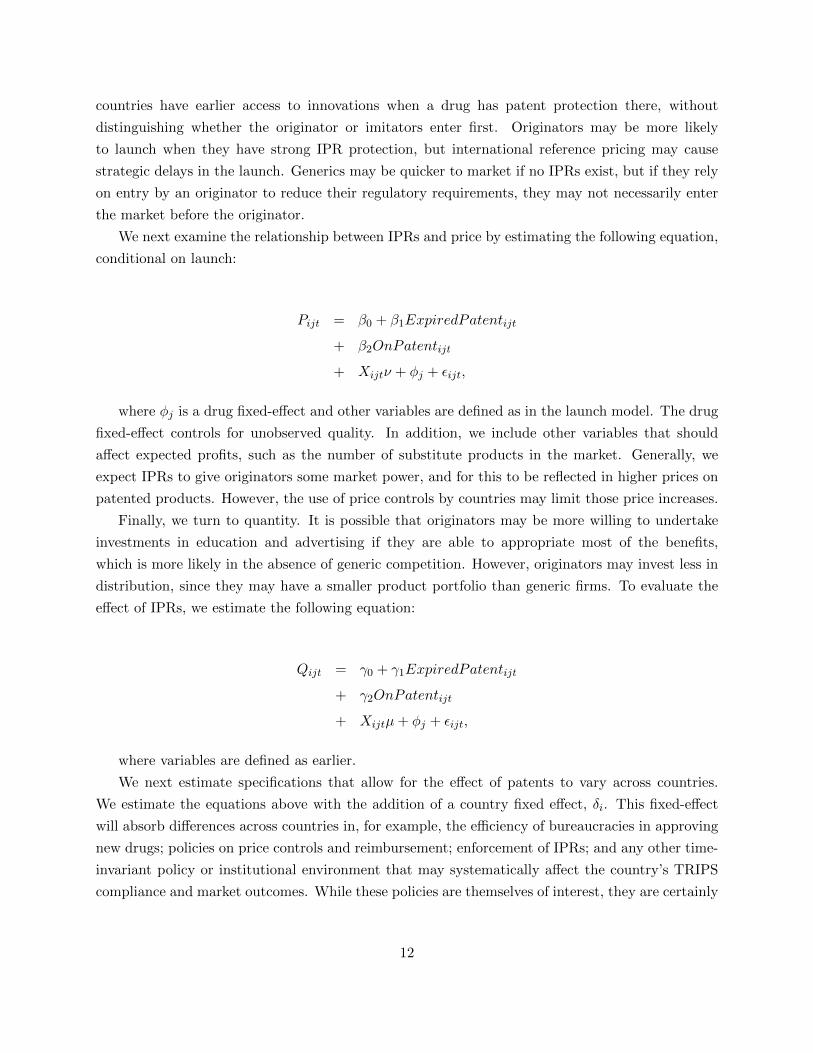
countries have earlier access to innovations when a drug has patent protection there, without
distinguishing whether the originator or imitators enter first. Originators may be more likely
to launch when they have strong IPR protection, but international reference pricing may cause
strategic delays in the launch. Generics may be quicker to market if no IPRs exist, but if they rely
on entry by an originator to reduce their regulatory requirements, they may not necessarily enter
the market before the originator.
We next examine the relationship between IPRs and price by estimating the following equation,
conditional on launch:
Pijt = β0 + β1ExpiredPatentijt
+ β2OnPatentijt
+ Xijtν + φj + εijt,
where φj is a drug fixed-effect and other variables are defined as in the launch model. The drug
fixed-effect controls for unobserved quality. In addition, we include other variables that should
affect expected profits, such as the number of substitute products in the market. Generally, we
expect IPRs to give originators some market power, and for this to be reflected in higher prices on
patented products. However, the use of price controls by countries may limit those price increases.
Finally, we turn to quantity. It is possible that originators may be more willing to undertake
investments in education and advertising if they are able to appropriate most of the benefits,
which is more likely in the absence of generic competition. However, originators may invest less in
distribution, since they may have a smaller product portfolio than generic firms. To evaluate the
effect of IPRs, we estimate the following equation:
Qijt = γ0 + γ1ExpiredPatentijt
+ γ2OnPatentijt
+ Xijtµ+ φj + εijt,
where variables are defined as earlier.
We next estimate specifications that allow for the effect of patents to vary across countries.
We estimate the equations above with the addition of a country fixed effect, δi. This fixed-effect
will absorb differences across countries in, for example, the efficiency of bureaucracies in approving
new drugs; policies on price controls and reimbursement; enforcement of IPRs; and any other time-
invariant policy or institutional environment that may systematically affect the country’s TRIPS
compliance and market outcomes. While these policies are themselves of interest, they are certainly
12

endogenous. Our work focuses on a single policy for which we have a credible identification strategy,
but the existence of other policies affects our interpretation of our results.
In additional specifications, we allow more nuanced differences. We first interact patent status
with World Bank income group definitions to examine differences between different levels of de-
velopment. We then also distinguish between pre- and post-TRIPS patents. In many countries, a
patent system existed prior to official TRIPS compliance, but may not have offered the same level
of protection. Instead of defining a dummy variable based on the existence of the product patent
alone, we define whether it is protected by only pre-TRIPS patents or has some patent protection
under a country’s TRIPS regime, using a more inclusive definition of patent (e.g., patents on new
uses or processes). We again allow this to vary by country income groups. If the patent priority date
determining whether a product qualifies for a Post-TRIPS patent in a country is exogenous, then
the difference in outcomes between products with pre-TRIPS patents and those with Post-TRIPS
patents captures the effect of strengthened IPRs. Finally, we estimate specifications for price and
quantity that include country-year interactions.
3.2 Instrumental variables approach
A limitation of the above approach is that patent protection is the endogenous outcome of decisions
by two key players. First, the originator must apply for protection (if offered in a country), and
expectations about the state of future patent protection in a country, or effective enforcement, as
well as expected price and quantity will influence this decision. Second, the policymaker or patent
office must grant the patent. As discussed above, many countries did not offer patent protection,
or offered weaker forms of protection, prior to TRIPS.
In an alternative model, we define an indicator variable for whether a drug was eligible for
TRIPS-compliant product patent protection in a particular country, i.e. TRIPS compliance oc-
curred no later than the priority date plus 30 months. Having a priority date within this window
exogenously shifts the incentive for originators to apply for a patent (because of stronger protection
or enforcement) and the obligation of patent offices to grant pharmaceutical product patents. In
addition, patents have a predetermined maximum term. While other country policies may extend
this, we take the “normal” expiration date of the first patent on a drug within a country as ex-
ogenous, at least at the level of a specific patent at the time of filing. These patent terms vary
across countries and over time, as laws were changed to comply with TRIPS. For example, in 1995,
the maximum term of patent protection in the US changed from 17 years from the grant date to
20 years from the filing date. We use indicators for the priority date falling within the period of
TRIPS eligibility and for the current period falling within the standard patent term following the
approach recommended by Wooldridge (2010).
First, we estimate a reduced-form model of patent protection (which we will call “stage 0”):
13

PatentedDrugijt = ν0 + ν1WithinWindowij
+ ν2WithinTermijt
+ Xijtκ+ φj + ξijt,
We then calculate predicted values ˆPatentedDrugijt, and use this and its interaction with other
variables as instruments in the second stage regressions of price and quantity:
Pijt = ρ0 + ρ1PatentedDrugijt
+ ρ3IncomeGroupi ∗ PatentedDrugijt+ Xijtχ+ φj + εijt,
Qijt = γ0 + γ1PatentedDrugijt
+ γ3IncomeGroupi ∗ PatentedDrugijt+ Xijtω + φj + εijt,
where PatentedDrugijt and IncomeGroupi ∗PatentedDrugijt are instrumented using the pre-
dicted values from stage 0, the square of predicted values, and the interaction with income (GDP
per capita, logged). As above, we also estimate an alternative specification using World Bank
income groups rather than a continuous measure of income. Although the dependent variable in
stage 0 is discrete, we use OLS due to the large number of fixed-effects. This method is robust to
misspecification of stage 0, although the estimator is not efficient if the linear probability model we
use is not correct (Angrist & Krueger (2001)).
The main drawbacks to this approach are the following. Since we lack separate instruments for
pre- and post-TRIPS patents, we treat any product patent protection as the endogenous treatment
variable. The omitted category, no patent protection, includes both drugs that were never patented
and those with expired patents. Treatment effects are likely to be heterogeneous if patent protection
has different effects across countries and/or drugs. Finally, we cannot implement an instrumental
variables estimator for the nonlinear model of launch.
14

4 Data
4.1 Market outcome data
Our data on key market outcomes of interest – the speed of launch, price, and units sold – comes
from the MIDAS dataset produced by IMS Health. We have quarterly data on prices and units
sold from 2000-2013 and on launch from 1990-2013, a time period that allows us to examine several
years pre- and post-TRIPS implementation for many developing countries. The original data is
provided at the package level, i.e. bottles of 30 10mg tablets. For drugs sold in multiple packages
and presentations, we aggregate the revenues and number of “standard units” (smallest dose) up to
the level of a molecule or combination. Although there is some price discrimination across packages
within a country, this aggregation facilitates comparisons across countries. Each drug is assigned
to a therapeutic class (at the ATC3 level); for drugs with sales in multiple classes, we use the class
with the highest level of sales as its primary disease market.
We focus on drugs first launched anywhere in the world after 1990, since it is this set for
which TRIPS is most relevant. Drugs that are unique to one country, a set that includes many
homeopathic products in India and China, are dropped from our analysis. We exclude diagnostic
agents (ATC class T) and drugs that cannot be easily assigned to a disease (ATC class V). Finally,
we restrict our sample to drugs that we could match to patent information. This leaves us with a
total of 716 drugs.
For each molecule-country pair, we observe launch date, the total sales in nominal local currency,
and the number of units sold. We convert nominal sales to real values using the country’s GDP
deflator. We calculate price as total sales divided by the total number of standard units sold.10
Thus, within-country price changes do not reflect exchange rate fluctuations or inflation. For cross-
country comparisons, we express prices in constant US dollars using the average exchange rate for
2013Q4.
We keep one observation per country and quarter for each drug starting from its initial launch.
A drug is considered launched in a country once positive sales are observed; prior to its launch
in a country but following its first launch elsewhere, launch is coded as zero and price and sales
are coded as missing. Ultimately, this dataset includes 56 quarters, 60 countries, and 716 unique
molecules, amounting to 1459993 molecule-country-quarter observations.
4.2 Firm-level data
We distinguish between originators, or firms that invest in the development of a new drug, and
generic firms. Originators generally own patent rights on the molecule or a license to those rights.
Many drugs are developed and/or marketed under license by multiple firms. For example, several
10Some observations have negative values for sales, which reflect the return of products to the manufacturer. Weset price to missing in these cases.
15

firms could collaborate in the development, with one firm responsible for marketing the drug glob-
ally, or one firm might develop the drug and license it out to other firms for marketing in North
America, Europe, etc. We use two approaches to identify these firms. First, the MIDAS dataset
includes some information on the licensing status of each firm generating sales of a molecule in
a country. If the licensing status is available and listed as either “original brand” or “licensed
brand”, we treat the observation as an originator sale, since the originator receives some payment
for the sale of a licensed brand or at least authorized its sale. For the remaining cases, we use
the R&D Focus database provided by IMS Health, which tracks drug development projects and
includes information on the drug, its intended uses, and the firms participating in its development
or marketing. We designate any firm listed as a co-developer or licensee on a drug project that is
also selling the product in one of our sample countries as an originator. All other sellers of that
drug are coded as generic firms or parallel importers.11
4.3 Country-level data
Summary information for the countries in our sample, including the dates of TRIPS deadlines,
World Bank income group definitions in 2000 and 2013, and region, is provided in Table 1. Our
sample includes the major emerging markets of Brazil, Russia, India, and China, as well as Indone-
sia, Malaysia, Thailand, and South Africa. Thirty of our sample countries had TRIPS compliance
dates in 2000 or later (see Table 1). Many countries had adopted pharmaceutical product patent
legislation prior to their official compliance deadlines. Quite a few rose in income classification
between 2000 and 2013. In our analysis, we use the income classification as of 2000. Results are
similar using the 2013 definition, although we have fewer countries in the lowest income group.
Our main focus in this paper is the effect of IPRs on the outcomes in country-markets, so it
is critical that we correctly measure the existence or strength of IPRs at the country-level over
time. There are a number of possible candidates. The first is the Ginarte-Park index of IPRs
and enforcement (Ginarte & Park (1997)). This measure has the advantage of including a specific
index of patent protection for chemicals. It is only available at 5-year intervals, however, and is
not available for every country in our sample. We complement this with information collected by
LaCroix & Liu (2014) and Hamdan-Livramento (2009). We thank these authors for their willingness
to share their datasets.
An additional form of protection, known as data exclusivity, is available in many countries.12
During the period of data exclusivity, only the owner of the data may use it to obtain regulatory
approval for marketing a drug. This varies across countries and over time. Based on country i’s
11Parallel importers sell the originator’s own products in a country, but without a license. Parallel trade iswidespread within the European Union and is thought to be important in some developing countries. We are onlyable to identify parallel traders within Europe, however.
12While not a TRIPS requirement, data exclusivity is an important element of subsequent bilateral and multilaterialtrade negotiations, including the Trans-Pacific Partnership.
16

data exclusivity term at time t, we define a dummy variable equal to one if drug j was likely to be
protected by data exclusivity.
To control for the impact of economic development or income level, we use the World Devel-
opment Index (WDI) dataset from the World Bank. It includes GDP per capita, population, the
Gini coefficient of income inequality, health expenditures per capita, life expectancy, out-of-pocket
health expenditures, poverty rates, and GDP deflators across the sampled countries. To retain as
much of our sample as possible, we include only the subset of WDI indicators with very complete
coverage. Our source of information on quarterly exchange rates between the local currency and
the US dollar is the Pacific Exchange Rate Service for most countries, and individual central banks
otherwise.
4.4 Disease data
We define a market as a country-disease pair. Regulatory approval is required at the country level
in order to market a drug, and gaining regulatory approval in one country does not generally allow
a firm to access other countries.13 In addition, demand for a drug that treats a particular disease
is generally limited to the population affected by that disease. For example, we would not expect
demand for a colon cancer drug to be very high among those who do not have colon cancer. Since
the burden of disease (or demand) can change over time for any number of reasons (aging of the
population, spread of infectious diseases, changes in risky behaviors, etc.), our ideal measure would
capture such changes.
We use a standard measure of disease burden known as “disability-adjusted life years,” or
DALYs, available from the WHO for a single cross-section of countries in 2004. For diseases
with considerable variation over time, such as HIV, this will again introduce measurement error.
However, it is considered more appropriate for cross-country comparisons than mortality. We
matched each drug’s ATC classification to its DALY code, using fairly aggregate disease definitions
(e.g., infectious and parasitic diseases are matched to ATC codes J and P).14
4.5 Patent data
Information on patents comes from IMS Patent Focus, which is a source of competitive intelligence
for pharmaceutical firms. An important issue for our analysis is the comprehensiveness of its
coverage across countries. Specifically, we might worry that data quality is lower in developing
countries that are of less commercial interest to drug companies. However, almost all patents
are filed under the Patent Cooperation Treaty, which permits simultaneous applications in 148
13Within the European Union, a firm can use a centralized approval process handled by the European MedicinesAgency to win approval among all member states. Alternatively, a firm can apply for regulatory approval in onemember state and use this member state as a reference for approval in other EU countries. However, in order to havethe product reimbursed, the firm must negotiate with different (country specific) regulators over the price.
14see http://www.who.int/entity/healthinfo/statistics/gbdestimatescauselist.pdf
17

countries. If at least one important developed market is among them, then the patent should
be in our dataset. We might not observe patents filed exclusively in lower-income countries, but
such applications are unlikely. In addition, since we focus on the product patent, there is little
uncertainty in matching a patent to a product.
We link patent information to the MIDAS data described above using the generic or chemical
name. The two data sources do not use common identifiers. Where possible, we matched on
chemical or molecule names. For vaccines and patents on drug delivery technologies, and for
patents identified only by the name of the branded product, additional work is required to find the
corresponding product in the other dataset. Of the 2,369 products launched after 1990, we were
able to identify patents for 716. Most of the unmatched drugs are homeopathic products or derived
from traditional medicine, unique to either India or China, and which do not qualify for patents.
The remainder of unmatched products are usually new versions or combinations of old molecules,
for which originators rely on country-specific data exclusivity protection in lieu of patents.
The first application date for the product patent associated with a molecule across all countries
is its priority date.15 Originators generally must apply for protection in other countries within
12-30 months of the priority date. Under the Paris Convention, inventors have 12 months to apply
in other countries. Under the Patent Cooperation Treaty, inventors may take an additional 18
months, for a total of 30. We account for each country’s status as a signatory to the PCT in
variable definitions. Because of the lengthy period of clinical trials, the priority date of the product
patent is usually at least 5 years before the launch date of a new drug.
We observe patenting activity in many countries prior to their required compliance with the
TRIPS Agreement. Some complied early, and most maintained a pre-TRIPS patent system that
provided weaker protection than TRIPS required. In addition, the legal availability of patents may
not always lead to the use of patents. If a market is very small or cannot support prices that allow
the firm to recover variable costs and the fixed costs of launch, then a firm may not bother to
apply for a local patent. Similarly, we may not observe patent applications when a firm expects
lax enforcement of the patent or a negative decision from the patent office.
We define a drug j as “on patent” in country i in quarter t if quarter t follows the earliest
grant date of any product patent on j in i and if quarter t precedes the last expiration date of any
patent granted on j in i. Pre-TRIPS, the patent term varied by country. Post-TRIPS, patents have
a duration of 20 years from the date of application. In some countries, drugs may be protected
by “supplementary protection certificates” or patent term extensions that allow years of market
exclusivity. We adjust our definition of “on patent” for patent extensions and lapsed patents.
15The filing date and priority date can be different for other types of patents, particularly when a patent applicationis derived from a parent application.
18

4.6 Summary of data
The distribution of broad disease areas for the molecules in our regression sample is listed in Table
2. Cancer, cardiovascular treatments, and anti-infectives have the highest number of molecules.
The list of countries included, along with their required TRIPS compliance dates and dates of
pharmaceutical product patent legislation, is contained in Table A of the appendix. For ease of
explication, we combine the three low income countries (India, Indonesia and Pakistan) with the
lower middle income group in the discussion and analysis that follows. All three were considered
lower middle income by 2013.
There is wide variation across countries in the fraction of drugs with product patents. For
example, there are very few with product patents in the United Arab Emirates and the Dominican
Republic, but more than 70% of the drugs launched since 1990 in the United States had a product
patent. Even among high income countries, some introduced product patent legislation relatively
late (such as Norway, Spain, and Estonia) and have a lower share of drugs with product patents.
Those without product patents in the US are generally older drugs for which a new use has been
discovered, or combinations of drugs that may not always qualify for product patents. The share of
products for which originators beat generics to market also varies substantially. The originator is
first more than 80% of the time in most countries. However, India is a clear exception: originators
are first in fewer than 20% of the opportunities (see Table A). In some South American and
Middle Eastern countries, generic firms precede originators in a significant number of cases. Some
of these countries only recently implemented product patents, but others may have weak patent
enforcement. Overall, the pattern of launch suggests that generic firms often rely on local entry by
originators, perhaps because obtaining regulatory approval is easier once the originator has provided
clinical data or because originators invest in advertising that generic firms can benefit from. It also
underscores the importance of patents in India compared with other developing countries. The
impact of introducing patent protection is likely to be larger in India than anywhere else, and may
have consequences for the supply of generic drugs produced in India to countries where IPRs do
not block entry.
Table 3 presents simple means of several key variables by income group and patent status. Not
surprisingly, the fraction of product launched is generally increasing in country income, with 55%
of eligible treatments available at some point during 1990-2013 in high income OECD countries,
but only 35% for lower middle income/low income countries. Launch by originators is faster in
high income countries, and originators are quicker to markets than generics in every income group.
However, generic entry is more likely in the upper and lower middle income groups, and occurs
slightly earlier than in high income countries on average.16 The existence of a product patent implies
faster originator entry (a median of 1.50 versus 3.51 years). More surprisingly, generic entry is slow
16The different outcomes observed in the high income non-OECD category likely reflect the small number ofcountries (Kuwait, Singapore, Slovenia and the United Arab Emirates) with high income inequality.
19

whether a product patent exists or not, though somewhat more likely when no product patent
exists. However, originators are still first in more than three-quarters of the cases. This suggests
that product patents are not the only important barrier to entry in most countries.
Figure 1 shows the distribution of the number of producers over drug-country-quarter obser-
vations by patent status; results using the presence of any patent are similar. The presence of a
product patent mostly affects whether any producer is active. That is, there is a shift from no
producers to a monopoly; the shift from more competitive markets to a monopoly is not evident.
Of course, originators are more likely to seek patents where they expect to earn positive profits.
These simple summary statistics suggest that if originators do not expect profits, generic firms
may not either. These patterns also suggest that enforcement of product patents is reasonably
strong overall, conditional on granting the product patent, because we rarely see generic entry in
the presence of a unexpired product patent. This is somewhat surprising, and merits some expla-
nation. First, firms are likely to seek patent protection only where they expect those patents to be
enforced, so we may not observe patents in countries where enforcement is weak. Second, TRIPS
introduced dispute resolution procedures to address disagreements between member states over the
enforcement of IP, and countries with weak enforcement may face trade penalties. Third, we are
focusing on product patents, for which there is relatively little legal ambiguity. The high profile
patent disputes concerning pharmaceuticals in India generally concern secondary patents, rather
than the product patent. Therefore, while enforcement is an unobserved omitted variable from our
regressions, we are reasonably confident that the inclusion of country fixed effects and the evidence
described here mitigate concerns about a systematic bias. 17
Summary statistics for variables used in the regression analysis are presented in Tables 4 and
5. Table 4 contains the sample used for the launch regression, which runs from 1990-2013; only
observations up to and including the quarter of launch are included for this analysis. Table 5
corresponds to the sample used for the price and quantity regressions, for which data is available
from 2000-2013. Only observations post-launch are included.
5 Results
5.1 Main effects
In all the tables of estimation results that follow, standard errors are clustered by country. Year
fixed-effects are included in all specifications, drug fixed-effects are included in the price and quan-
tity regressions, and therapeutic-class fixed-effects are included in the launch regressions. Because
17Berndt et al. (2011) suggest that while IPRs exist de jure, de facto protection in countries such as Brazil, India,and China remains weak. These countries generally see substantial entry by generic firms, conditional on launch byat least one firm. However, this study does not consider patents at the drug level, and during the period of study,very few drugs in those countries would have qualified for product patents.
20

our price measure is the price per “standard unit,” which varies across drugs,18 it is essential that
we include a drug fixed-effect. This inclusion is also important if patents are more likely to be
granted on novel drugs and novelty is positively correlated with a drug’s quality or effectiveness, or
if originators are more likely to seek protection on high quality drugs (though quality is generally
difficult to assess when the first patent applications are filed).
Market size is approximated by country-level variables such as the disease burden associated
with each drug’s primary therapeutic class, population, GDP per capita and life expectancy. Infor-
mation on national health policies such as the existence of an essential medicines list, use of price
controls, average out-of-pocket expenditures, etc. is available for a subset of countries, and the
effect of many of these (endogenous) policies on access is, of course, also of great interest. How-
ever, incorporating this information would reduce the sample of countries considerably. Because
we observe few changes for these policies over time within countries, we instead include a country
fixed-effect in some specifications. Other control variables include the number of substitute drugs
sold locally and the number of products marketed by the originator in country j (both lagged one
period). Finally, a lagged price index that tracks changes in the price of other (older) drugs in
the same ATC3 therapeutic class is included. Our discussion below focuses only on the variables
related to intellectual property.
Table 6 presents the results of the simplest specifications we estimate. We exclude country
fixed-effects, and focus only on how the existence of a product patent affects launch, price and
quantity sold. We distinguish between cases where no patent ever existed (the excluded category),
where a drug had some patent protection that has expired, and where a drug is currently protected
by a product patent (Table 6). On-patent products are most likely to be launched and to sell
in higher quantities, but also command the highest prices. Products with expired patents sell in
lower quantities and at lower prices than those that are on patent, but higher prices and quantities
relative to those that were never protected. The latter likely reflects the greater availability of
patent protection in richer countries and the greater incentives to seek patents in those markets.
Table 7 includes country fixed-effects. These absorb time-invariant differences in regulatory
barriers, the structure of retail and hospital pharmacy distribution, price controls, and other factors.
While the results for product launch are very similar, we find much smaller coefficients on patent
status in the price and quantity regressions. This is not very surprising, since richer countries
generally granted patents earlier than poorer countries and incentives to patent in rich countries
are also probably higher. The price variation associated with patents appears to be driven mostly
by cross-country variation.
18Ideally, we would use the price per standard course of treatment, but this is not available for all drugs in ourdataset, and usually varies depending on the specific use of a drug.
21

5.2 Effects by country income
We next explore whether the importance of patents varies by country income. Demand for pharma-
ceuticals in rich countries tends to be somewhat inelastic, especially when patients have insurance
coverage. In contrast, the average patient in a poorer country may be unable to pay high out-of-
pocket prices or to afford insurance, limiting the ability of originators to exercise any market power
provided by patents. We would therefore expect prices to be lower overall in poorer countries, and
for the patent premium to be smaller there. That said, there are reasons to expect deviations from
this pricing pattern. If firms are unable to price discriminate across patients of different income
levels within a country, they may choose to set a high price and sell only to the richest segment in
lower income countries. Governments in rich countries may act as monopsony purchasers or have
greater bargaining power in negotiating prices with pharmaceutical firms than poorer countries.
Both factors suggest that prices may be relatively high in poorer countries, with lower quantities
sold.
Results from regression specifications that interact patent status with World Bank income group
classifications are presented in Table 8.
We find the most striking differences for launch. Drugs that are never patented are unlikely to be
marketed, regardless of income. Launch of on-patent drugs is increasing in income, but the opposite
is true for drugs with expired patents. In other words, poor countries are more likely to receive older
drugs (meaning they could be sold either by originators or by generic firms, although we showed
earlier that originators are more likely to be first). Firms are less likely to introduce drugs with
expired patents in rich countries. Clearly, selection is important. Drugs that prove unsuccessful
in their initial launch markets may never be sold globally. The results for price also suggest that
patents are indeed worth more in richer markets, although differences between never patented,
expired patent and on-patent products are not statistically significant. That is, differential pricing
across countries is not markedly different for on-patent drugs, which is somewhat surprising. If
markets were perfectly competitive in the absence of a patent barrier, we would expect price to
fall to marginal cost and to vary little across countries. In fact, we observe large price differences
across countries regardless of patent status. In the case of quantity, the estimated difference across
patent status is an imprecisely estimated zero.
Next, we explore whether TRIPS changed the value of patents. In Table 9, we allow the effect
of patents to vary by income group and distinguish between patents granted pre-TRIPS or post-
TRIPS. As described earlier, the same drug can have pre-TRIPS and post-TRIPS patent status
in two different countries, depending on when each complied with TRIPS. Within a country, we
argue that the set of drugs with post-TRIPS patents is also (mostly) exogenously determined by
priority dates and TRIPS deadlines. Figures 2, 3 and 4 provide a graphical summary. Overall,
drugs are more likely to be launched if they have post-TRIPS patents, as well as to sell in higher
quantities. The effects for launch are larger in the rich countries. The most surprising result is that
22

the price of post-TRIPS patented drugs is lower than pre-TRIPS patented products, on average,
in the poorest category of countries. Including either country-year or drug-year interactions yields
similar patterns of coefficients for the price and quantity regressions (it was impossible to estimate
nearly 10,000 interaction terms in the launch regression). The point estimates for patent status
within each of the country income groups are closer when country-year interactions are added and
have smaller standard errors, but are not statistically different from each other.
We interpret these results with caution, since they are driven by a small number of drugs. Most
low and lower middle income countries faced TRIPS compliance deadlines of 2005. Because of
the lengthy drug development cycle, very few drugs first patented after 2005 have been brought to
market by 2013, when our sample ends. Identifying differences is difficult once drug fixed effects are
included, and our estimates are noisy. However, the general pattern that emerges is that prices have
not significantly increased post-TRIPS, and quantities have not significantly declined, in relatively
poor countries. We discuss possible explanations in section 5.4. In addition, while we include
drug fixed-effects to control for the quality of a molecule, it is also possible that quality varies
between manufacturers of the same molecule. In recent studies of the quality of drugs available in
pharmacies in the developing world, Bate et al. (2014a) and Bate et al. (2014b) present evidence
of significant quality differences between manufacturers and countries. They find that innovator
products tend to be of higher quality. Thus, higher prices on innovator products may signal quality
in markets where less stringent regulation exists. In the absence of generic competitors, originators
may have less reason to signal quality through price.
We re-estimated these specifications using a more inclusive definition of “on-patent,” as ex-
plained in Section 3. They are qualitatively similar to those described above.
5.3 Results using instrumental variables
Our final analysis adopts a different approach to identifying the effect of patent protection. Rather
than grouping products by whether they have patent protection, we use a country’s compliance
with TRIPS as an exogenous shifter for the incentives of firms to seek patents and for a country
to grant them. We can also exploit the exogenously determined (at the time of patent application)
statutory patent term, which should be correlated with patent status but have no effect on price or
quantity except through patent status. The statutory limit should be unrelated to quality, unlike
patent term extensions or other regulatory provisions for market exclusivity. It should also be
unrelated to endogenous challenges (which are more likely for expensive or important drugs) to a
patent’s validity. The statutory patent term is specified by law as years since application or years
since grant. Since the decision to apply (and possibly to grant) is endogenous, we instead base this
definition on the priority date plus 12 or 30 months, depending on a country’s status as a signatory
to the Patent Convention Treaty. As noted above, we focus only on the linear price and quantity
equations, and on a simplified measure of patent status.
23

Table ?? contains the estimation details for patent status (“stage 0”) and the first stage IV
regressions, where we define “patented” as having product patent protection. In stage 0, we esti-
mate a linear model for patent status using all explanatory variables (including year, country and
drug fixed-effects) plus indicators for whether the priority date fell within the window of TRIPS
compliance and for whether the period is within the statutory term of patent protection. The
latter are both highly significant and economically meaningful. We then generate predicted val-
ues ( PatentedDrug) for patent status, and use these, their square, and their interactions with
income groups as instruments for patent status in the price and quantity regressions. Standard
tests indicate that these instruments are valid.
In addition to the IV estimation of price and quantity, we include OLS included for comparison.
While the OLS estimates indicate only small differences in price or quantity associated with patents,
the IV estimates point to a much larger effect. The price premium associated with patent protection
is large and significant for all income groups except the poorest. This makes intuitive sense: while
patents provide some market power, its exercise (through setting high prices) is likely to be limited
where purchasing power is very low. In rich countries, patents allow the use of much higher markups.
The IV estimates also suggest more use of differential pricing for patented drugs than do the OLS.
Patented drugs sell in higher quantities in most income groups.
The IV estimates rely on the variation explained by the exogenous option of post-TRIPS pro-
tection and pre-determined statutory patent terms, and provide the local average treatment effect
of patents for the subset of cases where this variation changed patent status. The estimated local
average treatment effect of patent status for these products may not be representative for all drugs.
5.4 Discussion
Most of the debate about patented drugs is focused on price, with concerns that patients in poor
countries are unable to afford them. We expected patents to be associated with increased prices, if
patent holders are able to exploit their market power. In general, this is what we find, and concerns
about the effect of IPRs on affordability are certainly valid. However, there are two reasons to be
somewhat optimistic about the effects of patents in developing countries. The price premium
associated with patents is close to zero, on average, in the lower-middle income countries in our
sample. This is true whether we rely on OLS or on IV specifications. These results obscure the
changes specific to the implementation of the TRIPS Agreement in developing countries, however.
In fact, we find that TRIPS has actually been associated with a smaller price difference attributable
to patent protection in the poorest countries in our sample. Pre-TRIPS patented drugs are relatively
more expensive there. The price premium associated with patents is highest in rich countries, and
our estimates of this premium are higher when we control for the endogeneity of patent protection.
Two other measures of access receive less attention, but are worthy of discussion. Most of our
specifications find little difference in the quantities sold associated with patent status, although the
24

IV estimates show a more worrisome picture in poor countries. Drugs with post-TRIPS patents
have higher sales than those without such protection, however. This suggests that originators invest
in efforts to shift out demand when IPRs protect them from generic competition. Since advertising
and investments in educating patients or health care practitioners would generally spill over to
competitors, it makes sense that originators underinvest in them when facing generic imitation.
We did not have a clear prediction for the effect of patents on launch, but we find across all
specifications that launch of new products is faster in the presence of patents. As was evident from
the summary statistics, patents are not the only barrier to generic entry in practice: even when
patents do not exist, generics may not enter, and they rarely enter first in most markets.
Cockburn et al. (2014), in a study of country-level patent policy and launch incentives in an
earlier period than that covered here, also emphasize the importance of IPRs and access. They
found interesting differences for countries that offered only short process patents versus those with
long product patents, but TRIPS has eliminated these cross-country differences. Other authors who
have conducted a recent analysis of the pharmaceutical market in one important developing country,
India, find only a small increase in price post-TRIPS (Duggan et al. (2014)) and note the substantial
launch delays associated with weak patent protection (Berndt & Cockburn (2014)). Our results
are broadly consistent with these recent contributions. However, all of these papers use market
data from IMS Health, which does not necessarily cover all distribution channels, particularly in
developing countries. We believe it is the best available source for a multi-country study of a large
cross-section of products. Studies that use alternative sources or that focus on a specific disease
area, particularly those in which NGOs are active in distribution and not sampled by IMS, may
yield different results. Chaudhuri et al. (2006) is one such example, and identifying cases where
patents have had more negative consequences is important for adjusting policy.
In our description of the TRIPS Agreement, we noted several exceptions that developing coun-
tries negotiated. These include the right to use price controls and the right to issue compulsory
licenses (both of which have also been invoked by rich countries). One explanation for the ob-
served post-TRIPS reduction in price in lower middle income and low income countries is that
these countries exercised more stringent price controls on pharmaceuticals at the same time they
introduced stronger patents. India established a panel to examine regulating the price of patented
medicines in 2007, shortly after its TRIPS compliance deadline in 2005. Originators may still ex-
pect higher profits with price controls if they are not sharing the market with generic imitators, so
launch would be more attractive. We find some evidence for this. So far, the use of compulsory
licensing has been limited. Beall & Kuhn (2012) identified only 34 potential compulsory licenses
in 26 countries by 2011. Of course, originators may have started to reduce prices post-TRIPS or
to use voluntary licensing in order to make compulsory licensing less attractive to governments, or
perhaps due to increased attention to corporate social responsibility. For example, to encourage in-
novators to increase the availability of their products in developing countries, accesstomedicines.org
25

produces an annual index of pharmaceutical firms based on their pricing, licensing, R&D invest-
ments, and other dimensions. Merck and GlaxoSmithKline announced a large price cut on their
cervical cancer vaccines for developing countries in May 2013. Gilead, the producer of the hepatitis
C treatment SOVALDI, recently issued voluntary licenses for manufacturers selling in low-income
markets. Patent challenges, or attempts to invalidate pharmaceutical patents, may also play a
role. Such challenges exist in both developed countries (indeed, the Hatch-Waxman Act in the US
provides clear incentives for such challenges) and increasingly in developing countries as well. In
addition, countries vary in the definition of the inventive step required to patent an innovation.
Sampat et al. (2012) describe the case of India, whose Patent Act does not allow patents on vari-
ants of existing pharmaceuticals without proof of increased effectiveness. Garrison (2006) provides
a detailed description of other exceptions used by developing countries to limit scope of patent
protection.
The countervailing responses just described are most likely to affect important drugs: those
that treat serious diseases with a high local burden. That is, price controls and compulsory licenses
are more relevant for HIV or hepatitis treatments than for acne, restless leg syndrome, or erectile
dysfunction. We include one final set of specifications that includes country fixed-effects, and allows
the effect of patent status to vary by disease burden within a country. These results are presented
graphically in Figures 9, 10 and 11. For launch, we find that post-TRIPS patents have been most
important for diseases with lower disease burdens. This pattern is consistent with the idea (also
noted by Berndt & Cockburn (2014)) that these policies make product launch less attractive, as we
observe a smaller bump in launch for post-TRIPS patents when disease burden is greatest. Across
different types of drugs, prices are generally lower for diseases with higher burdens, while quantity
sold is higher. Such correlations are most pronounced for the post-TRIPS patented drugs, which
may be the focus of countervailing policies to offset the negative effects of patents. However, these
differences are statistically insignificant, and therefore only suggestive.
There are alternative explanations for a change in price unrelated to non-IP policy shifts or
political pressures. First, if originators are more willing to launch new products when they are
protected by IPRs, the set of products available in a market will expand. This larger set of products
may include those for which patents shifted the expected quantity sold by the innovator more than
the price commanded (especially in relatively poor countries, where demand may be more elastic).
In other words, the adoption of patents may have encouraged the launch of products with lower
prices, for which innovators could not cover the fixed costs of launch without the assurance of 100%
market share. Another explanation is related to the form of competition in developing markets.
While generic products in developed countries are usually considered (nearly) perfect substitutes for
the original product, emerging markets often see competition between “branded” generics, where
real or perceived quality may vary across firms. In these environments, firms may incur some costs
to develop and protect their brand names, or use price to signal quality. It is possible that by
26

allocating the entire market to the originator, TRIPS-related IPRs have eliminated the need to
differentiate from other producers of the same molecule; lower costs allow lower prices.
Whether the price changes are voluntary responses by firms or result from other policy instru-
ments, our estimates reflect the “net” effect of TRIPS rather than the effect of IPRs alone, and
there may be substantial heterogeneity in the outcomes across countries. However, these exemp-
tions largely offset the negative impact of stronger IPRs, conditional on product launch. They may
come at some cost: while Kyle & McGahan (2012) find that IPRs in developing countries have not
greatly shifted drug development incentives, the use of price controls in relatively rich markets is
associated with launch delays (Kyle (2007)).
6 Conclusion
Our results suggest several points about the relationship between IPRs and access. First, the
existence of IPRs is neither necessary nor sufficient for the launch of pharmaceutical innovations at
the country level. That is, the existence of patents on a molecule in a country does not always block
generic imitation, nor does the lack of patents always deter an originator from making a product
available. This suggests substantial heterogeneity in the value of IPRs, both across countries and
across drugs. IPRs that are not enforced are worth very little. IPRs on molecules with very high
imitation costs or low potential for profit in a country are also not particularly important. While
patented products generally command higher prices, we find that the price premium for patent
products is smaller following TRIPS compliance. This may reflect the greater use of pharmaceutical
price controls, bargaining power of government purchasers or the threat of compulsory licensing
in order to offset some of the market power granted by IPRs. Post-TRIPS patented drugs enjoy
higher sales. Finally, IPRs have a very large bearing on product launch. Thus, while the potential
for patents to limit access is often emphasized in policy discussions, it appears that IPRs – by
creating increased incentives for marketing efforts by originators – may increase the availability of
new treatments to populations in developing countries on average. Of course, there are important
exceptions to this pattern. Where a large generic market potentially exists, such as in the case
of HIV or Hepatitis C, patents are more likely to restrict price competition in developing markets
where such protection is available.
The TRIPS Agreement, which generally strengthened and harmonized IPRs across countries,
does appear to have changed market outcomes. On average, access to new pharmaceuticals has at
least not decreased following TRIPS. Point estimates show an increase in the probability of new
product launch and quantities sold, although differences are not always statistically significant.
While patents are also associated with higher prices, there is some evidence that prices in poorer
countries have fallen, though not to the level of off-patent products. However, the effect of IPRs may
be confounded by other policy changes. It is certainly possible that in the absence of countervailing
policies, stronger IPRs would have resulted in a larger increase in prices. It is also likely that IPRs
27

have very different implications for countries with a large generic sector (e.g., India) than for most
of the developing countries we examine. Nevertheless, we believe the results should be considered
relatively good news about the relationship between IPRs and access to innovative medicines,
although considerable work remains to improve the latter.
References
Angrist, J., & Krueger, A. (2001). Instrumental variables and the search for identification: from
supply and demand to natural experiments. Journal of Economic Perspectives, 15 (4), 69–85.
Arora, A., Branstetter, L., & Chatterjee, C. (2008). Strong Medicine: Patent Reform and the
Emergence of a Research-Driven Pharmaceutical Industry in India.
Bate, R., Jin, G. Z., & Mathur, A. (2014a). Falsified or substandard? assessing price and non-price
signals of drug quality. Journal of Economics and Management Strategy , forthcoming .
Bate, R., Jin, G. Z., Mathur, A., & Attaran, A. (2014b). Poor drug quality and global trade: A
pilot study. NBER Working Paper 20469 .
Beall, R., & Kuhn, R. (2012). Trends in Compulsory Licensing of Pharmaceuticals Since the Doha
Declaration: A Database Analysis. PLoS Medicine, 9 (1), e1001154.
Berndt, E. R., Blalock, N., & Cockburn, I. M. (2011). Diffusion of new drugs in the post-trips era.
International Journal of the Economics of Business, 18 (2), 203–224.
Berndt, E. R., & Cockburn, I. M. (2014). The hidden cost of low prices: Limited access to new
drugs in india. Health Affairs, 33 (9), 1567–1575.
Boldrin, M., & Levine, D. (2002). The Case Against Intellectual Property. American Economic
Review Papers and Proceedings, 92 , 209–212.
Borrell, J.-R. (2005). Patents and the faster introduction of new drugs in developing countries.
Applied Economics Letters, 12 (2), 379–382.
Branstetter, L., Fisman, R., & Foley, F. (2006). Do Stronger Intellectual Property Rights Increase
International Technology Transfer? Quarterly Journal of Economics, 121 (1), 321–349.
Chaudhuri, S., Goldberg, P., & Jia, P. (2006). Estimating the Effects of Global Patent Protection
in Pharmaceuticals: A Case Study of Quinilones in India. American Economic Review , 96 (5),
1477–1513.
Cockburn, I., Lanjouw, J., & Schankerman, M. (2014). Global diffusion of new drugs: The role of
patent policy, price controls and institutions. NBER Working Paper 20492 .
28

Cohen, W., Nelson, R., & Walsh, J. (2000). Protecting their Intellectual Assets: Appropriability
Conditions and Why U.S. Manufacturing Firms Patent (or Not). NBER Working Paper 7552 .
Danzon, P. M., Wang, R., & Wang, L. (2005). The Impact of Price Regulation on the Launch Delay
of New Drugs – Evidence from Twenty-five Major Markets in the 1990s. Health Economics, 14 ,
269–292.
Duggan, M., Garthwaite, C., & Goyal, A. (2014). The market impacts of pharmaceutical product
patents in developing countries: Evidence from India. NBER Working Paper 20548 .
Garrison, C. (2006). Exceptions to Patent Rights in Developing Countries. Tech. rep., International
Centre for Trade and Sustainable Development.
Ginarte, J., & Park, W. (1997). Determinants of Patent Rights: A Cross-National Study. Research
Policy , 26 (3), 283–301.
Hamdan-Livramento, I. (2009). How compliant are developing countries with their TRIPS obliga-
tions? CEMI Working Paper 2009-001.
Kyle, M. (2006). The role of firm characteristics in pharmaceutical product launches. RAND
Journal of Economics, 37 (3), 602–618.
Kyle, M. (2007). Pharmaceutical price controls and entry strategies. Review of Economics and
Statistics, 89 (1), 88–99.
Kyle, M., & McGahan, A. (2012). Investments in pharmaceuticals before and after TRIPS. Review
of Economics and Statistics, 94 (4), 1157–1172.
LaCroix, S., & Liu, M. (2008). Patents and Access to Essential Medicines , chap. 13, (pp. 423–464).
Frontiers of Economics and Globalization. Elsevier.
LaCroix, S., & Liu, M. (2014). The impact of stronger property rights in pharmaceuticals on
innovation in developed and developing countries.
Lanjouw, J. (2005). Patents, price controls and access to new drugs: How policy affects global
market entry. NBER Working Paper 11321 .
Lanjouw, J., & Cockburn, I. (2001). Do patents matter? Empirical evidence after GATT. NBER
Working Paper 7495 .
Maskus, K., & Penubartib, M. (1995). How trade-related are intellectual property rights? Journal
of International Economics, 39 , 227–248.
Qian, Y. (2007). Do Additional National Patent Laws Stimulate Domestic Innovation in an Inter-
national Patenting Environment? Review of Economics and Statistics, 89 (3), 436–453.
29

Sampat, B. N., Shadlen, K. C., & Amin, T. M. (2012). Challenges to India’s Pharmaceutical Patent
Laws. Science, 337 , 414–415.
Scott Morton, F., & Kyle, M. (2012). Markets for Pharmaceutical Products. In M. V. Pauly, T. G.
Mcguire, & P. P. Barros (Eds.) Handbook of Health Economics, vol. 2, chap. 12, (pp. 763–823).
Elsevier.
Waning, B., Diedrichsen, E., & Moon, S. (2010). A lifeline to treatment: the role of Indian
generic manufacturers in supplying antiretroviral medicines to developing countries. Journal of
the International AIDS Society , 13 (35).
Wooldridge, J. (2010). Econometric Analysis of Cross-section and Panel Data. MIT Press, 2nd ed.
30

Table 1: Distribution of country characteristicsYear of TRIPS compliance deadline N
1995 251996 11999 12000 162001 22005 122012 1Total 58
Income group (2000) NHigh OECD 20
High nonOECD 4Upper middle 17Lower middle 16Low income 3
Total 60
WDI geographic region NEast Asia & Pacific 10
Europe & Central Asia 27Latin America & Caribbean 9Middle East & North Africa 9
North America 2South Asia 2
Sub-Saharan Africa 1Total 60
Table 2: Distribution of molecules across diseasesDisease N
Infectious and parasitic 102Respiratory 49
Nutritional deficiencies 3Neoplasms 116Diabetes 36
Endocrine 11Neuropsychotic 92
Sense organ 10Cardiovascular 136
Digestive 44Genitourinary 41
Skin 36Musculoskeletal 39
Oral 1Total 716
31

Table 3: Access and price by income group and patent statusLaunch(mean)
Originator1st (mean)
Orig. launch(median yrs)
Any generic(mean)
Generic launch(median yrs)
High OECD 0.55 0.86 1.50 0.28 7.76High nonOECD 0.40 0.82 2.75 0.25 4.76Upper middle 0.44 0.79 2.76 0.39 7.01Lower middle 0.35 0.69 3.75 0.49 7.26
Never patented 0.31 0.73 3.51 0.43 7.50Ever patented 0.59 0.84 1.75 0.32 7.01Ever product patent 0.60 0.84 1.50 0.31 7.01
Total 0.45 0.80 2.25 0.36 7.25
32

Figure 1: Number of producers by patent status
33

Tab
le4:
Su
mm
ary
stat
isti
cs(l
aun
ch)
Vari
ab
leM
ean
Std
.D
ev.
N
=1
ifm
olec
ule
lau
nch
edin
cou
ntr
yth
isqu
arte
r0.
010.
11
1459993
Eve
rla
un
ched
inco
untr
y0.
090.
291459993
Ori
gin
ator
1st
tom
arke
t0.
740.
44
318857
Act
ive
pro
du
ctp
aten
t0.
150.
351459993
Nu
mb
erof
acti
vep
aten
ts2.
7515
.38
1459993
Any
acti
ve
pat
ent
0.28
0.45
1459993
Act
ive
pro
du
ctp
aten
tgr
ante
dp
ost-
TR
IPS
0.03
0.17
1459993
Nu
mb
erof
acti
vep
ost-
TR
IPS
pat
ents
inco
untr
y(c
omp
lian
ced
ead
lin
e)0.
917.
281459993
Any
acti
ve
pat
ent
gran
ted
pos
t-T
RIP
S0.
110.
31
1459993
Eve
rh
adan
yp
aten
tin
cou
ntr
y0.
370.
481459993
Eve
rh
adp
rod
uct
pat
ent
inco
untr
y0.
220.
41
1459993
Dru
gh
asd
ata
excl
usi
vit
yin
cou
ntr
y-q
uar
ter
0.49
0.5
1459993
Ou
t-of
-pock
etsh
are
ofp
riva
teh
ealt
hex
p76
.518
.61221656
Gov
tsh
are
ofh
ealt
hex
pen
dit
ure
s60
.98
17.7
81221656
GIN
Iin
dex
ofin
com
ein
equ
alit
y37
.18.
91348531
Log
(DA
LY
)3.
362
1447309
Ln
(GD
Pp
erca
pit
a)2.
141.
22
1459993
Lif
eex
pec
tan
cy74
.15
5.24
1459993
Ln
(pop
ula
tion
)2.
981.
61459993
Dat
aex
clu
sivit
yte
rmgr
ante
dby
cou
ntr
y5.
572.
821293979
Nu
mb
erof
loca
lsu
bst
itu
tes
7.61
9.58
1459993
Log
orig
inat
orp
rod
uct
sin
cou
ntr
y,t-
12.
261.
87
1459993
34

Tab
le5:
Su
mm
ary
stat
isti
cs(p
rice
,qu
anti
ty)
Vari
ab
leM
ean
Std
.D
ev.
N
Ln
(pri
cep
eru
nit
inU
Sd
olla
rs)
1.02
2.43
617996
Ln
(qu
anti
ty)
4.47
3.13
617996
Act
ive
pro
du
ctp
aten
t0.
310.
46
617996
Nu
mb
erof
acti
vep
aten
ts9
35.0
7617996
Any
acti
vep
aten
t0.
590.
49
617996
Act
ive
pro
du
ctp
aten
tgr
ante
dp
ost-
TR
IPS
0.08
0.28
617996
Nu
mb
erof
acti
vep
ost-
TR
IPS
pat
ents
inco
untr
y(c
omp
lian
ced
ead
lin
e)3.
7215
.68
617996
Any
acti
vep
aten
tgr
ante
dp
ost-
TR
IPS
0.37
0.48
617996
Eve
rhad
any
pat
ent
inco
untr
y0.
670.
47
617996
Eve
rhad
pro
du
ctp
aten
tin
cou
ntr
y0.
430.
49
617996
Dru
gh
asd
ata
excl
usi
vit
yin
cou
ntr
y-q
uar
ter
0.41
0.49
617996
Ou
t-of
-pock
etsh
are
ofp
riva
teh
ealt
hex
p72
.54
19.5
7507856
Gov
tsh
are
ofh
ealt
hex
pen
dit
ure
s63
.85
16.3
6507856
GIN
Iin
dex
ofin
com
ein
equ
alit
y36
.21
8.59
589626
Log
(DA
LY
)3.
341.
82
615338
Ln
(GD
Pp
erca
pit
a)2.
61.
16
617996
Lif
eex
pec
tan
cy76
.37
5.27
617996
Ln
(pop
ula
tion
)3.
181.
58
617996
Dat
aex
clu
sivit
yte
rmgr
ante
dby
cou
ntr
y6.
252.
99
572625
Nu
mb
erof
loca
lsu
bst
itu
tes
11.3
810
.25
617996
Pri
cein
dex
ofA
TC
clas
s1.
555.
01
617996
Log
orig
inat
orpro
du
cts
inco
untr
y,t-
13.
141.
72
617996
35

Table 6: Main effect of product patentLaunch Price Quantity
b/se b/se b/seExpired patent 0.7149∗∗∗ 0.3240∗∗∗ 0.3360∗∗
(0.0438) (0.1118) (0.1540)On patent 0.8535∗∗∗ 0.4466∗∗∗ 0.4449∗∗
(0.0498) (0.1354) (0.1864)Log(DALY) 0.0259 −0.0612∗ 0.1856∗∗∗
(0.0174) (0.0329) (0.0574)Ln(GDP per capita) 0.0260 0.2942∗∗∗ 0.7872∗∗∗
(0.0471) (0.1002) (0.1352)Life expectancy 0.0168 0.0253 0.0373
(0.0104) (0.0193) (0.0231)Ln(population) 0.0275 0.0306 0.7970∗∗∗
(0.0258) (0.0433) (0.0601)Number of local substitutes 0.0069∗∗∗ 0.0035 0.0148∗∗∗
(0.0015) (0.0069) (0.0047)Price index of ATC class −0.0078 −0.0020
(0.0151) (0.0051)Log originator products in country, t-1 0.2112∗∗∗ 0.0522 0.1098∗∗∗
(0.0076) (0.0375) (0.0409)Intercept −6.7325∗∗∗ −2.6172∗ −5.6876∗∗∗
(0.8066) (1.4316) (1.6216)N 1456176 620330 620330Pseudo R2 .083Adj. R2 .832 .765
Fixed effectsYear Year YearATC Drug Drug
* p<0.10, ** p<0.05, *** p< .01. Standard errors are clustered by country.
36

Table 7: Main effect of product patent with country fixed effectsLaunch Price Quantity
b/se b/se b/seExpired patent 0.7259∗∗∗ 0.0582∗ −0.0803∗
(0.0340) (0.0310) (0.0437)On patent 0.9293∗∗∗ 0.1017∗∗∗ 0.0107
(0.0440) (0.0296) (0.0482)Log(DALY) 0.0381∗∗∗ −0.0858∗∗∗ 0.2466∗∗∗
(0.0117) (0.0184) (0.0357)Ln(GDP per capita) 0.3558∗∗∗ −0.4714∗∗∗ 1.1047∗∗∗
(0.1350) (0.1535) (0.2370)Life expectancy 0.0214 −0.0205 0.0749∗
(0.0186) (0.0229) (0.0375)Ln(population) −0.0877 −0.5539∗∗ 1.0476∗
(0.2524) (0.2182) (0.6033)Number of local substitutes 0.0044∗∗∗ 0.0062∗ 0.0136∗∗∗
(0.0013) (0.0033) (0.0039)Price index of ATC class 0.0176∗∗∗ −0.0040
(0.0039) (0.0031)Log originator products in country, t-1 0.2035∗∗∗ −0.0061 0.1045∗∗∗
(0.0080) (0.0157) (0.0247)Intercept −7.7830∗∗∗ 1.4790 −8.7736∗∗
(1.8107) (2.0510) (3.8691)N 1456176 620330 620330Pseudo R2 .0894Adj. R2 .886 .8
Fixed effectsYear Year YearATC Drug Drug
Country Country Country
* p<0.10, ** p<0.05, *** p< .01. Standard errors are clustered by country.
37

Table 8: Estimation results using product patent by income groupLaunch Price Quantity
b/se b/se b/seExpired patent 1.0250∗∗∗ 0.2905∗∗∗ 0.4097∗∗
(0.1616) (0.0875) (0.1653)On patent 1.2320∗∗∗ 0.3728∗∗∗ 0.6126∗∗∗
(0.1731) (0.1094) (0.1971)High nonOECD × expired patent −0.1480 −0.0376 0.4873
(0.1701) (0.1568) (0.3623)Upper middle × expired patent −0.3070∗ 0.1894 −0.2616
(0.1660) (0.1872) (0.1961)Lower middle × expired patent −0.3288∗ −0.3112 −0.2288
(0.1835) (0.1956) (0.2100)High nonOECD × on patent −0.3271∗ −0.0611 0.3234
(0.1867) (0.1738) (0.4697)Upper middle × on patent −0.4753∗∗∗ 0.2369 −0.5864∗∗
(0.1798) (0.2146) (0.2524)Lower middle × on patent −0.5180∗∗ −0.0796 −0.5296∗
(0.2032) (0.1933) (0.2857)Drug has data exclusivity in country-quarter 0.1122 −0.1060
(0.0863) (0.0867)High nonOECD 0.3964∗ −0.1893 −0.9131∗
(0.2048) (0.1792) (0.5055)Upper middle 0.5093∗∗ −0.4058 −0.1880
(0.2066) (0.3848) (0.3504)Lower middle 0.3907 −0.4528 −0.5023
(0.2422) (0.7258) (0.6034)Log(DALY) 0.0290∗ −0.0738∗∗ 0.1557∗∗∗
(0.0158) (0.0309) (0.0525)Ln(GDP per capita) 0.0448 0.1391 0.6240∗∗∗
(0.0731) (0.2604) (0.2231)Life expectancy 0.0192∗ 0.0230 0.0191
(0.0114) (0.0168) (0.0157)Ln(population) 0.0389 0.0199 0.7638∗∗∗
(0.0266) (0.0497) (0.0642)Number of local substitutes 0.0069∗∗∗ 0.0024 0.0126∗∗∗
(0.0015) (0.0063) (0.0047)Price index of ATC class −0.0066 −0.0024
(0.0141) (0.0051)Log originator products in country, t-1 0.2098∗∗∗ 0.0454 0.0933∗∗
(0.0077) (0.0373) (0.0358)Intercept −7.3669∗∗∗ −1.6355 −3.2768∗∗∗
(0.9821) (1.4475) (1.2199)N 1456176 620330 620330Pseudo R2 .0837Adj. R2 .834 .769
Fixed effectsYear Year YearATC Drug Drug
* p<0.10, ** p<0.05, *** p< .01. Standard errors are clustered by country. The omitted incomegroup is High income OECD.
38

Table 9: Estimation results using product patent by income group and TRIPS statusPrice Quantity Quantityb/se b/se b/se
Expired patent 1.0379∗∗∗ 0.3006∗∗∗ 1.2202∗∗∗
(0.1604) (0.0786) (0.2336)Pre-TRIPS patent 1.1608∗∗∗ 0.4972∗∗∗ 1.6171∗∗∗
(0.1826) (0.1093) (0.3364)Post-TRIPS patent 1.4594∗∗∗ 0.4046∗∗∗ 1.2365∗∗∗
(0.1542) (0.0925) (0.2387)High nonOECD × Expired patent 0.2993∗∗ −0.3397∗∗∗ −1.8241∗∗∗
(0.1174) (0.0666) (0.2900)Upper middle × Expired patent 0.2660∗∗ −0.5767∗∗∗ −1.0739∗∗∗
(0.1240) (0.1475) (0.3000)Lower middle × Expired patent 0.1614 −1.3303∗∗∗ −0.8632∗
(0.1680) (0.2961) (0.4428)High nonOECD × Pre-TRIPS patent 0.0419 −0.3573∗∗∗ −2.2044∗∗∗
(0.1234) (0.0641) (0.3447)Upper middle × Pre-TRIPS patent 0.1674 −0.5926∗∗∗ −1.2855∗∗∗
(0.1258) (0.1601) (0.4060)Lower middle × Pre-TRIPS patent 0.0474 −1.0300∗∗∗ −1.9314∗∗∗
(0.2046) (0.1650) (0.4617)High nonOECD × Post-TRIPS patent 0.0676 −0.4352∗∗∗ −1.6122∗∗∗
(0.1010) (0.0742) (0.2822)Upper middle × Post-TRIPS patent −0.0412 −0.6387∗∗∗ −1.1074∗∗∗
(0.1336) (0.1650) (0.3363)Lower middle × Post-TRIPS patent −0.2175 −1.4901∗∗∗ −0.8119
(0.2011) (0.4361) (0.6538)Drug has data exclusivity in country-quarter 0.1649∗ −0.1484
(0.0873) (0.1188)Log(DALY) 0.0311∗∗
(0.0157)Ln(GDP per capita) 0.0743
(0.0720)Life expectancy 0.0208∗∗
(0.0093)Ln(population) 0.0442∗
(0.0262)Number of local substitutes 0.0059∗∗∗ −0.0060 0.0556∗∗∗
(0.0015) (0.0052) (0.0078)Price index of ATC class −0.0023 0.0074
(0.0049) (0.0052)Log originator products in country, t-1 0.2145∗∗∗ 0.0392 0.3556∗∗∗
(0.0071) (0.0368) (0.0763)Intercept −7.3761∗∗∗ 1.0374∗∗∗ −0.2282
(0.7569) (0.2355) (0.5651)High nonOECD
Upper middle
Lower middle
N 1456176 622988 622988Adj. R2 .829 .677
Fixed effectsYear*Country
Drug
* p<0.10, ** p<0.05, *** p< .01. Standard errors are clustered by country. The omitted incomegroup is High income OECD. 39
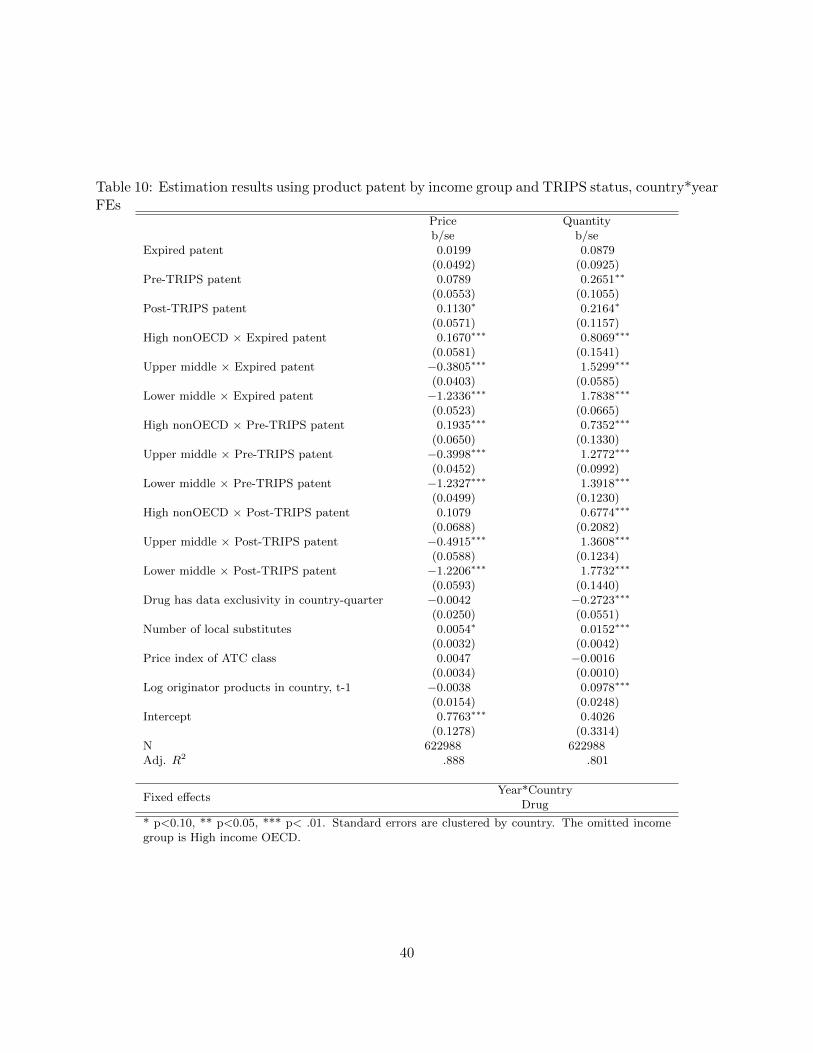
Table 10: Estimation results using product patent by income group and TRIPS status, country*yearFEs
Price Quantityb/se b/se
Expired patent 0.0199 0.0879(0.0492) (0.0925)
Pre-TRIPS patent 0.0789 0.2651∗∗
(0.0553) (0.1055)Post-TRIPS patent 0.1130∗ 0.2164∗
(0.0571) (0.1157)High nonOECD × Expired patent 0.1670∗∗∗ 0.8069∗∗∗
(0.0581) (0.1541)Upper middle × Expired patent −0.3805∗∗∗ 1.5299∗∗∗
(0.0403) (0.0585)Lower middle × Expired patent −1.2336∗∗∗ 1.7838∗∗∗
(0.0523) (0.0665)High nonOECD × Pre-TRIPS patent 0.1935∗∗∗ 0.7352∗∗∗
(0.0650) (0.1330)Upper middle × Pre-TRIPS patent −0.3998∗∗∗ 1.2772∗∗∗
(0.0452) (0.0992)Lower middle × Pre-TRIPS patent −1.2327∗∗∗ 1.3918∗∗∗
(0.0499) (0.1230)High nonOECD × Post-TRIPS patent 0.1079 0.6774∗∗∗
(0.0688) (0.2082)Upper middle × Post-TRIPS patent −0.4915∗∗∗ 1.3608∗∗∗
(0.0588) (0.1234)Lower middle × Post-TRIPS patent −1.2206∗∗∗ 1.7732∗∗∗
(0.0593) (0.1440)Drug has data exclusivity in country-quarter −0.0042 −0.2723∗∗∗
(0.0250) (0.0551)Number of local substitutes 0.0054∗ 0.0152∗∗∗
(0.0032) (0.0042)Price index of ATC class 0.0047 −0.0016
(0.0034) (0.0010)Log originator products in country, t-1 −0.0038 0.0978∗∗∗
(0.0154) (0.0248)Intercept 0.7763∗∗∗ 0.4026
(0.1278) (0.3314)N 622988 622988Adj. R2 .888 .801
Fixed effectsYear*Country
Drug
* p<0.10, ** p<0.05, *** p< .01. Standard errors are clustered by country. The omitted incomegroup is High income OECD.
40

Table 11: Estimation results using product patent by income groupPrice (OLS) Price (IV) Quantity (OLS) Quantity (IV)
b/se b/se b/se b/seOn patent 0.0903∗∗∗ −0.1284∗∗∗ 0.2654∗∗∗ 0.3377∗∗∗
(0.0277) (0.0131) (0.0404) (0.0223)High nonOECD × on patent 0.0439 −0.0505 −0.1380 0.0076
(0.0412) (0.0312) (0.1191) (0.0531)Upper middle × on patent 0.0092 −0.0742∗∗∗ −0.2838∗∗∗ −0.1549∗∗∗
(0.0335) (0.0140) (0.1065) (0.0238)Lower middle × on patent −0.0276 0.0290 −0.3647∗∗∗ −0.2177∗∗∗
(0.0467) (0.0255) (0.1063) (0.0434)Drug has data exclusivity in country-quarter −0.0060 −0.0037 −0.1675∗∗∗ −0.1656∗∗∗
(0.0217) (0.0030) (0.0440) (0.0052)Active non-product patent 0.0559∗∗∗ −0.0754∗∗∗ 0.1001∗∗∗ 0.1596∗∗∗
(0.0201) (0.0090) (0.0259) (0.0153)Log(DALY) −0.0859∗∗∗ −0.0862∗∗∗ 0.2488∗∗∗ 0.2481∗∗∗
(0.0183) (0.0018) (0.0358) (0.0030)Ln(GDP per capita) −0.4872∗∗∗ −0.4045∗∗∗ 1.0556∗∗∗ 1.0193∗∗∗
(0.1554) (0.0150) (0.2386) (0.0255)Life expectancy −0.0212 −0.0145∗∗∗ 0.0703∗ 0.0673∗∗∗
(0.0230) (0.0025) (0.0374) (0.0042)Ln(population) −0.5674∗∗ −0.4914∗∗∗ 0.9784 0.9523∗∗∗
(0.2215) (0.0235) (0.6065) (0.0400)Number of local substitutes 0.0061∗ 0.0063∗∗∗ 0.0134∗∗∗ 0.0134∗∗∗
(0.0032) (0.0002) (0.0039) (0.0003)Price index of ATC class 0.0175∗∗∗ 0.0175∗∗∗ −0.0041 −0.0040∗∗∗
(0.0039) (0.0004) (0.0030) (0.0007)Log originator products in country, t-1 −0.0055 −0.0035∗ 0.1037∗∗∗ 0.1019∗∗∗
(0.0156) (0.0018) (0.0248) (0.0031)Intercept 1.7269 0.8018∗∗∗ −6.6158∗ −7.8345∗∗∗
(2.0855) (0.2196) (3.8772) (0.3738)N 620330 620330 620330 620330Adj. R2 .886 .886 .800 .800
Fixed effectsYear
CountryDrug
* p<0.10, ** p<0.05, *** p< .01. Standard errors are clustered by country. The omitted incomegroup is High income OECD.
41

Figure 2: Patent protection and launch, by income group
Figure 3: Patent protection and price, by income group
42

Figure 4: Patent protection and quantity, by income group
Figure 5: Patent protection and price, IV estimates
43

Figure 6: Patent protection and quantity, IV estimates
Figure 7: Patent protection and price, IV estimates
44

Figure 8: Patent protection and quantity, IV estimates
Figure 9: Patent protection and launch, by disease burden
45

Figure 10: Patent protection and price, by disease burden
Figure 11: Patent protection and quantity, by disease burden
46

AC
ou
ntr
yL
ist
an
dIP
RIm
ple
menta
tion
Measu
res
Cou
ntr
yL
egis
lati
on
Dead
lin
eIn
com
eG
rou
pO
rigin
ato
r
firs
t(m
ean
)
Pro
du
ct
pate
nt
(mean
)
AL
GE
RIA
2003
Low
erm
idd
le0.
490.0
5
AR
GE
NT
INA
2000
2005
Up
per
mid
dle
0.75
0.1
9
AU
ST
RA
LIA
1990
1995
Hig
hO
EC
D0.
850.6
5
AU
ST
RIA
1987
1995
Hig
hO
EC
D0.
840.5
0
BE
LG
IUM
1995
Hig
hO
EC
D0.
870.7
0
BR
AZ
IL19
9720
05U
pp
erm
idd
le0.
830.2
3
BU
LG
AR
IA19
9319
96L
ower
mid
dle
0.81
0.2
3
CA
NA
DA
1987
1995
Hig
hO
EC
D0.
850.6
0
CH
INA
1993
2001
Low
erm
iddle
0.57
0.3
0
CO
LO
MB
IA20
0020
00L
ower
mid
dle
0.79
0.0
7
CR
OA
TIA
2004
2000
Up
per
mid
dle
0.68
0.1
3
CZ
EC
HR
EP
UB
LIC
1991
1995
Up
per
mid
dle
0.84
0.2
8
DO
MIN
ICA
NR
EP
UB
LIC
2000
2000
Low
erm
idd
le0.
620.0
0
EC
UA
DO
R19
9820
00L
ower
mid
dle
0.77
0.0
1
EG
YP
T20
0520
05L
ower
mid
dle
0.63
0.0
1
ES
TO
NIA
1994
2000
Up
per
mid
dle
0.74
0.1
1
FIN
LA
ND
1995
1995
Hig
hO
EC
D0.
870.2
4
FR
AN
CE
1978
1995
Hig
hO
EC
D0.
870.7
2
GE
RM
AN
Y19
6819
95H
igh
OE
CD
0.88
0.7
1
GR
EE
CE
1992
1995
Hig
hO
EC
D0.
850.5
0
HU
NG
AR
Y19
9419
95U
pp
erm
idd
le0.
860.2
7
IND
IA20
0520
05L
ower
mid
dle
0.18
0.0
7
IND
ON
ES
IA19
9720
00L
ower
mid
dle
0.80
0.0
6
47

Cou
ntr
yL
egis
lati
on
Dead
lin
eIn
com
eG
rou
pO
rigin
ato
r
firs
t(m
ean
)
Pro
du
ct
pate
nt
(mean
)
IRE
LA
ND
1995
Hig
hO
EC
D0.
850.5
6
ITA
LY
1978
1995
Hig
hO
EC
D0.
900.7
1
JA
PA
N19
7619
95H
igh
OE
CD
0.91
0.6
3
JO
RD
AN
1999
2000
Low
erm
idd
le0.
720.0
0
KO
RE
A19
8620
00U
pp
erm
idd
le0.
810.5
3
KU
WA
IT20
05H
igh
non
OE
CD
0.72
0.0
1
LA
TV
IA19
9319
99L
ower
mid
dle
0.76
0.2
6
LE
BA
NO
N20
00U
pp
erm
idd
le0.
690.0
0
LIT
HU
AN
IA19
9420
01U
pp
erm
idd
le0.
760.1
7
LU
XE
MB
OU
RG
1995
Hig
hO
EC
D0.
840.6
2
MA
LA
YS
IA19
8320
00U
pp
erm
idd
le0.
850.1
0
ME
XIC
O19
9120
00U
pp
erm
idd
le0.
810.4
3
MO
RO
CC
O20
0020
05L
ower
mid
dle
0.65
0.1
0
NE
WZ
EA
LA
ND
1995
Hig
hO
EC
D0.
780.5
6
NO
RW
AY
1992
1995
Hig
hO
EC
D0.
870.2
9
PA
KIS
TA
N20
0520
05L
ower
mid
dle
0.58
0.0
1
PE
RU
2000
2000
Low
erm
idd
le0.
710.0
5
PH
ILIP
PIN
ES
1998
2000
Low
erm
idd
le0.
800.3
1
PO
LA
ND
1993
2000
Up
per
mid
dle
0.83
0.2
0
PO
RT
UG
AL
1992
1995
Hig
hO
EC
D0.
820.3
7
RU
SS
IA19
9220
12L
ower
mid
dle
0.80
0.3
4
SA
UD
IA
RA
BIA
2004
2005
Up
per
mid
dle
0.78
0.0
7
SIN
GA
PO
RE
1994
2000
Hig
hn
onO
EC
D0.
850.3
5
SL
OV
AK
IA19
9119
95U
pp
erm
idd
le0.
840.2
4
SL
OV
EN
IA19
9219
95H
igh
non
OE
CD
0.85
0.2
2
48

Cou
ntr
yL
egis
lati
on
Dead
lin
eIn
com
eG
rou
pO
rigin
ato
r
firs
t(m
ean
)
Pro
du
ct
pate
nt
(mean
)
SO
UT
HA
FR
ICA
1997
1995
Up
per
mid
dle
0.83
0.6
0
SP
AIN
1992
1995
Hig
hO
EC
D0.
890.4
1
SW
ED
EN
1978
1995
Hig
hO
EC
D0.
870.6
9
SW
ITZ
ER
LA
ND
1977
1995
Hig
hO
EC
D0.
880.7
1
TH
AIL
AN
D19
9920
00L
ower
mid
dle
0.84
0.0
3
TU
NIS
IA20
0020
05L
ower
mid
dle
0.67
0.0
1
TU
RK
EY
1999
2005
Low
erm
idd
le0.
820.1
3
UN
ITE
DA
RA
BE
MIR
AT
ES
2002
2005
Hig
hn
onO
EC
D0.
820.0
1
UN
ITE
DK
ING
DO
M19
4919
95H
igh
OE
CD
0.86
0.7
3
UN
ITE
DS
TA
TE
S17
9019
95H
igh
OE
CD
0.86
0.7
6
UR
UG
UA
Y19
9120
05U
pp
erm
idd
le0.
640.0
2
VE
NE
ZU
EL
A20
0020
00U
pp
erm
idd
le0.
760.0
2
49

B Main Effect of Any Active Patent
Table 13: Main effect of any patentLaunch Price Quantity
b/se b/se b/seExpired patent 0.6019∗∗∗ 0.2448∗∗ 0.1373
(0.0631) (0.1042) (0.1323)On patent 0.8333∗∗∗ 0.4022∗∗∗ 0.4477∗∗
(0.0470) (0.1251) (0.1730)Log(DALY) 0.0267 −0.0618∗ 0.1843∗∗∗
(0.0174) (0.0328) (0.0571)Ln(GDP per capita) 0.0213 0.2929∗∗∗ 0.7758∗∗∗
(0.0473) (0.0996) (0.1346)Life expectancy 0.0166 0.0252 0.0373
(0.0105) (0.0192) (0.0227)Ln(population) 0.0267 0.0310 0.7948∗∗∗
(0.0259) (0.0431) (0.0601)Number of local substitutes 0.0070∗∗∗ 0.0034 0.0145∗∗∗
(0.0015) (0.0069) (0.0047)Price index of ATC class −0.0078 −0.0020
(0.0151) (0.0051)Log originator products in country, t-1 0.2109∗∗∗ 0.0529 0.1112∗∗∗
(0.0076) (0.0373) (0.0410)Intercept −6.6994∗∗∗ −2.6010∗ −5.6639∗∗∗
(0.8172) (1.4233) (1.5929)N 1456176 620330 620330Pseudo R2 .0832Adj. R2 .832 .765
Fixed effectsYear Year YearATC Drug Drug
* p<0.10, ** p<0.05, *** p< .01. Standard errors are clustered by country.
C Main Effect of Any Active Patent with Fixed Effects
D Estimation Results Using Any Patent by Income Group
E Estimation Results Using Any Patent by Income Group and
TRIPs Status
F Estimation Results Using Any Patent with Country*Year FEs
G First-stage IV Estimation Results
H IV Estimation Results Using Any Patent
50

Table 14: Main effect of any patent with country fixed effectsLaunch Price Quantity
b/se b/se b/seExpired patent 0.6037∗∗∗ 0.0352 −0.1738∗∗∗
(0.0552) (0.0354) (0.0533)On patent 0.8928∗∗∗ 0.0854∗∗∗ −0.0019
(0.0398) (0.0295) (0.0413)Log(DALY) 0.0388∗∗∗ −0.0862∗∗∗ 0.2455∗∗∗
(0.0117) (0.0182) (0.0358)Ln(GDP per capita) 0.3196∗∗ −0.4758∗∗∗ 1.0695∗∗∗
(0.1371) (0.1556) (0.2368)Life expectancy 0.0211 −0.0202 0.0740∗
(0.0189) (0.0228) (0.0372)Ln(population) −0.0944 −0.5566∗∗ 1.0191∗
(0.2483) (0.2191) (0.6012)Number of local substitutes 0.0047∗∗∗ 0.0062∗ 0.0135∗∗∗
(0.0013) (0.0032) (0.0039)Price index of ATC class 0.0176∗∗∗ −0.0040
(0.0039) (0.0030)Log originator products in country, t-1 0.2032∗∗∗ −0.0060 0.1050∗∗∗
(0.0079) (0.0157) (0.0246)Intercept −7.6917∗∗∗ 1.4722 −8.5579∗∗
(1.8247) (2.0494) (3.8513)N 1456176 620330 620330Pseudo R2 .0895Adj. R2 .886 .8
Fixed effectsYear Year YearATC Drug Drug
Country Country Country
* p<0.10, ** p<0.05, *** p< .01. Standard errors are clustered by country.
51

Table 15: Estimation results using any patent by income groupLaunch Price Quantity
b/se b/se b/seExpired patent 0.6314∗∗∗ 0.1778∗∗ 0.1409
(0.1693) (0.0775) (0.1493)On patent 1.2067∗∗∗ 0.3592∗∗∗ 0.5812∗∗∗
(0.1693) (0.0987) (0.1782)High nonOECD × expired patent 0.2039 0.1214 0.5497∗∗
(0.1864) (0.1533) (0.2689)Upper middle × expired patent 0.1017 0.2559 −0.1024
(0.1820) (0.1981) (0.1960)Lower middle × expired patent 0.1188 −0.1976 −0.0197
(0.1889) (0.1918) (0.2275)High nonOECD × on patent −0.2853 −0.0841 0.3846
(0.1885) (0.1650) (0.4359)Upper middle × on patent −0.4736∗∗∗ 0.2023 −0.4544∗∗
(0.1726) (0.1984) (0.2206)Lower middle × on patent −0.5278∗∗∗ −0.2328 −0.4156∗
(0.1970) (0.1872) (0.2318)Drug has data exclusivity in country-quarter 0.1124 −0.1040
(0.0858) (0.0865)High nonOECD 0.4034∗∗ −0.1775 −0.8847∗
(0.2046) (0.1791) (0.5003)Upper middle 0.5257∗∗ −0.3907 −0.1651
(0.2064) (0.3859) (0.3459)Lower middle 0.4158∗ −0.4329 −0.4798
(0.2408) (0.7283) (0.5993)Log(DALY) 0.0309∗∗ −0.0735∗∗ 0.1532∗∗∗
(0.0158) (0.0308) (0.0524)Ln(GDP per capita) 0.0554 0.1413 0.6203∗∗∗
(0.0724) (0.2610) (0.2228)Life expectancy 0.0189∗ 0.0231 0.0194
(0.0113) (0.0168) (0.0157)Ln(population) 0.0412 0.0192 0.7638∗∗∗
(0.0263) (0.0501) (0.0640)Number of local substitutes 0.0071∗∗∗ 0.0023 0.0124∗∗
(0.0015) (0.0063) (0.0047)Price index of ATC class −0.0068 −0.0025
(0.0141) (0.0051)Log originator products in country, t-1 0.2097∗∗∗ 0.0473 0.0957∗∗∗
(0.0077) (0.0375) (0.0358)Intercept −7.3829∗∗∗ −1.6642 −3.3308∗∗∗
(0.9726) (1.4473) (1.2185)N 1456176 620330 620330Pseudo R2 .0845Adj. R2 .834 .77
Fixed effectsYear Year YearATC Drug Drug
* p<0.10, ** p<0.05, *** p< .01. Standard errors are clustered by country. The omitted incomegroup is High income OECD.
52

Table 16: Estimation results using any patent by income group and TRIPS statusPrice Quantity Quantityb/se b/se b/se
Expired patent 0.6368∗∗∗ 0.1355∗∗ 0.9134∗∗∗
(0.1694) (0.0590) (0.1933)Pre-TRIPS patent 1.0492∗∗∗ 0.4700∗∗∗ 1.1655∗∗∗
(0.1702) (0.0830) (0.2319)Post-TRIPS patent 1.4035∗∗∗ 0.3894∗∗∗ 1.6729∗∗∗
(0.1661) (0.1102) (0.3046)High nonOECD × Expired patent 0.6565∗∗∗ −0.0500 −1.6490∗∗∗
(0.1496) (0.0939) (0.3127)Upper middle × Expired patent 0.6771∗∗∗ −0.4168∗∗ −0.8859∗∗∗
(0.1636) (0.1800) (0.2921)Lower middle × Expired patent 0.6041∗∗∗ −1.1413∗∗∗ −0.6832
(0.1879) (0.2882) (0.4397)High nonOECD × Pre-TRIPS patent 0.1022 −0.4233∗∗∗ −1.7710∗∗∗
(0.1518) (0.0541) (0.2678)Upper middle × Pre-TRIPS patent 0.1957∗ −0.6529∗∗∗ −0.8033∗∗
(0.1095) (0.1412) (0.3308)Lower middle × Pre-TRIPS patent 0.0520 −1.0839∗∗∗ −1.1020∗∗
(0.1882) (0.1718) (0.4188)High nonOECD × Post-TRIPS patent 0.1107 −0.4275∗∗∗ −1.9051∗∗∗
(0.0938) (0.0735) (0.3076)Upper middle × Post-TRIPS patent 0.0014 −0.5955∗∗∗ −1.2257∗∗∗
(0.1197) (0.1526) (0.3516)Lower middle × Post-TRIPS patent −0.1619 −1.5570∗∗∗ −1.0072∗
(0.1869) (0.4138) (0.6024)Drug has data exclusivity in country-quarter 0.1730∗∗ −0.1659
(0.0858) (0.1168)Log(DALY) 0.0297∗
(0.0156)Ln(GDP per capita) 0.0778
(0.0724)Life expectancy 0.0174
(0.0108)Ln(population) 0.0469∗
(0.0258)Number of local substitutes 0.0055∗∗∗ −0.0060 0.0527∗∗∗
(0.0016) (0.0051) (0.0073)Price index of ATC class −0.0023 0.0069
(0.0049) (0.0052)Log originator products in country, t-1 0.2115∗∗∗ 0.0403 0.3533∗∗∗
(0.0071) (0.0369) (0.0758)Intercept −7.1144∗∗∗ 1.0542∗∗∗ −0.2650
(0.8509) (0.2335) (0.5560)High nonOECD
Upper middle
Lower middle
N 1456176 622988 622988Adj. R2 .829 .678
Fixed effectsYear*Country
Drug
* p<0.10, ** p<0.05, *** p< .01. Standard errors are clustered by country. The omitted incomegroup is High income OECD. 53

Table 17: Estimation results using any patent by income group and TRIPS status, country*yearFEs
Price Quantityb/se b/se
Expired patent −0.0716 −0.0974(0.0538) (0.0825)
Pre-TRIPS patent 0.1145∗∗ 0.0284(0.0492) (0.1004)
Post-TRIPS patent 0.0434 0.3701∗∗∗
(0.0518) (0.1085)High nonOECD × Expired patent 0.3065∗∗∗ 1.2481∗∗∗
(0.0728) (0.1643)Upper middle × Expired patent −0.2817∗∗∗ 1.8503∗∗∗
(0.0645) (0.1019)Lower middle × Expired patent −1.1599∗∗∗ 2.0974∗∗∗
(0.0543) (0.1085)High nonOECD × Pre-TRIPS patent 0.0381 1.1176∗∗∗
(0.0514) (0.1167)Upper middle × Pre-TRIPS patent −0.4829∗∗∗ 1.7506∗∗∗
(0.0478) (0.0748)Lower middle × Pre-TRIPS patent −1.3415∗∗∗ 1.9930∗∗∗
(0.0504) (0.1086)High nonOECD × Post-TRIPS patent 0.1425∗∗∗ 0.7296∗∗∗
(0.0512) (0.1590)Upper middle × Post-TRIPS patent −0.4075∗∗∗ 1.4346∗∗∗
(0.0401) (0.0734)Lower middle × Post-TRIPS patent −1.1855∗∗∗ 1.7188∗∗∗
(0.0719) (0.1029)Drug has data exclusivity in country-quarter −0.0016 −0.2769∗∗∗
(0.0248) (0.0552)Number of local substitutes 0.0054∗ 0.0149∗∗∗
(0.0031) (0.0041)Price index of ATC class 0.0048 −0.0018∗
(0.0034) (0.0010)Log originator products in country, t-1 −0.0032 0.0998∗∗∗
(0.0154) (0.0243)Intercept 0.7970∗∗∗ 0.2129
(0.1258) (0.3288)N 622988 622988Adj. R2 .888 .802
Fixed effectsYear*Country
Drug
* p<0.10, ** p<0.05, *** p< .01. Standard errors are clustered by country. The omitted incomegroup is High income OECD.
54

Table 18: 1st Stage IV Estimation ResultsStage 0 IV first stage regressionsPatented Patented Patented* Patented* Patented*
nonOECD Upper middle Lower middleb/se b/se b/se b/se b/se
Within window 0.1817∗∗∗
(0.0009)Within term 0.0098∗∗∗
(0.0010)Drug has data exclusivity -0.0220∗∗∗ 0.0050∗∗∗ 0.0007∗∗∗ -0.0065∗∗∗ -0.0172∗∗∗
in country-quarter (0.0007) (0.0012) (0.0003) (0.0008) (0.0006)Log(DALY) -0.0018∗∗∗ 0.0029∗∗∗ -0.0011∗∗∗ 0.0032∗∗∗ 0.0017∗∗∗
(0.0004) (0.0007) (0.0002) (0.0004) (0.0004)Ln(GDP per capita) 0.3396∗∗∗ 0.2438∗∗∗ -0.0184∗∗∗ 0.1505∗∗∗ 0.2127∗∗∗
(0.0031) (0.0062) (0.0018) (0.0040) (0.0034)Life expectancy 0.0274∗∗∗ 0.0170∗∗∗ 0.0059∗∗∗ 0.0019∗∗∗ 0.0200∗∗∗
(0.0005) (0.0010) (0.0003) (0.0006) (0.0005)Ln(population) 0.2515∗∗∗ 0.2563∗∗∗ 0.1477∗∗∗ 0.0368∗∗∗ 0.1425∗∗∗
(0.0047) (0.0093) (0.0027) (0.0061) (0.0051)Number of local substitutes 0.0012∗∗∗ 0.0005∗∗∗ 0.0002∗∗∗ 0.0005∗∗∗ -0.0006∗∗∗
(0.00003) (0.0001) (0.00002) (0.00004) (0.0001)Price index of ATC class -0.0001∗ -0.0004∗∗ 0.00004 0.0001 -0.0006∗∗∗
(0.0001) (0.0002) (0.00005) (0.0001) (0.0001)Log originator products 0.0160∗∗∗ 0.0059∗∗∗ 0.0027∗∗∗ 0.0045∗∗∗ 0.0156∗∗∗
in country, t-1 (0.0004) (0.0007) (0.0002) (0.0005) (0.0004)PatentedDrug 0.0982∗∗∗ -0.2430∗∗∗ -0.9019∗∗∗ -1.2048∗∗∗
(0.0261) (0.0076) (0.0170) (0.0143)
PatentedDrug2
0.2902∗∗∗ 0.1111∗∗∗ 0.3004∗∗∗ 0.4392∗∗∗
(0.0164) (0.0048) (0.0108) (0.0090)PatentedDrug*High non-OECD 0.4312∗∗∗ 1.4396∗∗∗ 0.4694 ∗∗∗ 0.5785∗∗∗
(0.0261) (0.0076) (0.0171) (0.0143)PatentedDrug*Upper middle 0.0322∗ 0.1091∗∗∗ 1.4629 ∗∗∗ 0.4849∗∗∗
(0.0173) (0.0050) (0.0113) (0.0095)PatentedDrug*Lower middle 0.1489∗∗∗ 0.1613∗∗∗ 0.5597∗∗∗ 1.5710∗∗∗
(0.0212) (0.0062) (0.0139) (0.0116)Intercept -3.3003∗∗∗ -2.1989∗∗∗ -0.9238∗∗∗ -0.3971∗∗∗ -2.0793∗∗∗
(0.0470) (0.0872) (0.0254) (0.0570) (0.0479)
N 1761836 620330 620330 620330 620330F-statistic 18544.63 1124.43 1091.3 1075.84 728.68Adj. Partial R2 for IVs 0.0098 0.0759 0.0779 0.0759Adj. R2 0.5660 0.5925 0.5853 0.5818 0.4851
Fixed effectsYearDrug
Country
* p<0.10, ** p<0.05, *** p< .01.
55

Table 19: Estimation results using any patent by income groupPrice (OLS) Price (IV) Quantity (OLS) Quantity (IV)
b/se b/se b/se b/seOn patent 0.1205∗∗∗ 0.1978∗∗∗ 0.3464∗∗∗ 0.1570∗∗∗
(0.0330) (0.0251) (0.0596) (0.0428)High nonOECD × on patent 0.0146 0.0059 −0.2928∗ −0.2911∗∗∗
(0.0574) (0.0231) (0.1727) (0.0395)Upper middle × on patent −0.0114 −0.0037 −0.3379∗∗∗ −0.1375∗∗∗
(0.0393) (0.0164) (0.0841) (0.0280)Lower middle × on patent −0.1046∗∗∗ −0.1460∗∗∗ −0.3469∗∗∗ −0.1055∗∗∗
(0.0387) (0.0168) (0.0858) (0.0288)Drug has data exclusivity in country-quarter −0.0075 −0.0088∗∗∗ −0.1659∗∗∗ −0.1609∗∗∗
(0.0216) (0.0031) (0.0441) (0.0052)Active non-product patent −0.0342∗∗ −0.0632∗∗∗ −0.0597∗ −0.0377∗∗∗
(0.0162) (0.0078) (0.0301) (0.0133)Log(DALY) −0.0860∗∗∗ −0.0859∗∗∗ 0.2468∗∗∗ 0.2463∗∗∗
(0.0184) (0.0017) (0.0358) (0.0030)Ln(GDP per capita) −0.4838∗∗∗ −0.5081∗∗∗ 1.0783∗∗∗ 1.0986∗∗∗
(0.1565) (0.0155) (0.2394) (0.0264)Life expectancy −0.0212 −0.0233∗∗∗ 0.0725∗ 0.0756∗∗∗
(0.0230) (0.0025) (0.0378) (0.0043)Ln(population) −0.5706∗∗ −0.5943∗∗∗ 1.0004 1.0467∗∗∗
(0.2211) (0.0240) (0.6059) (0.0410)Number of local substitutes 0.0060∗ 0.0059∗∗∗ 0.0133∗∗∗ 0.0136∗∗∗
(0.0032) (0.0002) (0.0039) (0.0003)Price index of ATC class 0.0175∗∗∗ 0.0175∗∗∗ −0.0041 −0.0039∗∗∗
(0.0039) (0.0004) (0.0030) (0.0007)Log originator products in country, t-1 −0.0045 −0.0047∗∗∗ 0.1063∗∗∗ 0.1043∗∗∗
(0.0155) (0.0018) (0.0247) (0.0031)Intercept 1.7401 1.8630∗∗∗ −6.8743∗ −8.8278∗∗∗
(2.0844) (0.2242) (3.9044) (0.3829)N 620330 620330 620330 620330Pseudo R2
Adj. R2 .886 .886 .8 .8
Fixed effectsYear
CountryDrug
* p<0.10, ** p<0.05, *** p< .01. Standard errors are clustered by country. The omitted incomegroup is High income OECD.
56