Intellectual Capital and Its Impact on Financial Performance: A Study of Oil and Gas Sector of...
16
Available online at www.ilshs.pl International Letters of Social and Humanistic Sciences 2(2) (2015) 125-140 ISSN 2300-2697 Intellectual Capital and Its Impact on Financial Performance: A Study of Oil and Gas Sector of Pakistan Muhammad Arslan*, Rashid Zaman Bahria University Islamabad, PO box 44000, E-8, Islamabad, Pakistan *E-mail address: [email protected] ABSTRACT The study examines the Intellectual Capital (IC) performance of oil and gas sector of Pakistan over the period of 2007 to 2011 and its impact on corporate financial returns. The study uses value added intellectual coefficient (VAICit™) to measure IC performance and its various components of VAICit™ like (HCEit, SCEit and CEEit) and its impact on financial performance (ROEit, ROIit and EPSit). Micro panel data of oil and gas sector registered in KSE-100 index is collected from their consolidated annual reports over the period of 2007 to 2011. The IC performance is measured by Ante Pulic Model (VAICit™) and its effect on corporate returns (ROEit, ROIit and EPSit) is tested by Random Effect Model estimation. Hausman test suggests that study accepts null hypothesis (Chi2. Prop > 0.05) where for ui is uncorrelated with regressor means that random effect is preferred versus alternative fixed effect in all the proposed research models. The study reveals that VA is considered an important component for measuring the VAICit™ performance and it has positive and significant relationship with firm’s profitability (EPSit) and HCEit and SCEit have positive and significant relationship with firm’s financial performance (ROEit and ROIit) respectively. So, this study explores that Intellectual Capital Efficiency (ICE) has relatively larger contribution for measuring the VAICit™ performance where HCEit and SCEit execute substantive role to accelerate the financial performance of oil and gas sector of Pakistan as compare to tangible assets. Keywords: Intellectual Capital; Financial Performance; Financial Performance; Oil and Gas sector, Pakistan 1. INTRODUCTION Prominently, many practitioners, academicians and researchers consider intellectual capital (IC) as a key determinant to enhance value creation efficiency and firm performance. The growing importance of IC in all sectors of economy led the new directions in knowledge base economy especially in oil and gas sector. Oil and gas sector is very crucial for Pakistan’s economy and its importance cannot be overlooked due to growing energy crises. This sector has been phenomenal since 1947. It has played a significant role in development of national GDP whereas Pakistan is meeting about 18% of its oil demands from its local resources.
-
Upload
muhammad-arslan -
Category
Education
-
view
76 -
download
6
Transcript of Intellectual Capital and Its Impact on Financial Performance: A Study of Oil and Gas Sector of...

Available online at www.ilshs.pl
International Letters of Social and Humanistic Sciences
2(2) (2015) 125-140 ISSN 2300-2697
Intellectual Capital and Its Impact on Financial Performance: A Study of Oil and Gas Sector of
Pakistan
Muhammad Arslan*, Rashid Zaman
Bahria University Islamabad, PO box 44000, E-8, Islamabad, Pakistan
*E-mail address: [email protected]
ABSTRACT
The study examines the Intellectual Capital (IC) performance of oil and gas sector of Pakistan
over the period of 2007 to 2011 and its impact on corporate financial returns. The study uses value
added intellectual coefficient (VAICit™) to measure IC performance and its various components of
VAICit™ like (HCEit, SCEit and CEEit) and its impact on financial performance (ROEit, ROIit and
EPSit). Micro panel data of oil and gas sector registered in KSE-100 index is collected from their
consolidated annual reports over the period of 2007 to 2011. The IC performance is measured by Ante
Pulic Model (VAICit™) and its effect on corporate returns (ROEit, ROIit and EPSit) is tested by
Random Effect Model estimation. Hausman test suggests that study accepts null hypothesis (Chi2.
Prop > 0.05) where for ui is uncorrelated with regressor means that random effect is preferred versus
alternative fixed effect in all the proposed research models. The study reveals that VA is considered an
important component for measuring the VAICit™ performance and it has positive and significant
relationship with firm’s profitability (EPSit) and HCEit and SCEit have positive and significant
relationship with firm’s financial performance (ROEit and ROIit) respectively. So, this study explores
that Intellectual Capital Efficiency (ICE) has relatively larger contribution for measuring the VAICit™
performance where HCEit and SCEit execute substantive role to accelerate the financial performance
of oil and gas sector of Pakistan as compare to tangible assets.
Keywords: Intellectual Capital; Financial Performance; Financial Performance; Oil and Gas sector,
Pakistan
1. INTRODUCTION
Prominently, many practitioners, academicians and researchers consider intellectual
capital (IC) as a key determinant to enhance value creation efficiency and firm performance.
The growing importance of IC in all sectors of economy led the new directions in knowledge
base economy especially in oil and gas sector. Oil and gas sector is very crucial for Pakistan’s
economy and its importance cannot be overlooked due to growing energy crises. This sector
has been phenomenal since 1947. It has played a significant role in development of national
GDP whereas Pakistan is meeting about 18% of its oil demands from its local resources.

International Letters of Social and Humanistic Sciences 2(2) (2015) 125-140
-126-
The present growth rate of economy shows that our oil demands will be from 64.5
million tons in 2010-11 to over 361.31 million tons in 2030. Over the last 3 to 4 decades, the
gas sector has played a significant role by making large indigenous discoveries. But due to
growing population and industrial needs this sector would not remain self-sufficient. Pakistan
has large number of reservoirs of oil and gas but it requires a massive foreign and local
investment for the extraction, exploration and refinery of these valuable resources. The
growth of knowledge management has enhanced the importance of IC, therefore, many
organizations similar to energy sector consider IC as a main driver of growth, value creation
and competitive advantage in knowledge base economy (Cabrita and Vaz, 2006). The World
Bank (1998, p. 1) has identified the importance of knowledge and intellectual ability:
“Knowledge is like light. Weightless and intangible, it can easily travel the world,
enlightening the lives of people everywhere”. There has been great evidence for the last
couple of decades that economies are shifting themselves to knowledge generation activities
where knowledge creation, sharing, and dissemination is the main constituent for
organizational growth and survival (OECD, 1996). Such activities in knowledge base
economy put great emphasis on the management of the human capital efficiency through
training and knowledge sharing. Therefore, the aim of present study is to examine and assess
the IC performance in oil and gas sector of Pakistan and its impact on financial returns. This
study also examines the consequent effect of IC on firm’s performance and gives deep
insights how important IC is especially the human capital investment for this sector to reduce
energy crises.
2. LITERATURE REVIEW
The empirical literature reveals that IC has positive and significant impact on future
performance of firms. Tan, Plowman and Hancock (2007) measure the empirical relation of
IC with present and future performance of firms using VAIC™ model and show that IC has
positive and significant association with growth rate and future performance of firms where
IC’s contribution to firm’s performance varies industry to industry. IC is considered as one of
the most important valuable strategic asset for firms. The success and competiveness of firms
are based on management of these strategic assets like human capital, structural capital,
relational capital etc. Tseng and Goo (2005) analyze that organizational success is based on
the efficient management of knowledge based assets that is intellectual assets therefore IC has
positive relationship with present and future corporate value of firm in knowledge base
economy (Pew et al. 2007). Cabrita and Vaz (2005) examine the empirical relationship of IC
with bank’s performance. They also find that human capital, structural capital and relational
capital have substantive relationship with bank’s performance where IC is considered a key
indicator for measuring the value creation efficiency of banks. Goh (2005) explores the
pragmatic findings while measuring the intellectual capital efficiency of Malaysian
commercial banks based on VAIC™ assessment and found that 80 percent efficiency in
VAIC™ performance is attributed by Human Capital Efficiency (HCE) which means that
HCE has relatively larger contribution in measuring VAIC™ performance as compare to SCE
and CEE. Same findings are revealed by Joshi, Cahill and Sidhu (2010) where VAIC™ has
positive and significant relationship with HC to enhance the value creation efficiency of
Australian Owned banks. This study also explored that HCE was a major determinant for
measuring the VAIC™ performance of banks as compare to SCE and CEE and same findings
are explored by (Mohiuddin et al., 2006, Calisir et al., 2010). Maditinos et al., (2011) found
International Letters of Social and Humanistic Sciences 2(2) (2015) 125-140
-127-
that human capital Efficiency (HCE) has significant relationship with financial performance
(ROA). So, investment on human capital is more returnable as compare to SCE and CEE
(Goh 2005; Joshi et el., 2010; Laing et al., 2010; Calisir et al., 2010; Rehman et al., 2011)
where HCE has extensive contribution in measuring VAIC™ performance and has a
positively significant relationship with financial performance.
As a result, companies are conducting a substantive investment on human capital to
upgrade the stock of HC through employee training and knowledge sharing.Therefore, human
capital is more significant and vital than structural and physical assets (Kamath 2008).
Furthermore, HCE is the most significant variable and it has positive and significant
association with both profitability and productivity of pharmaceutical industry of India.
Yalma and Coskun (2007) find the empirical relationship to measure the intellectual capital
performance of banks listed in Istanbul Stock Exchange and asserted that VAIC™ has
positive relationship with profitability of banks. Diez et al., (2010) examine the statistical
significant and positive relationship between intellectual capital efficiency and increased
value creation (sales growth) in Spanish firms where human and structural capital is positively
associated with sales growth.
3. INTELLECTUAL CAPITAL
A brief review of contemporary research identifies that IC has been used as an
intangible and knowledge base asset. Therefore, a sustainable firm performance and
competitive advantage is mainly associated with these knowledge base assets, firm’s
intellectual capabilities and resources which that jointly referred as IC (Bontis 1998, 2001;
Wu et al., 2006). The growing phenomena of IC have been realized by too many
contemporary researchers and policy makers that organization’s success and survival is based
on human capabilities, experience and their skill, innovation process and technology (Stewart,
1997, 2001; Sveiby, 1997). Stewart (1997) defines the IC as valuable intellectual asset which
is the core competency to enhance the growth of organization. Edvinsson and Malone (1997)
defined IC as knowledge that can be transformed to generate value. Porter (1999) argue the
success of any organization in competitive environment is the employment of intellectual
resources.
However, the firm future performance and profitability is based on IC and human
intellectual abilities rather physical and tangible assets (Wood, 2003; Hazlina and Zubaidah,
2008). The term IC and intangible assets are interchangeable to each other therefore; they are
considered as an integral part of organization’s success that may constitute 80 percent in
market value creation (Fornell, 2000). Stewart (1997) defines the IC as valuable intellectual
assets which are the core competencies to lead the growth of organization. The increasingly
importance of IC has recognized it as valuable strategic asset for firm’s sustainable
performance in a competitive advantage (Maditinos et al., 2011). IC is considered a driving
force to gain competitive edge in dynamic environment of globalization which has positive
relationship with firm performance (Tovstiga and Tulugurova 2007). Makki and Lodhi (2008)
analyze that firm’s intellectual capital efficiencies are determined by their profitability.
In many organizations the knowledge management and intellectual resources are very
important for proven growth of these organizations (Boedker et al., 2005). For stock and stake
holders, it is vital to effectively manage the intellectual as well as knowledge base resources.
The prime objective of this study is to measure the intellectual capital performance and to
examine the empirical relationship of IC performance constituents with financial performance

International Letters of Social and Humanistic Sciences 2(2) (2015) 125-140
-128-
indicators. The methodology of study is similar with Tan et al., (2007); Goh (2005); Joshi et
al., (2010); Mohiuddin et al., (2006); Firer and Williams (2003); Rehman et al., (2011);
Kamath (2008); Maditinos et al., (2011) etc. Based on value added intellectual coefficient
(VAIC™), this study analytically examines VAIC™ performance and components Human
Capital Efficiency (HCE), StructuralCapital Efficiency (SCE) and Capital Employed
Efficiency (CEE) and its relationship with financial performance indicators (ROA, REO and
EPS). Sveiby (1997) classifies the IC into three major components.
1. Human Capital
2. Structural Capital
3. Relational Capital
3. 1. Human Capital
Human capital is one the valuable strategic asset. It has enormous contribution in the
field of inventions and innovation therefore, its importance cannot be overlooked in the
knowledge base economy. There has been a growing attention that manpower is considered as
an essential resource for organization success and survival which deliver basis for competitive
advantage in dynamic business environment. These are the intellectual abilities of
organizations’ top management being used for making strategic decisions. HC is the
knowledge, experience, skill and expertise of firms’ employees (Edvinsson and Malone
1997). Diez, Ochoa, Prieto and Santidrian (2010) define HC as firm’s competencies and value
creation efficiencies which are linked by employee’s knowledge, skill and intellectual
capabilities. Sveiby (1997) describes HC as abilities to work in different dimension that
enhance value creation both in tangible and intangible assets. Finally, HC defines as
combined capabilities of firms’ employees which are extracted to find out paramount
solutions of structured and unstructured problems from the knowledge, experience and skill of
individuals (Bontis 1998). HC is considered as one of the integral part of IC and it has a very
deep concern with IC and as well as firms’ performance (Marques and Simon 2003) and
define HC as technical knowledge, experience, Team spirit and leadership abilities of firms’
management.
3. 2. Structural Capital
Structural Capital is second integral part of IC. It refers to innovative process,
technology, databases, patents and copy rights and supportive infrastructure process that
enable human capital to function properly. SC identifies organizations’ processes, technology
and supportive activities to link for value creation efficiency of firm (Carroll and Tansey
2000). So, it is a very key mechanism for transmission and communication of knowledge in
internal and external environment of organization for value creation.
3. 3. Relational Capital
The relational capital is recognized as the relationships with customers, suppliers and
stakeholders that influence the company’s life. Cheng et al (2010) argues that customer
relations are a crucial factor in competitive advantage which result an increase of corporate
performance. Prahalad and Ramaswamy (2000) found that the customers are the source to
increase the competency of organizations. Increase of organizational competency is based on
customer’s relations.

International Letters of Social and Humanistic Sciences 2(2) (2015) 125-140
-129-
4. THEORETICAL FRAMEWORK
After review of extensive literature, the study addresses the following theoretical frame
works.
Theoretical Framework 1
Theoretical Framework 2

International Letters of Social and Humanistic Sciences 2(2) (2015) 125-140
-130-
Hypothesis:
After review of plethora of literature and Ante Public model, the current research paper
addresses the following proposed hypothesis;
H1a: There is a significant and positive association between Human Capital Efficiency
(HCE) and financial performance indicator (ROE).
H1b: There is a significant and positive association between Structural Capital Efficiency
(SCE) and financial performance indicator (ROI).
H1c: There is a significant and positive association between Capital Employed Efficiency
(CEE) and financial performance indicator (EPS).
H1d: There is a significant and positive association between VAIC™ and financial
performance indicators (ROE, ROI and EPS).
H1e: There is a significant and positive association between VA and financial performance
indicators (ROE, ROI and EPS).
5. DATA COLLECTION AND METHODOLOGY
5. 1. Data
Data is collected from 9 companies registered in KSE-100 index under the umbrella of
oil and gas sector. Micro panel data is gathered and assembled from annual reports and its
relevant websites, Karachi Stock Exchange and companies offices over the period of 2007 to
2011.
5. 2. Value Added Intellectual Coefficient (VAIC™) Ante Pulic Model
VAIC™ model is the most modern approach for measuring and evaluating the
performance of intangible and tangible assets. It is a very consistent and valid technique for
measuring the performance of intangible assets that is Intellectual Capital Efficiency (ICE)
which is the composition of human and structural capital efficiency. VAIC™ also measures
and evaluates the efficiency of physical and financial assets. This methodology is developed
by Ante Pulic (1988, 2000) in Austrian Research Centre of IC. Therefore, it is also recognized
as Austrian approach.
Pulic hasused this approach into its various studies Ante Pulic (1997, 1998, 2001 and
2002). Many researchers and practitioners used this methodology for measuring IC
performance like Firer and Williams 2003; Riahi-Belkauui 2003; Mavridis 2004; Goh 2005;
Goo and Tseng 2005;Mavridis 2005; Kujansivu and Lonnqvist 2005; Mohiuddin, Najibullah
and Shahid 2006; Ji-jian, Nai-ping and Yu-sheng 2006; Tan, Plowman and Hancock 2007;
Pew et al.2007; Yalama and Coskun 2007; Kamath 2007 and 2008; Gan and Saleh 2008;
Makki, Lodhi and Rahman 2008; Ting and Lean 2009; Muhammad and Ismail 2009;
Kamukama, Ahiauzu and Ntayi 2010 and 2011; Zeghal and Maaloul 2010; Laing, Dunn and
Lucas 2010; Joshi, Cahill and Sidhu 2010; Diez et al. 2010; Ahangar 2011; Maditinos et al.
2011, Rehman et al., (2011, 2012) etc. VAIC™ is designed to provide information regarding
the value creation efficiencies of bot tangible and intangible assets. So, this model is briefly
given below with its intellectual coefficients.
Output = Total Sale
International Letters of Social and Humanistic Sciences 2(2) (2015) 125-140
-131-
Input = Operating expenses (Input referred to all the operating expenses which are
used to generate the sale other than personal costs).
Value added = Output-Input (VA referred to Output minus Input which is
measured to determine value added efficiency of firms’).
HC = Personal cost (Salaries and Wages), considered as an investment.
HCE = VA/HC (Human Capital Efficiency referred to per unit of value of human
capital)
CA = (Capital invested in physical and financial capital).
CEE = VA/CA (Capital Employed Efficiency referred to per unit value of
physical and financial assets).
SC = VA-HC
SCE = SC/VA (Structural Capital Efficiency referred to per unit value of
structural capital).
VAIC™ = HCE + SCE + CEE (Value Added Intellectual Coefficient)
Table No. 1
Sr.# Oil and Gas Sector VAIC™ Performance
(Rs.)
VAIC™
Ranking
VA (Rs.
Millions)
VA-
Ranking
1 Pakistan Refinery Ltd (PRL) 4497.8808 1 430,956,933 4
2 Attock Refinery Ltd (ARL) 3081.44958 2 344,156,569 7
3 Attock Petroleum Ltd (APL) 2749.21754 3 702,668,873 3
4 National Refinery Ltd (NRL) 2747.05936 4 123,623,116 9
5 Pakistan State Oil (PSO) 1213.93791 5 420,597,257 5
6 Shell Pakistan Ltd 691.586076 6 3,536,352,511 1
7 Mari Gas company Ltd 230.925102 7 401,207,734 6
8 Oil and Gas Development Co.
Ltd (OGDC) 80.1626756 8 199,517,289 8
9 Pakistan Petroleum Ltd (PPL) 78.6211303 9 904,808,901 2
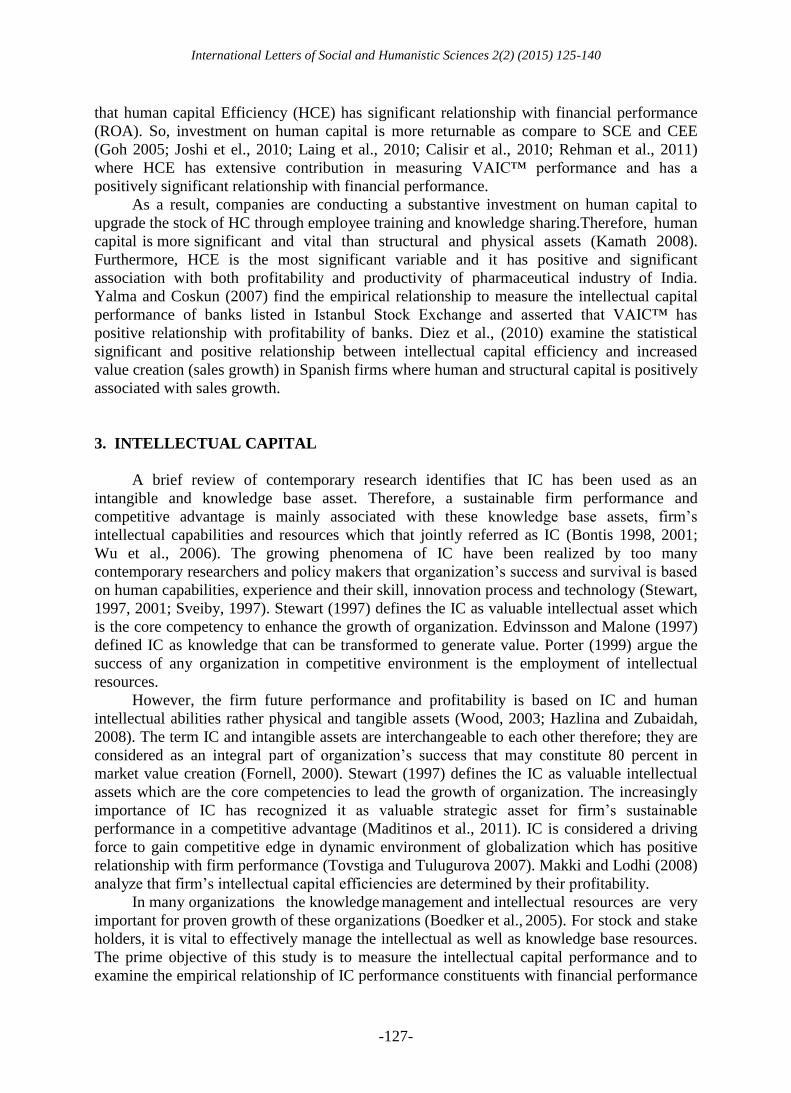
5. 3. Five Year VAIC™ and VA Performance and their Ranking
The Table 1 shows the five year VAIC™ and VA performance and its ranking. The
purpose of ranking is to access the five year performance of IC in oil and gas sector based on
Ante Pulic model. Value Added Intellectual Coefficient (VAIC™) is a key methodology for
measuring the IC performance. The features of this methodology that it not only evaluates the
performance of intangible assets (i.e. Intellectual Capital Efficiency (ICE) which composition
of Human Capital Efficiency and Structural Capital Efficiency) but it also evaluates the
performance of tangible assets consist of Capital Employed Efficiency (CEE). So, VAIC™ is
the composition human capital, structural capital and capital employed which provides the
information about the company value creation efficiency of both tangible and intangible
assets.

International Letters of Social and Humanistic Sciences 2(2) (2015) 125-140
-132-
The Table 1 shows that each company is ranked based on VAIC™ performance. So,
Pakistan Refinery Ltd (PRL) is the most efficient company based on five year VAIC™
performance. It has generated the value of (VAIC™ = PKR-3754.05817) over the period of
2007 to year 2011. This means that if we invest five PKR on company it would generate value
of PKR 3754.05817 over the five and it is ranked at 1st
position being a most efficient
company in oil and gas sector. Followed by Attock Refinery Ltd (ARL) and Attock Petroleum
Ltd (APL) where VAIC™ performance is PKR-3081.44958 and PKR-2749.21754 and placed
at 2nd
and 3rd
position respectively. Whereas the, Pakistan Petroleum Ltd (PPL) is ranked at 9th
position being the least efficient company in oil and gas sector. It has generated the value of
PKR-78.6211303 over the five year. Table 1 also shows five year VA performance in oil and
gas sector. Five year (VA) performance is calculated by summing up each year (VA)
performance. Pakistan Refinery Ltd (PRL) is the most efficient company based on VAIC™
but it is ranked at 4th
position VA performance. It has generated Rs. Millions 430,956,933/.
Attock Refinery Ltd (ARL) is the second most efficient company based on VAIC™
performance but it is ranked at 7th
position based on VA. Shell Pakistan Ltd is placed at 6th
position based on VAIC™. It is the most efficient company based on VA and it is ranked at
1st
position. So, Attock Petroleum Ltd (APL), Pakistan Refinery Ltd (PRL), Pakistan State Oil
(PSO), Mari Gas Company Ltd, Attock Refinery Ltd (ARL), Oil and Gas Development Co.
Ltd (OGDC) and National Refinery Ltd (NRL) are placed at 3rd, 4th, 5th, 6th, 7th, 8th and
9th position respectively based on VA performance.
This shows that Pakistan Refinery Ltd being the most efficient company based on
VAIC™ performance where HCE performs substantial contribution for measuring the
VAIC™ performance as compare to other components of VAIC™. The justification is firm’s
that have potential stock of valuable knowledge asset that is human capital means better
performance of IC to accelerate the financial returns.

International Letters of Social and Humanistic Sciences 2(2) (2015) 125-140
-133-
5. 4. Econometric Methodology for Panel Data
The panel data which is also known as longitudinal or cross-sectional data. In panel
data, the behavior of entities is measured which varies across the time. The micro penal data
is collected from 9 companies belong to oil and gas sector which have relative large market
capitalization or trading volume in Karachi Stock Exchange for last 10 years. The data is
collected and gathered from consolidated audited annual reports, relevant websites and
OGRA (Oil and Gas Regulatory Authority) over the period of 2007 to 2011. Random Effects
Model (REM) is used to measure the empirical relationship between VAIC™ and its
constituents i.e. (HCE, SCE and CEE) with financial performance indicators (ROE, ROI and
EPS). The selection of random effects model is based on Hausman test justifications.
Panel Data Equation
Yit = β0 + β1xit1 +…………… βkxit + uit
5. 5. Hausman Specification Test for Fixed versus Random Effects Model
A Hausman test is used to differentiate between random and fixed effects model
(Hausman, 1978; Greene 1997). The Hausman test suggests where the null hypothesis
preferred model is random effects versus alternative fixed effects to determine whether ui are
correlated or uncorrelated with regressors.
The null hypothesis of Huaman test for ui is uncorrelated with regressors. The results of
study indicate in the all the proposed research models that (Chi2. Prop > 0.05). So, study
accepts the null hypothesis which means that random effects model is preferred. The
justification behind the use of random effects is that variations across the entities are assumed
to be random or uncorrelated with predictor and independent variables.
The equation for random effects models can be written as follows:
1) ROEit = βVAit + α + uit + εit
2) ROIit = βVAit + α + uit + εit
3) EPSit = βVAit + α + uit + εit
4) ROEit = β(VAIC™it) + α + uit + εit
5) ROIit = β (VAICit ) + α + uit + εit
6) EPSit = β(VAIC™it) + α + uit + εit
7) ROEit = β1(HCE it) + β2(SCE it) + β3(CEE it) + α + uit + εit
8) EPSit = β1 (HCE it) + β2 (SCE it) + β3 (CEE it) + α + uit + εit
9) EPSit = β1 (HCE it) + β2 (SCE it) + β3 (CEE it) + α + uit + εit
where,
αi (I = 1….n) = the unidentified intercept/cut off for the each company. ROEitROIit and
EPSit = the dependent variables for random effects models 1 to 9. VAit, VAIC™it, HCEit,
SCEit and CEEit = independent variable(s) for random effects models 1 to 9.
I = Company and t = time. β is coefficient(s), and uit is the error term between the entity, εit
within the entity error “In the case of time-series cross-sectional data, the interpretations of
the beta coefficients would be” for a known company, as (VA), (VAIC™), HCE, SCE and
CEE changes across the time by one unit, ROE, ROI and EPS increases or decreases by β
units. The rational for selection of random effect model that variations across the entities are
assumed to be random and uncorrelated with the predictor or independent variable.

International Letters of Social and Humanistic Sciences 2(2) (2015) 125-140
-134-
6. RESULTS AND ANALYSIS
The Table no. 2 represents the empirical results of proposed research models M1, M2,
and M3 for ROE, ROI and EPS. The proposed model M1 for ROE, ROI and EPS postulates
the results of VA with financial performance indicators. Value Added is a very crucial
ingredient for measuring the VAIC™ performance and its constituents. The results of study
demonstrate that VA has positive and significant relationship with ROI (β = 0.072169) and
EPS (β = 0.245322) at (p < 0.10) respectively and negative association with ROE. The F-test
represents the overall fitness of model. The F (Prob.) shows that proposed model for ROI and
EPS is significant at (p < 0.10).
The proposed model M2 for ROE, ROI and EPS shows the empirical relationship of
VAIC™ with financial performance indicators. The results of study reveal that VAIC™ has
significant (P < 0.05) and positive (β = 0.215450) relationship with profitability (EPS). Value
Added Intellectual Coefficient (VAIC™) has significant relationship with ROI at (P < 0.10)
but this relationship is measured statistically negative (β = -0.222645) with ROI and positive
(β = 0.065707) relationship with ROE. The proposed model M3 for ROE, ROI and EPS
demonstrate the pragmatic relationship of VAIC™ performance components (HCE, SCE and
CEE) with financial indicators (ROE, ROI and EPS) of oil and gas sector.
This model represents that Human Capital Efficiency (HCE) and Structural Capital
Efficiency (SCE) have a substantive positive (β = 0.468245; β = 0.706156) and a significant
relationship with ROE at (P < 0.05) and a substantive negative (β = -42.50043) but a
significant relationship is observed between Capital Employed Efficiency (CEE) and ROE at
(p < 0.01). However, M3 for ROI shows that HCE and SCE have a positive (β = 2.020140; β
= 1.294653) and significant association with ROI at (P < 0.05) respectively. CEE has a
significant (P < 0.01) and statistically negative (β = -58.34709) relationship with ROI.
Whereas, the M3 for EPS suggests that only SCE has positive (β = 0.605685) and significant
Dependent
Independent M1 M2 M3 M1 M2 M3 M1 M2 M3
Constant 1.751921 1.337056 -0.139367 3.780809 1.542411 -0.777253 -0.487005 0.996595 0.779821
VAit 0.8104 0.0769** 0.0845***
VAIC™it 0.4475 0.0575** 0.0110**
HCEit 0.0233** 0.0499** 0.3739
SCEit 0.0465** 0.2027 0.0773**
CEEit 0.0100* 0.0064* 0.3588
R2 0.00138 0.013799 0.168439 0.073239 0.082142 0.256585 0.068991 0.136715 0.206099
Adj. R2 -0.0218144 -0.009136 0.107593 0.051686 0.060797 0.202189 0.04734 0.116639 0.148009
F- Statistic 0.059409 6.61 2.768281 3.39814 3.848221 4.716968 3.18645 6.809763 3.547915
Prob. (F-Stat) 0.808591 0.132 0.053771*** 0.072169*** 0.05629*** 0.006424* 0.081306*** 0.012424** 0.022550**
Coefficients -0.033898 0.065707 0.468245 0.072169 -0.222645 0.516642 0.245322 0.21545 0.173647
0.706156 0.573052 0.605685
-42.50043 -58.34709 -14.22242
T-Statistics -0.241443 0.766587 2.356503 2.509336 -1.952052 2.02014 1.76588 2.658933 0.899035
2.05335 1.294653 1.811858
-2.695544 -2.87521 -0.927986
Durbin Watson 0.691792 0.705993 0.904998 0.760047 0.772567 1.059664 1.481002 1.687753 1.964228
Hausman
Chi Sq. Statistics2.552532 0.00002 2.566598 0.43799 1.282217 3.576149 0.080777 3.779143 6.405457
Hausman 0.1101>0.05 0.9965>0.05 0.4634>0.05 0.051>0.05 0.2575>0.05 0.311>0.05 0.7762>0.05 0.0519>0.05 0.0935>0.05
(Prob.) (Reject Null (Reject Null (Reject Null (Reject Null (Reject Null (Reject Null (Reject Null (Reject Null (Reject Null
Hypothesis) Hypothesis) Hypothesis) Hypothesis) Hypothesis) Hypothesis) Hypothesis) Hypothesis) Hypothesis
ROIitROEit EPSit
*, ** and *** presents significance level at 1%, 5% and 10% respectively.
Table No. 2

International Letters of Social and Humanistic Sciences 2(2) (2015) 125-140
-135-
(P < 0.05) relationship with profitability (EPS). Whereas, HCE has positive (β = 0.173647)
and CEE has negative (β = -14.22242) relationship with EPS but these are not statistically
significant. The values of R2 represent about 16.84%, 25.66% and 20.61% variations are
explained by predictor’s variables (HCE, SCE and CEE) in outcome variables (ROE, ROI and
EPS).
7. CONCLUSIONS
Drawing upon a sample of panel data, this study empirically examines and explores the
performance of IC and its components with financial performance indicators of oil and gas
sector. There are number of classifications and measures to explore the IC performance. For
that purpose the Pulic model (VAIC™) is used for IC performance. This model is being used
by many researchers and practitioners in their numerous studies. VAIC™ is considered as
important tool to examine the value creation efficiency of tangible and intangible assets. For
that purpose Value Added (VA) plays a vital role for measuring the VAIC™ performance and
its constituents. This pragmatic analysis and relationship was undertaken with the help of
fixed and random effects where hausman test results suggest that random effect model is
preferred on fixed effect model and ui is uncorrelated with regressors. Intellectual Capital
consider as a source of sustainable competitive advantage for firm’s performance. Therefore,
the results of study are consistent with previous research (Tan et al 2007; Cabrita and Vaz
2005; Tseng and Goo 2005; Maviridis 2005; Goh 2005; Rehman et al 2011; Ji-Jian et al 2006;
Cabrita and Bontis 2008; Makki et al 2008; Diez et al 2010; Firer and Williams 2003;
Kamukama et al 2011; Laing et al 2010) The empirical results reveal the following aspects of
the relationship:
1. VA has a positive and significant relationship with ROI (β = 0.072169) and EPS (β =
0.245322) at (p < 0.10) respectively and negative association with ROE.
2. Value Added Intellectual Coefficient (VAIC™) has significant (P< 0.05) and positive (β =
0.215450) relationship with profitability (EPS). Value Added Intellectual Coefficient
(VAIC™) has significant relationship with ROI at (P < 0.10) but this relationship is
statistically negative (β = -0.222645) with ROI and positive (β = 0.065707) relationship with
ROE.
3. Human Capital Efficiency (HCE) and Structural Capital Efficiency (SCE) perform
fundamental role to enhance the Intellectual Capital Efficiency (ICE) of intangible assets of a
firm performance. This study shows that HCE and SCE have a positive and significant
relationship with ROE. HCE has relatively larger contribution for measuring the VAIC™
performance in oil and gas sector as compare to other components of VAIC™. This
performance of HCE varies industry by industry and country to country. Due to that reason
HCE has a positive and significant relationship with ROE and ROI (P < 0.05). This means
that human and structural capital perform substantive role for measuring VAIC™
performance. Intellectual Capital Efficiency(ICE) which is the composition of HCE and SCE
have relatively substantive contribution for measuring VAIC™ performance and to accelerate
the financial performance of this sector as compare to tangible assets. HCE has relatively
large contribution for measuring the ICE and VIAC™ performance as compare to other
components of VAIC™ and tangible assets. Therefore, it has substantive relationship with
firm’s performance and its efficiency.
International Letters of Social and Humanistic Sciences 2(2) (2015) 125-140
-136-
Limitations and Future Research of Study
There are also certain limitations to this study. Stahle, Stahle and Aho (2011) found
some critical draw backs in Ante Pulic methodology (VAIC™) and exposed that VAIC™
only indicates the efficiency of the firm’s labour and capital investment (physical investment)
and has nothing to discuss about IC performance in its true sense. The results of Pulic studies
and its subsequent literature do not provide any logical deduction to support that VAIC™ and
its constituents have any relationship with firm’s performance. VAIC™ methodology has
severe calculation and validity problems particularly in calculation of Intellectual Capital
Efficiency (Human and Structural Efficiency) and also it does not deal with relational capital.
Therefore, future researcher must consider these limitations in their studies. Regardless,
validity and inherent limitations of VAIC™ authors proposed that it is a suitable approach for
measuring IC performance as compare to other financial and accounting approaches. Further,
future researchers would get better results by increasing the size and length of period. Pulic
methodology is a pure accounting technique for measuring the IC performance and use to
extract data from consolidated annual reports. Whereas, different countries used different
accounting practices which may influences the results.
References
[1] Bontis, N. 1998. Intellectual capital: an exploratory study that develops measures and
models. Management Decision, 36(2), 63-76.
[2] Bontis, N. 2001. Assessing knowledge assets: a review of the models used to measure
intellectual capital. International Journal of Management Review, 3(1), 41-60.
[3] Beodker, C., Guthrie, J. and Cuganesan, S. 2005. The strategic significance of human
capital information in annual reporting. Journal of Human Resource Costing and
Accounting, 8(2), 7-22.
[4] Cabrita, M. and Vaz, J. 2006. Intellectual capital and value creation: Evidence from the
Portuguese Banking Industry. The Electronic Journal of Knowledge Management, 4(1),
11-20.
[5] Cabrita, M.D.R. and Bontis, N. 2008. Intellectual capital and business performance in the
Portugese banking industry.Int. J. Technology Management, 43, 1-3.
[6] Calisir F., Gumussoy C.A., Bayraktaroglu A.E. and Deniz E. 2010. Intellectual capital in
the quoted Turkish ITC sector. Journal of Intellectual Capital, 11(4), 537-553.
[7] Carroll, R.F. and Tansey, R.R. 2000. Intellectual capital in the new Internet economy – its
meaning, measurement and management for enhancing quality. Journal of Intellectual
Capital, 1(4), 296-312.
[8] Cheng M.Y., Lin J.Y., Hsiao T.Y. and Lin T.W. (2010). Invested resource, competitive
intellectual capital, and corporate performance. Journal of Intellectual Capital, 11(4),
433-450.
[9] Diez, J.M., Ochoa, M.L., Prieto, M.B. and Santidrian, A. 2010. Intellectual Capital and
value creation in Spanish firms. Journal of Intellectual Capital, 11(3), 348-367.

International Letters of Social and Humanistic Sciences 2(2) (2015) 125-140
-137-
[10] Edvinsson, L. and Malone, M.S. 1997. Intellectual Capital: Realizing Your Company’s
True Value By Findings Its Hidden Brainpower. Harper Collins Publishers, New York,
NY.
[11] Firer, S. and Williams, S. M. 2003. Intellectual capital and traditional measures of
corporate performance. Journal of Intellectual Capital, 4(3), 348-360.
[12] Fornell, C. 1992. A national customer satisfaction barometer: the Swedish experience.
Journal of Marketing, 55, 1-22.
[13] Goh, P.C. 2005. Intellectual capital performance of commercial banks in Malaysia.
Journal of Intellectual Capital, 6(3), 385-396.
[14] Hazlina, H. and Zubaidah, Z.A. 2008. Relationship between intellectual capital and
firms’ performance: evidence from public listed companies in Malaysia, Proceedings of
International Accounting Business Conference, Johor Bahru, Malaysia.
[15] Ji-Jian, Z., Nai-Ping, Z. and Yu-Sheng, K. 2006-Oct. Study on intellectual Capital and
Enterprise’s Performance. Journal of Modern Accounting and Auditing, 2(10), 35-39.
[16] Joshi, M., Cahill D. and Sidhu J. 2010. Intellectual Capital Performance in the banking
sector: An assessment of Australian owned banks. Journal of Human Resource Costing
and Accounting, 14(2), 151-170.
[17] Kamath, G.B. 2008. Intellectual capital and corporate performance in Indian
pharmaceutical industry. Journal of Intellectual Capital, 9(4), 684-704.
[18] Kamukama, N., Ahiauzu, A. and Ntayi, J.M. 2011. Competitive advantage: mediator of
intellectual capital and performance. Journal of Intellectual Capital, 12(1), 152-164.
[19] Laing, G., Dunn, J. and Lucas, S.H. 2010. Applying the VAIC™ model to Australian
hotels. Journal of Intellectual Capital, 11(3), 269-283.
[20] Maditinos, D., Chatzoudes, D., Tsairidis, C. and Theriou G. 2011. The impact of
intellectual capital on firms’ market value and financial performance. Journal of
Intellectual Capital, 12(1), 132-151.
[21] Makki, M.A.M. and Lodhi, S.A. 2008. Impact of intellectual capital efficiency on
profitability (a case study of LSE25 companies).The Lahore Journal of Economics,
13(2), 81-98.
[22] Marques, D.P. and Simon, F.J.G. 2003. Validating and measuring IC in the
biotechnology and telecommunication industries. Journal of Intellectual Capital, 4(3),
332-347.
[23] Maviridis, D.G. 2005. Intellectual capital Performance Determinants and globalization
status of Greek Listed firms. Journal of Intellectual Capital, 6(1), 127-140.
[24] Mohiuddin, M., Najibullah, S. and Shahid, A.I. 2006. November –December. An
Exploratory Study on Intellectual Capital Performance of the Commercial Banks in
Bangladesh. The Cost and Management, 34(6), 40-54.
[25] OECD 1996. The Knowledge-based Economy, Organization for Economic Co-operation
and Development, Paris.
[26] Prahalad, C.K. and Ramaswamy, V. 2000. Co-opting customer competence. Harvard
Business Review, 78(1), 79-87.

International Letters of Social and Humanistic Sciences 2(2) (2015) 125-140
-138-
[27] Porter, M.E. 1999. Creating advantage. Executive Excellence, 11, 13-14.
[28] Pulic, A. 1998. Measuring the performance of intellectual potential in knowledge
economy. available at: www.measuring-ip.at/OPapers/Pulic/Vaictxt/vaictxt.html
[29] Pulic, A. 2000. VAIC – an accounting tool for IC management. available at:
www.measuring-ip.at/Papers/ham99txt.htm
[30] Ståhle, P., Ståhle, S. and Aho, S. 2011. Value added intellectual coefficient (VAIC): a
critical analysis. Journal of Intellectual Capital, 12(4), 531–551.
[31] Stewart, T. 1997. Intellectual Capital: The New Wealth of Organizations. Doubleday/
Currency, New York, NY.
[32] Stewart, T.A. 2001. The Wealth of Knowledge: Intellectual Capital and the Twenty-first
Century Organization, Doubleday, New York, NY.
[33] Sveiby, K.E. 1997. The New Organizational Wealth: Managing and Measuring
Knowledge-based Assets, Berrett- Koehler, San Francisco, CA.
[35] Tovstiga, G. and Tulugurova, E. 2007. Intellectual capital practices and performance in
Russian enterprises. Journal of Intellectual Capital, 8(4), 695-707.
[35] Tan, H.P., Plowman, D. and Hancock, P. 2007. Intellectual capital and financial returns
of companies. Journal of Intellectual Capital, 8(1), 76-95.
[36] Tseng, C.Y. and Goo, Y.J.J. 2005. Intellectual capital and corporate value in an
emerging economy: empirical study of Taiwanese manufacturers. R & D Management,
35(2), 187-201.
[37] World Bank 1998. “Knowledge for development”, World Development Report, World
Bank, Washington, DC.
[38] Wood, J. 2003. Australia: an underperforming knowledge nation? Journal of Intellectual
Capital, 4(2), 144-164.
[39] Wu, W.Y., Tsai, J.J., Cheng, K.Y. and Lai, M. 2006. Assessment of intellectual capital
management in Taiwanese IC design companies: using DEA and the Malmquist
productivity index. R&D Management, 35(2), 531-45.
[40] Yalma, A. and Coskun, M. 2007. Intellectual Capital Performance of quoted banks on
the Istanbul stock exchange market. Journal of Intellectual Capital, 8(2), 256-271.
( Received 25 October 2014; accepted 04 November 2014 )

International Letters of Social and Humanistic Sciences 2(2) (2015) 125-140
-139-
Appendix
Years ID Oil and Gas Sector VAIC HCE SCE CEE VA
2007 1 AttockRefinary Ltd
(ARL) 541.9131 539.083 1.832027 0.998145 58,969,207
2008 1 AttockRefinary Ltd
(ARL) 754.3787 751.5514 1.828577 0.998669 91,577,293
2009 1 AttockRefinary Ltd
(ARL) 523.0159 520.2994 1.718416 0.998078 76,448,109
2010 1 AttockRefinary Ltd
(ARL) 554.0922 551.5921 1.501906 0.998187 87,994,939
2011 1 AttockRefinary Ltd
(ARL) 708.0497 705.2304 1.820683 0.998582 115,967,385
2007 2 Pakistan Refinary Ltd
(PRL) 765.3862 1240.056 3.983115 0.999194 57,254,941
2008 2 Pakistan Refinary Ltd
(PRL) 1245.038 1240.056 3.983115 0.999194 94,686,923
2009 2 Pakistan Refinary Ltd
(PRL) 959.1699 955.8137 2.357335 0.998954 76,770,953
2010 2 Pakistan Refinary Ltd
(PRL) 705.3682 701.8914 2.478159 0.998575 76,475,284
2011 2 Pakistan Refinary Ltd
(PRL) 844.4822 839.6311 3.852208 0.998809 96,223,409
2007 3 National Refinary Ltd
(NRL) 496.3294 491.9975 3.333979 0.997967 108,226,158
2008 3 National Refinary Ltd
(NRL) 574.4937 570.3935 3.101936 0.998247 144,564,521
2009 3 National Refinary Ltd
(NRL) 563.2708 558.9917 3.280861 0.998211 138,926,778
2010 3 National Refinary Ltd
(NRL) 534.3874 530.7766 2.612742 0.998116 134,919,688
2011 3 National Refinary Ltd
(NRL) 578.578 574.4748 3.10493 0.998259 176,031,728
2007 4 Mari Gas Company
Limited 61.78909 58.47105 2.335141 0.982898 21,438,470
2008 4 Mari Gas Company
Limited 51.27547 48.65228 1.643746 0.979446 20,696,243
2009 4 Mari Gas Company
Limited 40.75542 38.53714 1.244229 0.974051 25,446,345
2010 4 Mari Gas Company
Limited 41.61862 39.42275 1.221238 0.974634 26,760,281
2011 4 Mari Gas Company
Limited 35.48649 33.40632 1.110105 0.970066 29,281,777
2007 5 Oil and Gas
Development Co. ltd 18.78192 17.36454 0.474962 0.942411 61,430,769
2008 5 Oil and Gas
Development Co. ltd 18.57162 17.09693 0.533176 0.94151 80,279,472
2009 5 Oil and Gas
Development Co. ltd 13.90863 12.58047 0.407647 0.920512 72,558,106

International Letters of Social and Humanistic Sciences 2(2) (2015) 125-140
-140-
2010 5 Oil and Gas
Development Co. ltd 13.48893 12.19316 0.37778 0.917987 86,461,733
2011 5 Oil and Gas
Development Co. ltd 15.41158 14.02498 0.457897 0.928699 119,867,177
2007 6 Pakistan State Oil (PSO) 209.9867 203.5291 5.462475 0.995087 408,250,702
2008 6 Pakistan State Oil (PSO) 242.4765 236.9372 4.543586 0.995779 577,535,268
2009 6 Pakistan State Oil (PSO) 253.7426 248.1023 4.644287 0.995969 712,533,301
2010 6 Pakistan State Oil (PSO) 277.3676 272.0663 4.304912 0.996324 870,658,805
2011 6 Pakistan State Oil (PSO) 230.3645 225.6862 3.682803 0.995569 967,374,435
2007 7 Attock Petroleum Ltd
(APL) 567.6575 561.1221 5.537164 0.998218 49,744,594
2008 7 Attock Petroleum Ltd
(APL) 551.9415 547.0843 3.859059 0.998172 59,866,884
2009 7 Attock Petroleum Ltd
(APL) 490.3477 485.4985 3.851228 0.99794 70,363,296
2010 7 Attock Petroleum Ltd
(APL) 530.4566 525.0469 4.411636 0.998095 94,597,175
2011 7 Attock Petroleum Ltd
(APL) 608.8143 602.643 5.172956 0.998341 126,635,785
2007 8 Pakistan Petroleum Ltd 14.31134 12.9166 0.472162 0.92258 23,782,400
2008 8 Pakistan Petroleum Ltd 14.84064 13.4296 0.485506 0.925538 29,627,145
2009 8 Pakistan Petroleum Ltd 17.05004 15.62631 0.487725 0.936005 40,440,276
2010 8 Pakistan Petroleum Ltd 15.34677 14.00087 0.417321 0.928576 44,895,211
2011 8 Pakistan Petroleum Ltd 17.07234 15.64666 0.489582 0.936089 60,772,257
2007 9 Shell Pakistan Ltd 130.5232 125.2291 4.302083 0.992015 125,672,142
2008 9 Shell Pakistan Ltd 145.7704 140.9523 3.825241 0.992905 151,727,656
2009 9 Shell Pakistan Ltd 111.7091 105.6608 5.057793 0.990536 170,213,604
2010 9 Shell Pakistan Ltd 132.7555 126.1373 5.626163 0.992072 216,593,263
2011 9 Shell Pakistan Ltd 170.8278 164.9395 4.89436 0.993937 240,602,236