INTEGRATION OF V2V-AEB SYSTEM WITH WEARABLE CARDIAC ...
100
INTEGRATION OF V2V-AEB SYSTEM WITH WEARABLE CARDIAC MONITORING SYSTEM AND REDUCTION OF V2V-AEB SYSTEM TIME CONSTRAINTS A Thesis Submitted to the Faculty of Purdue University by Shalabh Bhatnagar In Partial Fulfillment of the Requirements for the Degree of Master of Science in Electrical and Computer Engineering August 2017 Purdue University Indianapolis, Indiana
Transcript of INTEGRATION OF V2V-AEB SYSTEM WITH WEARABLE CARDIAC ...

INTEGRATION OF V2V-AEB SYSTEM WITH WEARABLE CARDIAC
MONITORING SYSTEM AND REDUCTION OF V2V-AEB SYSTEM TIME
CONSTRAINTS
A Thesis
Submitted to the Faculty
of
Purdue University
by
Shalabh Bhatnagar
In Partial Fulfillment of the
Requirements for the Degree
of
Master of Science in Electrical and Computer Engineering
August 2017
Purdue University
Indianapolis, Indiana

ii
THE PURDUE UNIVERSITY GRADUATE SCHOOL
STATEMENT OF COMMITTEE APPROVAL
Dr. Stanley Yung-Ping Chien, Chair
Department of Electrical and Computer Engineering
Dr. Yaobin Chen
Department of Electrical and Computer Engineering
Dr. Lauren Christopher
Department of Electrical and Computer Engineering
Approved by:
Dr. Brian King
Head of the Graduate Program

iii
To follow every path one needs some light. I would like to thank all the people who
were my lights.
I want to thank and dedicate my thesis to my family and my advisor. A special
gratitude to my loving and supporting parents Rashmi Bhatnagar and Rakesh
Bhatnagar who taught me the meaning of life and never giving up attitude. My
sister Trisha Srivastava and my brother Sarvesh Bhatnagar never left my side and
were always there when I needed someone. I am fortunate to have such a great
loving parents and family who have groomed me and helped me at every step of life.

iv
ACKNOWLEDGMENTS
I want to express my gratitude to my supervisor Dr. Stanley Yung-Ping Chien
for helping and supporting me in my thesis and for all the things he has done for
me in past two years. I would also like to thank you for helping me to develop my
technical skills and valuable lessons you taught me, which I will nourish my entire
life. I would also like to thank Dr. Yaobin Chen and Dr. Lauren Christopher who
are my committee members in my final defense, for their great recommendations and
suggestions during the preparation of my thesis.

v
TABLE OF CONTENTS
Page
LIST OF TABLES . . . . . . . . . . . . . . . . . . . . . . . . . . . . . . . . . . vii
LIST OF FIGURES . . . . . . . . . . . . . . . . . . . . . . . . . . . . . . . . . viii
SYMBOLS . . . . . . . . . . . . . . . . . . . . . . . . . . . . . . . . . . . . . . x
ABBREVIATIONS . . . . . . . . . . . . . . . . . . . . . . . . . . . . . . . . . . xi
ABSTRACT . . . . . . . . . . . . . . . . . . . . . . . . . . . . . . . . . . . . . xii
1 INTRODUCTION . . . . . . . . . . . . . . . . . . . . . . . . . . . . . . . . 1
1.1 Background . . . . . . . . . . . . . . . . . . . . . . . . . . . . . . . . . 4
1.1.1 Vehicle to Vehicle Communication . . . . . . . . . . . . . . . . . 4
1.1.2 Autonomous Emergency Braking . . . . . . . . . . . . . . . . . 6
1.2 V2V-AEB System . . . . . . . . . . . . . . . . . . . . . . . . . . . . . . 7
1.2.1 PreScan . . . . . . . . . . . . . . . . . . . . . . . . . . . . . . . 9
1.2.2 V2V-AEB Architecture . . . . . . . . . . . . . . . . . . . . . . . 11
1.2.3 V2V-AEB Simulation Model . . . . . . . . . . . . . . . . . . . . 14
1.3 Thesis Organization . . . . . . . . . . . . . . . . . . . . . . . . . . . . . 14
2 INTEGRATING V2V-AEB WITH CARDIAC MONITORING SYSTEM . . 17
2.1 Literature Review . . . . . . . . . . . . . . . . . . . . . . . . . . . . . . 18
2.2 Methodology . . . . . . . . . . . . . . . . . . . . . . . . . . . . . . . . 19
2.3 Analyze the Pre-recorded Dataset . . . . . . . . . . . . . . . . . . . . . 21
2.3.1 Bifurcate the pulse rates of a particular user according to mo-tion types. . . . . . . . . . . . . . . . . . . . . . . . . . . . . . . 22
2.3.2 Find normal and abnormal heart beat patterns . . . . . . . . . 29
2.3.3 Verification of abnormal heart rate . . . . . . . . . . . . . . . . 32
2.4 Adapting Intelligent Cardiac Monitoring system in V2V-AEB . . . . . 36
2.4.1 Simulation . . . . . . . . . . . . . . . . . . . . . . . . . . . . . . 38

vi
Page
2.4.2 Hardware Model . . . . . . . . . . . . . . . . . . . . . . . . . . 39
3 EFFECT OF DELAY IN V2V-AEB . . . . . . . . . . . . . . . . . . . . . . . 43
3.1 Mathematical Model to Reduce Effect of Delay . . . . . . . . . . . . . 46
3.2 Algorithm to Reduce Effect of Delay . . . . . . . . . . . . . . . . . . . 56
3.3 Result . . . . . . . . . . . . . . . . . . . . . . . . . . . . . . . . . . . . 58
4 HANDLING DELAY IN V2V-AEB . . . . . . . . . . . . . . . . . . . . . . . 61
4.1 Optimizing Vehicle Information . . . . . . . . . . . . . . . . . . . . . . 62
4.2 Optimizing Pedestrian Information . . . . . . . . . . . . . . . . . . . . 63
4.3 Grouping of Pedestrians . . . . . . . . . . . . . . . . . . . . . . . . . . 69
4.3.1 Working of the system . . . . . . . . . . . . . . . . . . . . . . . 70
4.3.2 Result . . . . . . . . . . . . . . . . . . . . . . . . . . . . . . . . 74
4.4 Jamming of Network . . . . . . . . . . . . . . . . . . . . . . . . . . . . 74
4.5 Message Confidence . . . . . . . . . . . . . . . . . . . . . . . . . . . . . 78
5 CONCLUSION AND FUTURE WORK . . . . . . . . . . . . . . . . . . . . 80
5.1 Conclusion . . . . . . . . . . . . . . . . . . . . . . . . . . . . . . . . . . 80
5.2 Contributions . . . . . . . . . . . . . . . . . . . . . . . . . . . . . . . . 81
5.3 Future work . . . . . . . . . . . . . . . . . . . . . . . . . . . . . . . . . 82
REFERENCES . . . . . . . . . . . . . . . . . . . . . . . . . . . . . . . . . . . . 83

vii
LIST OF TABLES
Table Page
1.1 Types of time delay in V2V-AEB . . . . . . . . . . . . . . . . . . . . . . . 3
1.2 Standard applications of V2V . . . . . . . . . . . . . . . . . . . . . . . . . 5
2.1 Table for average heart rates [26] . . . . . . . . . . . . . . . . . . . . . . . 30
2.2 Matrix A: to study the abnormality in heart rate . . . . . . . . . . . . . . 33
3.1 Bifurcation of delay (D) . . . . . . . . . . . . . . . . . . . . . . . . . . . . 44
3.2 Algorithm to reduce effect of delay . . . . . . . . . . . . . . . . . . . . . . 57
4.1 Algorithm to determine which pedestrian information should be sent . . . 69
4.2 Matrix for pedestrian information . . . . . . . . . . . . . . . . . . . . . . . 71
viii
LIST OF FIGURES
Figure Page
1.1 The advantages of V2V-PAEB system . . . . . . . . . . . . . . . . . . . . 9
1.2 Overview of the V2V-AEB system . . . . . . . . . . . . . . . . . . . . . . 10
1.3 The architecture of the V2V-AEB system . . . . . . . . . . . . . . . . . . 12
1.4 The V2V-PAEB Simulation model . . . . . . . . . . . . . . . . . . . . . . 15
1.5 The V2V-AEB simulation scenario . . . . . . . . . . . . . . . . . . . . . . 16
2.1 Processing unit of Cardiac monitoring system. . . . . . . . . . . . . . . . . 20
2.2 Acceleration sensor data . . . . . . . . . . . . . . . . . . . . . . . . . . . . 24
2.3 A KNN algorithm example . . . . . . . . . . . . . . . . . . . . . . . . . . . 24
2.4 Normalization of relative acceleration . . . . . . . . . . . . . . . . . . . . . 27
2.5 Classification using the KNN algorithm from relative acceleration . . . . . 28
2.6 Detailed system diagram . . . . . . . . . . . . . . . . . . . . . . . . . . . . 34
2.7 Heart attack detection . . . . . . . . . . . . . . . . . . . . . . . . . . . . . 35
2.8 Integration of V2V-AEB and Intelligent cardiac monitoring system . . . . 36
2.9 Implementation process of Cardiac Monitoring System(Trigger signal-Time) 38
2.10 Heart rate sensor module . . . . . . . . . . . . . . . . . . . . . . . . . . . . 40
2.11 Connection of heart rate sensor module with FRDM K-64 . . . . . . . . . 41
2.12 Real time pulse rate using FRDM K64 . . . . . . . . . . . . . . . . . . . . 42
3.1 Vehicle’s ttb, tsb and ttc . . . . . . . . . . . . . . . . . . . . . . . . . . . . 47
3.2 The scenarios of vehicles with V2V-AEB enabled system. . . . . . . . . . . 48
3.3 Pedestrian tracking to calculate ttc. . . . . . . . . . . . . . . . . . . . . . . 48
3.4 Pedestrian tracking to calculate ttc with and without delay . . . . . . . . . 50
3.5 To calculate ttb to stop at a distance (d) before collision . . . . . . . . . . 54
3.6 Block diagram to reduce effect of delay . . . . . . . . . . . . . . . . . . . 57
3.7 V2V-AEB simulation . . . . . . . . . . . . . . . . . . . . . . . . . . . . . . 59

ix
Figure Page
3.8 Result of primitive method and proposed method . . . . . . . . . . . . . . 60
4.1 Location from Google map . . . . . . . . . . . . . . . . . . . . . . . . . . . 64
4.2 Sending information of the pedestrian in front . . . . . . . . . . . . . . . . 65
4.3 Block diagram to determine which pedestrian information should be sent . 68
4.4 Pedestrian detection by the vehicle . . . . . . . . . . . . . . . . . . . . . . 70
4.5 Example of pedestrian groping . . . . . . . . . . . . . . . . . . . . . . . . . 72
4.6 Algorithm for clustering . . . . . . . . . . . . . . . . . . . . . . . . . . . . 75
4.7 Grouping of pedestrians using MATLAB (blue dots indicate the hub) . . . 76
4.8 Block diagram to reduce jamming of the network . . . . . . . . . . . . . . 78

x
SYMBOLS
A resultant acceleration
Ar acceleration sensor value while running
Are acceleration sensor value while resting
Aw acceleration sensor value while walking
Dc signal transmission delay (communication delay)
Dm mechanical delay
Dp signal processing delay
Ds sender delay
max(A) maximum value of resultant acceleration for an activity
min(A) minimum value of resultant acceleration for an activity
NA normalized value of acceleration
Sv maximum distance to decide whether to send the message or not
ta time difference between original time to collision and current time
to collision
td time delay
ttcc current time to collision after prediction
ttco original time to collision without prediction
Vc velocity of the car
Vp velocity of the pedestrian
Vr relative velocity

xi
ABBREVIATIONS
AEB Autonomous Emergency Braking
Md Maximum delay
Ntsb New tsb
PAEB Pedestrian Autonomous Emergency Braking
tsb Time to start braking
ttc Time to collision
ttb Time threshold for braking
ttbs ttb to stop d distance before collision
V2V Vehicle to Vehicle
V2V-AEB Vehicle to Vehicle Communication and Autonomous Emergency
Braking
V2V-PAEB Vehicle to Vehicle Communication and Pedestrian Autonomous
Emergency Braking

xii
ABSTRACT
Bhatnagar, Shalabh. M.S.E.C.E., Purdue University, August 2017. Integration ofV2V-AEB System with Wearable Cardiac Monitoring System and Reduction of V2V-AEB System Time Constraints. Major Professor: Stanley Chien.
Autonomous Emergency Braking (AEB) system uses vehicles on-board sensors
such as radar, LIDAR, camera, infrared, etc. to detect the potential collisions, alert
the driver and make safety braking decision to avoid a potential collision. Its limi-
tation is that it requires clear line-of-sight to detect what is in front of the vehicle.
Whereas, in current V2V (vehicle-to-vehicle communication) systems, vehicles com-
municate with each other over a wireless network and share information about their
states. Thus the safety of a V2V system is limited to the vehicles with communi-
cation capabilities. Our idea is to integrate the complementary capabilities of V2V
and AEB systems together to overcome the limitations of V2V and AEB systems. In
a V2V-AEB system, vehicles exchange data about the objects information detected
by their onboard sensors along with their locations, speeds, and movements. The
object information detected by a vehicle and the information received through the
V2V network is processed by the AEB system of the subject vehicle. If there is an
imminent crash, the AEB system alerts the driver or applies the brake automatically
in critical conditions to prevent the collision.
To make V2V-AEB system advance, we have developed an intelligent heart Mon-
itoring system and integrated it with the V2V-AEB system of the vehicle. The ad-
vancement of wearable and implantable sensors enables them to communicate drivers
health conditions with PCs and handheld devices. Part of this thesis work concen-
trates on monitoring the drivers heart status in real time by using fitness tracker.
In the case of a critical health condition such as the cardiac arrest of a driver, the

xiii
system informs the vehicle to take an appropriate operation decision and broadcast
emergency messages over the V2V network. Thus making other vehicles and emer-
gency services aware of the emergency condition, which can help a driver to get
immediate medical attention and prevent accident casualties.
To ensure that the effectiveness of the V2V-AEB system is not reduced by a time
delay, it is necessary to study the effect of delay thoroughly and to handle them
properly. One common practice to control the delayed vehicle trajectory information
is to extrapolate trajectory to the current time. We have put forward a dynamic
system that can help to reduce the effect of delay in different environments without
extrapolating trajectory of the pedestrian. This method dynamically controls the
AEB start braking time according to the estimated delay time in the scenario.
This thesis also addresses the problem of communication overload caused by V2V-
AEB system. If there are n vehicles in a V2V network and each vehicle detects m
objects, the message density in the V2V network will be n × m. Processing these
many messages by the receiving vehicle will take considerable computation power
and cause a delay in making the braking decision. To prevent flooding of messages in
V2V-AEB system, some approaches are suggested to reduce the number of messages
in the V2V network that include not sending information of objects that do not cause
a potential collision and grouping the object information in messages.

1
1. INTRODUCTION
According to WHO (World Health Organization), lives of approximately 1.27 million
people are cut short every year as a result of a road traffic crash. Half of the 1.27
million people die in road traffic crashes are pedestrians, motorcyclists, and bicyclists
[1]. In TASI (Transportation Active Safety Institute) at IUPUI, our focus lies on
research to reduce the road accidents and make the road safer.
Various advancements have been achieved in the field of active Safety systems to
make the road safer. V2V communication, Adaptive Cruise Control, and Automatic
Emergency Braking are some of the advances in the active safety systems. In the
current V2V (vehicle to vehicle communication) system, vehicles communicate with
each other over a wireless network. A standard protocol for a V2V wireless network
is Discrete Short Range Communication (DSRC) [2]. Each vehicle in the V2V system
acts as a communication node. It exchanges data about its location, speed, and
movement and makes the decision, based on received information accordingly [2]. Its
limitation is, it only broadcasts about what is going on in the system [2]. So the
safety is limited to vehicles in the V2V network.
Whereas AEB (Autonomous Emergency Braking) system uses vehicle’s on-board
sensors such as radar, LIDAR, camera, infrared, etc. to detect and alert the driver
for any potential collision [3]. Its limitation is that it requires clear line-of-sight to
identify the objects in the surrounding [4]. Our idea is to integrate the complemen-
tary capabilities of V2V and AEB systems to overcome the personal limitations of
V2V and AEB systems. In V2V-AEB, vehicles exchange data about the objects in-
formation detected by its onboard sensors and its location, speed, and movement.

2
The object information detected by a vehicle and the information received through the
V2V network is processed by the AEB system of the vehicle. If there is an imminent
crash, the AEB system alerts the driver and applies the brake automatically in critical
condition.
Moreover, rapid growth in health monitoring systems has enabled us to integrate
these technologies with V2V-AEB system to improve safety. So far, the research of
health-related mobile applications have focused on measuring the pulse rate, blood
sugar levels, cholesterol, distance walked/stairs climbed, diet suggestions, calories
burnt etc. [5] [6]. We have concentrated on developing an intelligent heart monitoring
system to detect medical emergencies such as paralytic attack, cardiac arrest, etc. by
studying the frequency of the pulse rate from the fitness tracker. When a vehicle gets
the medical emergency information, it broadcasts the message on V2V network with
higher priority and tries to apply brake using AEB system to stop safely. Moreover,
it informs emergency services so that the driver can get a quick medical attention.
For a practical implementation of the V2V-AEB system, it is necessary to resolve
certain issues. One of the key issues is a time delay in the system. As in real time
V2V-AEB system, delays [as shown in Table 1.1] may be caused during the period
of detection, communication, processing and while implementing the decision at the
sender as well as at the receiver side. This delay will result in a late response by the
AEB system which may lead to a collision. For the system to function correctly, the
delay in the system should not exceed an absolute limit. If the delay is too long, the
receiving vehicle may not have enough time to respond to the received information.
Hence the shared AEB information may become useless.
To make a system robust such that delay in the system does not reduce its effec-
tiveness while making a decision, it is necessary to study the effect of delay thoroughly
and to handle them properly. One common practice to control the delayed trajectory
information is to extrapolate trajectory to the current time. We have put forward a
dynamic system that can help to reduce the effect of delay in different environments

3
Table 1.1.Types of time delay in V2V-AEB
Time Delay type Definition
Sender delay It occurs while detecting pedestrian through AEB
system on the sender side and merging all the
information of detected object in a message format.
Communication delay It occurs during transmitting data from one object
to another. This may occur due to packet collision or
excess of information in the network.
Mechanical delay It happens in the braking system. It represents the time
difference between good and bad mechanical operation
due to change in friction between road and tire.
Signal processing delay Occurs, while processing and merging the information,
received from other vehicles and its sensors, for making
AEB decision.
without extrapolating trajectory of the pedestrian. However, when the delay is above
certain time, the system fails to overcome that delay. So it’s necessary to keep the
delay under a particular value. To reduce delay in V2V-AEB, various methods have
been proposed and implemented. The proposed method helps to reduce communica-
tion delay, delay due to packet collision and signal processing delay by decreasing the
number of messages in the V2V-AEB system. By preventing from sending messages
related to the pedestrian who likely will not cause a collision (like the pedestrian who
are walking on the sidewalk and who are standing off the road).

4
The other method developed, is grouping the pedestrians with similar features in
one message, thus reducing the number of messages in the system and decreasing
the communication and signal processing delay. Before going further let’s learn more
about V2V, AEB, and V2V-AEB systems.
1.1 Background
1.1.1 Vehicle to Vehicle Communication
Vehicle to vehicle communication is a type of Internet of things designed to con-
nect the vehicles with each other. V2V communication enables the vehicles to share
its information such as its position, speed, steering wheel position, brake status, and
other vehicle dynamics over V2V network [2]. The information shared over V2V
network can be used effectively to avoid road accidents and to deal with traffic con-
gestion. For example, the vehicle can detect other vehicles which are in blind spots
using V2V communication or it can help the driver to select a path with minimum
traffic congestion.
Vehicles use Dedicated Short Range Communication (DSRC) media to communi-
cate with other vehicles in the V2V network. DSRC is a two-way wireless communi-
cation; it is a short range to medium range communication, which helps vehicles to
share information at a very high transmission rate and with the low latency, which
is a vital requirement for an active safety application [2]. The federal communica-
tion commission that regulates interstate communication signal has allocated 75MHz
spectrum from the 5.9GHz band for V2V communication in the US.
The range of DSRC is about 1000 meters. Thus the vehicles can communicate
with other vehicles in the range of 1000 meters [7]. In V2V each vehicle’s behaves
as a communication node and exchange information with other nodes. The vehicle
collects and uses the excessive amount of data from a huge array of sources to make
a safety decision.

5
With vehicles in the surrounding area, V2V provides the driver with 360 degrees of
awareness. The effect of obstacles on radio message is not adverse. Therefore it is
not necessary that the objects should be in the range of the vehicle sensors to detect
emergencies. Research by NHTSA estimates that V2V communication can help the
driver to prevent 70 percent to 8o percent accidents of unimpaired drivers [8].
Few, applications of V2V system [9] is shown below (Table 1.2):
Table 1.2.Standard applications of V2V
Blind spot detection
Forward collision warning
Sudden braking ahead warning
Do not pass warning
Intersection collision avoidance and movement assistance
Approaching emergency vehicle warnings
Vehicle safety inspection
Transit or emergency vehicle signal priority
In-vehicle signing
Rollover warning
Traffic and travel condition data to improve traveler information and
maintenance services
The limitation of V2V is that it only shares the information about vehicle’s state,
such as its position, velocity, whether it’s going to take a turn or apply a brake.
Thus the safety due to V2V remains for the vehicles with the capability of V2V
communication.
6
1.1.2 Autonomous Emergency Braking
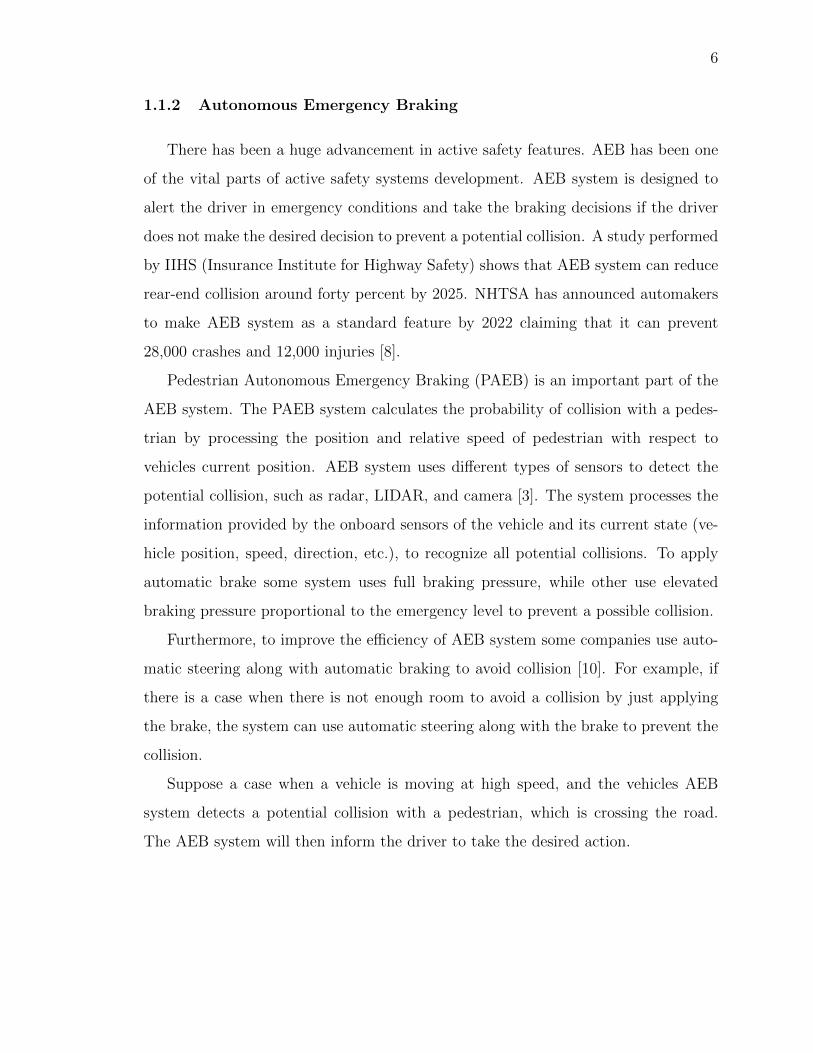
There has been a huge advancement in active safety features. AEB has been one
of the vital parts of active safety systems development. AEB system is designed to
alert the driver in emergency conditions and take the braking decisions if the driver
does not make the desired decision to prevent a potential collision. A study performed
by IIHS (Insurance Institute for Highway Safety) shows that AEB system can reduce
rear-end collision around forty percent by 2025. NHTSA has announced automakers
to make AEB system as a standard feature by 2022 claiming that it can prevent
28,000 crashes and 12,000 injuries [8].
Pedestrian Autonomous Emergency Braking (PAEB) is an important part of the
AEB system. The PAEB system calculates the probability of collision with a pedes-
trian by processing the position and relative speed of pedestrian with respect to
vehicles current position. AEB system uses different types of sensors to detect the
potential collision, such as radar, LIDAR, and camera [3]. The system processes the
information provided by the onboard sensors of the vehicle and its current state (ve-
hicle position, speed, direction, etc.), to recognize all potential collisions. To apply
automatic brake some system uses full braking pressure, while other use elevated
braking pressure proportional to the emergency level to prevent a possible collision.
Furthermore, to improve the efficiency of AEB system some companies use auto-
matic steering along with automatic braking to avoid collision [10]. For example, if
there is a case when there is not enough room to avoid a collision by just applying
the brake, the system can use automatic steering along with the brake to prevent the
collision.
Suppose a case when a vehicle is moving at high speed, and the vehicles AEB
system detects a potential collision with a pedestrian, which is crossing the road.
The AEB system will then inform the driver to take the desired action.

7
However, if a vehicle finds the probability that by just applying brake it annot
prevent a collision, AEB will start the automatic steer assist along with brake to move
vehicle away from the pedestrian to avoid an accident. The AEB system has helped
us to reduce the number of accidents by a considerable amount.
There are few limitations of the AEB system; Like, the sensors in the vehicle
require a clear line of sight. If the object is not in a line of sight of the sensor, the
vehicle will not be able to detect a potential collision.
1.2 V2V-AEB System
To overcome the limitations of the V2V and the AEB system as mentioned above,
we have integrated the complementary capabilities of the V2V and the AEB system
by sharing the information detected by the vehicles onboard sensor over the V2V
network [11]. The other vehicles can use this information to make a safety decision if
necessary. Thus, it compensates the limitations and disadvantages of both the V2V
system and the AEB system as mentioned below [11].
For an AEB system to detect a pedestrian, it is necessary that the pedestrian
is in its line of sight. These limitations of the AEB system might be nullified by
the proposed V2V-AEB method, as vehicles can use the information sent by other
vehicles. Another limitation of AEB system is that its sensors have short detection
range, which provides little time for the system to react. The maximum detection
range of AEB sensor is 80-100 meters. Beyond this, it is difficult for the vehicle to
detect objects. However, as the range of the V2V is 1000 meters, sharing the AEB
information over the V2V network can extensively increase the detection range of
objects. Moreover, AEB system might have sensor limitations under some particular
condition. In such case, the vehicle can use the shared information from the other
vehicles AEB system in V2V network.
Along with V2V enabled vehicles, V2V-AEB system also helps non-V2X enabled
objects such as pedestrians. Research is going on to build a device with which pedes-
8
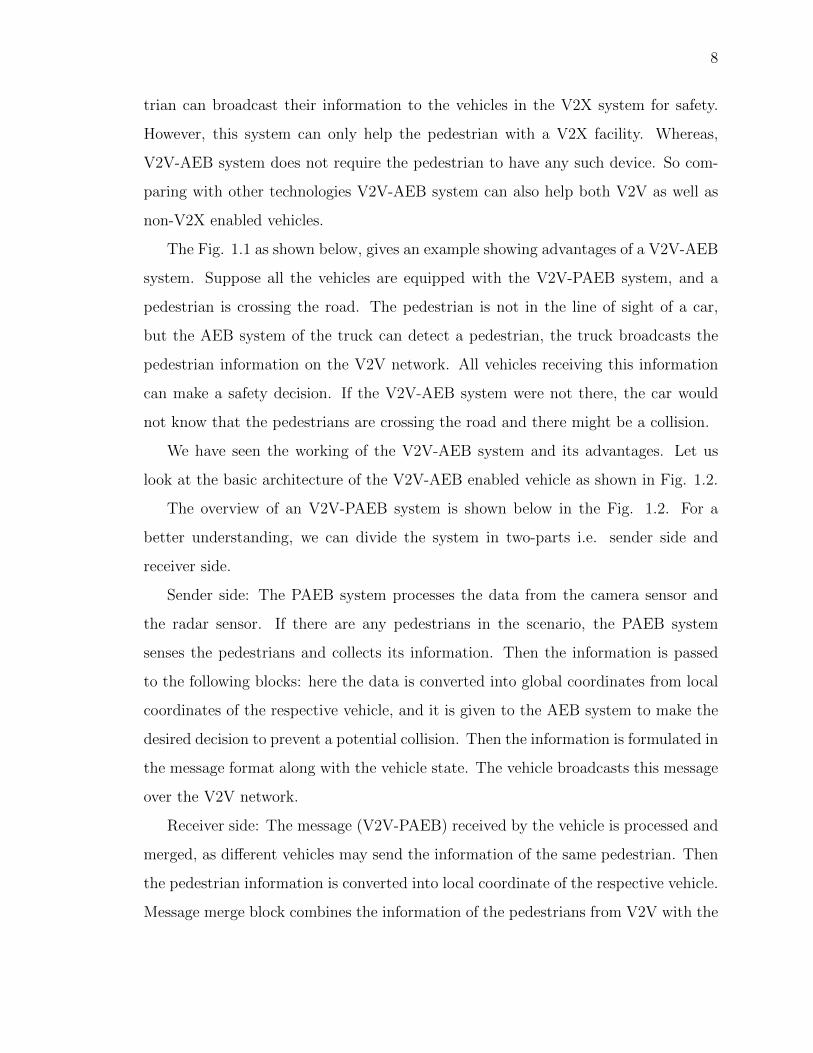
trian can broadcast their information to the vehicles in the V2X system for safety.
However, this system can only help the pedestrian with a V2X facility. Whereas,
V2V-AEB system does not require the pedestrian to have any such device. So com-
paring with other technologies V2V-AEB system can also help both V2V as well as
non-V2X enabled vehicles.
The Fig. 1.1 as shown below, gives an example showing advantages of a V2V-AEB
system. Suppose all the vehicles are equipped with the V2V-PAEB system, and a
pedestrian is crossing the road. The pedestrian is not in the line of sight of a car,
but the AEB system of the truck can detect a pedestrian, the truck broadcasts the
pedestrian information on the V2V network. All vehicles receiving this information
can make a safety decision. If the V2V-AEB system were not there, the car would
not know that the pedestrians are crossing the road and there might be a collision.
We have seen the working of the V2V-AEB system and its advantages. Let us
look at the basic architecture of the V2V-AEB enabled vehicle as shown in Fig. 1.2.
The overview of an V2V-PAEB system is shown below in the Fig. 1.2. For a
better understanding, we can divide the system in two-parts i.e. sender side and
receiver side.
Sender side: The PAEB system processes the data from the camera sensor and
the radar sensor. If there are any pedestrians in the scenario, the PAEB system
senses the pedestrians and collects its information. Then the information is passed
to the following blocks: here the data is converted into global coordinates from local
coordinates of the respective vehicle, and it is given to the AEB system to make the
desired decision to prevent a potential collision. Then the information is formulated in
the message format along with the vehicle state. The vehicle broadcasts this message
over the V2V network.
Receiver side: The message (V2V-PAEB) received by the vehicle is processed and
merged, as different vehicles may send the information of the same pedestrian. Then
the pedestrian information is converted into local coordinate of the respective vehicle.
Message merge block combines the information of the pedestrians from V2V with the

9
Fig. 1.1. The advantages of V2V-PAEB system
information of the pedestrians provided by its PAEB system. Then the pedestrian is
tracked and time to collision of the pedestrian with respect to the vehicle is calculated
to make the desired decision.
1.2.1 PreScan
To simulate scenarios and to test the proposed method we have used a Prescan
software provided by the TASS International company. PreScan is a physics based
simulation platform; it is designed as a development tool for the advanced driver safety
system (ADAS) and the intelligent vehicles system [12]. It can be used to simulate

10
Fig. 1.2. Overview of the V2V-AEB system
the operation of an intelligent vehicle system using various sensor technologies such as
radar, LIDAR, camera, ultrasonic and GPS systems. It is used by many automobile
industries to develop such system. It also provides a framework for a V2V and the
V2I technologies. Thus empowering a user to develop, design and evaluate various
V2V applications.
PreScan provides a dedicated graphical user interface (GUI) that enable users
to build and develop the traffic scenarios. It offers various features, such as: road
sections, infrastructure components (building, street light, traffic signals, etc.), actors
(Pedestrians, Car, Truck, Motor Bike, etc.), lighting conditions (Day, Sunlight, Night.
Headlights and lampposts) and weather conditions (Rain, Snow, Fog, etc.).
11
It enables a user to design, develop and verify the algorithms for data process-
ing, sensor fusion, decision making using Matlab/Simulink interface. PreScan also
provides a 3-D visualization of the generated scenario and the developed method, for
the user to visualize it.
Since PreScan is a physics-based simulation, it provides an insight of how the
system will behave in actual conditions. Also, it provides various other benefits such
as 3D view. The user can also modify the weather, lightning, and a road friction
state quickly. It also provides an ability to the user to control actors dynamic easily.
Thus, we used PreScan to develop the proposed methods and study it.
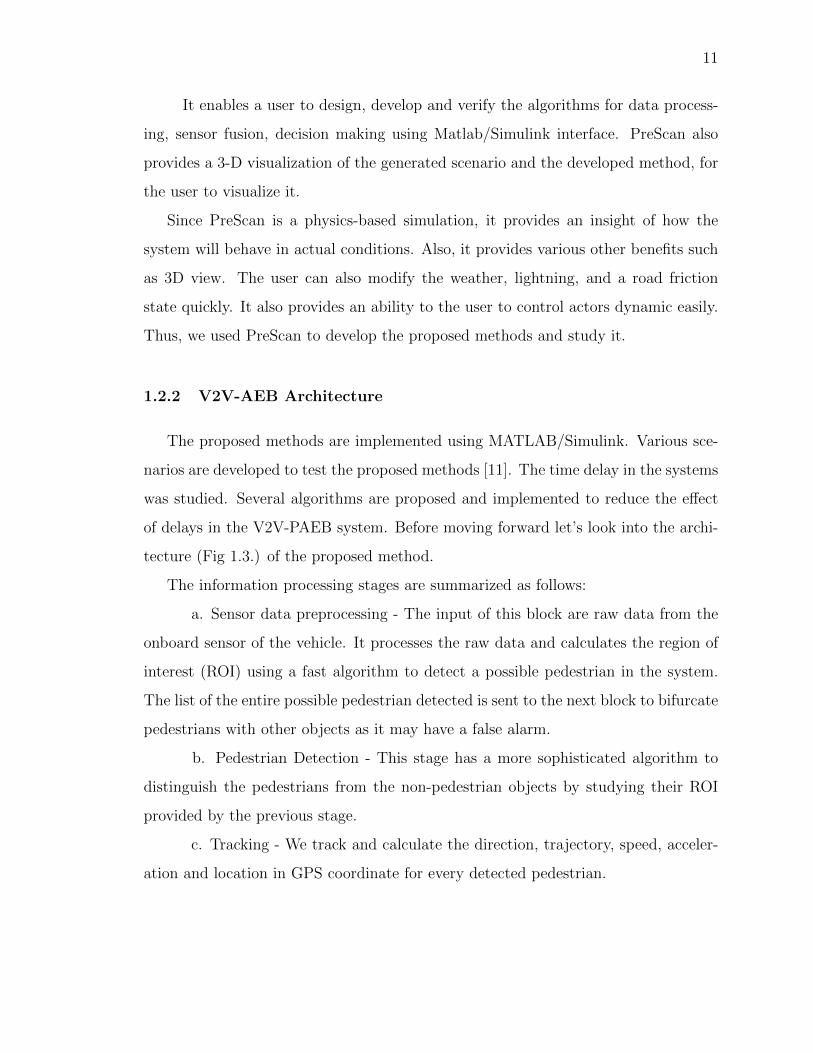
1.2.2 V2V-AEB Architecture
The proposed methods are implemented using MATLAB/Simulink. Various sce-
narios are developed to test the proposed methods [11]. The time delay in the systems
was studied. Several algorithms are proposed and implemented to reduce the effect
of delays in the V2V-PAEB system. Before moving forward let’s look into the archi-
tecture (Fig 1.3.) of the proposed method.
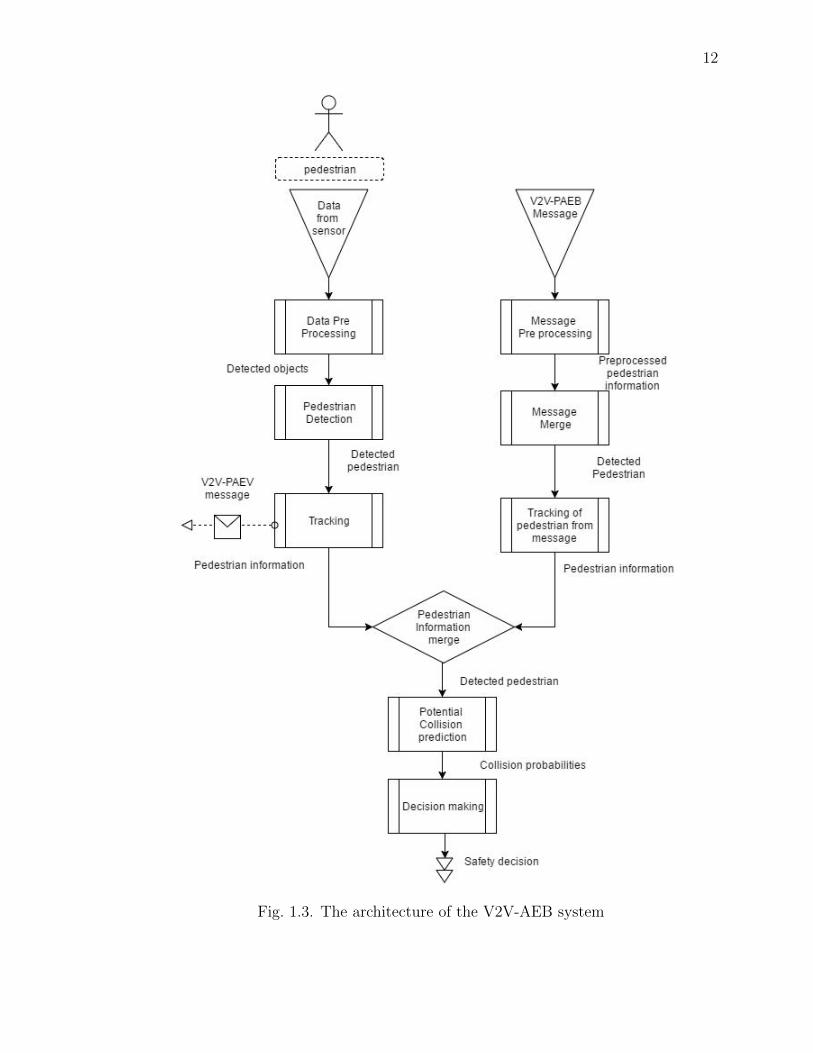
The information processing stages are summarized as follows:
a. Sensor data preprocessing - The input of this block are raw data from the
onboard sensor of the vehicle. It processes the raw data and calculates the region of
interest (ROI) using a fast algorithm to detect a possible pedestrian in the system.
The list of the entire possible pedestrian detected is sent to the next block to bifurcate
pedestrians with other objects as it may have a false alarm.
b. Pedestrian Detection - This stage has a more sophisticated algorithm to
distinguish the pedestrians from the non-pedestrian objects by studying their ROI
provided by the previous stage.
c. Tracking - We track and calculate the direction, trajectory, speed, acceler-
ation and location in GPS coordinate for every detected pedestrian.
12
Fig. 1.3. The architecture of the V2V-AEB system

13
d. Send V2V-AEB message - All the information is being converted into
message format to broadcast in the V2V network.
e. V2V-AEB message preprocessing - The received messages are placed in a
queue periodically. Then the message is read from the queue, and the pedestrian
information is extracted such as its speed, and the location.
f. V2V-AEB message merge - The extracted data from the received message
is merged to obtain a list of pedestrians without duplicate ones. The information of
each pedestrian should be accurate.
g. Tracking 2 - All the pedestrian information received from the V2V-AEB
messages are tracked over time to get their trajectories to predict their future loca-
tions.
h. Pedestrian Information merge - The pedestrian information from vehicles
onboard sensors and those we got from the V2V-AEB system is merged to obtain a
complete set of pedestrians surrounding the host vehicle.
i. Potential Collision Prediction - This stage projects the current trajectories
of pedestrians and host vehicles into future and determines the possibility of collision
based on geometric computations.
j. Decision making - This stage is responsible for making the proper safety
decisions when potential collisions are detected. It makes the safety decision by
generating a warning signal to the driver in case of a possible collision or by applying
the brake in the event of an imminent crash.
14
1.2.3 V2V-AEB Simulation Model
Based on the detailed architecture the model was designed using a PreScan in
Matlab and Simulink. The simulation model is shown below in Figure 1.4. The
developed simulation model was tested on the scenario as shown below in the Fig. 1.5.
In the scenario as shown in Fig. 1.5, the speed of the car is 14m/s, the deceleration
of the car is 12m/s2 and the speed of right (men) and left (woman) pedestrians is
1.5m/s and 2m/s, respectively.
The pedestrians are not visible to the red car because its line of sight is obscured
by the truck. Thus, the red car won’t know that the pedestrians are crossing the
road this may lead to an accident. However, the truck and the green car can detect
both pedestrians and broadcast their information. This information received through
a V2V network can be used by the red car to make a safety decision as seen in Fig.
1.5 (b) and (c).
1.3 Thesis Organization
After studying about the V2V, AEB, and the V2V-AEB system let us go ahead.
V2V-PAEB system helps us to protect pedestrians and objects in the surrounding of
the vehicle. But what if the driver is in some medical emergency? To answer this
question and make more advanced active safety features, we integrated the intelligent
cardiac monitoring system with the V2V-AEB system, which will be seen in section
2 of this thesis. For a more reliable active safety system, it is necessary to reduce the
latency in the V2V-AEB system. Thus, section 3 will focus on studying delay in the
V2V-PAEB system, and a model will be discussed to reduce the effect of delay. It is
found out, that even after using the proposed method to lessen the impact of delay
in the system, when the delay goes above the threshold value the system fails. Thus,
section 4 will introduce some methods to reduce delay in the V2V-AEB system [13].

15
Fig
.1.
4.T
he
V2V
-PA
EB
Sim
ula
tion
model

16
(a) V2V-PAEB test scenario
(b) The front view when vehicles started applying
break using V2V-AEB system
(c) The front view after pedestrian crossed the
road safely
Fig. 1.5. The V2V-AEB simulation scenario

17
2. INTEGRATING V2V-AEB WITH CARDIAC
MONITORING SYSTEM
The proposed V2V-AEB system helps us to protect pedestrians and the object in the
surrounding of the vehicle. However, it does not provide the information related to
whereabouts of drivers condition such as his health status. To take it one step ahead
we have proposed a method to monitor the drivers health condition and inform the
vehicle in case of a medical emergency.
Rapid growth in the advanced active safety systems and the health monitoring
systems have enabled the possible integration of these technologies for improved ve-
hicle safety. In the V2V-AEB system, the vehicle shares its information and the
environment information detected by its onboard sensor over V2V network, so that
other vehicles can use the shared information to prevent a potential collision. The
advancement of wearable and implantable sensors enables fitness tracker to commu-
nicate persons health conditions with PCs and handheld devices. In this section,
we focus on the possible integration of intelligent cardiac monitoring system with
the V2V-AEB system. By monitoring the drivers heart condition in real time using
fitness tracker.
So far as per our study, the research of health-related mobile applications have fo-
cused on measuring the pulse rate, blood sugar levels, cholesterol, distance walked/stairs
climbed, diet suggestions, calories burnt, etc. [5] [6]. We are concentrating on devel-
oping an intelligent system to inform the vehicle in case of a medical emergency such
as paralytic attack, cardiac arrest, etc. by studying the frequency of the pulse rate
from a fitness tracker. When the vehicle gets the medical emergency information, it
broadcasts the message on V2V network, so that other vehicles can try to distance
from this vehicle and vehicle can apply a brake to stop safely. Moreover, it can also
inform emergency services for getting an immediate medical attention.

18
2.1 Literature Review
To move forward, it is necessary to study different methods that are available
to detect the medical emergency condition. We have also considered various algo-
rithms that are used to study attributes (e.g. pulse rate) from the dataset and detect
abnormalities in a patients body. These studies will be discussed in this section.
Analyzing pulse rate dataset is the key part in developing a system. As error in
analyzing can excessively temper the results. Different researchers have used different
algorithms to analyze the data. Like, Particle Swarm Optimization along with Feed
Forward Neural network techniques is used to diagnose heart diseases [14]. Data
mining among other algorithms gave 82.5% accuracy in analyzing the data of the
patient [15]. Another method researchers use is data mining along with K-mean clus-
tering to cluster the data in groups. Maximal Frequent Itemset Algorithm (MAFIA)
is used on these clusters to extract familiar patterns for heart attack [16].
After analyzing the dataset, next step is to identify the anomalies in persons body
to detect the emergency medical conditions. There are various algorithms proposed
to predict the anomalies of the heartbeat. Cauchy principle Swarm Optimization
Algorithm was one of them, which helped the researchers to detect abnormalities in
heart rate from the dataset [17]. Whereas, some researchers have also used Bernoulli
principle to detect the variation of blood pressure. The blood pressure and the heart
rate variability was detected with less than 5% errors by this method [18]
After knowing anomalies in the heart beat the question arises, how can we identify
heart attack through it? Various methods have been tried by different researchers.
But it has to be considered anomalies in heart rate can be due to many reasons.
Heart rate increase could be because of many reasons such as cholesterol, stress, lack
of fitness, etc.

19
Different techniques are used by the researchers to understand the stress levels
in a human so as to analyze how the heart rate varies with the activities performed.
Wireless body area network is one such system used by the researcher, which is
equipped with intelligent sensors to calculate stress levels before performing activities
[19].
To predict heart attack researchers have used data mining as one of the tech-
niques. Whereas, some researchers have calculated Heart Rate Variability (HRV)
from the ECG and used Support Vector Machine (SCV) classifier to distinguish be-
tween healthy and critical patients. Researcher claims it can predict cardiac arrests
30 minutes before the actual attack [20].
Currently, present methods, as per our knowledge use ECG signal to predict
medical emergency conditions. But ECG signal can only be measured when a person
is at rest or lying down on the bed. Since it is difficult to get the heart rate while
driving, we have proposed an algorithm to predict an emergency condition (heart
failure) using fitness tracker. We are using decision tree with feedback along with
KNN algorithm to anticipate this condition of a user.
2.2 Methodology
Heart rate differs from person to person depending upon various factors such as
age, body mass, and fitness level. There are external factors that determine the heart
rate too (i.e. atmospheric pressure, altitude, temperature, and humidity). It is a
general perception that the regular heart rate of a person is usually in the range of 60-
100 beats per minute [21]. There are many situations when the heart beat rate changes
abruptly, and a typical situation found regularly is during waking up or sudden body
movements. This might cause a heart rate to shoot up for a few seconds. We are
attempting to identify heart abnormality by continuously monitoring, analyzing the
pulse rate, and body movement of, a vehicle driver using a fitness tracker.

20
We intend to pass the heart abnormality information to the vehicle to trigger it to
brake/pull over automatically and to share the information to the V2V network to
alert surrounding vehicles and seek medical assistance.
Fig. 2.1. Processing unit of Cardiac monitoring system.
The information used in our proposed system includes heart rate and the tri-
axial accelerometer inputs. Additionally, subjects age, BMI, and weight are used to
calculate the initial thresholds for the subject. Tri-axial acceleration sensor data is
used to determine the motion that the user is performing [22]. While other attributes
such as pulse rate, BMI, age, and medical history are used to predict the emergency
condition. If an abnormal pulse rate is detected, then the system will output this
information.
The data is processed in a three-step approach:
(1) Get a prerecorded heart rate dataset of many human subjects. Analyze
the dataset to extract the signal patterns of normal and abnormal heart rate based
on some attributes.

21
(2) Gather real-time heartbeat rate information from vehicle drivers. Identify
the abnormal signal patterns learned from step (1).
(3) Create a warning signal to the vehicle for automatic emergency braking/pull
over, warn nearby vehicles for abnormal driving behavior through a V2V network,
and request for medical help through a V2V network.
2.3 Analyze the Pre-recorded Dataset
27 individuals heart beat history was used to test the proposed method. These
datasets were taken from the UCI (University of California, Irvine) Machine learning
repository and Eric (Entrepts, Reprsentation et Ingnierie des Connaissances) labora-
tory repository [23] [24] [25]. Within these 27 individuals, the data set of 9 healthy
individuals (8 males and 1 female aged 27.223.31 years and BMI 25.112.62 kgm2 ) has
the information about the acceleration sensor and pulse rate for 18 different physi-
cal activities performed in 10 hrs. This data is collected using a heart rate monitor
and inertial sensors. Out of 9 healthy individuals data, 5 were used to extract the
attributes and 4 were used to test the proposed method. The data set of the other 18
people has the information about their heart pulse rate of a patient in at rest position
for 24 hours. The datasets of 8 out of these 18 patients were used to extract features
and 10 were used to test the proposed method.
In data from 9 healthy people, each subjects activity consists of heart rate records
obtained from fitness tracker and the 3D accelerometer with respect to time. The 3D
accelerometer data can be analyzed to calculate the velocity and displacement from
the statistical estimate of accelerations along the x, y, and z-axis. The data set has
the data from 2-accelerometer sensors, one with 6G maximum acceleration and the
other with 16G maximum acceleration.
22
During high-intensity movement, a persons high impact may saturate the 6G
accelerometer, so the data from the 16G accelerometer should be used. The sampling
rate of the heartbeat rate monitor is 9Hz, and the sampling rate of the accelerometer
is 100Hertz. Additionally, subjects age, BMI, and weight are available. The data set
has the information about pulse rate after every 1-minute interval.
To extract the abnormal heart beat pattern, we analyze the data in three steps
(as shown in Fig 2.1.):
Step 1: Bifurcate the pulse rate according to users motion type, as we know
that the pulse rate varies according to the motion types.
Step 2: Determine the normal/abnormal pulse rate range for each body motion
type.
Step 3: Verify if the heart beat shoot up was due to some external factor or
health condition by studying the unusual frequency of the pulse rate.
2.3.1 Bifurcate the pulse rates of a particular user according to motion
types.
Different physical activities of subjects are classified into three main levels: resting
(sitting, lying, etc.), walking, and running (playing soccer, running, etc.). The dataset
has activity IDs to indicate subjects motion type that makes it easier to organize the
data and bifurcate.
Preprocess the data:
Some part of the data is questionable, as indicated by the data set. Thus, only the
correct sections of the data set are selected. KNN (K-nearest neighbors) classification
is used on accelerometer data to differentiate body movements into activity levels.
KNN is a supervised learning algorithm where the result is classified based on the
majority of K-Nearest Neighbor category. KNN is also called a lazy learning algorithm
because it is a type of instance-based learning algorithm.

23
Before using the KNN algorithm on the acceleration sensor from dataset, it is
necessary to study the behavior of acceleration sensor data for different activities.
Figure 2.2 represents the probability function for the relative acceleration data used
of different physical activities (Resting, Walking, and Running). The x-axis is relative
acceleration sensor data and the y-axis is probability function, which estimates the
probability of a single sample data having an instantaneous value greater than the
probability value. The Purple line is for resting, the Green line is for walking, and
the Black line is for running. For lower acceleration values, the probability function
has greater values with respect to resting posture, whereas for higher acceleration
values, the probability function curve for running data points is present only. From
the graph, it can be depicted that an increase in the motion of a body is directly
proportional to the value of acceleration sensor data.
i.e.
Are < Aw < Ar
Where,
Are= Acceleration sensor value while resting
Aw= Acceleration sensor value while walking
Ar= Acceleration sensor value while running
When the KNN algorithm is used to predict the motion of a user, the input of a
acceleration sensor is compared with the training dataset extracted from 5 users. In
the KNN algorithm, from the training dataset K-nearest neighbors are searched, and
it classifies input into groups (i.e. resting, walking, running) who have a maximum
number of votes in the defined (K) neighborhood.
Example: let us consider KNN classifier with k=3. The below example shows that
there are two groups in which the input should be classified. The red cross and blue
dots represent two classifications from the training dataset. When an input is given
as shown by the white dot, it checks the K nearest neighbor. Here, K is equal to 3,
and the nearest neighbor is shown in the dotted circle. The point is classified into
a group which has the maximum member in the defined neighborhood of the input.

24
Fig. 2.2. Acceleration sensor data
Here when we check the 3 nearest neighbors of the input, the weight of the group
represented by the red cross is 2 and represented by the blue dot is 1. Thus the input
belongs to group 1, which is represented by the red cross.
Fig. 2.3. A KNN algorithm example

25
Probabilistic interpretation:
Let,
training set T = {(x1, y1), ..., (xn, yn)}
Where,
xi are the points in training dataset, xi ∈ Rd,
yi is classification in finite set, let yi ∈ {0, 1}
Let x be a new input that we want to classify in which group they lie (i.e. what
is y corresponding to s)
Let K be a fixed variable
Let us define random variable Y ∼ P
P (y | x, T ) = P (y) = fraction of points xi in Nk(x) st yi = y
Nk(x) = k nearest points to x
Prediction of classification, y = argmaxyP (y|x, T )
We have seen how the KNN algorithm works, to use the KNN classifier to classify
the acceleration data it’s necessary to extract correct data points from the training
data set. To extract the attributes for the algorithm, first, we remove the questionable
data from data set. The dubious data is mentioned in the data set in which data is
questionable. Then the data from the training set is classified in 3 activities (resting,
walking, running) as mentioned earlier. The classification of the training dataset is
done by using activity IDs provided in the data set. Then this dataset is used to
classify the input acceleration sensor value.
The next point arises, which is how to find the best K value to get maximum
accuracy, i.e. how many nearest neighbors should be taken into consideration to
classify the input. To find the value of K, we used the 2 fold cross validation method.
The training data is divided into two groups, one of the two groups is used as the
training set and the other as the testing set alternatively to find K.

26
To find the distance from each data in the training set, the classification algorithm
will take O(nd) time. Where d is time to calculate distance and n is the total number
of data points in the training set. The accelerometer gives the data in 3 axes, it will
consume a lot of time to find the distance from each data point. To reduce the time
(i.e., to reduce d) we find the relative acceleration (eq 2.1) so that single value can
represent all 3-axes’ values and the value of d can be reduced. Then the acceleration
data set is normalized in the range of 0 to 1 using eq (2.2)
A =√a2x + a2y + a2z (2.1)
Where,
A = resultant acceleration
ax = acceleration in x direction
ay = acceleration in y direction
az = acceleration in z direction
NAi =Ai −min(A)
max(A)−min(A)(2.2)
Where,
NA= normalized value of acceleration
A = resultant acceleration
min(A) = minimum value of resultant acceleration for each activity
max(A) = maximum value of resultant acceleration for each activity
The result of normalization for relative acceleration is shown in Fig. 2.4. The
figure below has time on its x-axis and resultant acceleration (A) data on the y-axis.
The green peaks show the relative acceleration sensor data whereas the blue peaks
show normalized acceleration sensor data.
The normalization of data is done for classification. The classification result of
acceleration data using KNN is shown in Fig. 2.5. The green box indicates the
accuracy of detection in the correct particular type of motion, whereas red indicates

27
Fig. 2.4. Normalization of relative acceleration
the error (i.e. the detection of particular data in the wrong state of motion). It
shows that overall accuracy for the detection of data into its own respective category
is 87.1%.
The KNN algorithm finds the distance from all the data in the training set and
then it compares the K-nearest neighbor to classify the input. Thus its time com-
plexity to sort is O(nd+nlog(k)). If O(d) is the time to calculate the distance, its
time complexity becomes O(nd), where n is a total number of elements in the training
dataset. This is because the distance is calculated for each data point present in the
training set. While choosing the k smallest distance from the n dataset it will take
O(nlog(k)) time. This process is time-consuming due to the large data set available.
To reduce the time complexity and the space complexity, we have used the relative
acceleration data for analysis. This acceleration data covers all the motion types (i.e.

28
Fig. 2.5. Classification using the KNN algorithm from relative acceleration
resting, walking and running), so they are divided into three categories with respect
to an activity ID given in the dataset. The window of time w is chosen, and the
variation of relative acceleration is found on the initial and end of the window. The
mean and standard deviation of each group is calculated which is further used to
classify the activity using acceleration sensor data.
V Am =
∑ni=1 V Ai
N(2.3)
Where,
V Am = mean of Variation in Acceleration for specific activity
V A = Variation in relative acceleration for specific activity
N = Total number of data

29
σ =
√√√√ 1
N
N∑i=1
(V Ai − V Am)2 (2.4)
Where,
σ = standard deviation
The mean (eq. 2.3) and the 2nd standard deviation (eq. 2.4) of each motion
type are calculated. They are used to classify the acceleration sensor data. The
2nd standard deviation of each group is calculated, as it states the range of 95.4%
of the data from data set. Thus, it can be used to check whether the input lies in
this range or not. The 2nd standard deviation value is chosen to prevent overlapping
in the classification of acceleration data. These features are used to classify input
in respective categories. To classify the input, the normalized value of the relative
acceleration is calculated and compared with 2nd deviation value of 3 groups. Thus,
the time complexity is O(c) time. Where c is a constant time to calculate relative
acceleration and normalization of the input value and comparing with the value of
standard deviation of 3 groups.
The overall accuracy of the method is 78%, which is less than KNN classifier.
However, the efficiency of the classifier can be afforded as the heart rate is monitored
in 2 more steps and our goal is to detect an emergency condition in which time plays
an important role.
2.3.2 Find normal and abnormal heart beat patterns
The bifurcated pulse rate from activity classification in step 1 is passed to step
2 to detect abnormal heartbeat patterns, considering the activity classification from
step 1. But to identify the abnormal heartbeat patterns, it is important to study the
nature of pulse rate. The pulse rate is highly dependent on factors like age, sex, and
BMI. According to [26], the safe maximum and safe minimum pulse rate of people of
different age groups are shown in Table 2.1.

30
Table 2.1.Table for average heart rates [26]
Newborns 1-30 days old 70-190
Infants 1-11 months 80-160
Toddlers 1-2 years old 80-130
Preschoolers 3-4 years old 80-120
Elementary Age 5-10 years 70-115
Teenagers 10-20 years 60-100
Adults 20-60 years 60-100
Psychological effects of stress can also contribute to heart rate increase while
performing activities such as yoga or meditation could bring the heart rate back to
normal. Typically, athletes have a resting heart rate as low as 50-60 beats per minute.
The maximum heart rate that can be achieved by individuals is given by the formula:
220-(age) [27]. According to reports [8], the heart rate for a healthy person while
exercising is between 50% of (220-age) and 85% of (220-age) [28] [29] [30]. As per
studies conducted by Cleveland Clinic, it is to be noted that if a persons heart rate
is above 220 for more than a minute, it may lead to heart muscle damage resulting
in arrhythmia [31] [32].
Maximumheartrate = 220− (age) (2.5)
Minimumheartratedurinexcercise = 0.5(220− (age)) (2.6)
Maximumheartrateduringexcercise = 0.85(220− (age)) (2.7)
Maximumheartrate < 220 (2.8)
As heart rate depends on various factors, it is necessary to personalize the al-
gorithm as per the user. To customize the system is calculates a maximum and
minimum pulse rates for each subject. Initially, we do not have the average pulse
31
rates of the subject. Hence, we will instead ask the subject to input some of the
information like age, height, BMI, etc., and use Table 1 and equations (2.5-2.8) to
assign initial safe minimum and safe maximum. Once the data starts coming to the
system, the program calculates the minimum and maximum range of pulse rate as
per the user. Thus, its accuracy in detection of an emergency condition will improve
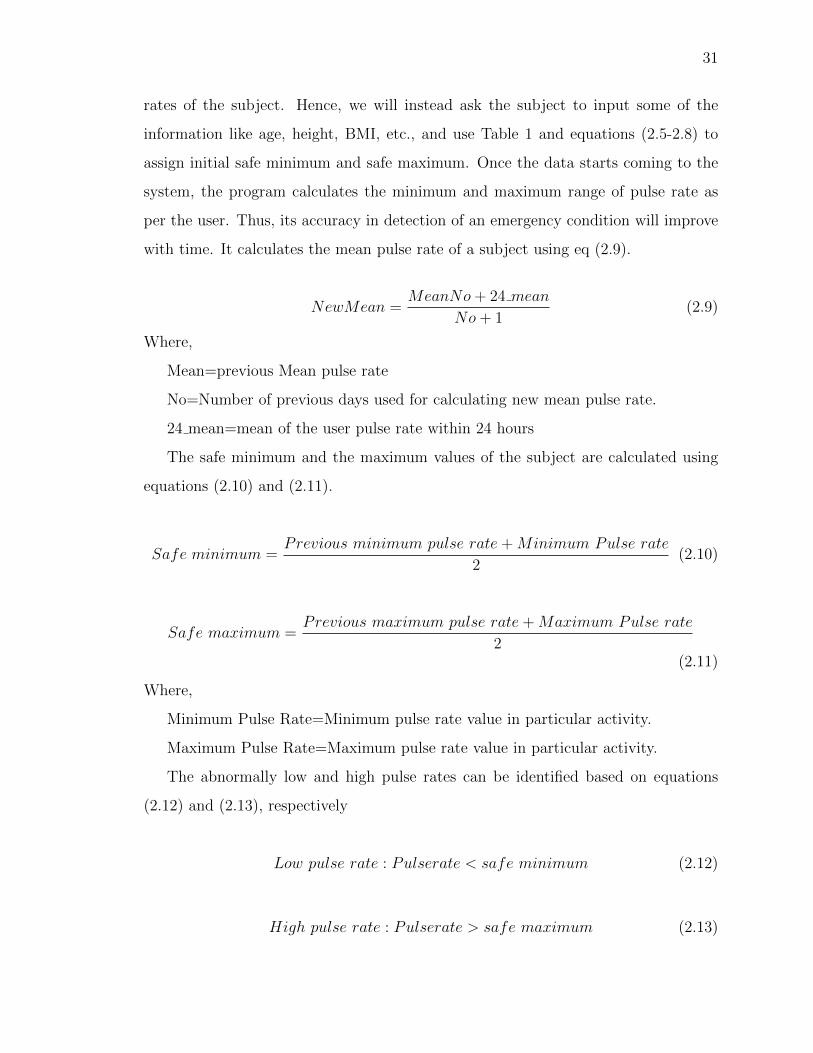
with time. It calculates the mean pulse rate of a subject using eq (2.9).
NewMean =MeanNo+ 24 mean
No+ 1(2.9)
Where,
Mean=previous Mean pulse rate
No=Number of previous days used for calculating new mean pulse rate.
24 mean=mean of the user pulse rate within 24 hours
The safe minimum and the maximum values of the subject are calculated using
equations (2.10) and (2.11).
Safe minimum =Previous minimum pulse rate+Minimum Pulse rate
2(2.10)
Safe maximum =Previous maximum pulse rate+Maximum Pulse rate
2(2.11)
Where,
Minimum Pulse Rate=Minimum pulse rate value in particular activity.
Maximum Pulse Rate=Maximum pulse rate value in particular activity.
The abnormally low and high pulse rates can be identified based on equations
(2.12) and (2.13), respectively
Low pulse rate : Pulserate < safe minimum (2.12)
High pulse rate : Pulserate > safe maximum (2.13)

32
The pulse rate fluctuations might be due to various reasons. Also, there might
be the wrong classification from step1; this may lead to a false alarm. To avoid such
situation, we further investigate the health condition to understand how drastically
the pulse rate has changed.
2.3.3 Verification of abnormal heart rate
Step 2 indicates if the pulse rate goes beyond the expected safe ranges. Step 3
examines the indication closely based on other factors such as frequency variation in
the last three pulse rates. The trigger through step 2 can be due to various reasons
like: due to external factors (temperature of the environment), a sudden change in
activity, and other health conditions or due to the wrong classification of activity. For
example, if a person is doing exercise his pulse rate goes high. After completion of
exercise when a person sits to relax, his heart rate would still be high under normal
condition. However, the system may detect it as an emergency from step 2, but it
is not an emergency condition and can be verified by studying previous pulse rate.
Also, there are various other reasons like stress, which might lead to increase in pulse
rate [33]. However, stress is steady process thus pulse rate will also increase gradually.
Moreover, other external factors (temperature of the environment), excitement also
lead to gradual increase in pulse rate.
Whereas, the attack is a sudden phenomenon, which requires immediate medical
attention. Thus during medical emergency condition like heart attack, pulse rate
changes drastically over a short period [34] [33]. Thus, emergency conditions can be
verified by checking whether there was a drastic change in pulse rate or it is gradual.
To check this, we monitor the fluctuations in the heart rate closely for a certain set
period (in this case, we observe the fluctuation closely for 3-4 minute). In order to
check the drastic change of pulse rate so that attack can be verified. To calculate
drastic change inequalities (2.14) and (2.15) are checked.
|Pc − Pc−1| >|SafeMax− SafeMin|
2(2.14)

33
Where,
(Pc) refers to the current Pulse rate
(Pc−1) refers to previous Pulse rate
|Pc−1 − Pc−2| >|SafeMax− SafeMin|
2(2.15)
Where,
(Pc−1) refers to previous Pulse rate
(Pc−2) refers to 2nd previous Pulse rate
If the heart rate change is less than the maximum change rate and is not satisfying
either inequality (2.14) or inequality (2.15), it stores the value of pulse rate in a
separate matrix (matrix [A]), to analyze the reason for the sudden fluctuations in
pulse rate. However, if both inequality 2.14 and 2.15 are satisfied, it triggers the
vehicle and sends the information to the health care centers to take a quick action.
Table 2.2.Matrix A: to study the abnormality in heart rate
Time Pc Pc−1 Pc−2
T1 X1 X2 X3
T2 X4 X5 X6
T3 X7 X8 X9
T4 X10 X11 X12
From matrix [A], where we have stored irregular pulse rates, we can study them
to know the cause of the situation. We can also study the altitude and acceleration
sensor data to understand if the user was at a higher altitude or if s/he was doing
some sort of physical activity that led to the unusual pulse rate. However, if this is
not the case, we can see whether this situation has occurred previously or not and
then retrieve the data to analyze if there is any particular pattern to it. Moreover,

34
Fig. 2.6. Detailed system diagram
if it happens often, we can send the report of the pulse rate for 24 hours to a doctor
and request a patient body checkup, as well.
The proposed method is tested on ten patient data and four healthy persons. For
activity classification and attributes extraction (minimum, maximum, safe minimum,

35
Fig. 2.7. Heart attack detection
safe maximum and mean value of pulse rate), we used five healthy persons data and
eight heart patients data. Here is one of the visual analysis of the saved file with
data from a patient of 32 years old with 64 Kg (Fig5).His resting heart rate was 120,
and maximum heart rate was 185. The data is from ECG during the period when a
patient got a heart attack.
When the pulse rate of the subject is below safe minimum pulse rate or above safe
maximum pulse rate, the data was saved and represented in the graph by blue curve
in Fig. 2.7. If the pulse rate was not in the safe range (i.e. if it is above safe maximum
or below safe minimum), the data was compared to the previous pulse rate and if it
satisfies inequality 2.14 as mentioned earlier those data is also saved separately, the
green curve in Fig. 2.7 represents it. The two peaks show that previous two-pulse
rate changes that are compared and were found to be out of normal range. If the
pulse rate is changed drastically as per inequalities 2.14 and 2.15, the information

36
should be sent to the vehicle for automatic emergency braking and broadcast in V2V
network for seeking help and warning nearby vehicles. The red peak in Figure 5 shows
the point when the emergency heart condition information is sent.
2.4 Adapting Intelligent Cardiac Monitoring system in V2V-AEB
Fig. 2.8. Integration of V2V-AEB and Intelligent cardiac monitoring system
We have looked into the advantages of V2V-AEB system, to make driving safer we
proposed a method to integrate the intelligent health monitoring system with V2V-
AEB. Various problems need to be solved to integrate the system. Importing pulse

37
rate to a vehicle is one of them, pulse rate from devices such as fitness tracker or
Implantable Cardiac device, can be imported through Bluetooth. As fitness tracker
and Implantable cardiac device calculate the pulse rate in real time, this information
tracked by the device can be used to monitor the health condition of the driver.
However, the other question arises is how to import the drivers data such as his
age, sex, Maximum pulse rate, Minimum pulse rate; because it is not necessary
that a vehicle is used by just one driver only. To extract these attributes vehicle can
connect with the mobile phone of the driver as unlike vehicle, mobile phone nowadays
is personalized. Thus, a vehicle can import the drivers data such as his maximum
pulse rate, minimum pulse rate, etc. After extracting the data from a mobile phone,
the pulse rate could be monitored by vehicle through fitness tracker or Implantable
Cardiac device. When the health monitoring system detects an emergency in the
vehicle, a triggered signal should be generated to activate V2V-AEB system of a
vehicle. To generate the triggered signal the vehicle can use CAN bus. The CAN bus
connects the V2V and AEB system of the vehicle. The triggered signal can activate
the V2V-AEB system as proposed to take desired decision.
When the system triggers the vehicle under an emergency condition, it executes
the Automatic Emergency Braking (AEB) protocol. AEB helps the driver to stop
the vehicle at a safe position. So that there is no accident, in a case when the driver
is unconscious during medical emergency condition he does not need to panic for
the control of the vehicle. Otherwise, this can make drivers health condition worse.
Simultaneously, vehicle broadcast emergency message in V2V network so that other
vehicle can come to know about the emergency condition and immediate medical
attention can be provided to the driver. Also, it can prevent collision with other cars,
as other vehicles would be aware of the patients vehicle and they can try to assist the
patient.

38
Fig. 2.9. Implementation process of Cardiac Monitoring Sys-tem(Trigger signal-Time)
2.4.1 Simulation
Simulation by PreScan software is used to demonstrate the proposed method.
The pulse rate of a heart patient at rest condition in the dataset is fed as an input,
assuming heart patient is driving the vehicle. When driver had a heart attack, the
system triggered the vehicle for stopping. The timing of the execution is shown in

39
Fig. 2.9. The AEB system was activated along with the V2V system. The vehicle
stopped at a safe location and broadcasted its location in V2V network. The x-axis
is the time whereas the y-axis is the trigger signal. It represents when the system
triggers the vehicles AEB system and V2V system and when the vehicle stops.
2.4.2 Hardware Model
The proposed method has also been implemented and tested using FRDM K64
and finger heart rate sensor. After getting the pulse rate value, the information is
sent to the cloud using AT&T M2X. M2X is an IOT platform provided by AT&T,
we have used it to store the real-time processed data and for triggering in the case of
emergency. Let us first study about finger heart rate sensor.
Heart Rate Sensor Module:
The module (as shown in Fig. 2.10) uses photo transistor and infrared led (IR) to
detect the pulse of the finger. Red led flashes whenever a pulse is detected. There is a
led on the light side of the finger and a phototransistor on the other side of the finger,
which is used to obtain flux emitted. The resistance of the photoresistor will vary
as pulse will change. The heart beat sensor module has three pins: Signal (Analog
signal), 5V and ground.
FRDM K64:
FRDM K64 is a low power (250A/MHz) Freescale development platform. It has
120 MHz ARM cortex-M4 core microcontroller with 1 MB flash memory and 256 kb
RAM. The board includes 6-axis digital accelerometer and magnetometer which is
required to detect the motion of the user. This feature of FRDM K64 makes as an
ideal selection for our system. The pin configuration of FRDM K64 and connection
with Heartbeat Sensor is shown below in Fig. 2.11

40
Fig. 2.10. Heart rate sensor module
Working:
The FRDM K64 operates on the mbed program; the proposed system is pro-
grammed using Embedded C. Onboard acceleration sensor is used to predict the
motion of the body. As per the motion of a body, the pulse rate has been processed
as explained earlier. This setup was tested on five people with age group 24-34. The
Fig. 2.11 shows the heart rate of one of the user.

41
Fig. 2.11. Connection of heart rate sensor module with FRDM K-64

42
Fig. 2.12. Real time pulse rate using FRDM K64

43
3. EFFECT OF DELAY IN V2V-AEB
We have read about the proposed system in previous sections. There can be various
constraints like delay in the system while implementing the proposed system. This
delay might reduce the effectiveness of the proposed system. It is necessary to control
delay for an efficient V2V-AEB system. As delay will result in a late response by the
AEB system, which may lead to a collision. For the system to function properly, the
time delay in the system should not exceed a certain limit. If the delay is too long,
the receiving vehicle may not have time to respond to the information, hence the
shared AEB information will become useless, and to make V2V-AEB system more
effective, the delays need to be resolved.
To make system robust such that delay in the system does not reduce its effective-
ness while making the decision, it is necessary to study the effect of delay thoroughly
and to handle them properly [13]. One common practice to handle the delayed tra-
jectory information is to extrapolate trajectory to the current time. We have put
forward a dynamic system that helps to reduce the effect of delay in different envi-
ronments without extrapolating trajectory of the pedestrian. In V2V-AEB system,
various time delays can occur at each information processing step, starting from de-
tecting pedestrians through onboard sensors, converting them into message format
(Ds), sending the information about those pedestrian to other vehicles (Dc), process-
ing all the received information on receiver side, merging those information with self
AEB system and using those data to make appropriate decision (Dp). Based on the
path of information flow we have divided all these delays into four parts. The total
delay (D) in the system is the sum of all delay parts.

44
D = Ds +Dc +Dp +Dm (3.1)
Where,
Table 3.1.Bifurcation of delay (D)
Ds Sender delay
Dc Signal transmission delay (Communication delay)
Dp Signal Processing delay
Dm Mechanical delay
To develop algorithms for handling the delay in the real system, it is necessary to
study the delays given by equation 3.1 and reason for these delays in the system.
Sender delay (Ds):
Vehicles detect the objects using its onboard AEB sensors such as radar, LIDAR,
and camera. Then it determines if the detected object is a pedestrian or a vehicle and
finds its speed, location, and moving direction. Later this information is converted
into message format to broadcast over V2V network [11]. All these processing steps
take some time causing a certain time delay. This delay will increase as the number of
pedestrian increases. Since, it will take the time to track each pedestrian, differentiate
various information, and convert all the information into the message format.
Communication delay (Dc):
A communication delay in the V2V communication can also be termed as an end
to end delay. End to end delay refers to the time taken for a packet to be transmitted
across a network from source to destination. The message size and the network load

45
affect it. For example, if there are m cars and n pedestrian there will be in total m*n
messages in the system so it will require some time for a car to process the messages.
This time delay is known as communication delay. The communication delay may
also occur due to packet collision. Packet collision occur if there are more than one
packet in the system and it is directly proportional to number of messages.
Delay on receiver side (Dp):
Signal processing delay includes delay during message decoding, AEB information
merging; command to actual braking as shown below:
a. Message preprocessing
As there may be many messages received from V2V network simultaneously [35],
the message queuing and decoding may cause some delay. Thus it can be said that
delay due to message merging is directly proportional to the number of messages
received by the vehicle.
b. Message merge
There may be many senders in V2V-AEB system. Each vehicle may provide
different information for the same object [35]. Merging all information provided by
different senders causes certain delay.
c. Tracking
Abruptly change in the position of the pedestrian or too many objects in the
system may confuse the system [35] which can cause the delay while tracking. For
example, if the pedestrian got panic and changes its motion suddenly, the system will
require some time to follow the pedestrian, this will lead to a delay in the system.
d. Pedestrian information merge
While merging the information provided by its AEB system and other vehicles in
V2V network [35] there can be some delay. As both the information can be different
and it will require some time to merge those pieces of information.

46
Mechanical delay (Dm):
While communicating the decision to the braking system to stop the vehicle, there
can be a delay. Also, weather condition may lead to decrease in braking efficiency
i.e. more time for stopping the vehicle. For example, if it is raining or there is snow
the friction between tires of the car and road will be less, which will lead to delay
in stopping the car. Assuming proper operation of the brake the minimum stopping
distance for an automobile is determined by the coefficient of friction between road
and tires. The kinetic energy of the car is required to reduce to zero by friction
force. If the wheels of the vehicle continue to turn while braking, the static friction is
operating, while the wheels are locked and sliding over the road surface, the braking
force is a kinetic friction force.
Kinetic energy to zero,
Work by friction = −µmgd = −1
2mv0
2 (3.2)
Stoppingdistance, d =v0
2
2µg(3.3)
The stopping distance is inversely proportional to friction coefficient. So as the friction
decreases the stopping distance increases. So the vehicle should start applying in
advance to stop at a particular point.
3.1 Mathematical Model to Reduce Effect of Delay
We have seen the reasons which may lead to delay in the system. Now we will
try to find mathematically, how can we overcome the delay in the system? Before
going forward, we define certain timing terms. Each vehicle model has its property;
they have different minimum time for breaking, i.e., time to stop for any particular
condition. All timing is in reference to potential collision location.

47
Time to collision (ttc): ttc is the instantaneous ratio of the distance to the
potential crash location to current vehicle velocity.
Time threshold for braking (ttb): Is the minimum time that the vehicle needs
with maximum braking to stop at a potential crash location in an idle condition.
Time to start braking: (tsb): Is the time from when the vehicle starts breaking
to vehicle stops at the potential crash location.
Fig. 2 explains ttb, tsb and ttc. When ttc = ttb, the vehicle needs to brake with
full power to avoid a collision. When ttc < ttb, the collision cannot be avoided. The
vehicle can only control tsb for avoiding a collision. For collision avoidance, following
condition must be satisfied
ttc ≥ tsb ≥ ttb (3.4)
Fig. 3.1. Vehicle’s ttb, tsb and ttc
To understand the effect of delay, let us consider the scenario as shown in Fig. 3.3.
C1, C2, and C3 represent car 1, 2 and 3 respectively. T1 represents the truck and P
represents the pedestrian. All vehicles are V2V-AEB enabled. This scenario shows
how the V2V-AEB system works and how delay may affect the proposed system.
Assuming C1 at point C1a cannot detect the pedestrian P , as P is obscured by T1.
But C2 can detects the pedestrian P at point x in time t1 and sends the information
to C3, C1 and T1. Assuming delay of time td in the system thus, C1 receives the
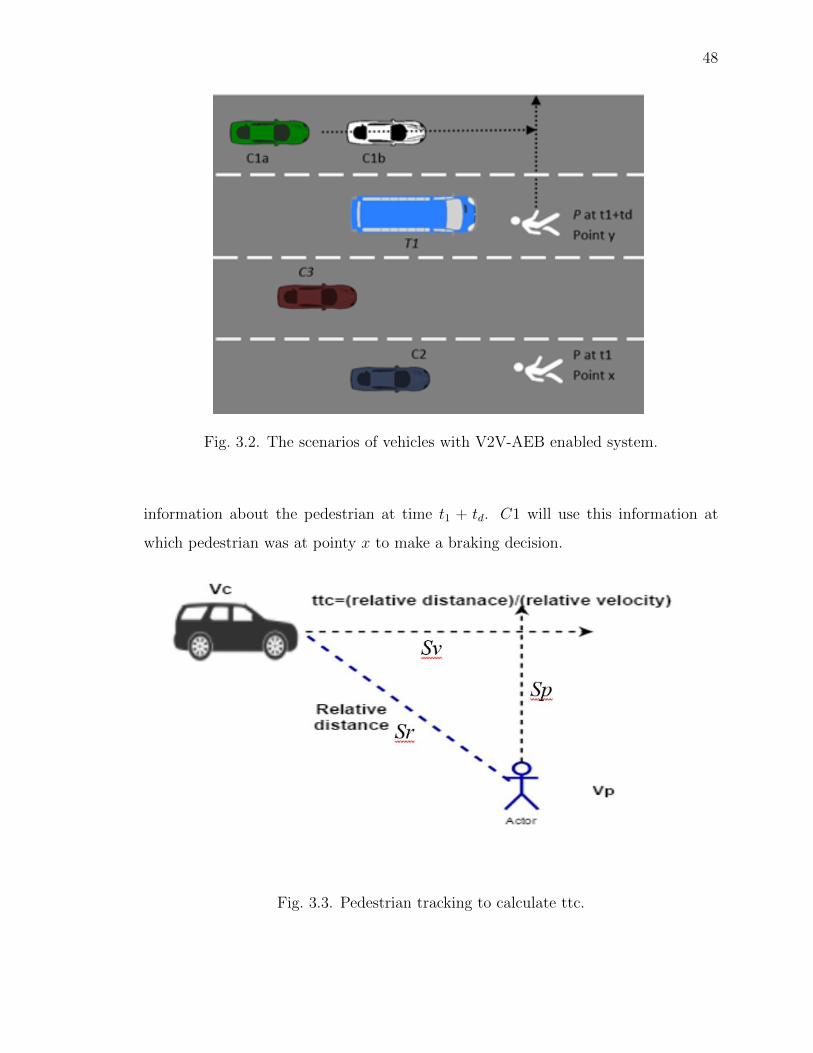
48
Fig. 3.2. The scenarios of vehicles with V2V-AEB enabled system.
information about the pedestrian at time t1 + td. C1 will use this information at
which pedestrian was at pointy x to make a braking decision.
Fig. 3.3. Pedestrian tracking to calculate ttc.
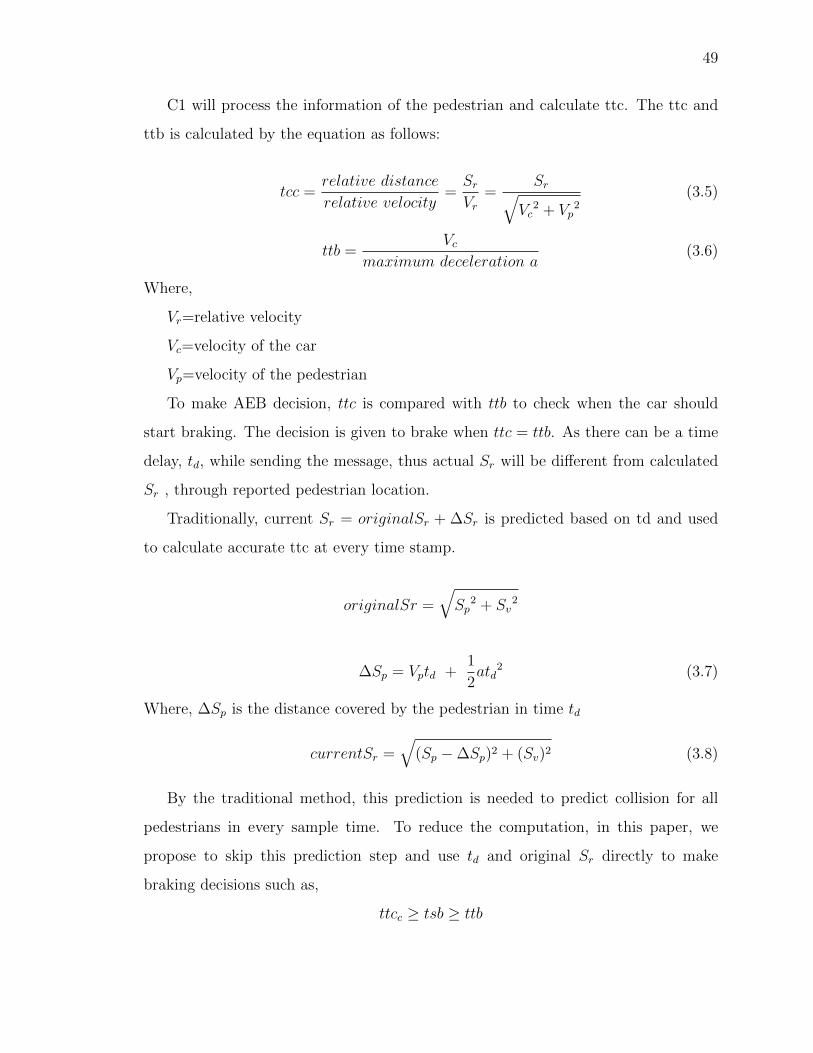
49
C1 will process the information of the pedestrian and calculate ttc. The ttc and
ttb is calculated by the equation as follows:
tcc =relative distance
relative velocity=Sr
Vr=
Sr√Vc
2 + Vp2
(3.5)
ttb =Vc
maximum deceleration a(3.6)
Where,
Vr=relative velocity
Vc=velocity of the car
Vp=velocity of the pedestrian
To make AEB decision, ttc is compared with ttb to check when the car should
start braking. The decision is given to brake when ttc = ttb. As there can be a time
delay, td, while sending the message, thus actual Sr will be different from calculated
Sr , through reported pedestrian location.
Traditionally, current Sr = originalSr + ∆Sr is predicted based on td and used
to calculate accurate ttc at every time stamp.
originalSr =√Sp
2 + Sv2
∆Sp = Vptd +1
2atd
2 (3.7)
Where, ∆Sp is the distance covered by the pedestrian in time td
currentSr =√
(Sp −∆Sp)2 + (Sv)2 (3.8)
By the traditional method, this prediction is needed to predict collision for all
pedestrians in every sample time. To reduce the computation, in this paper, we
propose to skip this prediction step and use td and original Sr directly to make
braking decisions such as,
ttcc ≥ tsb ≥ ttb

50
Let,
ttcc = ttco − ta (3.9)
Where,
ttcc = current time to collision after prediction
ttco= original time to collision without prediction
ta= time difference between original time to collision and current time to collision
Substituting value of ttcc from equation 3.9 in equation 3.4.
ttco − ta ≥ tsb ≥ ttb
ttco ≥ tsb+ ta ≥ ttb+ ta (3.10)
Thus from eq. 3.10 we can verify that by adding certain time to ttb and tsb we can
use the ttco derived from an original position of the pedestrian without calculating
the current position of the pedestrian. Now, let us explore the relationship between
communication delay and tsb such that a potential collision can be avoided, i.e. how
can we increase ttb as per delay in the system, to overcome the difference between
current ttcc and original ttco.
Fig. 3.4. Pedestrian tracking to calculate ttc with and without delay
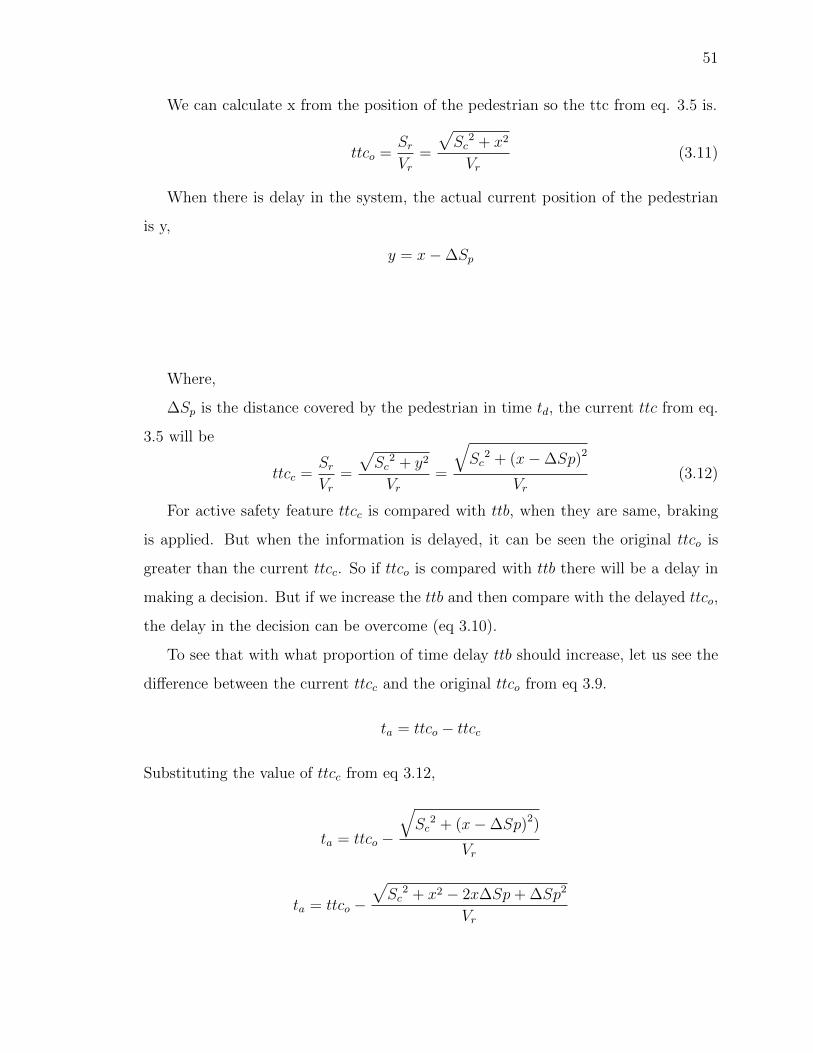
51
We can calculate x from the position of the pedestrian so the ttc from eq. 3.5 is.
ttco =Sr
Vr=
√Sc
2 + x2
Vr(3.11)
When there is delay in the system, the actual current position of the pedestrian
is y,
y = x−∆Sp
Where,
∆Sp is the distance covered by the pedestrian in time td, the current ttc from eq.
3.5 will be
ttcc =Sr
Vr=
√Sc
2 + y2
Vr=
√Sc
2 + (x−∆Sp)2
Vr(3.12)
For active safety feature ttcc is compared with ttb, when they are same, braking
is applied. But when the information is delayed, it can be seen the original ttco is
greater than the current ttcc. So if ttco is compared with ttb there will be a delay in
making a decision. But if we increase the ttb and then compare with the delayed ttco,
the delay in the decision can be overcome (eq 3.10).
To see that with what proportion of time delay ttb should increase, let us see the
difference between the current ttcc and the original ttco from eq 3.9.
ta = ttco − ttcc
Substituting the value of ttcc from eq 3.12,
ta = ttco −
√Sc
2 + (x−∆Sp)2)
Vr
ta = ttco −√Sc
2 + x2 − 2x∆Sp+ ∆Sp2
Vr

52
ta = ttco −
√Sc
2 + x2
Vr2− (2x∆Sp−∆Sp2)
Vr2
From equation 3.11,
ta = ttco −
√ttco
2 − (2x∆Sp−∆Sp2)
Vr2
ta = ttco −√ttco
2 − Z
Where,
Z =(2x∆Sp −∆Sp
2)
Vr2
Therefore,
ta = (ttco −√ttco
2 − Z)× (ttco +√ttco
2 − Z)
(ttco +√ttco
2 − Z)
ta =Z
(ttco +√ttco
2 − Z)
Therefore,
ta =Z
ttco
The braking decision is made when ttb is equal to ttc. So for making decision
minimum value of ttc can be ttb for AEB system to work. To get the maximum value
of ta we can substitute ttco as ttb.
Since, from equation 3.4 for proper decision making:
ttco ≥ ttb
Thus,

53
ta ≤Z
ttb(3.13)
From equation 3.7,
∆Sp = Vptd +1
2atd
2
For generalization let us assume that pedestrian walk with constant speed that is
acceleration is 0.
Therefore,
∆Sp = Vptd
Substituting the value of ∆Sp in equation of Z:
Z =2xVptd − Vp2td2
Vr2
Z =td(2xVp − Vp2td)
Vr2 (3.14)
Z is of the form mtd, and when Z is maximum ta is maximum. Assume,td 6= 0. Z ≤ 0
when the pedestrian has already passed the collision point.
As from eq (3.13)
ta <Z
ttb
Thus,
ta <td(2xVp − Vp2td)
Vr2 × ttb
(3.15)
From equation 3.10
ttco ≥ tsb+td(2xVp − Vp2td)
Vr2 × ttb
≥ ttb+td(2xVp − Vp2td)
Vr2 × ttb
Let,
Ntsb = tsb+td(2xVp − Vp2td)
Vr2 × ttb
Where,

54
Ntsb= new tsb
ttco ≥ Ntsb ≥ ttb+td(2xVp − Vp2td)
Vr2 × ttb
Thus, new tsb can be given as follows:
Ntsb = ttb+td(2xVp − Vp2td)
Vr2 × ttb
(3.16)
td = Curent time − time stamp of message (3.17)
Where,
td = Time delay in the system which can be found through the time stamp of
message.
Suppose, we want to keep some safe distance from pedestrian after vehicle com-
pletely stops, assume we keep ’d’ meter distance. So to keep the safe distance of d
meter, new ttb is calculated as follows:
Fig. 3.5. To calculate ttb to stop at a distance (d) before collision
To calculate ttb to stop d distance before a collision, we can consider how much
time vehicle will take to travel distance d. Assuming, its initial velocity to be 0,

55
which will be its final velocity after stopping and considering deceleration of vehicle
as acceleration.
d =1
2am × ttd2
Where,
am=maximum decceleration
ttd=Time to travel d distance
s=distance it travelled after maximum break is applied
Time to travel d distance, ttd =
√2d
am(3.18)
Therefore, to stop d distance before collision will be,
ttbs = ttb+ Time to travel d distance
Where,
ttbs = ttb to stop d distance before collision
d=distance we want to stop before collision point
Substituting the value of ttb from eq. 3.6 and ttd from eq (3.18)
ttbs =Vcam
+
√2d
am(3.19)
Where,
ttbs = ttb to stop d distance before collision
d=distance we want to stop before collision point
Substituting ttbs in equation 3.16 in place of ttb
Ntsb = ttb+
√2d
a+td(2xVp − Vp2td)
Vr2 × ttb
(3.20)
This Ntsb can be used to tackle delay and stop d meter before collision. Let us
see in next section how to dynamically change tsb and use equation 3.20 instead of
primitive method.
56
3.2 Algorithm to Reduce Effect of Delay
We have derived how to calculate a time to start braking (eq 3.20) to overcome
the delay in the system. We studied that delay in the system changes as the number
of pedestrian and vehicle in the system changes i.e. the volume of messages in the
system changes. As when number of vehicle and pedestrian in the system changes, the
number of message in the system changes, resulting in variation of delay in the system.
To tackle this variation, we use the self-evolving system. Whenever the volume of
messages in the system change or a new pedestrian is detected, it calculates a newtsb.
To calculate the new tsb vehicle checks, if the volume of the message in the V2V
network is changed or new pedestrian is detected, indeed if it is. The timestamp of
the delayed message is compared with the current time, and the difference of both is
used to calculate time delay of the system. In a V2V-AEB system, the car receives
information about vehicles in the network and pedestrians detected by other vehicles
in the system. If the number of the object received by a vehicle changes, it calculates
the time delay. To check the number of objects in the system, a vehicle can use a
counter to count the number of messages which describe the volume of the message in
the system. If volume increases or decreases, the vehicle will calculate the time delay
in the system. As vehicle has the information about the time when the message was
generated. Assuming while broadcasting the message in V2V network, the vehicle
attaches the timestamp at which the message is generated. If there is a change of
time delay in the system, it compares it with the previous time delay in the system.
If there is a difference or new pedestrian is detected, it calculates a new tsb.
New time to start braking is calculated as given by equation 3.20:
Ntsb = ttb+
√2d
a+td(2xVp − Vp2td)
Vr2 × ttb
After calculating Ntsb, V2V-AEB system uses it to make a decision through AEB
system as shown in Fig 7. The Ntsb is calculated for each pedestrian when it is
detected and used to make the braking decision unless the time delay is changed in
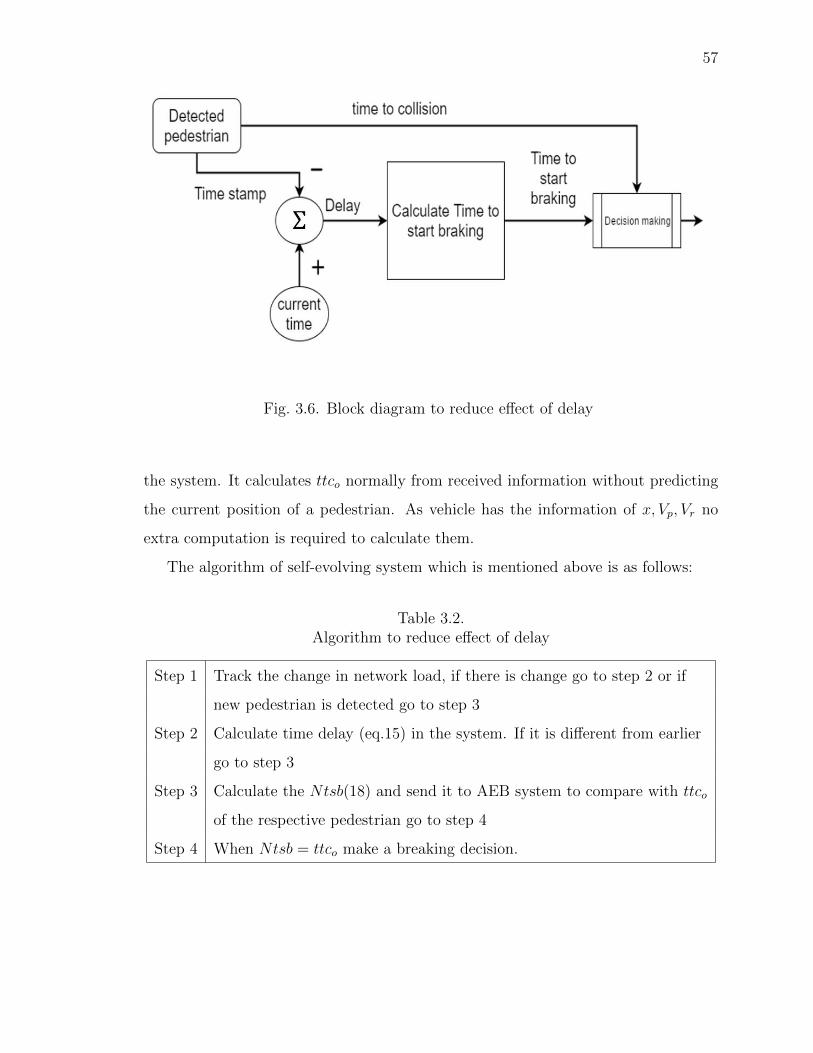
57
Fig. 3.6. Block diagram to reduce effect of delay
the system. It calculates ttco normally from received information without predicting
the current position of a pedestrian. As vehicle has the information of x, Vp, Vr no
extra computation is required to calculate them.
The algorithm of self-evolving system which is mentioned above is as follows:
Table 3.2.Algorithm to reduce effect of delay
Step 1 Track the change in network load, if there is change go to step 2 or if
new pedestrian is detected go to step 3
Step 2 Calculate time delay (eq.15) in the system. If it is different from earlier
go to step 3
Step 3 Calculate the Ntsb(18) and send it to AEB system to compare with ttco
of the respective pedestrian go to step 4
Step 4 When Ntsb = ttco make a breaking decision.

58
3.3 Result
We have stated how the proposed system works to handle the delay in the system.
PreScan software is used to demonstrate the algorithms for handling the delay in real
system. Following example in simulation helps to see the nature of delay and how it
affects the system.
Example: In the scenario as shown in Fig 5, the speed of the car is 14m/s, the
deceleration of the car is 12m/s2 and the speed of right and left pedestrians are
1.5m/s and 2m/s, respectively. The truck can detect both pedestrians and broadcast
the pedestrian information. The time delay is increased in the simulation to find the
Md.
Above figures (Fig. 3.8) shows the working of V2V-AEB system in the ideal
condition, i.e., Assuming, no delay in the scenario. The delay in the system is varied
for each run in the simulation. The proposed algorithm modulates its time to start
braking to overcome the delay in the system. However, it can be seen, that at a
particular point no matter how the time to start braking is increased the system fails,
i.e., at such point ttc < ttb. This delay is termed as maximum delay Md. From the
previous method, the delay which can be handled by the system is less than 0.2s
in the simulation model. It can be seen that using proposed method we can handle
larger delay until its value is lesser than maximum delay. The blue line depicts the
delay that can be handled by primitive methods.

59
(a) Vehicle started applying break using V2V-AEB system
(b) The front view when vehicles started applying break using V2V-AEB system
(c) The front view when pedestrian crossed the road safely
Fig. 3.7. V2V-AEB simulation

60
Fig. 3.8. Result of primitive method and proposed method

61
4. HANDLING DELAY IN V2V-AEB
In the previous section, we formulated a method to reduce the effect of delay in the
V2V-AEB system. However, if a delay is above certain point i.e. Md, the system
fails to overcome the delay. To make the proposed system more efficient, the delay
in the system should always be less than the threshold value i.e. Md. As studied in
the previous section, the delay is directly proportional to the number of messages.
Whereas, a major issue to be tackled in the proposed V2V-AEB system is the message
explosion due to a large amount of information available. For example, if there are
m cars in a situation and each car identifies n objects, and they create one message
for each detected object. Then there will be m × n messages in the scenario. This
many numbers of messages may lead to communication load, which will results in
communication delay due to packet collision also processing delay as every car will be
required to process (m− 1)× n messages and processing these many messages needs
time.
In this section, we try to answer a question: how to reduce the communication
messages and the message processing delay in the V2V-AEB system. In this sec-
tion, we will also discuss the various method to reduce communication messages and
message processing delay in V2V-AEB system [13]. The introduced method prevents
sending messages related to the vehicle or pedestrian who is not likely to cause a
crash (like the pedestrian who are walking on the footpath or who are standing off
the road). The other approach is clustering the pedestrians with related features in
a single message, thus reducing the load of messages in the system, which results
in the decrease of the communication and message processing delay. We will also
discuss message confidence by assigning the level of trust during the time of sending
a message.

62
4.1 Optimizing Vehicle Information
In a V2V-AEB system, the car sends the information about the pedestrian and
the vehicle that it detects through its onboard sensor. So it is important to decide
which information about the vehicle should be sent and how can we optimize the
amount of information without compromising with the efficiency of the system. As if
we neglect some important information about the vehicle in the scenario it will lead
to some severe accidents and excess of information will lead to increase in the volume
of the message in the scenario. This will result in an increase of communication delay
and processing delay that indirectly affect the decision making of the AEB system.
A. The question arises how to decide which vehicle information should be
sent.
Sending the information about the vehicles which are in V2V network is an excess
of information, as more precise information about those vehicles, are already in the
network [11]. We assume that the vehicle with the V2V feature shares the information
about its speed, location and its movement in the V2V network. Thus sending that
information again will be of no use and it will add up to more number of messages.
But the question arises to how to decide whether the vehicle is in the V2V network
or not?
a. How to decide which vehicles are in V2V network?
There can be several ways for this, like the car capable of V2V communication can
have some logo so that other vehicles can neglect to process those vehicles information
and to send it in the V2V network. As the vehicles do not have to process any data
for this, it will be faster, and it will take O(1) time. But having a logo is not likely
acceptable by private car owners.

63
The other way can be that the vehicle can compare the information from AEB
system and those received from the V2V network. If the two vehicles have almost the
same information, it can restrain itself from transmitting that information in V2V
network. However, as the GPS has some error, we cannot get the exact location of
the vehicle. One possible solution is that we can find the similar data having a similar
location, speed, and direction. Since vehicles have to process the information, in this
case, it will take more time and memory.
4.2 Optimizing Pedestrian Information
The vehicle can detect many objects on the road and roadside. Some pedestrians
are just standing or on the roadside that may not cause a potential collision. So
it is necessary to separate the information about that pedestrian who can cause a
potential collision and who does not. This will enable the vehicle to send the data
about those pedestrians that can be injured by the vehicle. So for decreasing the
V2V messages about pedestrians, it is necessary to decide which pedestrian causes
the potential collision.
The pedestrians walking on the sidewalk can be excluded from the V2V message,
as we expect the vehicle will not run on the sidewalk. This will considerably reduce the
amount of V2V messages without sabotaging the safety of the pedestrian. However,
if a pedestrian is leading towards the road, the vehicle should transmit the data about
this pedestrian as it might cause a safety issue.
A. Bifurcating the pedestrian using GPS coordinates:
Assuming that vehicles can get accurate GPS information and road boundary
information through on-board sensors, the location and boundary of a road can be
obtained out via linking them with Google maps. If the location of the pedestrian or
other objects is not on the road, then the car can neglect that object. As soon, GPS
will be more accurate to centimeter accuracy [36].

64
It can be observed from Fig. 4.1 that Google maps can be used to determine the
boundaries of roads. So this information about the road can be used to see if the
pedestrian is on the road or not.
Fig. 4.1. Location from Google map
B. Eliminating objects not likely to cause collision
a. If a pedestrian is behind a forward moving vehicle on the road, conveying the
data of that pedestrian to the vehicle ahead does not improve the safety (See Fig.
4.2). Since the vehicle will not harm the pedestrian at the backside of it Fig. 4.2.
Therefore, a subject vehicle can neglect the received messages from a car behind
it. The subject vehicle can also neglect to transmit information of the discovered
objects. If there is no vehicle behind the subject vehicle and the detected objects
is behind the vehicle in front. However, the question is the outline of no vehicle
behind the subject vehicle. As if a vehicle is too far from the pedestrian, then the
information of pedestrian is of no use for that vehicle. So it is necessary to decide
all those pedestrian whose information car should send. To decide which pedestrian
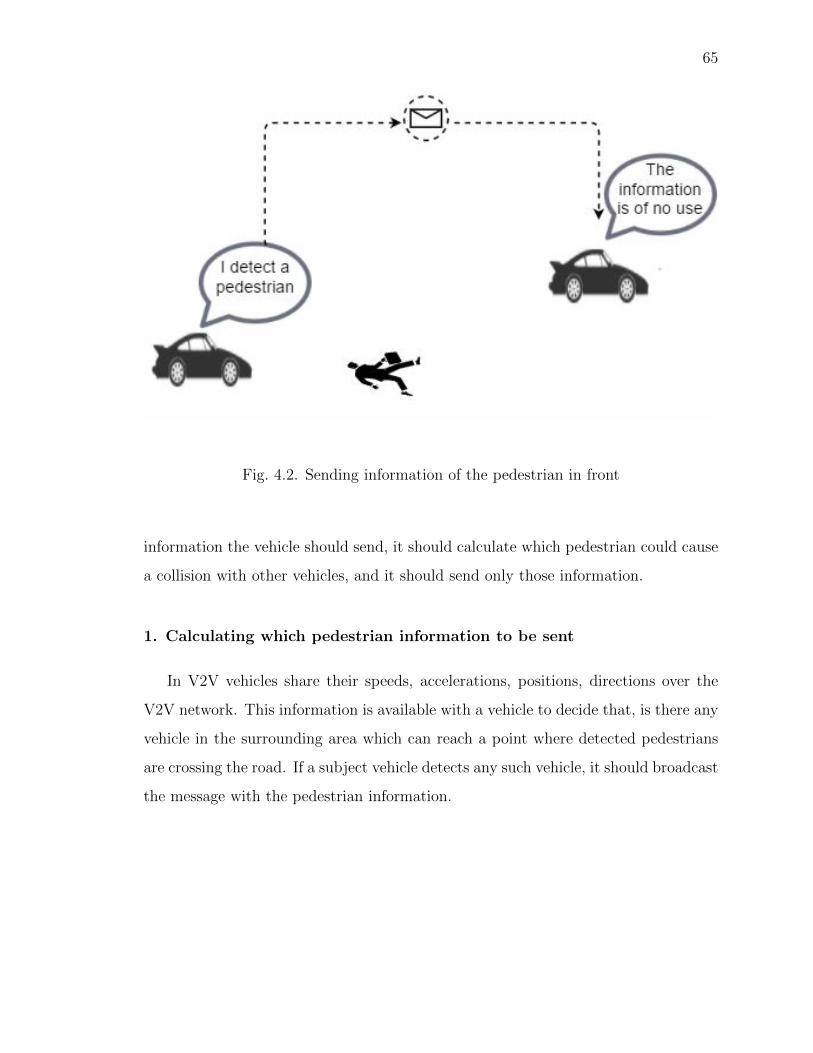
65
Fig. 4.2. Sending information of the pedestrian in front
information the vehicle should send, it should calculate which pedestrian could cause
a collision with other vehicles, and it should send only those information.
1. Calculating which pedestrian information to be sent
In V2V vehicles share their speeds, accelerations, positions, directions over the
V2V network. This information is available with a vehicle to decide that, is there any
vehicle in the surrounding area which can reach a point where detected pedestrians
are crossing the road. If a subject vehicle detects any such vehicle, it should broadcast
the message with the pedestrian information.

66
Let,
Vp =the pedestrian speed
L= length of road pedestrian has to cover
Vv= maximum speed of car
av =maximum acceleration of car
Tp= time for pedestrian to cross the road
Thus,
From distance formulae,
S = ut+1
2at2
Assuming, the acceleration of the pedestrian is 0
Time for pedestrian to cross the road,
Tp =L
Vp(4.1)
The maximum distance, Sv, between the vehicle behind the subject vehicle and
the detected pedestrian is used to determine if the pedestrian information should be
transmitted or not. Sv can be determined by distance formula considering (Tp) (eq
4.1) as a time required by the pedestrian to cross a road and maximum vehicle speed
and acceleration.
Sv = L× VvVp
+av × L2
2Vp2 (4.2)
Where,
Sv=maximum distance to decide whether to send the message or not
L=lane width
Vv=the speed of vehicle in behind
Vp= speed of pedestrian
av=the acceleration speed of vehicle behind the pedestrian
If a pedestrian is crossing the road, and there is a vehicle behind the subject
vehicle at a distance less than Sv to the detected pedestrian (eq 4.2), then the subject
vehicle should transmit the pedestrian information to the V2V network.

67
Example 1
The velocity of a pedestrian is 1.2 m/s and four lane road with a width of 3.7 m
of lane each lane. The maximum velocity of the vehicle in the road is 80km/hr. i.e.
22.22 m/s and maximum acceleration be 2m/s2.
Thus,
Sv = L× VvVp
+av × L2
2Vp2
= 3.7× 4× 22.22
1.2+
1× (3.7× 4)2
2× 1.22
= 426.15 meter
So, if a vehicle finds any other vehicle in the range of 426.15 meters in V2V
network, it can transmit the information about the pedestrian.
However, if there are many pedestrians and vehicle in the system, the processing
time to process all the information will be large. To tackle this problem, we can select
the pedestrian with minimum speed, as that will be the maximum time if one starts
with minimum speed to cross the road. The other question arises how to select the
value of Vv and av. Similar to pedestrian speed we can select the Vv as the maximum
value of vehicle velocity in the scenario and av as maximum acceleration value of the
vehicle to get maximum distance.
Example 2
A pedestrian is crossing a four-lane road at a speed 1.2 m/sec. The width of each
lane is 3.7 meter. The maximum velocity among all the vehicles behind the subject
vehicle is 80km/hr (22.22 m/s), and the maximum acceleration among all the vehicles
be 2m/s2 Thus, from eq 4.2
Sv = L× VvVp
+av × L2
2Vp2
= 3.7× 4× 22.22
1.2+
1× (3.7× 4)2
2× 1.22
= 426.15 m

68
Fig. 4.3. Block diagram to determine which pedestrian information should be sent
So, if a vehicle detects any other vehicle in the range of 426.15 meters in V2V
network, it can transmit the information about the pedestrian.

69
Table 4.1.Algorithm to determine which pedestrian information should be sent
Step 1 Calculate width of lane, L.
Step 2 Find minimum speed of pedestrians detected, Vp. Maximum speed of
vehicles present in the scenario, Vv and maximum acceleration av of
vehicles. Find minimum speed of pedestrians detected, Vp. Maximum
speed of vehicles present in the scenario, Vv and maximum acceleration
av of vehicles.
Step 3 Calculate maximum distance Sv ,using value calculated from step 1 and
2 Where,
Sv = L× Vv
Vp+ av×L2
2Vp2
Step 4 Find if there is any vehicle in the calculated maximum distance.
Step 5 If step 4 is true broadcast the message.
4.3 Grouping of Pedestrians
In V2V-AEB, each vehicle sends the data about the pedestrians they have de-
tected along with their vehicle information. Analyze a scenario of m V2V-AEB en-
abled vehicles and n pedestrians at a road intersection. If each vehicle can detect all
pedestrians and broadcast them to the V2V network, then each vehicle will receive
(m-1)n messages. The receiver vehicle has to process all these messages to make a
safety decision. To reduce the number of messages, we suggest a method to cluster
the pedestrian information in groups before transmitting them. Thus, reducing the
processing time of the vehicle on the receiver side and the communication delay due
to packet collision in V2V network.

70
For clustering these pedestrians, we cannot compromise the safety. Pedestrians
having similar information can be grouped as one pedestrian such that all pedestrians
will stay in a group until the time they cross the road safely so that they can be viewed
as one entity.
4.3.1 Working of the system
To group the pedestrian, we use a clustering technique. If the distances between
two pedestrians are less than a predefined threshold ’a’, and difference in their speed
is less than ’b’, then they are grouped in one cluster. The pedestrian information is
transmitted as a single pedestrian with the speed of minimum one which ensures us
all the pedestrian will cross the road safely and as one entity. The value of a and b
are selected such that pedestrian will remain in the same group until they cross the
street safely.
When a pedestrian is detected, we measure its distance from the detecting vehicle
and thus evaluate its position in an x-y plane before converting it into GPS coordinate
as shown below.
Fig. 4.4. Pedestrian detection by the vehicle
After calculating the x, y coordinate, velocity, and orientation of pedestrian, the
information is embedded in a matrix form.
To transmit the data of pedestrians as a group, it arranges the pedestrians in
ascending order as per their positions in the y-axis. The first pedestrian is selected
from the list and made as a hub. Then the pedestrians are selected and formed as

71
Table 4.2.Matrix for pedestrian information
Pedestrian Location (x) Location (y) Velocity Direction
1 x1 y1 v1 D1
2 x2 y2 v2 D2
3 x3 y3 v3 D2
4 x4 y4 v4 D1
5 x5 y5 V5 D2
a group whose distance from the hub is less than or equal to threshold a, difference
between their speeds is less than the threshold b and they are moving in the same
direction. Similarly, all the groups are created. The grouped pedestrian is transmitted
as the single entity with the average location of the pedestrians in the hub and
the lowest velocity among all the pedestrians in the hub. Before broadcasting the
information, the location is converted in the form of GPS coordinates.
As the pedestrian are arranged in ascending order of their y location, when we
discover the distance of a pedestrian to another pedestrian in the same hub is greater
than a, a new hub is created to other pedestrians. This process iterates until all
pedestrians are grouped.
Example 3
The example in Figure 7 shows how the ten pedestrians are grouped using the
proposed algorithm. Figure 7 represents the data array (dashed box) of the proposed
algorithm. Xs represent the pedestrian by parameter (x, y, and v), where x is its
location in the x-axis, y in y-axis and v is its speed. The pedestrian is arranged in
ascending order, according to its location in y-axis in an array (dashed box).
After arranging the pedestrians, the hub of the group is greedily selected in each
iteration. The pedestrian whose location difference is less than or equal to 1 meter

72
Fig. 4.5. Example of pedestrian groping
and the magnitude of the difference between speed is less than equal to 0.1m/s is
included in the group of the respective hub as described below.

73
In iteration 1:
The first element of the array is created as a hub. The box with a solid line
represents the group.
The pedestrians are selected whose distance, d =√
(x1 − x2)2 + (y1 − y2)2 is less
than 1 meter and difference of speed is less than or equal to 0.1m/s with respect to
the hub. Yellow X denotes the selected pedestrians i.e. 2nd and 3rd pedestrian, red
X denotes the hub, and the group is indicated by a box with a solid line. When no
pedestrians are left in an array whose distance is less than 1 meter and speed is less
than or equal to 0.1 m/s a new hub is created, and similarly, pedestrians are selected.
As we see that distance 4th pedestrian from the hub is 1.14 meter which is greater
than 1 meter. Thus it is not included in the group.
In iteration 2:
After completion of iteration 1 when no other pedestrian belongs to group 1.
The new pedestrian is selected as a hub from the array, i.e., pedestrian 4. The other
pedestrians (pedestrian 5 and 7) are selected to form a group as explained in iteration
1. It can be viewed, the difference of pedestrian (pedestrian6) velocity (—0.2—m/s)
is greater than 0.1m/s to the hub. Thus it is not included in the group.
In iteration 3:
Pedestrian 6 is selected as a new hub as it does not belong to any other group.
The other member (pedestrian 8 and 9) of the group is selected, similarly from the
array as described in iteration 1.

74
In iteration 4:
The 10th pedestrian does not belong to any other group. Thus, it is made as a
new hub.
The information about the hub is sent over V2V-AEB network; it is demonstrated
by the solid box. For the above example, ten pedestrians are grouped in 4 groups
after 4th iteration as seen above and the information is broadcasted when the array
is empty.
4.3.2 Result
Figure 9 shows the output for grouping of the pedestrians in the example. Each
blue dot indicates one hub whose information is transmitted through the V2V net-
work.
The 24 pedestrians were grouped into eight groups by the algorithm. Suppose
these 24 pedestrian and 20 cars are on the road, by using the grouping algorithm,
we can reduce the number of messages from 480 to 160. Thus on the receiver side
instead of processing 480 messages, it just has to process this 160 messages.
The sender side needs to process the 24 pedestrians to form groups and convert
the location of the hub of groups to GPS coordinates. Then the GPS locations can
be broadcasted over the V2V network.
4.4 Jamming of Network
There might be cases when there are many pedestrians on the road. For example,
around 14,000 pedestrian walk in one hour near west 34th street as per 2015 studies
[37]. Also, according to reports [37], there were as many as 55 pedestrian fatalities.
If all the information is shared over the V2V network, it will cause network overload,
leading to the large number of packet collision, communication delay, and message
processing delay. Thus, if there are too many pedestrians in the environment, the

75
Fig. 4.6. Algorithm for clustering
Note: ► This represent comment
Step1 Differentiate pedestrian as per their directions of crossing the road (here we consider 2 directions whether
pedestrians are moving left or right with respect to vehicle, as most of the pedestrians on the road try to cross the
road. thus they will come in this category. Other pedestrians who are not in this category can be sent as an individual
entity)
Step 2 Arrange pedestrian in increasing order of their location in y axis with respect to the vehicle.
Step 3 Select the first pedestrian (minimum location) from the array and make it as a hub. Total number of hubs,
m=1.
► m is the counter to count number of hubs
Step 4
For i= 2 to total number of pedestrians in the same direction of crossing the road
Calculate distance of pedestrian[i] from the hub
Calculate speed difference of pedestrian[i] and that of the hub
If (distance >a or difference of speed >b)
total number of hub is j=m,
► j is a memory used to store the number of hubs to use it as counter. So that, the information about total number of
hubs is not lost
while( j ≥1)
Calculate distance of pedestrian[i]
from hub[j]
Calculate speed difference of
pedestrian[i] with hub[j]
If ((distance<a) and (speed<b))
exit if loop
► it exit the loop as the pedestrian belongs to already existing group.
else
j=j-1
end if else loop
end while loop
Add as a new hub
m=m+1;
end if loop
end for loop
► Repeat step 4 for every direction
Step5: Broadcast all the hub information over DSRC network

76
Fig. 4.7. Grouping of pedestrians using MATLAB (blue dots indicate the hub)
best option will be preventing vehicle to send pedestrian messages (except in critical
emergency conditions such as medical emergency condition) over V2V network, to
avoid congestion in the network.
Therefore, the question arises what is the maximum number of pedestrians de-
tected that vehicle should stop sending pedestrian messages. However, it will not
be appropriate to select based on the number of pedestrians, because it might be
possible that just one vehicle can detect all pedestrians, whereas the pedestrians are
not in the line of sight of other vehicles. In this case, information from the vehicle
who can detect all the pedestrians is critical. So instead of determining the number of
pedestrians, we use the time delay in the network to decide whether a vehicle should

77
broadcast message of observed objects or not. When the network is congested and
the time delay in the system is such that no safety decision can be made in time to
benefit safety by using received information through V2V network, the vehicle can
stop sending messages of observed objects.
That is,
td ≥Maximum delay,Md
Such that,
ttc < ttb
Where,
Maximum delay (Md): the threshold time delay above which the AEB system
cannot avoid collision.
ttc = time to collision i.e. time when the car will collide with the object.
ttb = threshold time for braking, i.e. minimum time required by the vehicle to
stop the car.
td = time delay = Current time− time stamp
Therefore, the vehicle can stop sending messages when the time delay in the system
is above maximum delay and will continue sending the message only when a delay of
the system becomes lower than the maximum delay.
The introduced method can be executed as shown below (see Figure 4.8).The re-
ceived message from V2V-AEB message has the information about when the message
is generated. The time stamp from the received message is compared with the current
time to calculate the delay in receiving the message. If the calculated delay is found
above maximum delay, the vehicle does not construct the V2V message to broadcast
the object detected by its onboard sensor over a V2V network. Where, maximum de-
lay is the threshold time delay above which the AEB system cannot avoid a collision,
i.e., when time to collision to an object is greater than a threshold time for braking
(i.e. the minimum time required for the vehicle to stop).

78
Fig. 4.8. Block diagram to reduce jamming of the network
4.5 Message Confidence
It is also necessary that the pedestrian information accuracy is considered while
sending the message. We termed it as Message Confidence.
The accuracy of the information of the pedestrian depends on how close the object
is to the radar and camera and also the efficiency of the radar. We assume that the
company provides the efficiency of its radar in the form error per meter. Suppose the
range of the radar to detect pedestrian is from 0.15 m to 20 m and the error is 0.1
per meter. So we take the mean to be 10 meters assuming if the pedestrian is in the
range of 10 meter its information is almost correct.

79
To calculate the pedestrian confidence we divide ten by the range of pedestrian
to the car i.e. suppose the pedestrian is 12 m away from the car then its confidence
is (10−0.1×10)12
× 100 = 83.33% If it is less than 10 meter, its pedestrian confidence will
be greater than 100%. If the pedestrian confidence is greater than 100, we will round
it to 100% So the confidence of the message can be calculated as follows Percent
confidence = M(1-E)/D *100 M= mean of the range E= error of the radar in the
form error per meter D=distance of the object from the radar

80
5. CONCLUSION AND FUTURE WORK
5.1 Conclusion
The proposed algorithm can detect emergency condition by monitoring pulse rate
of the driver. During an emergency condition, the health monitoring system triggers
the vehicles V2V-AEB system. The V2V-AEB system helps the patient to park vehi-
cle safely and broadcast the emergency signal over the V2V network. It is necessary to
personalize the algorithm because every individual has different pulse rate pattern.
To tackle this condition, the algorithm is made adaptive to personalize as per the
user. The attribute for the system is extracted using five healthy person and eight
patient data, and it is tested on ten patient data and four healthy persons data. Also,
the pulse rate changes as per the activity user are performing. To identify activity
user is performing KNN algorithm was used which gave the accuracy of 87.1%. The
time complexity of KNN is O(nk+nd) (where n is the total number of data, k is the
nearest neighbor on whose bases activity is predicted, and d is the time required to
calculate the distance between 2 points). To reduce the time complexity 2nd stan-
dard deviation is used as a boundary line of the acceleration value for 3 activities
(running, resting, walking) with an accuracy of 78%. Then as per the activity user is
performing the pulse rate is monitored to detect the cardiac emergency condition.
In the third section, we studied the effect and reason of delay in V2V-AEB system.
It has been studied that delay is directly proportional to a number of message in the
system. We have proposed a new method to tackle this delay by increasing the time
to start braking, unlike primitive method to extrapolate trajectory of a pedestrian at
every time stamp.
81
Instead of just assigning one number as a time to start braking, the system can
calculate the time to start braking as per delay in the system. Using the proposed
algorithm, we can handle large value of delay compared with the primitive method as
shown in the results. Thus making the system robust, as it will minimize the effect
of delay.
However, if the delay is large precisely at the point when time to collision is
lesser than a threshold time for braking the proposed system also fails. Thus to
make a system more efficient, the delay in the system should always be kept below
the threshold value. The proposed system helps to reduce communication delay and
processing delay in the system by reducing the number of message in the V2V-AEB
network. Thus, it increases the chance that V2V-AEB system makes the decision on
time. Using the method of elimination, information about some pedestrians are not
sent if they are not on the road or there is no vehicle in the range to cause a potential
collision. Further, the proposed method of grouping is tested in a simulation with 24
pedestrians which were grouped into eight groups. We also discussed the method to
prevent V2V network jamming, by monitoring delay in the network.
5.2 Contributions
The focus of this research is to develop an Intelligent cardiac monitoring system
and integrating with the V2V-AEB system. The developed intelligent cardiac mon-
itoring system tracks acceleration sensor data and pulse rate to predict heart attack
of the driver. Datasets of healthy persons and heart attack patients are used to test
the developed system. The system is also tested in real time using FRDM-K64 and a
heart rate sensor module. The data of the pulse rate is sent to the cloud using an IOT
platform provided by the AT&T company. The integration of the cardiac monitoring
system with the V2V-AEB system is simulated using PreScan. The pulse rate of the
heart patients is fed in the simulation to test the heart attack cases while driving.

82
Since there will be a large number of messages in the proposed system, it may
lead to delay and network congestion. The delays are one of the main constraints
in V2V-AEB system as it is a real time system. A method is proposed to handle
this delay in the V2V-AEB system by changing vehicles time to start braking as per
delay in the scenario. The proposed system is mathematically proved and tested in
the simulation. However, if the delay in the system is above certain value such that
time to collision is less than time to start braking the proposed system to handle
delay fails. Therefore it is necessary to keep delay under a certain value i.e. Md.
Various methods to reduce delay and network congestion have been formulated and
implemented in the simulation.
5.3 Future work
The further extension of this project can be to detect the drowsy condition of the
driver. It can also determine if a person is intoxicated due to alcohol consumption. To
increase the accuracy of the predictions we need to train this network with different
datasets containing different demographics and conditions. BMI is the body mass
index, which is an important factor in analyzing the users health condition. Also, we
can include inputs such as if a person is a smoker or non-smoker and manipulate the
pulse rate setting and the time we wait to observe the patients data could be reduced
in such cases. Various other factors are required to include in the code, and one of the
inputs that user gives would be his previous medical history where he needs to enter
if he has had conditions such as, asthma, high or low blood pressure, any cardiac
arrests, etc. Depending upon such conditions, the program needs to be trained to
sense any irregularities and make desired decision.
The algorithm to reduce the effect of delay in the system can be advanced by
considering weather condition and storing the performance of the vehicle at various
scenarios. Other advance methods such as neural network can be used to get more
precise values.

REFERENCES

83
REFERENCES
[1] W. H. Organization, Global status report on road safety: time for action. WorldHealth Organization, 2009.
[2] J. B. Kenney, “Dedicated short-range communications (dsrc) standards in theunited states,” Proceedings of the IEEE, vol. 99, no. 7, pp. 1162–1182, 2011.
[3] J. V. Bond III, G. H. Engelman, J. Ekmark, J. L. Jansson, M. N. Tarabishy,and L. Tellis, “Autonomous emergency braking system,” US Patent 6,523,912,February 25, 2003.
[4] J. Lenard, R. Danton, M. Avery, A. Weekes, D. Zuby, and M. Kuhn, “Typicalpedestrian accident scenarios for the testing of autonomous emergency brakingsystems,” in Enhanced Safety of Vehicles (ESV) Conference, Washington, USA,2011.
[5] J. Duffy, “The 25 best fitness apps of 2017,” http://www.pcmag.com/article2/0,2817,2485287,00.asp, last date accessed: 06/28/2017.
[6] C. Allison and B. Caddy, “Food trackers: The best calorie counterapps and wearables,” https://www.wareable.com/health-and-wellbeing/food-trackers-the-best-calorie-counter-apps-and-wearables, last date accessed:06/28/2017.
[7] A. Aliedani, S. W. Loke, A. Desai, and P. Desai, “Investigating vehicle-to-vehiclecommunication for cooperative car parking: The copark approach,” in SmartCities Conference (ISC2), 2016 IEEE International. IEEE, 2016, pp. 1–8.
[8] D. N. Dewees, “Are Automated Vehicles Coming at the Right Speed?” https://ideas.repec.org/p/tor/tecipa/tecipa-564.html, University of Toronto, Depart-ment of Economics, Working Papers tecipa-564, August 2016, last date accessed:06/28/2017.
[9] T. L. Willke, P. Tientrakool, and N. F. Maxemchuk, “A survey of inter-vehiclecommunication protocols and their applications,” IEEE Communications Sur-veys & Tutorials, vol. 11, no. 2, 2009.
[10] M. Heesen, M. Dziennus, T. Hesse, A. Schieben, C. Brunken, C. Loper, J. Kelsch,and M. Baumann, “Interaction design of automatic steering for collision avoid-ance: challenges and potentials of driver decoupling,” IET intelligent transportsystems, vol. 9, no. 1, pp. 95–104, 2014.
[11] B. Tang, “Pedestrian protection using the integration of v2v communication andpedestrian automatic emergency braking system,” Purdue University MastersThesis, 2015.

84
[12] T. I. Website, “Prescan overview,” https://www.tassinternational.com/prescan-overview, 2015, last date accessed: 02/28/2017.
[13] S. Bhatanagar, S. Chien, and Y. Chen, “Reducing delay in v2v-aeb system byoptimizing messages in the system,” 25th International technical conference onEnhanced Safety of Vehicle, ESV, no. 17-0330, 2017.
[14] N. Sarraf-Zadegan, G. Sadri, H. Malek-Afzali, M. Baghaei, N. Mohammadi-Fard,S. Shahrokhi, H. Tolooie, M. Poormoghaddas, M. Sadeghi, A. Tavassoli et al., “Is-fahan healthy heart programme: a comprehensive integrated community-basedprogramme for cardiovascular disease prevention and control. design, methodsand initial experience,” Acta cardiologica, vol. 58, no. 4, pp. 309–320, 2003.
[15] K. Srinivas, G. R. Rao, and A. Govardhan, “Analysis of coronary heart diseaseand prediction of heart attack in coal mining regions using data mining tech-niques,” in 5th International Conference on Computer Science and Education(ICCSE). IEEE, 2010, pp. 1344–1349.
[16] H. W. Khaing, “Data mining based fragmentation and prediction of medicaldata,” in 3rd International Conference on Computer Research and Development(ICCRD), vol. 2. IEEE, 2011, pp. 480–485.
[17] X. Zhen-yuan, W. Chang-li, C. He, and W. Jing, “Network anomaly recogni-tion based on cauchy particle swarm optimization algorithm-rbf neural network,”in International Conference on Computers, Communications, and Systems (IC-CCS). IEEE, 2015, pp. 252–255.
[18] A. Jaiswal, E. Pandey, P. Swapnil, S. Kumar, J. R. Yathav, A. Bailur et al., “Aninnovative approach to monitor the variation in blood pressure using bernoulliprinciple, pulse transit time and heart rate variability,” in India Conference(INDICON), 2015 Annual IEEE. IEEE, 2015, pp. 1–4.
[19] E. Jovanov, A. Lords, D. Raskovic, P. G. Cox, R. Adhami, and F. Andrasik,“Stress monitoring using a distributed wireless intelligent sensor system,” IEEEEngineering in Medicine and Biology Magazine, vol. 22, no. 3, pp. 49–55, 2003.
[20] C. J. Sheela and L. Vanitha, “Prediction of sudden cardiac death using supportvector machine,” in International Conference on Circuit, Power and ComputingTechnologies (ICCPCT). IEEE, 2014, pp. 377–381.
[21] A. Angelone and N. A. Coulter, “Respiratory sinus arrhythmia: a frequencydependent phenomenon,” Journal of Applied Physiology, vol. 19, no. 3, pp. 479–482, 1964.
[22] M. Arif and A. Kattan, “Physical activities monitoring using wearable accel-eration sensors attached to the body,” PloS one, vol. 10, no. 7, p. e0130851,2015.
[23] A. Reiss and D. Stricker, “Introducing a new benchmarked dataset for activitymonitoring,” in 16th International Symposium on Wearable Computers (ISWC).IEEE, 2012, pp. 108–109.
[24] M. Lichman, “UCI machine learning repository,” http://archive.ics.uci.edu/ml,University of California, Irvine, School of Information and Computer Sciences,2013, last date accessed: 06/28/2017.

85
[25] A. Reiss and D. Stricker, “Creating and benchmarking a new dataset for phys-ical activity monitoring,” in Proceedings of the 5th International Conference onPErvasive Technologies Related to Assistive Environments. ACM, 2012, p. 40.
[26] J. Nikhilesh, E. Jeff, and T. Kate, “Heart rate vs pulse,” http://www.diffen.com/difference/Heart Rate vs Pulse, last date accessed: 06/28/2017.
[27] B. Nes, I. Janszky, U. Wisløff, A. Støylen, and T. Karlsen, “Age-predicted maxi-mal heart rate in healthy subjects: The hunt fitness study,” Scandinavian journalof medicine & science in sports, vol. 23, no. 6, pp. 697–704, 2013.
[28] W. C. Miller, J. P. Wallace, and K. E. Eggert, “Predicting max hr and the hr-vo2relationship for exercise prescription in obesity.” Medicine and science in sportsand exercise, vol. 25, no. 9, pp. 1077–1081, 1993.
[29] A. C. of Sports Medicine et al., “The recommended quantity and quality ofexercise for developing and maintaining cardiorespiratory and muscular fitness,and flexibility in healthy adults,” Med. Sci. Sports Exerc., vol. 30, pp. 975–991,1998.
[30] M. C. Staff, “Healthy lifestyle fitness,” http://www.mayoclinic.org/healthy-lifestyle/fitness/in-depth/exercise-intensity/art-20046887?pg=2, lastdate accessed: 06/28/2017.
[31] A. F. Members, K. Dickstein, A. Cohen-Solal, G. Filippatos, J. J. McMurray,P. Ponikowski, P. A. Poole-Wilson, A. Stromberg, D. J. van Veldhuisen, D. Ataret al., “Esc guidelines for the diagnosis and treatment of acute and chronic heartfailure 2008: The task force for the diagnosis and treatment of acute and chronicheart failure 2008 of the european society of cardiology. developed in collabo-ration with the heart failure association of the esc (hfa) and endorsed by theeuropean society of intensive care medicine (esicm),” European heart journal,vol. 29, no. 19, pp. 2388–2442, 2008.
[32] C. C. Doctor, “Arrhythmia,” https://my.clevelandclinic.org/health/articles/arrhythmia, last date accessed: 04/28/2017.
[33] R. M. Carney, K. E. Freedland, P. K. Stein, J. A. Skala, P. Hoffman, and A. S.Jaffe, “Change in heart rate and heart rate variability during treatment fordepression in patients with coronary heart disease,” Psychosomatic Medicine,vol. 62, no. 5, pp. 639–647, 2000.
[34] F. Bryan, “A heart rate during a heart attack,” http://www.livestrong.com/article/187198-a-heart-rate-during-a-heart-attack/, last date accessed:06/28/2017.
[35] B. Tang, S. Chien, Z. Huang, and Y. Chen, “Pedestrian protection using theintegration of v2v and the pedestrian automatic emergency braking system,” inInternational Conference on Intelligent Transportation Systems (ITSC). IEEE,2016, pp. 2213–2218.
[36] J. K. Kim, J. W. Kim, J. H. Kim, T. H. Jung, Y. J. Park, Y. H. Ko, and S. Jung,“Experimental studies of autonomous driving of a vehicle on the road using lidarand dgps,” in International Conference on Control, Automation and Systems(ICCAS). IEEE, 2015, pp. 1366–1369.
86
[37] W. Hu, “New yorks sidewalks are so packed, pedestrians are tak-ing to the streets,” https://www.nytimes.com/2016/07/01/nyregion/new-york-city-overcrowded-sidewalks.html, last date accessed: 04/28/2017.