Integration of Segmented Microflow Chemistry and Online ...
12
S1 SUPPORTING INFORMATION Integration of Segmented Microflow Chemistry and Online HPLC/MS Analysis on a Microfluidic Chip System Enabling Enantioselective Analyses at the Nanoliter Scale Sebastian K. Piendl, a Thomas Schönfelder, b Matthias Polack, a Laura Weigelt, a Till van der Zwaag, c Thorsten Teutenberg, c Erik Beckert, b and Detlev Belder a* a Institute of Analytical Chemistry, Leipzig University, Linnéstraße 3, 04103 Leipzig, Germany. b Fraunhofer Institute for Applied Optics and Precision Engineering (IOF), Albert-Einstein-Str. 7, 07745 Jena, Germany c Institut für Energie- und Umwelttechnik e. V., Bliersheimer Str. 58-60, 47229, Duisburg, Germany * Corresponding author: [email protected] Table of contents: Supplementary Information on the Chip Design S2 Figure S1: Overview of the different chip layers and side view on the clearance holes S2 Epifluorescence Setup & Instrumentation S3 Figure S2: Epifluorescence microscope used for chromatographic experiments S3 Table S1: Overview of fluorescence filter used for optical detection S3 Setup and Parameters for Chip/MS Coupling S4 Table S2: MS parameters used during chip/MS experiments S4 Figure S3: Photograph of the droplet-HPLC/MS setup S4 Chromatographic and Fluidic Characterization of the Chip-HPLC System S5 Figure S4: Pressure stability curve and Van-Deemter plot of the newly developed droplet-HPLC chip device S5 Figure S5: Negative CAD model of the microfluidic channels used for fluid simulations S5 Figure S6: Fluidic simulations of the band dispersion effects induced by the chip-rotor structure S6 Additions to the Analysis of the Segmented Analyte Mixture S7 Figure S7: Schematic drawing of the experimental setup used for the segmentation of the analyte mixture S7 Table S3: Detailed description of the applied optical system for the online analysis of a segmented analyte mixture S7 Figure S8: Three superimposed chromatographic runs obtained from segment analysis S8 Additions to the Analysis of a Segmented Off-Chip Reaction Mixture S9 Figure S9: Instrumentation for the on-line analysis of a segmented off-chip reaction mixture S9 Figure S10: Photograph of the segmentation setup used S9 Table S4: MS parameters used during chip/MS experiments S10 Figure S11: Typical chromatogram obtained after the analysis of a segmented reaction mixture S10 Additions to Segmentation, Reaction, and HPLC/MS Analysis on a Microfluidic Chip System S11 Figure S12: Schematic drawing of the microfluidic chip system used for segmentation and analysis S11 Table S5: Detailed experimental conditions used for on-chip segmentation, reaction, and analysis S11 References S12 Electronic Supplementary Material (ESI) for Lab on a Chip. This journal is © The Royal Society of Chemistry 2021
Transcript of Integration of Segmented Microflow Chemistry and Online ...
S1
SUPPORTING INFORMATION
Integration of Segmented Microflow Chemistry and Online HPLC/MS
Analysis on a Microfluidic Chip System Enabling Enantioselective
Analyses at the Nanoliter Scale
Sebastian K. Piendl,a Thomas Schönfelder,b Matthias Polack,a Laura Weigelt,a Till van der Zwaag,c Thorsten
Teutenberg,c Erik Beckert,b and Detlev Beldera*
a Institute of Analytical Chemistry, Leipzig University, Linnéstraße 3, 04103 Leipzig, Germany.
b Fraunhofer Institute for Applied Optics and Precision Engineering (IOF), Albert-Einstein-Str. 7, 07745 Jena, Germany
c Institut für Energie- und Umwelttechnik e. V., Bliersheimer Str. 58-60, 47229, Duisburg, Germany
* Corresponding author: [email protected]
Table of contents:
Supplementary Information on the Chip Design S2
Figure S1: Overview of the different chip layers and side view on the clearance holes S2
Epifluorescence Setup & Instrumentation S3
Figure S2: Epifluorescence microscope used for chromatographic experiments S3
Table S1: Overview of fluorescence filter used for optical detection S3
Setup and Parameters for Chip/MS Coupling S4
Table S2: MS parameters used during chip/MS experiments S4
Figure S3: Photograph of the droplet-HPLC/MS setup S4
Chromatographic and Fluidic Characterization of the Chip-HPLC System S5
Figure S4: Pressure stability curve and Van-Deemter plot of the newly developed droplet-HPLC chip device S5
Figure S5: Negative CAD model of the microfluidic channels used for fluid simulations S5
Figure S6: Fluidic simulations of the band dispersion effects induced by the chip-rotor structure S6
Additions to the Analysis of the Segmented Analyte Mixture S7
Figure S7: Schematic drawing of the experimental setup used for the segmentation of the analyte mixture S7
Table S3: Detailed description of the applied optical system for the online analysis of a segmented analyte mixture S7
Figure S8: Three superimposed chromatographic runs obtained from segment analysis S8
Additions to the Analysis of a Segmented Off-Chip Reaction Mixture S9
Figure S9: Instrumentation for the on-line analysis of a segmented off-chip reaction mixture S9
Figure S10: Photograph of the segmentation setup used S9
Table S4: MS parameters used during chip/MS experiments S10
Figure S11: Typical chromatogram obtained after the analysis of a segmented reaction mixture S10
Additions to Segmentation, Reaction, and HPLC/MS Analysis on a Microfluidic Chip System S11
Figure S12: Schematic drawing of the microfluidic chip system used for segmentation and analysis S11
Table S5: Detailed experimental conditions used for on-chip segmentation, reaction, and analysis S11
References S12
Electronic Supplementary Material (ESI) for Lab on a Chip.This journal is © The Royal Society of Chemistry 2021
S2
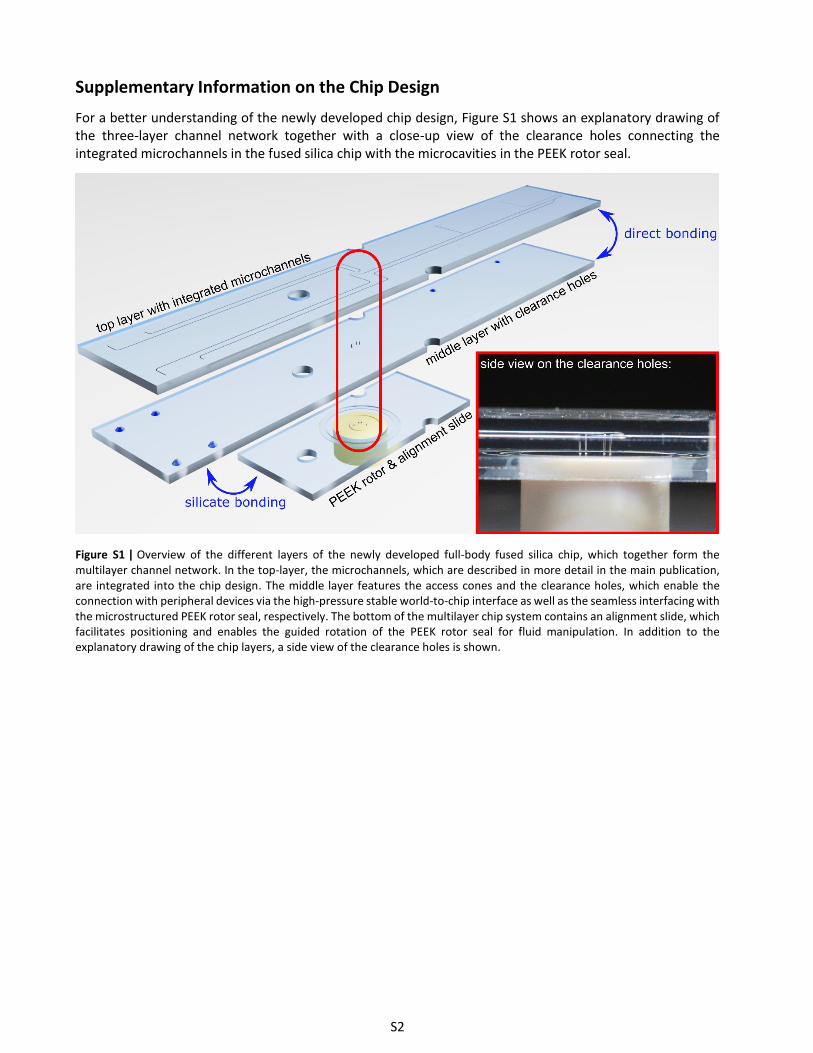
Supplementary Information on the Chip Design
For a better understanding of the newly developed chip design, Figure S1 shows an explanatory drawing of the three-layer channel network together with a close-up view of the clearance holes connecting the integrated microchannels in the fused silica chip with the microcavities in the PEEK rotor seal.
Figure S1 | Overview of the different layers of the newly developed full-body fused silica chip, which together form the multilayer channel network. In the top-layer, the microchannels, which are described in more detail in the main publication, are integrated into the chip design. The middle layer features the access cones and the clearance holes, which enable the connection with peripheral devices via the high-pressure stable world-to-chip interface as well as the seamless interfacing with the microstructured PEEK rotor seal, respectively. The bottom of the multilayer chip system contains an alignment slide, which facilitates positioning and enables the guided rotation of the PEEK rotor seal for fluid manipulation. In addition to the explanatory drawing of the chip layers, a side view of the clearance holes is shown.
S3
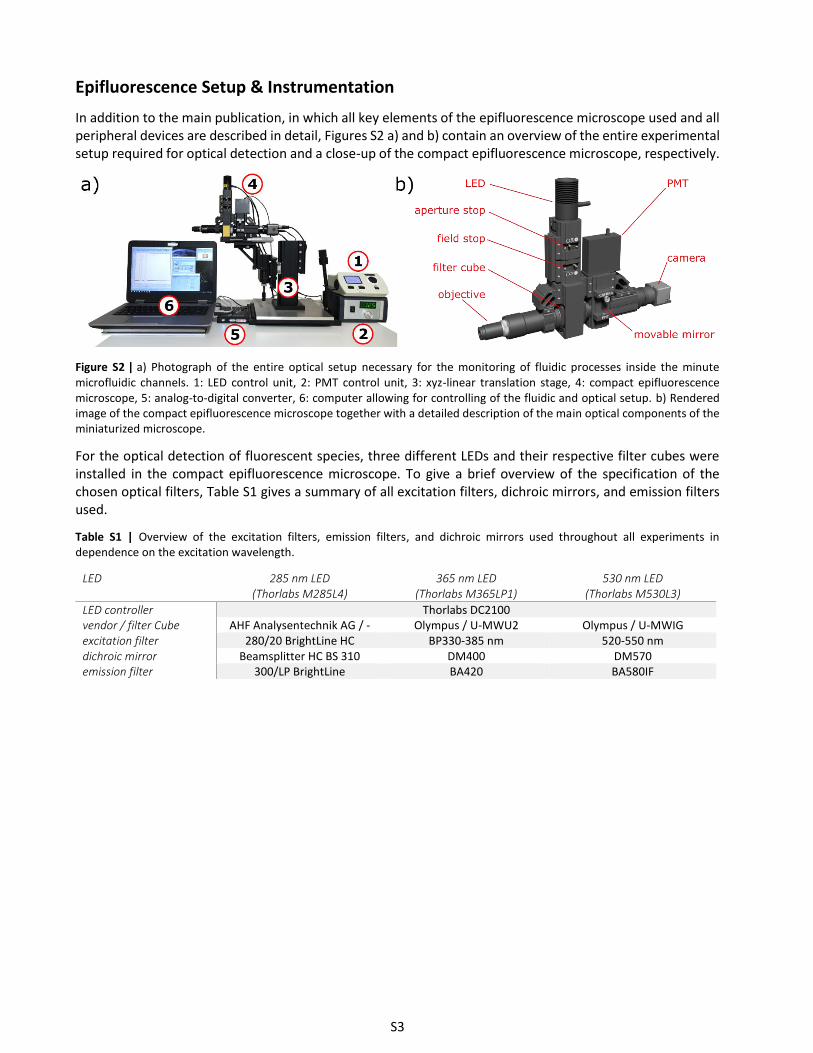
Epifluorescence Setup & Instrumentation
In addition to the main publication, in which all key elements of the epifluorescence microscope used and all peripheral devices are described in detail, Figures S2 a) and b) contain an overview of the entire experimental setup required for optical detection and a close-up of the compact epifluorescence microscope, respectively.
Figure S2 | a) Photograph of the entire optical setup necessary for the monitoring of fluidic processes inside the minute microfluidic channels. 1: LED control unit, 2: PMT control unit, 3: xyz-linear translation stage, 4: compact epifluorescence microscope, 5: analog-to-digital converter, 6: computer allowing for controlling of the fluidic and optical setup. b) Rendered image of the compact epifluorescence microscope together with a detailed description of the main optical components of the miniaturized microscope.
For the optical detection of fluorescent species, three different LEDs and their respective filter cubes were installed in the compact epifluorescence microscope. To give a brief overview of the specification of the chosen optical filters, Table S1 gives a summary of all excitation filters, dichroic mirrors, and emission filters used.
Table S1 | Overview of the excitation filters, emission filters, and dichroic mirrors used throughout all experiments in dependence on the excitation wavelength.
LED 285 nm LED (Thorlabs M285L4)
365 nm LED (Thorlabs M365LP1)
530 nm LED (Thorlabs M530L3)
LED controller Thorlabs DC2100 vendor / filter Cube AHF Analysentechnik AG / - Olympus / U-MWU2 Olympus / U-MWIG excitation filter 280/20 BrightLine HC BP330-385 nm 520-550 nm dichroic mirror Beamsplitter HC BS 310 DM400 DM570 emission filter 300/LP BrightLine BA420 BA580IF
S4
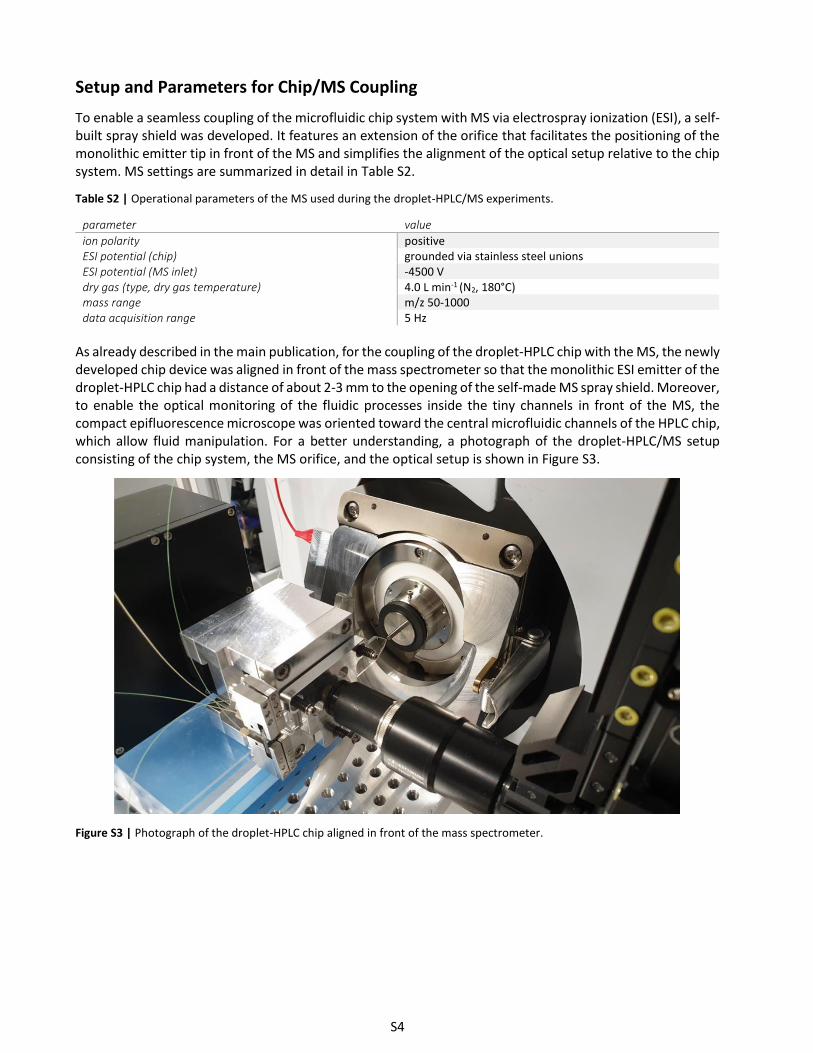
Setup and Parameters for Chip/MS Coupling
To enable a seamless coupling of the microfluidic chip system with MS via electrospray ionization (ESI), a self-built spray shield was developed. It features an extension of the orifice that facilitates the positioning of the monolithic emitter tip in front of the MS and simplifies the alignment of the optical setup relative to the chip system. MS settings are summarized in detail in Table S2.
Table S2 | Operational parameters of the MS used during the droplet-HPLC/MS experiments.
parameter value
ion polarity positive ESI potential (chip) grounded via stainless steel unions ESI potential (MS inlet) -4500 V dry gas (type, dry gas temperature) 4.0 L min-1 (N2, 180°C) mass range m/z 50-1000 data acquisition range 5 Hz
As already described in the main publication, for the coupling of the droplet-HPLC chip with the MS, the newly developed chip device was aligned in front of the mass spectrometer so that the monolithic ESI emitter of the droplet-HPLC chip had a distance of about 2-3 mm to the opening of the self-made MS spray shield. Moreover, to enable the optical monitoring of the fluidic processes inside the tiny channels in front of the MS, the compact epifluorescence microscope was oriented toward the central microfluidic channels of the HPLC chip, which allow fluid manipulation. For a better understanding, a photograph of the droplet-HPLC/MS setup consisting of the chip system, the MS orifice, and the optical setup is shown in Figure S3.
Figure S3 | Photograph of the droplet-HPLC chip aligned in front of the mass spectrometer.
S5
Chromatographic and Fluidic Characterization of the Chip-HPLC System
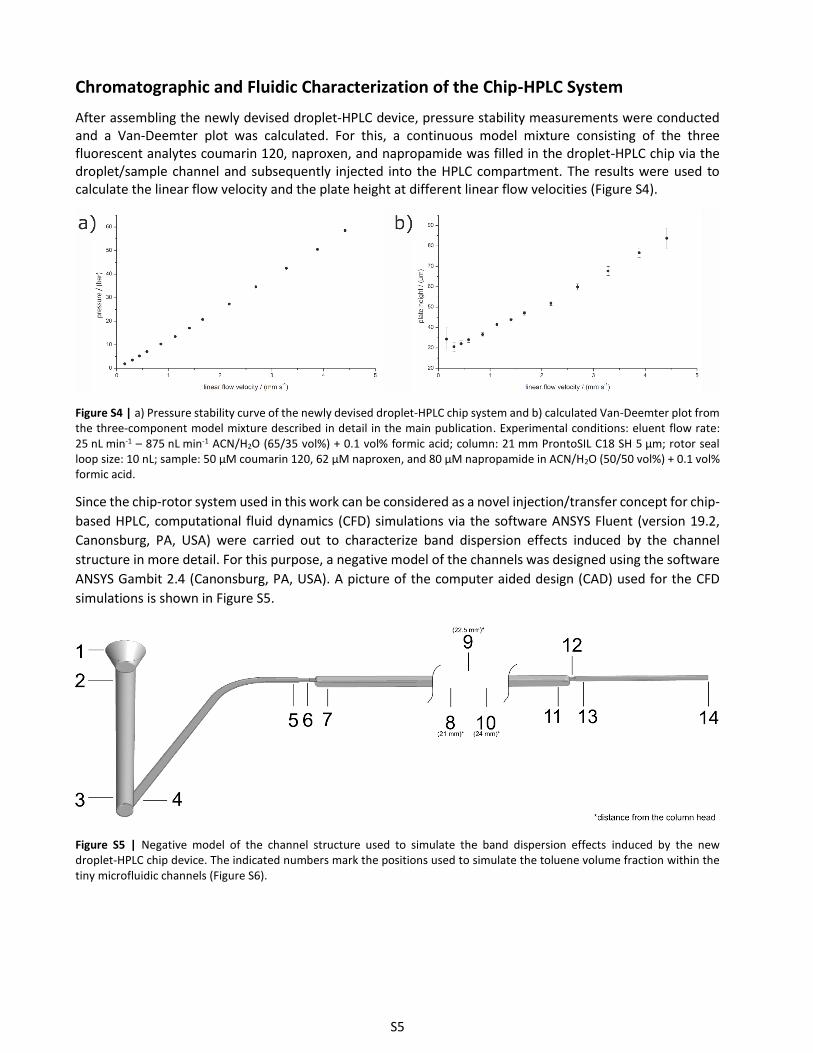
After assembling the newly devised droplet-HPLC device, pressure stability measurements were conducted and a Van-Deemter plot was calculated. For this, a continuous model mixture consisting of the three fluorescent analytes coumarin 120, naproxen, and napropamide was filled in the droplet-HPLC chip via the droplet/sample channel and subsequently injected into the HPLC compartment. The results were used to calculate the linear flow velocity and the plate height at different linear flow velocities (Figure S4).
Figure S4 | a) Pressure stability curve of the newly devised droplet-HPLC chip system and b) calculated Van-Deemter plot from the three-component model mixture described in detail in the main publication. Experimental conditions: eluent flow rate: 25 nL min-1 – 875 nL min-1 ACN/H2O (65/35 vol%) + 0.1 vol% formic acid; column: 21 mm ProntoSIL C18 SH 5 µm; rotor seal loop size: 10 nL; sample: 50 µM coumarin 120, 62 µM naproxen, and 80 µM napropamide in ACN/H2O (50/50 vol%) + 0.1 vol% formic acid.
Since the chip-rotor system used in this work can be considered as a novel injection/transfer concept for chip-
based HPLC, computational fluid dynamics (CFD) simulations via the software ANSYS Fluent (version 19.2,
Canonsburg, PA, USA) were carried out to characterize band dispersion effects induced by the channel
structure in more detail. For this purpose, a negative model of the channels was designed using the software
ANSYS Gambit 2.4 (Canonsburg, PA, USA). A picture of the computer aided design (CAD) used for the CFD
simulations is shown in Figure S5.
Figure S5 | Negative model of the channel structure used to simulate the band dispersion effects induced by the new droplet-HPLC chip device. The indicated numbers mark the positions used to simulate the toluene volume fraction within the tiny microfluidic channels (Figure S6).

S6
For the simulation of diffusive mass transport in capillary systems, Wilke and Chang's approach has been
used.1 To emulate the fully porous 5 µm particles used as the stationary phase material in the separation
compartment, a porous medium was defined using the measured pressure drop across the separation
channel, the Burke-Plummer equation,2 and Darcy's law. Frictional heating was computed via a user defined
function so that a term in the energy conservation equation, depending on pressure drop and flow rate within
the packing, releases energy uniformly within the porous medium.3 Figure S6 shows the volume fraction of
the model substance toluene at different positions in the microfluidic channel plotted over time.
Figure S6 | CFD simulation of the model analyte toluene that is injected into the newly developed chip-rotor system. The individual graphs indicate the toluene volume fraction at the positions described in Figure S5. Simulation parameter: flow rate: 150 nL min-1 MeOH, injection volume: 10 nL, separation channel: porous medium emulating 5 µm fully porous particles.
Based on the simulation results shown in Figure S6, band dispersion effects induced by the clearance holes,
µ-frits, or channel dimensions can be investigated. In general, the results indicate that only minor band
dispersion effects are induced in the prototype used in this work. Potential for optimization lies mainly in the
clearance holes, which in this work were intentionally designed with a widening structure to facilitate the
alignment of the chip-rotor system. Even though these simulations cannot represent reality in its entirety,
such as sample concentration effects at the column head and mass transfer processes on the stationary
phase, they do give a first impression of the fluidic situation inside the microfluidic channels. By packing the
stationary phase with other materials or optimizing the flow rate, these band broadening effects can be
further reduced in practice.
S7
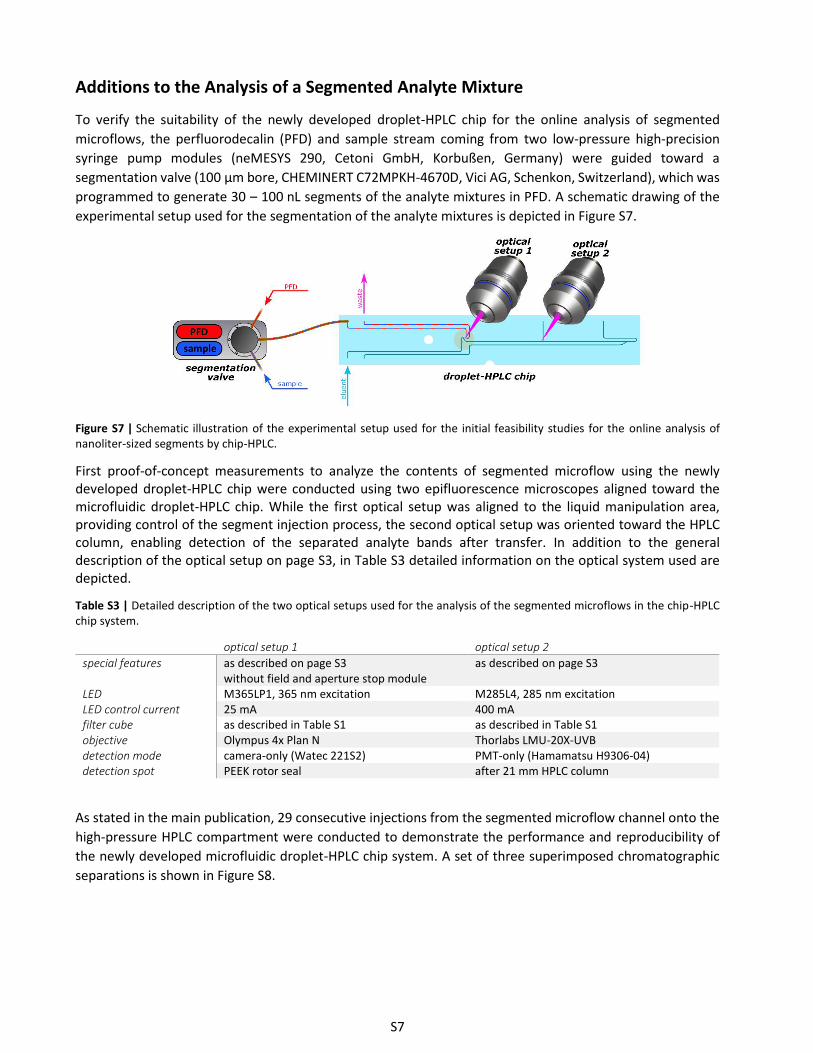
Additions to the Analysis of a Segmented Analyte Mixture
To verify the suitability of the newly developed droplet-HPLC chip for the online analysis of segmented
microflows, the perfluorodecalin (PFD) and sample stream coming from two low-pressure high-precision
syringe pump modules (neMESYS 290, Cetoni GmbH, Korbußen, Germany) were guided toward a
segmentation valve (100 μm bore, CHEMINERT C72MPKH-4670D, Vici AG, Schenkon, Switzerland), which was
programmed to generate 30 – 100 nL segments of the analyte mixtures in PFD. A schematic drawing of the
experimental setup used for the segmentation of the analyte mixtures is depicted in Figure S7.
Figure S7 | Schematic illustration of the experimental setup used for the initial feasibility studies for the online analysis of nanoliter-sized segments by chip-HPLC.
First proof-of-concept measurements to analyze the contents of segmented microflow using the newly developed droplet-HPLC chip were conducted using two epifluorescence microscopes aligned toward the microfluidic droplet-HPLC chip. While the first optical setup was aligned to the liquid manipulation area, providing control of the segment injection process, the second optical setup was oriented toward the HPLC column, enabling detection of the separated analyte bands after transfer. In addition to the general description of the optical setup on page S3, in Table S3 detailed information on the optical system used are depicted.
Table S3 | Detailed description of the two optical setups used for the analysis of the segmented microflows in the chip-HPLC chip system.
optical setup 1 optical setup 2
special features as described on page S3 without field and aperture stop module
as described on page S3
LED M365LP1, 365 nm excitation M285L4, 285 nm excitation LED control current 25 mA 400 mA filter cube as described in Table S1 as described in Table S1 objective Olympus 4x Plan N Thorlabs LMU-20X-UVB detection mode camera-only (Watec 221S2) PMT-only (Hamamatsu H9306-04) detection spot PEEK rotor seal after 21 mm HPLC column
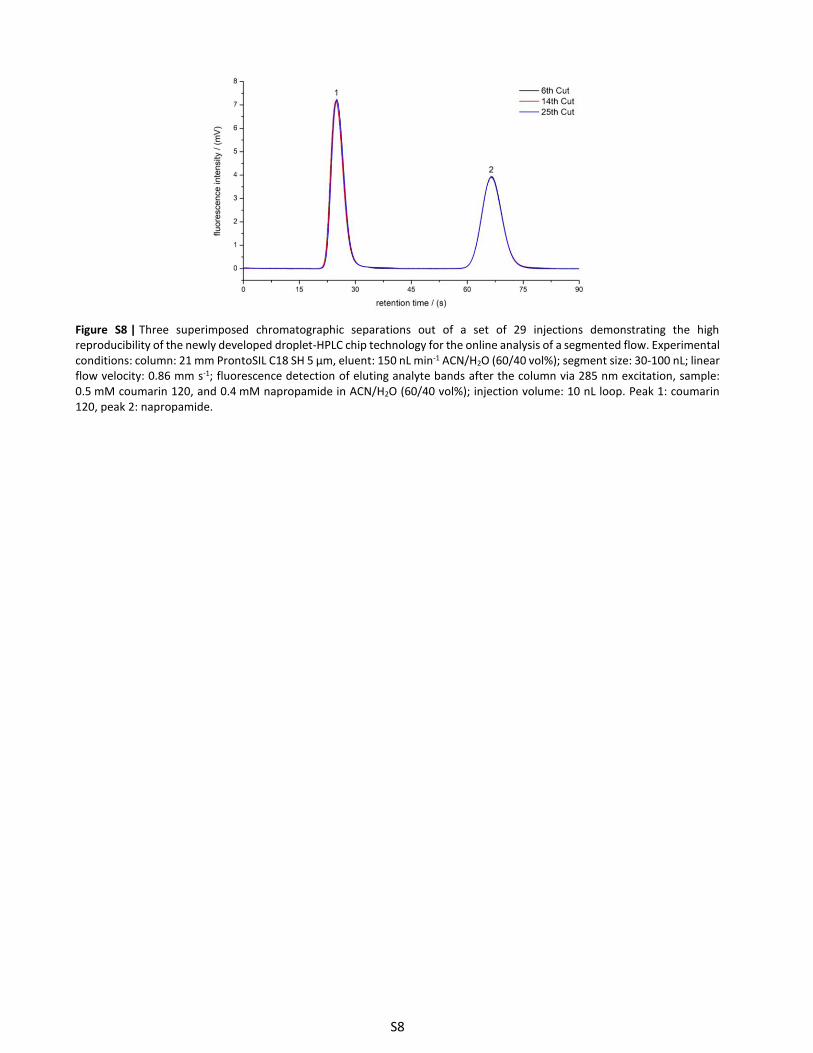
As stated in the main publication, 29 consecutive injections from the segmented microflow channel onto the
high-pressure HPLC compartment were conducted to demonstrate the performance and reproducibility of
the newly developed microfluidic droplet-HPLC chip system. A set of three superimposed chromatographic
separations is shown in Figure S8.
S8
Figure S8 | Three superimposed chromatographic separations out of a set of 29 injections demonstrating the high reproducibility of the newly developed droplet-HPLC chip technology for the online analysis of a segmented flow. Experimental conditions: column: 21 mm ProntoSIL C18 SH 5 µm, eluent: 150 nL min-1 ACN/H2O (60/40 vol%); segment size: 30-100 nL; linear flow velocity: 0.86 mm s-1; fluorescence detection of eluting analyte bands after the column via 285 nm excitation, sample: 0.5 mM coumarin 120, and 0.4 mM napropamide in ACN/H2O (60/40 vol%); injection volume: 10 nL loop. Peak 1: coumarin 120, peak 2: napropamide.
S9
Additions to the Analysis of a Segmented Off-Chip Reaction Mixture
In addition to the main publication, a detailed schematic drawing of the experimental setup used for the
droplet-HPLC/MS analysis of a segmented reaction mixture is depicted in Figure S9.
Figure S9 | Schematic drawing of the experimental setup used for the online analysis of a segmented off-chip reaction mixture via chip-HPLC/MS.
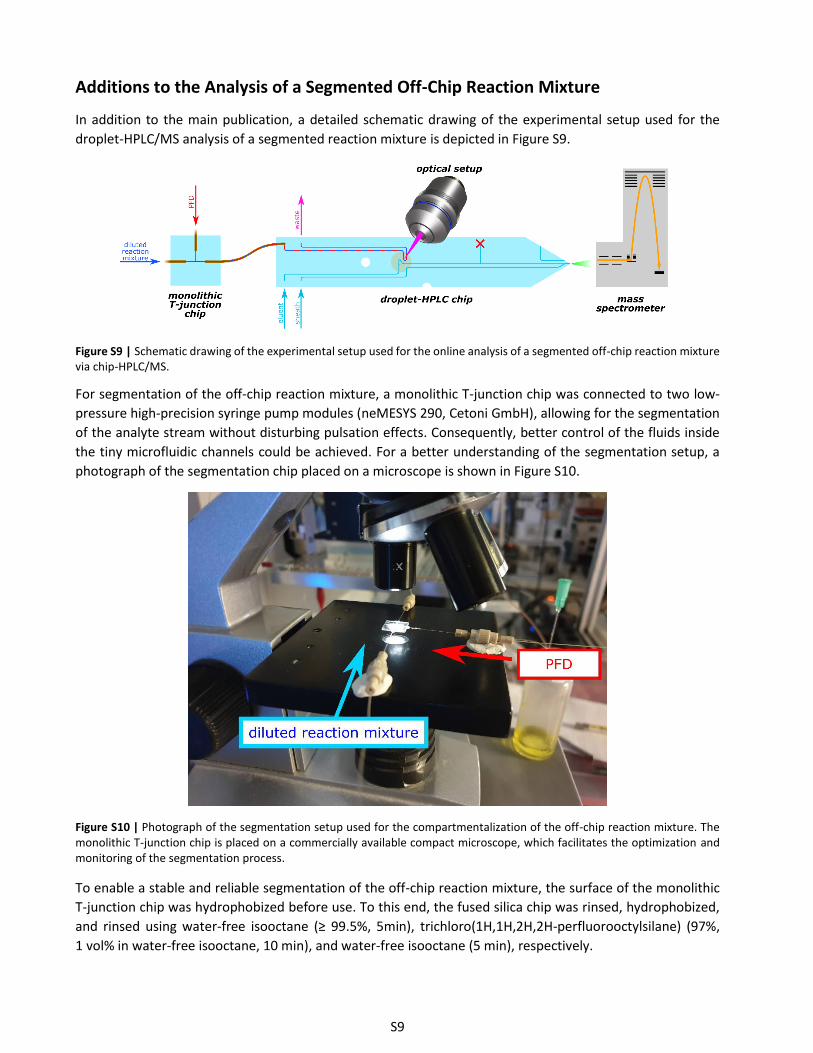
For segmentation of the off-chip reaction mixture, a monolithic T-junction chip was connected to two low-
pressure high-precision syringe pump modules (neMESYS 290, Cetoni GmbH), allowing for the segmentation
of the analyte stream without disturbing pulsation effects. Consequently, better control of the fluids inside
the tiny microfluidic channels could be achieved. For a better understanding of the segmentation setup, a
photograph of the segmentation chip placed on a microscope is shown in Figure S10.
Figure S10 | Photograph of the segmentation setup used for the compartmentalization of the off-chip reaction mixture. The monolithic T-junction chip is placed on a commercially available compact microscope, which facilitates the optimization and monitoring of the segmentation process.
To enable a stable and reliable segmentation of the off-chip reaction mixture, the surface of the monolithic
T-junction chip was hydrophobized before use. To this end, the fused silica chip was rinsed, hydrophobized,
and rinsed using water-free isooctane (≥ 99.5%, 5min), trichloro(1H,1H,2H,2H-perfluorooctylsilane) (97%,
1 vol% in water-free isooctane, 10 min), and water-free isooctane (5 min), respectively.
S10
After segmentation of the reaction mixture in the monolithically fabricated T-junction chip, the segmented
microflow is guided toward the fluid manipulation area of the droplet-HPLC chip via the droplet/sample
channel using fused silica and PEEK capillaries (360 µm outer diameter, 75 µm inner diameter, Vici AG). Used
experimental parameters are listed in Table S4.
Table S4 | Detailed experimental parameters applied for the online analysis of a segmented off-chip reaction mixture.
category parameter value
off-chip reaction mixture solvent methanol (100 vol%) conc. starting material 1 100 mM 4-hydroxycoumarin conc. starting material 2 110 mM trans-4-phenyl-3-buten-2-one conc. catalyst 10.3 mM (1S,2S)-(-)-diphenylethylendiamine conc. additive 1 M HOAc reaction time / reaction temperature 24 h / room temperature (23°C)
dilution of reaction mixture dilution factor of the reaction mixture 1:1000 solvent composition after dilution ACN/MeOH/H2O (39.9/0.1/60 vol%) + 0.1 vol%
formic acid added fluorescence marker (organic phase) 304 µM naproxen
applied flow rates for segmentation
diluted reaction mixture (organic phase) 1.2 µL min-1 PFD (oil phase) 0.1 µL min-1
segment size 60 nL
optical setup LED / LED control current M285L4 (285 nm excitation) / 500 mA filter cube as described in Table S1 objective Thorlabs LMU-15X-UVB detection mode camera-only (Watec 221S2)
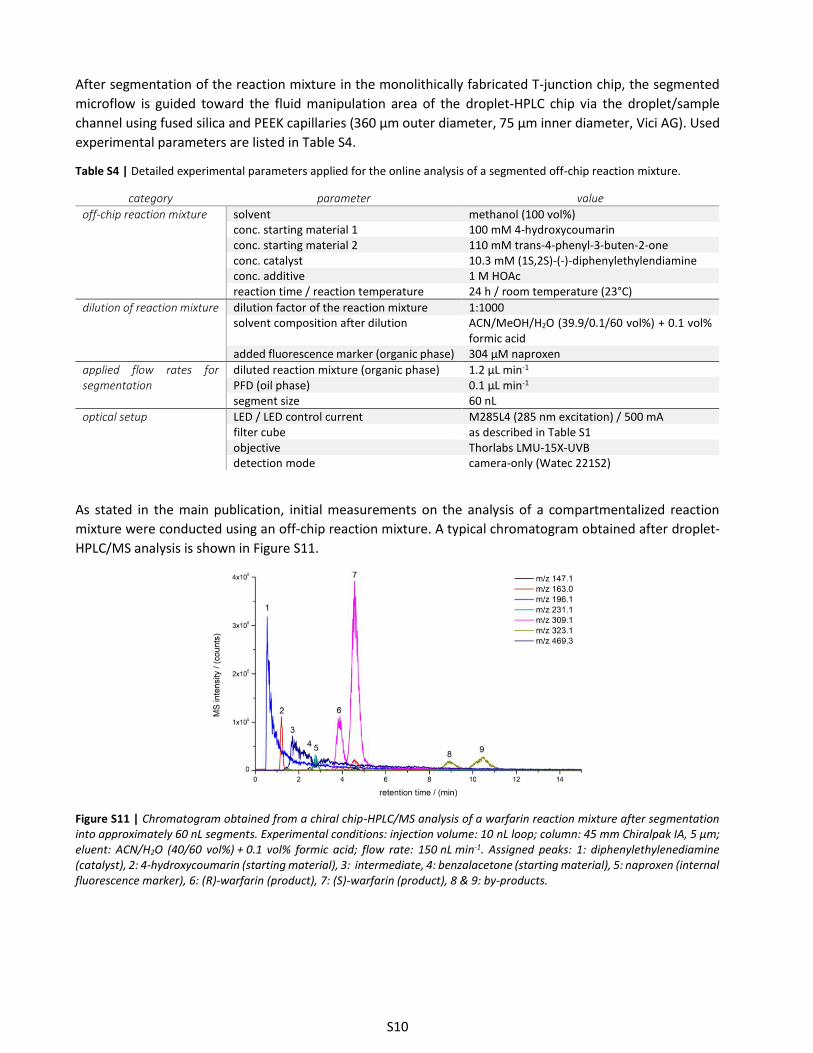
As stated in the main publication, initial measurements on the analysis of a compartmentalized reaction
mixture were conducted using an off-chip reaction mixture. A typical chromatogram obtained after droplet-
HPLC/MS analysis is shown in Figure S11.
Figure S11 | Chromatogram obtained from a chiral chip-HPLC/MS analysis of a warfarin reaction mixture after segmentation into approximately 60 nL segments. Experimental conditions: injection volume: 10 nL loop; column: 45 mm Chiralpak IA, 5 µm; eluent: ACN/H2O (40/60 vol%) + 0.1 vol% formic acid; flow rate: 150 nL min-1. Assigned peaks: 1: diphenylethylenediamine (catalyst), 2: 4-hydroxycoumarin (starting material), 3: intermediate, 4: benzalacetone (starting material), 5: naproxen (internal fluorescence marker), 6: (R)-warfarin (product), 7: (S)-warfarin (product), 8 & 9: by-products.
S11
Additions to Segmentation, Reaction, and Online HPLC/MS Analysis on a
Microfluidic Chip System
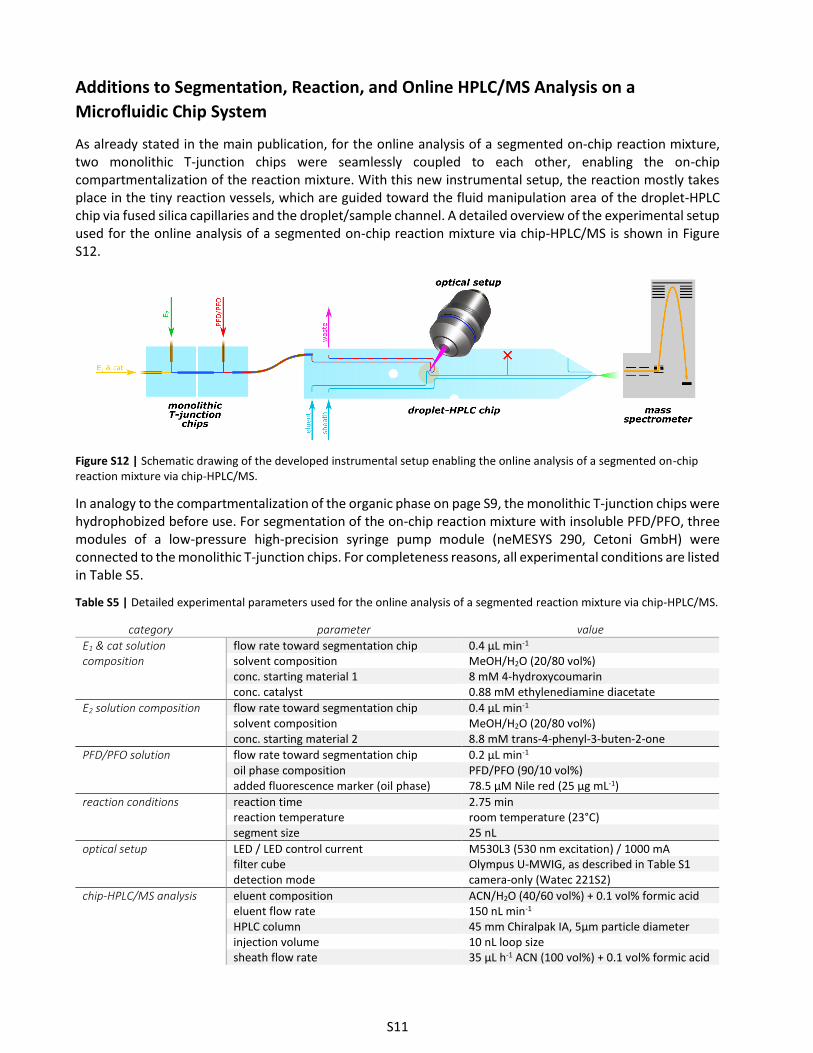
As already stated in the main publication, for the online analysis of a segmented on-chip reaction mixture, two monolithic T-junction chips were seamlessly coupled to each other, enabling the on-chip compartmentalization of the reaction mixture. With this new instrumental setup, the reaction mostly takes place in the tiny reaction vessels, which are guided toward the fluid manipulation area of the droplet-HPLC chip via fused silica capillaries and the droplet/sample channel. A detailed overview of the experimental setup used for the online analysis of a segmented on-chip reaction mixture via chip-HPLC/MS is shown in Figure S12.
Figure S12 | Schematic drawing of the developed instrumental setup enabling the online analysis of a segmented on-chip reaction mixture via chip-HPLC/MS.
In analogy to the compartmentalization of the organic phase on page S9, the monolithic T-junction chips were hydrophobized before use. For segmentation of the on-chip reaction mixture with insoluble PFD/PFO, three modules of a low-pressure high-precision syringe pump module (neMESYS 290, Cetoni GmbH) were connected to the monolithic T-junction chips. For completeness reasons, all experimental conditions are listed in Table S5.
Table S5 | Detailed experimental parameters used for the online analysis of a segmented reaction mixture via chip-HPLC/MS.
category parameter value
E1 & cat solution composition
flow rate toward segmentation chip 0.4 µL min-1 solvent composition MeOH/H2O (20/80 vol%)
conc. starting material 1 8 mM 4-hydroxycoumarin conc. catalyst 0.88 mM ethylenediamine diacetate
E2 solution composition flow rate toward segmentation chip 0.4 µL min-1 solvent composition MeOH/H2O (20/80 vol%) conc. starting material 2 8.8 mM trans-4-phenyl-3-buten-2-one
PFD/PFO solution flow rate toward segmentation chip 0.2 µL min-1 oil phase composition PFD/PFO (90/10 vol%)
added fluorescence marker (oil phase) 78.5 µM Nile red (25 µg mL-1)
reaction conditions reaction time 2.75 min reaction temperature room temperature (23°C) segment size 25 nL
optical setup LED / LED control current M530L3 (530 nm excitation) / 1000 mA filter cube Olympus U-MWIG, as described in Table S1 detection mode camera-only (Watec 221S2)
chip-HPLC/MS analysis eluent composition ACN/H2O (40/60 vol%) + 0.1 vol% formic acid eluent flow rate 150 nL min-1 HPLC column 45 mm Chiralpak IA, 5µm particle diameter injection volume 10 nL loop size sheath flow rate 35 µL h-1 ACN (100 vol%) + 0.1 vol% formic acid
S12
References:
(1) Wilke, C. R.; Chang, P. Correlation of Diffusion Coefficients in Dilute Solutions. AIChE J. 1955, 1 (2), 264–270. https://doi.org/10.1002/aic.690010222.
(2) Pereira, L. Comparison of Solid Core HPLC Column Performance. Thermo Fisher Scientific 2012. (3) de Villiers, A.; Lauer, H.; Szucs, R.; Goodall, S.; Sandra, P. Influence of Frictional Heating on Temperature Gradients in Ultra-High-Pressure Liquid
Chromatography on 2.1mm I.D. Columns. Journal of Chromatography A 2006, 1113 (1–2), 84–91. https://doi.org/10.1016/j.chroma.2006.01.120.