Integration for Simulink - Lauterbach · 2019-11-06 · Integration for Simulink 7 ©1989-2019...
40
Integration for Simulink 1 ©1989-2019 Lauterbach GmbH Integration for Simulink TRACE32 Online Help TRACE32 Directory TRACE32 Index TRACE32 Documents ...................................................................................................................... 3rd-Party Tool Integrations .......................................................................................................... Integration for Simulink ............................................................................................................. 1 History ...................................................................................................................................... 3 Introduction ............................................................................................................................. 3 Installation ............................................................................................................................... 4 System Requirements 4 License Requirements 4 Installing the TRACE32 Integration for Simulink 5 Updating the TRACE32 Integration for Simulink 5 Deinstallation ........................................................................................................................... 6 TRACE32 XIL ........................................................................................................................... 7 Demo Project 7 Functional Overview 10 Navigate to C/C++ Code - From Simulink to TRACE32 11 Navigate to Model - From TRACE32 to Simulink 12 Run until C/C++ Code using Temporary Breakpoints 13 Set Breakpoint to C/C++ Code 15 Remove Breakpoint for C/C++ Code 18 Stop the Simulation 18 Build Process 19 Configuration of Models 20 Code Coverage Measurement 21 Code Execution Profiling 22 Customize Execution Profiling 22 Stack Profiling 22 Customize Stack Profiling 22 Report of Profiling Results 23 Stack Memory Information 23 PRACTICE Callbacks 24 Customizing Callbacks 24 Callback Interface 24 Callback Implementation 25
Transcript of Integration for Simulink - Lauterbach · 2019-11-06 · Integration for Simulink 7 ©1989-2019...

Integration for Simulink
TRACE32 Online Help
TRACE32 Directory
TRACE32 Index
TRACE32 Documents ......................................................................................................................
3rd-Party Tool Integrations ..........................................................................................................
Integration for Simulink ............................................................................................................. 1
History ...................................................................................................................................... 3
Introduction ............................................................................................................................. 3
Installation ............................................................................................................................... 4
System Requirements 4
License Requirements 4
Installing the TRACE32 Integration for Simulink 5
Updating the TRACE32 Integration for Simulink 5
Deinstallation ........................................................................................................................... 6
TRACE32 XIL ........................................................................................................................... 7
Demo Project 7
Functional Overview 10
Navigate to C/C++ Code - From Simulink to TRACE32 11
Navigate to Model - From TRACE32 to Simulink 12
Run until C/C++ Code using Temporary Breakpoints 13
Set Breakpoint to C/C++ Code 15
Remove Breakpoint for C/C++ Code 18
Stop the Simulation 18
Build Process 19
Configuration of Models 20
Code Coverage Measurement 21
Code Execution Profiling 22
Customize Execution Profiling 22
Stack Profiling 22
Customize Stack Profiling 22
Report of Profiling Results 23
Stack Memory Information 23
PRACTICE Callbacks 24
Customizing Callbacks 24
Callback Interface 24
Callback Implementation 25
Integration for Simulink 1 ©1989-2019 Lauterbach GmbH

Callback Events 25
TRACE32 PIL ........................................................................................................................... 26
Harness for Back-to-Back Testing 26
Back-to-Back Testing 28
Safety Standards and Unit Testing 28
Background 28
Simulation Modes 29
Harness Creation 29
Interface Configuration 30
Callbacks 30
Parameters 31
Supported Data Types 31
Start TRACE32 PIL .................................................................................................................. 32
Configure the PIL Simulation Mode ....................................................................................... 33
Select an Extension (PIL) 33
Create a Harness (PIL) 34
Processor-In-the-Loop (PIL) 36
Toolchain 36
Customize the Extension Settings (PIL) 36
Troubleshooting ...................................................................................................................... 38
Known Issues 39
Help Us Help You - Export TRACE32 Information 40
Integration for Simulink 2 ©1989-2019 Lauterbach GmbH

Integration for Simulink
Version 06-Nov-2019
History
21-Jan-19 New sections: “Demo Project”, “Navigate to C/C++ Code”, “Navigate to Model”, “Run until C/C++ Code using Temporary Breakpoints”, and “Set Breakpoint to C/C++ Code”.
21-Jan-19 New sections: “Remove Breakpoint for C/C++ Code”, and “Stop the Simulation”.
Introduction
This document describes how to install, configure, and use the TRACE32 Integration for Simulink.
It is now common to perform simulation and verification of designs before committing to hardware. Such solution can be achieved using tools like MATLAB and Simulink especially for the control engineering market. It can save a lot of time and effort if the control loop can be tested for the effects of many variables before finalizing the design. Simulink integrates the capability of generating code automatically from a model; this feature can be used to check that the program behaves the same way on the control hardware as in the simulation.
After creating the control algorithms and testing them with Simulink, the corresponding program code for the processor of the control hardware can be generated from the control blocks using the Embedded Coder. Using a TRACE32 debugger, the generated code can be loaded into the control hardware and tested in-situ.
The TRACE32 Integration for Simulink consists of two parts:
• TRACE32 XIL
• TRACE32 PIL
Intended Audience
The users of the TRACE32 Integration for Simulink have to be familiar with TRACE32, MATLAB, and Simulink.
Integration for Simulink 3 ©1989-2019 Lauterbach GmbH
Installation
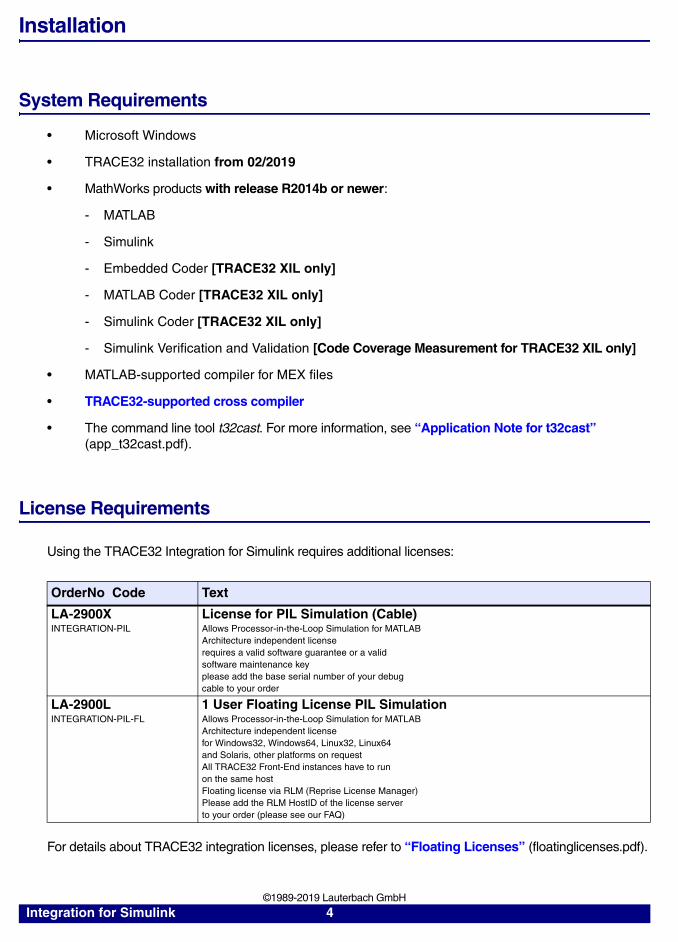
System Requirements
• Microsoft Windows
• TRACE32 installation from 02/2019
• MathWorks products with release R2014b or newer:
- MATLAB
- Simulink
- Embedded Coder [TRACE32 XIL only]
- MATLAB Coder [TRACE32 XIL only]
- Simulink Coder [TRACE32 XIL only]
- Simulink Verification and Validation [Code Coverage Measurement for TRACE32 XIL only]
• MATLAB-supported compiler for MEX files
• TRACE32-supported cross compiler
• The command line tool t32cast. For more information, see “Application Note for t32cast” (app_t32cast.pdf).
License Requirements
Using the TRACE32 Integration for Simulink requires additional licenses:
For details about TRACE32 integration licenses, please refer to “Floating Licenses” (floatinglicenses.pdf).
OrderNo Code Text
LA-2900X INTEGRATION-PIL
License for PIL Simulation (Cable)Allows Processor-in-the-Loop Simulation for MATLABArchitecture independent licenserequires a valid software guarantee or a validsoftware maintenance keyplease add the base serial number of your debugcable to your order
LA-2900L INTEGRATION-PIL-FL
1 User Floating License PIL SimulationAllows Processor-in-the-Loop Simulation for MATLABArchitecture independent licensefor Windows32, Windows64, Linux32, Linux64and Solaris, other platforms on requestAll TRACE32 Front-End instances have to runon the same hostFloating license via RLM (Reprise License Manager)Please add the RLM HostID of the license serverto your order (please see our FAQ)
Integration for Simulink 4 ©1989-2019 Lauterbach GmbH

Installing the TRACE32 Integration for Simulink
To install the TRACE32 Integration for Simulink, do one of the following:
• Choose the automated installation of the TRACE32 Integration for Simulink during the installation of TRACE32.
• Run the installer in the subfolder ~~/demo/env/matlabsimulink of your TRACE32 installation directory to install TRACE32 PIL.
The installer detects the versions of MATLAB that are installed on your system. By selecting a version the plug-in is automatically registered for this version during the installation. You can verify the correct installation by entering the command ver in the MATLAB command line.
Updating the TRACE32 Integration for Simulink
To update the TRACE32 Integration for Simulink:
1. Navigate to the subfolder ~~/demo/env/matlabsimulink of your TRACE32 installation directory.
2. Place the newer version of the installer into this subfolder.
3. Run the newer version of the installer to update the TRACE32 Integration for Simulink.
NOTE: Registration of the plug-in requires a modification of the MATLAB search path. Please create a backup before starting the installation.
Integration for Simulink 5 ©1989-2019 Lauterbach GmbH

Deinstallation
To uninstall the TRACE32 Integration for Simulink:
1. Run the provided uninstaller in its installation directory.
2. After completion, please remove all paths starting with ~~/demo/env/matlabsimulink/ from the MATLAB search path.
You can verify the removal by entering pathtool in the command line of MATLAB.
Integration for Simulink 6 ©1989-2019 Lauterbach GmbH
TRACE32 XIL
TRACE32 XIL is a fully integrated plug-in for Simulink that builds on the MATLAB Target Connectivity API to run processor-in-the-loop simulations with Simulink. Generated code can be easily cross-compiled, deployed, executed and debugged on custom targets. Execution and stack profiling via code instrumentation and execution of PRACTICE callbacks is supported during simulation.To quickly switch between elements of your model and the corresponding sections of C/C++ and object code, you can use the navigation features of the TRACE32 XIL plug-in.
The key features are:
• TRACE32 Remote API for generic target support
• Compatible with TRACE32 Instruction Set Simulator for easy testing on virtual targets
• Support for built-in target connectivity capabilities like code execution profiling and code coverage
• Use TRACE32 features to diagnose errors on the target platform
• Bidirectional navigation between model and generated code
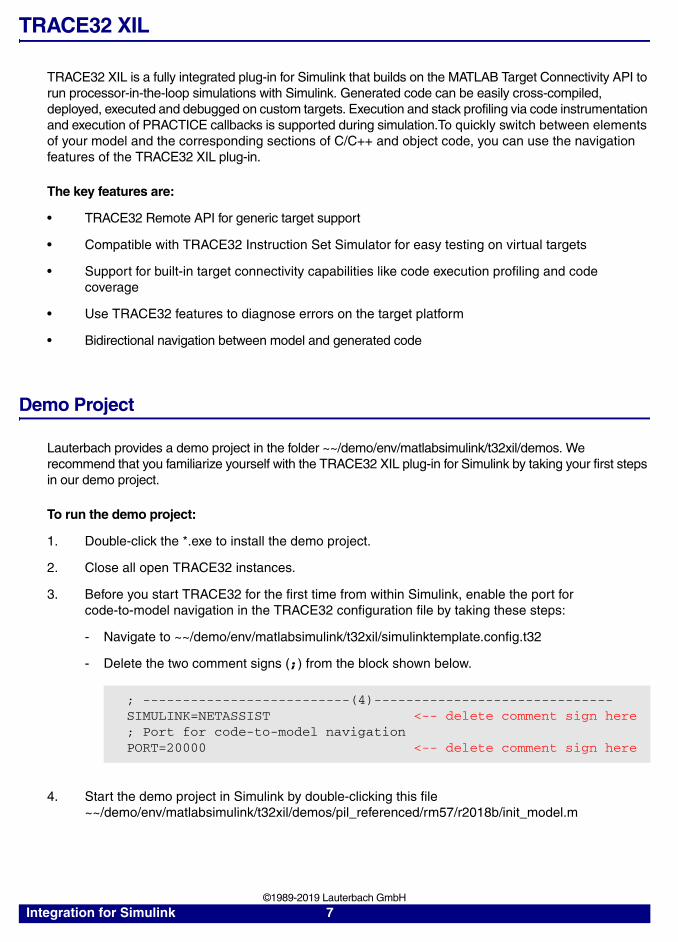
Demo Project
Lauterbach provides a demo project in the folder ~~/demo/env/matlabsimulink/t32xil/demos. We recommend that you familiarize yourself with the TRACE32 XIL plug-in for Simulink by taking your first steps in our demo project.
To run the demo project:
1. Double-click the *.exe to install the demo project.
2. Close all open TRACE32 instances.
3. Before you start TRACE32 for the first time from within Simulink, enable the port for code-to-model navigation in the TRACE32 configuration file by taking these steps:
- Navigate to ~~/demo/env/matlabsimulink/t32xil/simulinktemplate.config.t32
- Delete the two comment signs (;) from the block shown below.
4. Start the demo project in Simulink by double-clicking this file ~~/demo/env/matlabsimulink/t32xil/demos/pil_referenced/rm57/r2018b/init_model.m
; --------------------------(4)------------------------------SIMULINK=NETASSIST <-- delete comment sign here; Port for code-to-model navigationPORT=20000 <-- delete comment sign here
Integration for Simulink 7 ©1989-2019 Lauterbach GmbH

5. Once Simulink has started, double-click the file pil_topmodel_<target_board>.slx [A]:
6. Open the file trace32_settings.m [B] and increase the communication timeout value of cfg.Timeout_Transfer.
This is to prevent error messages in Simulink while you are debugging an application in TRACE32. The default timeout value is 10 seconds. Here, we have set the timeout value to 10000 seconds.
A
B
Integration for Simulink 8 ©1989-2019 Lauterbach GmbH

7. In Simulink, click the Run button to compile the Simulink model.
- Simulink establishes a connection to the required TRACE32 instance.
- TRACE32 displays the state “stopped” in the state line. TRACE32 stays in the state “running” if you have set the simulation stop time to inf in Simulink. To end the simulation in Simulink and the application execution in TRACE32, click Stop in Simulink.
Additionally in our demo project, the following happens after the connection has been established:
- The PRACTICE script trace32_<target_board>_startup.cmm is executed in TRACE32. For convenient access to the script file, double-click it in Simulink’s Current Folder window pane.
- A List.Mix window opens in the main window of TRACE32 PowerView because the List.Mix command is included in the PRACTICE script trace32_<target_board>_startup.cmm. The List.Mix window displays the source code Simulink has generated based on your model.
Next:
• Functional Overview
Integration for Simulink 9 ©1989-2019 Lauterbach GmbH
Functional Overview
In this section:
• Navigate to C/C++ Code, i.e. Simulink block -> Code in TRACE32
• Navigate to Model, i.e. Code in TRACE32 -> Simulink block
• Run until C/C++ Code using Temporary Breakpoints
• Set Breakpoint to C/C++ Code
• Remove Breakpoint for C/C++ Code
• Stop the Simulation
Integration for Simulink 10 ©1989-2019 Lauterbach GmbH
Navigate to C/C++ Code - From Simulink to TRACE32
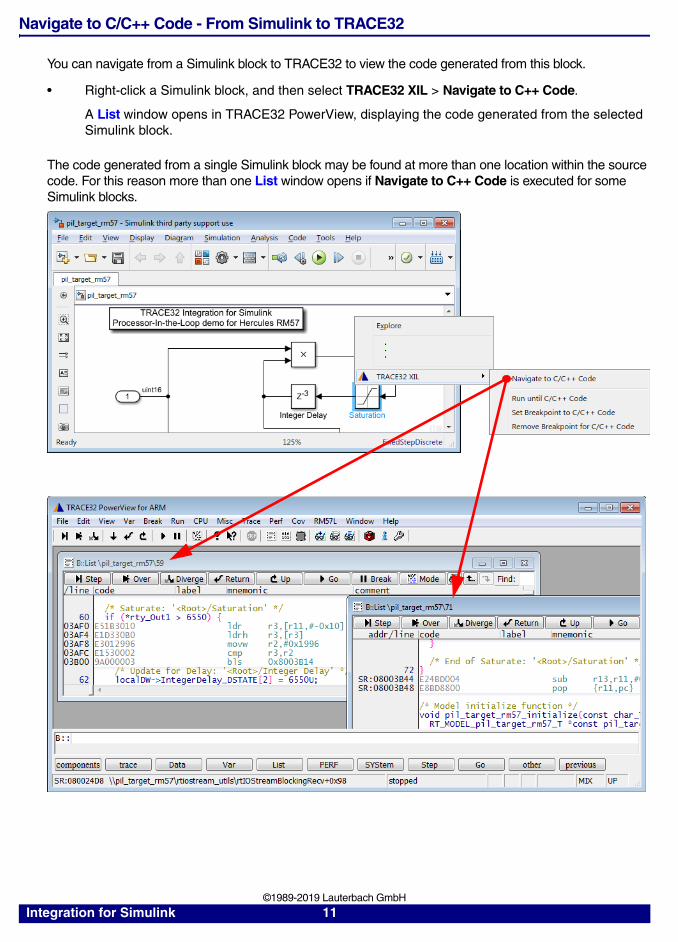
You can navigate from a Simulink block to TRACE32 to view the code generated from this block.
• Right-click a Simulink block, and then select TRACE32 XIL > Navigate to C++ Code.
A List window opens in TRACE32 PowerView, displaying the code generated from the selected Simulink block.
The code generated from a single Simulink block may be found at more than one location within the source code. For this reason more than one List window opens if Navigate to C++ Code is executed for some Simulink blocks.
Integration for Simulink 11 ©1989-2019 Lauterbach GmbH
Navigate to Model - From TRACE32 to Simulink
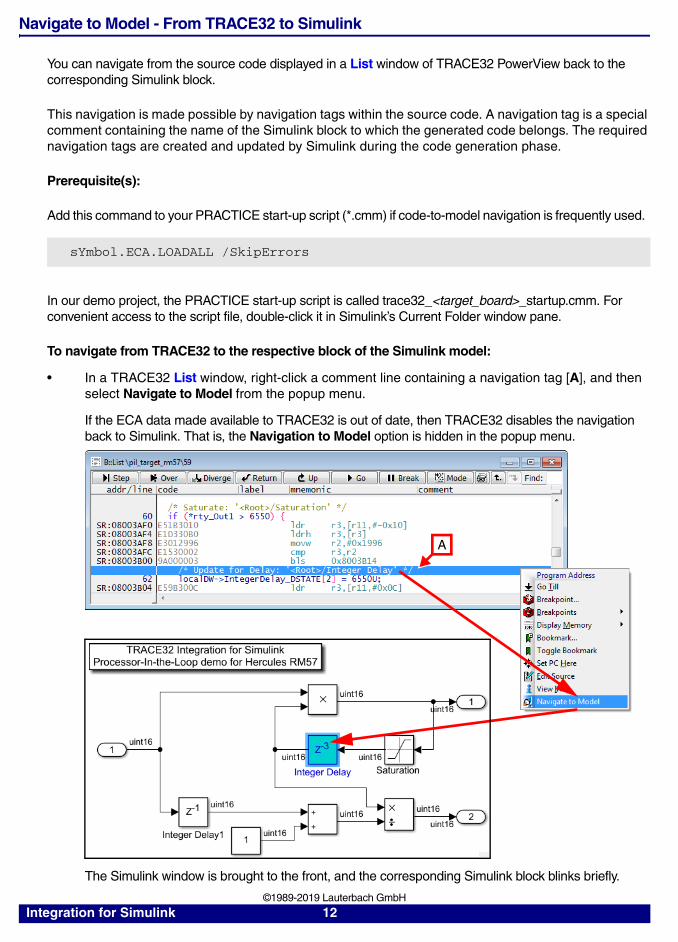
You can navigate from the source code displayed in a List window of TRACE32 PowerView back to the corresponding Simulink block.
This navigation is made possible by navigation tags within the source code. A navigation tag is a special comment containing the name of the Simulink block to which the generated code belongs. The required navigation tags are created and updated by Simulink during the code generation phase.
Prerequisite(s):
Add this command to your PRACTICE start-up script (*.cmm) if code-to-model navigation is frequently used.
In our demo project, the PRACTICE start-up script is called trace32_<target_board>_startup.cmm. For convenient access to the script file, double-click it in Simulink’s Current Folder window pane.
To navigate from TRACE32 to the respective block of the Simulink model:
• In a TRACE32 List window, right-click a comment line containing a navigation tag [A], and then select Navigate to Model from the popup menu.
If the ECA data made available to TRACE32 is out of date, then TRACE32 disables the navigation back to Simulink. That is, the Navigation to Model option is hidden in the popup menu.
The Simulink window is brought to the front, and the corresponding Simulink block blinks briefly.
sYmbol.ECA.LOADALL /SkipErrors
A
Integration for Simulink 12 ©1989-2019 Lauterbach GmbH

Run until C/C++ Code using Temporary Breakpoints
From within Simulink, you can instruct TRACE32 PowerView to execute the software up to the code which was generated from the corresponding Simulink block. This is useful for debugging an individual time step in the Simulink model while the application is running in TRACE32.
On the TRACE32 PowerView side, this is done by automatically setting temporary breakpoint(s) and executing a Go. Temporary breakpoints are automatically deleted once the temporary breakpoint has been reached.
To run until C/C++ Code using temporary breakpoints:
1. In Simulink, enter the simulation stop time.
In case of our demo project, enter inf as the simulation stop time in the window of the pil_topmodel_<target_board>.
2. In Simulink, click Run.
In case of our demo project, click Run in the window of the pil_topmodel_<target_board>.
- The model is now being executed in Simulink [A].
- The application code is now running in TRACE32, see state line at the bottom of the TRACE32 PowerView window [B].
3. In Simulink, right-click a block, and then select TRACE32 XIL > Run until C/C++ Code from the popup menu.
- TRACE32 stops the application execution at the temporary breakpoint you have just set from within Simulink. The TRACE32 state line displays stopped at breakpoint.
- The GUI controls (popup menu, buttons, etc.) in Simulink are deactivated.
- If the code generated from the Simulink block is located at different source code positions, software execution will stop in TRACE32 at the first temporary breakpoint which is hit.
- If the code generated from the block cannot be reached at all, the software execution won’t stop, i.e. the target stays in the state running.
A B
Integration for Simulink 13 ©1989-2019 Lauterbach GmbH

4. To view the current location of the PC (program counter), open a List.Mix window by typing List.Mix at the TRACE32 command line.
5. To restore the full GUI control to Simulink, you need to stop the simulation as described in “Stop the Simulation”, page 18.
Variation:
• For the List.Mix window to open automatically in TRACE32, include the List.Mix command in your PRACTICE start-up script (*.cmm); see “Demo Project”, page 7.
Integration for Simulink 14 ©1989-2019 Lauterbach GmbH

Set Breakpoint to C/C++ Code
From within Simulink, you can instruct TRACE32 PowerView to set breakpoints at the code sections which were generated from the corresponding Simulink block. You can view the successful execution of this task by opening a Break.List window in TRACE32.
Breakpoints set with the function Set Breakpoint to C/C++ Code are not deleted automatically by TRACE32 once such a breakpoint has been reached in TRACE32.
By double-clicking a breakpoint in the Break.List window, you can view code and breakpoint in a List window.
NOTE: • Clicking Run in Simulink deletes all existing breakpoints in TRACE32 because the entire code is re-generated. Therefore, you should set breakpoints from within Simulink while the simulation is running in Simu-link.
• Alternatively, you can specify breakpoints in your PRACTICE start-up script (*.cmm). In this case you need to set the breakpoints to symbols rather than addresses. These breakpoints are re-set when the model is re-built.Example: Break.Set pil_target_rm57 /Program
A Breakpoint address.
B Function name (which is the same as the \<module_name> in our demo project)
D
B
B C
E
A
Integration for Simulink 15 ©1989-2019 Lauterbach GmbH

To set a breakpoint to C/C++ code:
1. In Simulink, enter the simulation stop time.
In case of our demo project, enter inf as the simulation stop time in the window of the pil_topmodel_<target_board>.
2. In Simulink, click the Run button.
In case of our demo project, click the Run button in the window of the pil_topmodel_<target_board>.
3. In Simulink, right-click a block, and then select TRACE32 XIL > Set Breakpoint to C/C++ Code from the popup menu.
The block to which you have set a breakpoint is highlighted in orange.
4. In TRACE32, open a Break.List window to view the result.
C Number of lines between function name and breakpoint (line number offset).
D \<module_name>\<absolute_line_number>. Please note the leading backslash at the module name.
E Red bars visualize breakpoints. Here a breakpoint in line 32.
Integration for Simulink 16 ©1989-2019 Lauterbach GmbH
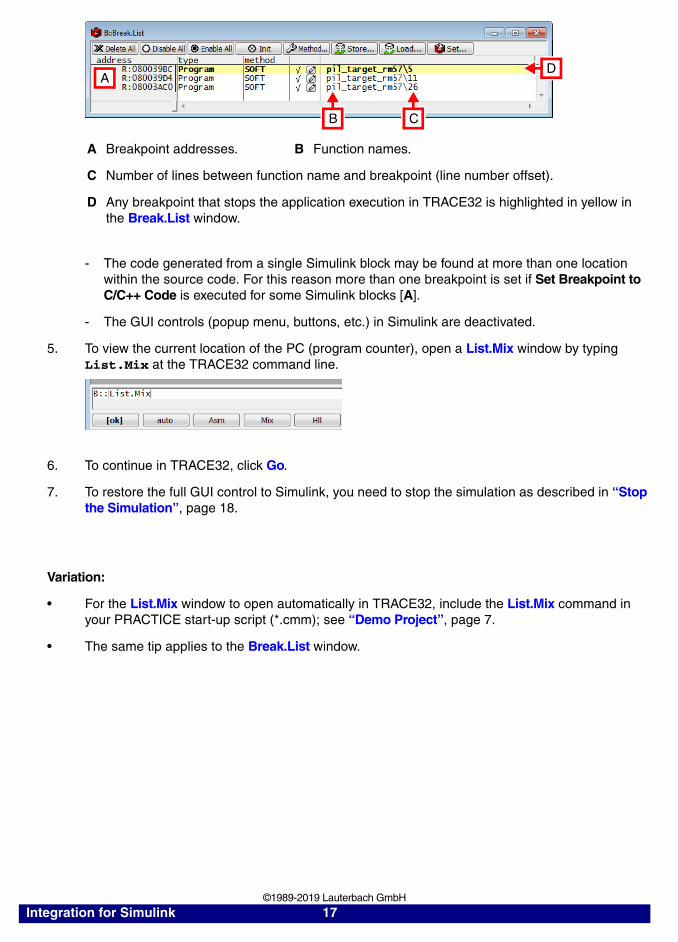
- The code generated from a single Simulink block may be found at more than one location within the source code. For this reason more than one breakpoint is set if Set Breakpoint to C/C++ Code is executed for some Simulink blocks [A].
- The GUI controls (popup menu, buttons, etc.) in Simulink are deactivated.
5. To view the current location of the PC (program counter), open a List.Mix window by typing List.Mix at the TRACE32 command line.
6. To continue in TRACE32, click Go.
7. To restore the full GUI control to Simulink, you need to stop the simulation as described in “Stop the Simulation”, page 18.
Variation:
• For the List.Mix window to open automatically in TRACE32, include the List.Mix command in your PRACTICE start-up script (*.cmm); see “Demo Project”, page 7.
• The same tip applies to the Break.List window.
A Breakpoint addresses. B Function names.
C Number of lines between function name and breakpoint (line number offset).
D Any breakpoint that stops the application execution in TRACE32 is highlighted in yellow in the Break.List window.
B
A
C
D
Integration for Simulink 17 ©1989-2019 Lauterbach GmbH

Remove Breakpoint for C/C++ Code
Orange Simulink blocks indicate that breakpoints exist for the associated source code in TRACE32. If you no longer need a breakpoint in the source code for particular orange block, you can delete this breakpoint from within Simulink.
To delete breakpoints in the source code of TRACE32 from within Simulink:
• Right-click an orange Simulink block, and then select TRACE32 XIL > Remove Breakpoint for C/C++ Code from the popup menu.
Result:
- In Simulink, a previously orange block then turns white again.
- In TRACE32, the deleted breakpoints are removed from the Break.List window.
Stop the Simulation
The GUI controls (popup menu, buttons, etc.) in Simulink are deactivated if the following two conditions apply:
• The simulation is running in Simulink.
• The application execution in TRACE32 is stopped by a breakpoint or a temporary breakpoint.
To restore the full GUI control to Simulink, you need to stop the simulation as described in the steps below.
To stop the simulation:
1. Open the Break.List window to check if any breakpoints are still enabled.
- Enabled breakpoints: Their font color is black.
- Disabled breakpoints: Their font color is gray.
2. Disable all breakpoints by clicking Disable All.
3. Click Go in any List.* window or click Go on the TRACE32 toolbar.
Since TRACE32 is now in the state running again, the GUI controls in Simulink are also re-activated.
4. In Simulink, click Stop.
The stop of the simulation in Simulink also causes TRACE32 to stop the application execution. The TRACE32 state line displays stopped.
Integration for Simulink 18 ©1989-2019 Lauterbach GmbH

Build Process
TRACE32 XIL has built-in support for both template makefiles used for building legacy models and custom toolchains. Custom toolchains require MATLAB R2015b and newer.
To switch between both configurations the plug-in registration of TRACE32 XIL has to be altered. The following steps are required:
1. Select the plug-in registration:
2. Delete or rename the current plug-in registration sl_customization.p.
3. Change the filename of the selected plug-in registration to sl_customization.p.
Build Method Plug-in Registration
Template Makefile sl_customization_template_makefile.p
Custom Toolchain sl_customization_custom_toolchain.p
NOTE: Starting with MATLAB R2018b TRACE32 XIL is configured to use custom toolchains during the build process. However, template makefiles are used by default for older versions.
Integration for Simulink 19 ©1989-2019 Lauterbach GmbH

Configuration of Models
TRACE32 XIL is automatically selected for the execution of PIL simulations when top level model and its sub and referenced modules are configured properly.
To configure a model for use, the following steps are necessary:
1. Open the dialog Model Configuration Parameters.
2. Configure the settings in the dialog Hardware Implementation for your target.
3. Select a supported system target file in the dialog Code Generation:
4. Configure the build process in the dialog Code Generation.
- Select a supported template makefile and a make command when building using template makefile:
Model Type System Target File
AUTOSAR autosar.tlc
Embedded Coder ert.tlc
trace32_target_ert.tlc
Architecture Template Makefiles
ARM trace32_arm_tmf.tmf
C2000 trace32_c2000_tmf.tmf
Power Architecture trace32_mpc_tmf.tmf
RH850 trace32_rh850_tmf.tmf
TriCore trace32_tc_tmf.tmf
V800 trace32_v850_tmf.tmf
Integration for Simulink 20 ©1989-2019 Lauterbach GmbH

- Select a supported toolchain when building using custom toolchains:
5. Add the template makefile to the MATLAB search path and configure it for your build toolchain.
6. Create a PRACTICE start-up script for your target:
7. Create a TRACE32 configuration file for your target:
- Select a TRACE32 operation mode (Instruction Set Simulator, ICD via USB, ...).
- Configure two ports for the TRACE32 Remote API.
8. Create a TRACE32 XIL settings file and add it to the search path.
Ready-to-run examples for the TRACE32 Instruction Set Simulator are located in the directory ~~/demo/env/matlabsimulink/t32xil/demos.
Code Coverage Measurement
To measure the code coverage during simulation Simulink Coverage is required. It can be configured via the dialog “Coverage” in “Model Configuration Parameters”.
Toolchain Toolchain Configuration
TRACE32 XIL v1.0 | gmake makefile t32xil_tc.m
TRACE32 XIL GCC arm-none-eabi Cortex-R | gmake makefile
t32xil_tc_gcc_arm_none_eabi_cortex_r.m
TRACE32 XIL GCC arm-none-eabi Cortex-M | gmake makefile
t32xil_tc_gcc_arm_none_eabi_cortex_m.m
NOTE: This step is only required if you have configured the build process for template makefiles. It can be omitted when a custom toolchain is used.
HELP.FILTER.Add intsimulink
ENTRY %LINE &ELF_FILE ;do not modify this line
IF (!OS.FILE(&ELF_FILE))( PRINT %ERROR "The target binary location must be passed to the script." ENDDO)
...
ENDDO
Integration for Simulink 21 ©1989-2019 Lauterbach GmbH

Code Execution Profiling
To measure the duration of function calls and tasks code execution profiling can be used. The measurement is performed during simulation by supplementing the generated code with instrumentation probes that track the execution time by evaluation of the target’s hardware timers. After completion an execution profile of functions and tasks can be viewed within MATLAB.
Customize Execution Profiling
Enabling execution profiling requires the following steps:
1. Specify a hardware timer for the PIL target connectivity API via the MATLAB Code Replacement Tool.
2. Specify the name of the timer object in the TRACE32 XIL settings file.
Please refer to the MATLAB documentation for additional information on how to set up code execution profiling for PIL simulations.
Stack Profiling
To measure the utilization of the stack memory on the target platform stack profiling can be applied. Stack profiling reports the maximum amount of used stack memory after completion of the simulation.The measurement is performed by marking the complete stack memory area with a byte pattern prior to the start and verifying its integrity after the simulation has been completed.
Customize Stack Profiling
Enabling stack profiling requires the following configuration steps:
1. Create a variable on the MATLAB workspace with stack memory information for the current target platform.
2. Specify the name of the variable in the TRACE32 XIL settings file.
3. Modify the PRACTICE start-up script to halt the target after completion of the initialization.
NOTE: TRACE32 XIL version 2.1747 or newer is required for code coverage measurement. To check your version enter the command ver in the MATLAB command prompt.
Integration for Simulink 22 ©1989-2019 Lauterbach GmbH

Report of Profiling Results
After the end of the simulation a report of the stack profiling is displayed:
In addition the contents of the stack memory information are updated with the profiling results.
Stack Memory Information
Information about the stack memory section of the target is provided as MATLAB structure array:
Field description:
name Sets the display name of the stack memory section
startAddress Sets the starting address of the stack memory section in hexadecimal notation
endAddress Sets the end address of the stack memory section in hexadecimal notation
growthDirection Sets the growth direction of used stack memory during execution. The values UP and Down are supported.
pattern Sets the byte pattern for marking unused stack memory in hexadecimal notation.
maxUsageInBytes Is updated after completion of the simulation with the maximum number of used stack memory bytes.
maxUsageInPercent Is updated after completion of the simulation with the percentage of used stack memory bytes.
Integration for Simulink 23 ©1989-2019 Lauterbach GmbH

PRACTICE Callbacks
To support complex analysis tasks with TRACE32, a number of callbacks can be configured to trigger the execution of PRACTICE scripts at certain events during a simulation run. Passing and returning data between MATLAB and TRACE32 is useful to model complex workflows.
Customizing Callbacks
Setting up PRACTICE callbacks requires the following steps:
1. Create one or more containers on the MATLAB workspace that reflect the callback interface for data exchange with TRACE32.
2. Create PRACTICE script(s) that provide the implementation for the required callbacks.
3. Enable the callbacks in the TRACE32 XIL settings file.
Callback Interface
The callback interface is represented by a MATLAB structure array that consists of key-value pairs. Fields can be either defined as input whose value is transferred to TRACE32 or as output whose value is updated by TRACE32.
The example above defines the following callback interface:
The value type determines if a filed is interpreted as input or output. Input values must have type string, whereas all outputs must be defined as empty arrays.
interface = struct('in1', 'input1', ... 'in2', 'input2', ... 'in3', 'input3', ..., 'out1', [], ... 'out2', []);
variable type value
in1 Input input1
in2 Input input2
in3 Input input3
out1 Output -
out2 Output -
Integration for Simulink 24 ©1989-2019 Lauterbach GmbH
Callback Implementation
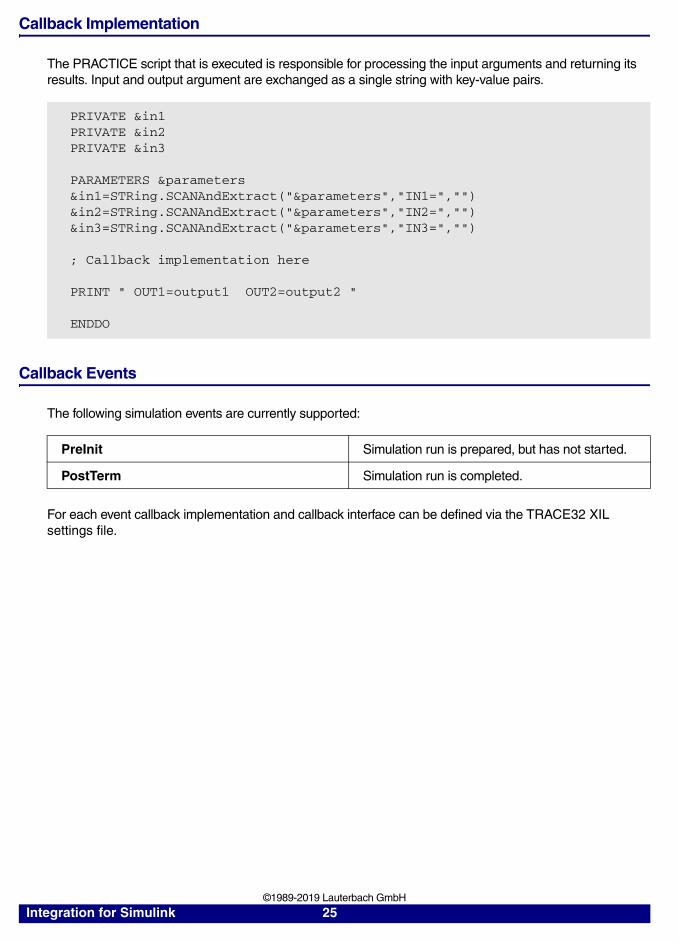
The PRACTICE script that is executed is responsible for processing the input arguments and returning its results. Input and output argument are exchanged as a single string with key-value pairs.
Callback Events
The following simulation events are currently supported:
For each event callback implementation and callback interface can be defined via the TRACE32 XIL settings file.
PRIVATE &in1PRIVATE &in2PRIVATE &in3 PARAMETERS ¶meters&in1=STRing.SCANAndExtract("¶meters","IN1=","")&in2=STRing.SCANAndExtract("¶meters","IN2=","")&in3=STRing.SCANAndExtract("¶meters","IN3=","")
; Callback implementation here
PRINT " OUT1=output1 OUT2=output2 "
ENDDO
PreInit Simulation run is prepared, but has not started.
PostTerm Simulation run is completed.
Integration for Simulink 25 ©1989-2019 Lauterbach GmbH

TRACE32 PIL
TRACE32 PIL is a fully integrated plug-in for Simulink that implements a customizable workflow to streamline the setup of SIL/PIL simulations for unit testing. Its workflow is designed for the use with block libraries as efficient solution for code partitioning and reuse as alternative to model referencing. Due to its close coupling with TRACE32, it supports a multitude of hardware platforms and virtual targets. In addition, the full feature set of TRACE32 becomes available during model-based testing. TRACE32 PIL can be seamlessly integrated into existing toolchains.
The key features are:
• Simple target adaptation
• Auto-generated and hand-written code supported
• Built-in support for various build toolchains
• IEC 61508 compliant unit testing
• On-the-fly debugging
Harness for Back-to-Back Testing
TRACE32 PIL aims to transform a subsystem containing the unit under test into an integrated harness for back-to-back testing of MIL, SIL, and PIL:
Input Output
Modes
pppppppppppppppppInput Stimuli
Test HarnessSource Block
Test Results
Test HarnessSink Block
1
Output1
Input
Input Output
MIL
Input Output
SIL
Input Output
PIL
Integration for Simulink 26 ©1989-2019 Lauterbach GmbH

TRACE32 PIL has been optimized for the combination with model-based testing tools that interface with its harness via signal ports and parameters. The harness introduces a Variant Subsystem that contains a distinct subsystem for each configured simulation mode. The currently selected submodule determines the active simulation mode, so the different modes can be seamlessly adjusted between tests.
Whereas similar solutions rely on pre-made hooks to create a suitable interface for PIL testing, TRACE32 PIL has developed a different approach. To be able to even support hand-written source code, TRACE32 PIL features a parser for both model and source code interface. Its workflow analyzes the interfaces, makes the interfaces configurable by the user, and dynamically creates a submodule with a matching interface for the harness. Taking advantage of the capabilities of modern debug interfaces, TRACE32 makes all model parameters tunable without the need to recompile the object code.
During the interface configuration, the user can customize both the mapping of source code functions to model callbacks and variables. Subsequently, wrapper functions are derived from the mapping data to transform model callbacks into the associated function calls and parameter initializations. The strength of this approach is that the dependency on the code generation process is minimized. Supported code generators include:
• Embedded Coder
• TargetLink
• QGen
The creation of the harness is fully customizable via the graphical user of TRACE32 PIL or the built-in command line interface.
Integration for Simulink 27 ©1989-2019 Lauterbach GmbH

Back-to-Back Testing
Safety Standards and Unit Testing
IEC 61508 and related standards (ISO 26262, DO-178C, EN 50128, ...) emphasize the role of the test environment for the significance of the test results. Please consider ISO 26262-6:2011 (9.4.6) in this context:
“The test environment for software unit testing shall correspond as closely as possible to the target environment. If the software unit testing is not carried out in the target environment, the differences in the source and object code, and the differences between the test environment and the target environment, shall be analyzed in order to specify additional tests in the target environment during the subsequent test phases.”
Consequently, one of the main objectives for unit and integration testing should be to integrate PIL and HIL into the test procedure as early as possible. TRACE32 PIL has been developed as a mean towards this goal at the level of unit testing.
Background
An important concept of model-based development is the verification that a model that is used for production code generation and the derived source code share the same behavior. This type of equivalence testing is called back-to-back testing. A compile and linking toolchain is used to convert the source code into executable object code that is required for testing. To demonstrate its equivalence, both model and executable object code are stressed with the same set of test stimuli while their outputs are monitored. After each step or after the end of the test, the recorded output streams of model and executable are compared with each other.
Input Stimuli
Test Vectors
Input Output
Model for ProductionCode Generation
Input Output
Derived ExecutableObject Code
Test Results
Integration for Simulink 28 ©1989-2019 Lauterbach GmbH

Simulation Modes
All modes offer the ability to execute back-to-back testing in which the same test stimuli are applied to the model and the application, after which the output values of both are compared. Models can be used with a series of different simulation modes for verification and validation purposes.
Types of Simulation Modes:
Harness Creation
When using TRACE32 PIL, the harness for back-to-back testing is created via its graphical user interface (GUI) or the built-in command line interface. TRACE32 PIL automates the following activities during the creation of the harness:
1. Execute a customizable callback at the start.
2. Place unit under test in a Variant Subsystem.
3. Create a submodule for the selected simulation mode in the Variant Subsystem.
4. Place an S-Function block with user-specified callback interface into the submodule.
5. Create an interface for the generated production code that transforms Simulink callbacks into the user-specified function calls and parameter initializations.
6. Trigger the build process of the executable object code.
7. Activate the associated submodule for the selected simulation mode.
8. Prepare the target platform for the execution for the simulation.
9. Execute a callback after completion.
This workflow is fully customizable and can be backed by additional scripts.
MIL If an executable model is used for the simulation, then the method is referred to as Model-In-the-Loop (MIL).
SIL The term Software-In-the-Loop (SIL) refers to the execution of an application that is based on a model in the host environment. In the course of the simulation, test stimuli are applied to the application, and the return values are measured and verified.
PIL Direct extensions of this procedure are Processor-In-the-Loop (PIL) simulations. In this case, an application is compiled and linked for use in the immediate target environment and executed on a hardware platform or a virtual target.
HIL The last stage of model-based testing is Hardware-In-the-Loop (HIL) simulation in which the application is tested in a complex hardware environment.
Integration for Simulink 29 ©1989-2019 Lauterbach GmbH

Interface Configuration
For the simulation modes SIL or PIL, an C MEX S-Function is used for the communication with the target platform. TRACE32 PIL makes use of a subset of the callback methods that are available for C MEX S-Functions. The following callback methods are currently used:
To interact correctly with the target platform during a simulation, the callbacks have to be mapped correctly to their direct equivalent in the derived source code. TRACE32 PIL provides a flexible mechanism for the configuration of this translation. Functions to enable this interface are provided during the creation of the harness for back-to-back testing.
Callbacks
TRACE32 PIL provides a dialog for the mapping of S-function callbacks to source code functions on the target platform:
The pane on the left side shows the supported callbacks. Source code functions in the pane on the right can be assigned via double-clicking or use of the controls to a slot in the center pane. Each callback is translated by the harness to a function call of the function slot on the same level. Callbacks methods may be left unassigned to disable an callback event during the simulation.
INIT Initialize the S-Function prior to the start of the simulation loop.
STEP Calculate the outputs of the block for a time step.
TERM Perform tasks to wrap up the simulation.
Integration for Simulink 30 ©1989-2019 Lauterbach GmbH

Parameters
During simulation, data is continuously exchanged between model and source code entities. Defining the mapping of parameters, input and output ports in the model to source code variables, determines the interface that is required for back-to-back testing. TRACE32 PIL provides a dialog for the mapping of model and source code interface:
The pane on the left side shows the model parameters for the enabled callback methods:
Source code variables in the pane on the right can be assigned via double-clicking or use of the controls to a slot in the center pane. The harness is configured, so that during the simulation each model parameter shares its value with the parameter slot on the same level. Model parameters may be left unassigned to disable its mapping. The center pane indicates an incompatibility between the data types of model parameter and parameter slot by a red symbol.
Supported Data Types
TRACE32 PIL supports interfaces containing the following data types:
• SS_DOUBLE
• SS_SINGLE
• SS_INT8
• SS_UINT8
• SS_INT16
• SS_UINT16
• SS_INT32
• SS_UINT32
A INIT: Tunable block parameters are available for mapping.
B STEP: Input and output ports are available for mapping.
- TERM: No mapping is performed.
A
B
Integration for Simulink 31 ©1989-2019 Lauterbach GmbH

Start TRACE32 PIL
1. Start MATLAB.
2. Do one of the following:
- Open an existing Simulink model that contains the unit under test.
- Create a new Simulink model.
3. Make sure that the unit under test is placed in a dedicated subsystem.
4. Select a subsystem of the Simulink model.
5. Right-click, and then select TRACE32 PIL from the popup menu.
The TRACE32 PIL - <extension> (<sub_system>) dialog opens.
Next: “Select an Extension (PIL)”, page 33.
Integration for Simulink 32 ©1989-2019 Lauterbach GmbH

Configure the PIL Simulation Mode
The diagram below provides an overview of the major steps in setting up the PIL simulation mode in TRACE32 PIL. For details, click the blue hyperlinks.
Select an Extension (PIL)[PIL - Process Overview]
To add support for a simulation mode, follow these steps:
1. In the TRACE32 PIL - <extension> (<sub_system>) dialog, choose Settings menu > Select Extension.
2. In the Select Extension dialog, do one of the following:
- Select the extension to the simulation mode PIL, and then click Select.An empty TRACE32 PIL Settings dialog opens.
- Click the entry Select from settings file, and then browse for a file with the desired extension settings. The settings are loaded into the TRACE32 PIL Settings dialog.
Next: You are now ready to customize the extension settings as described in “Processor-In-the-Loop (PIL)”, page 36.
Start TRACE32 PIL
Select an extension
Customize the extension
Create the harness
PIL Select from settings file
Integration for Simulink 33 ©1989-2019 Lauterbach GmbH
Create a Harness (PIL)[PIL - Process Overview]
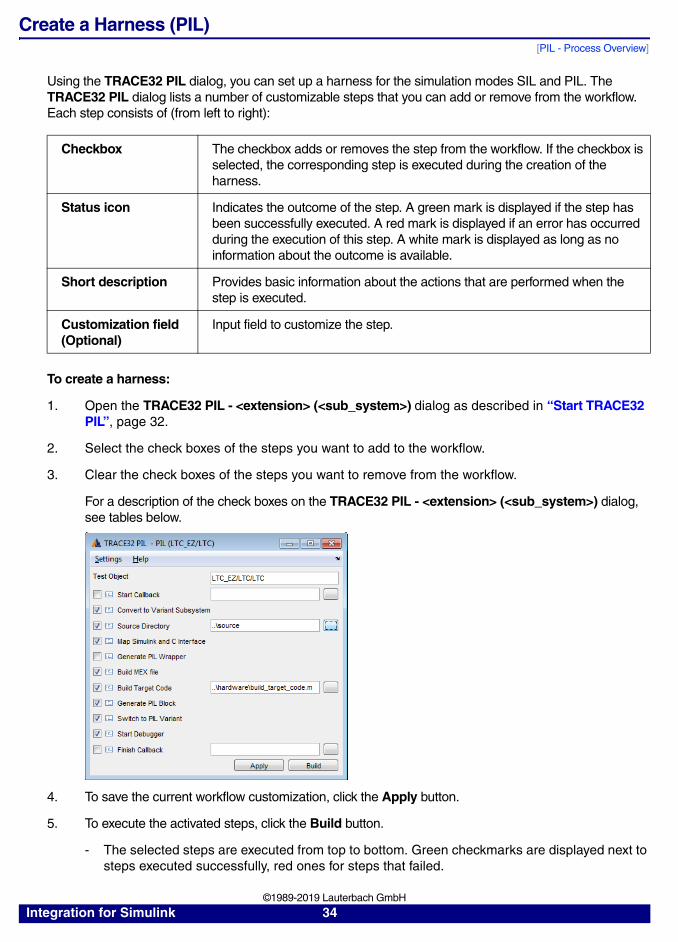
Using the TRACE32 PIL dialog, you can set up a harness for the simulation modes SIL and PIL. The TRACE32 PIL dialog lists a number of customizable steps that you can add or remove from the workflow. Each step consists of (from left to right):
To create a harness:
1. Open the TRACE32 PIL - <extension> (<sub_system>) dialog as described in “Start TRACE32 PIL”, page 32.
2. Select the check boxes of the steps you want to add to the workflow.
3. Clear the check boxes of the steps you want to remove from the workflow.
For a description of the check boxes on the TRACE32 PIL - <extension> (<sub_system>) dialog, see tables below.
4. To save the current workflow customization, click the Apply button.
5. To execute the activated steps, click the Build button.
- The selected steps are executed from top to bottom. Green checkmarks are displayed next to steps executed successfully, red ones for steps that failed.
Checkbox The checkbox adds or removes the step from the workflow. If the checkbox is selected, the corresponding step is executed during the creation of the harness.
Status icon Indicates the outcome of the step. A green mark is displayed if the step has been successfully executed. A red mark is displayed if an error has occurred during the execution of this step. A white mark is displayed as long as no information about the outcome is available.
Short description Provides basic information about the actions that are performed when the step is executed.
Customization field (Optional)
Input field to customize the step.
Integration for Simulink 34 ©1989-2019 Lauterbach GmbH

- If you have selected the check box Map Simulink and C Interface, the TRACE32 PIL - <extension> (<sub_system>) dialog will stop at this step until you have performed the interface configuration, see “Interface Configuration”, page 30.
- In case of red checkmarks, go back to MATLAB and troubleshoot your Simulink model.
TRACE32 PIL Dialog - Check Box Description
Test Object The test object selects a subsystem within the model for which a harness should be created. To specify the element, please enter its model path. When using the context menu to open the GUI, the test object is automatically set to the current target.
Start Callback Executes a custom callback before the harness is created. To configure the step, please select a custom callback.
Convert to Variant Subsystem
Converts the Test Object to a Variant Subsystem.
Source Directory Selects the location of the derived source code. To configure the step, please select the appropriate source code folder.
Includes Specifies location of additional source files. To configure this step, please enter the directories of the files to be included.
Map Simulink and C Interface
Configures the interface for the PIL simulation.
Generate PIL Wrapper Creates source files that implement the specified function and parameter interface.
Build MEX File Invokes the build process of the MEX file.
Build Target Code Invokes the build process of the target code. To configure this step, please select a custom build script.
Generate PIL Block Inserts the submodule for PIL into the harness.
Switch to PIL Variant Selects the simulation mode for PIL.
Start Debugger Starts TRACE32 and prepares the target platform for the simulation.
Finish Callback Executes a custom callback after the harness has been created.
Integration for Simulink 35 ©1989-2019 Lauterbach GmbH

Processor-In-the-Loop (PIL)
Toolchain
PIL verifies an algorithm by executing it on a hardware platform or virtual target:
The harness for back-to-back testing controls the simulation from the modeling environment via an S-function. Using the MEX compiler of MATLAB an S-function with customized callback interface is created from C source code. TRACE32 provides unified access to the target platform without requiring any target-specific adaptions on both host- and target-side. The callbacks are mapped to associated function calls via the TRACE32 Remote API. Using the debug interface TRACE32 initializes the debug session and prepares the target for the simulation.
Customize the Extension Settings (PIL)[PIL - Process Overview]
Adding PIL support to the harness for back-to-back testing requires configuration settings that are set via the dialog for extension settings.
To modify the extension settings:
1. In the TRACE32 PIL - <extension> (<sub_system>) dialog, choose Settings menu > Extension Settings.
For a description of the fields in the TRACE32 PIL Settings dialog, see table below.
2. To store the current settings to a file, click Apply.
Callbacks
S-Function
MEX Compiler
CallbackInterface
Function Interface
TRACE32
Cross Compiler
Functions
Target Platform
C MEX S-Function
RemoteAPI Debug
Interface
Target Binary
Integration for Simulink 36 ©1989-2019 Lauterbach GmbH

3. To close the dialog, click OK.
You are prompted to select a target for storage of the settings if none has been specified.
Next: “Create a Harness (PIL)”, page 34.
TRACE32 PIL Settings Dialog - Option Description
Settings File Displays the name of the m-file that is used for storing the current simulation mode’s extension settings.
TRACE32 Debugger Exe-cutable
Selects the executable of TRACE32 to be started.
Additional Parameters Reserved for future use.
TRACE32 Configuration File
Selects a TRACE32 configuration file (*.t32) for your debug environment.
PRACTICE Start-up Script Selects a PRACTICE start-up script (*.cmm) for your debug environment.
Additional Files Reserved for future use.
Host Defines the host on which the TRACE32 display driver runs. Default value is localhost.
Maximum Packet Length Defines the maximum packet length. Must not bigger than 1024.
Port Defines the UDP port for sending. Default value is 20000.
Integration for Simulink 37 ©1989-2019 Lauterbach GmbH
Troubleshooting
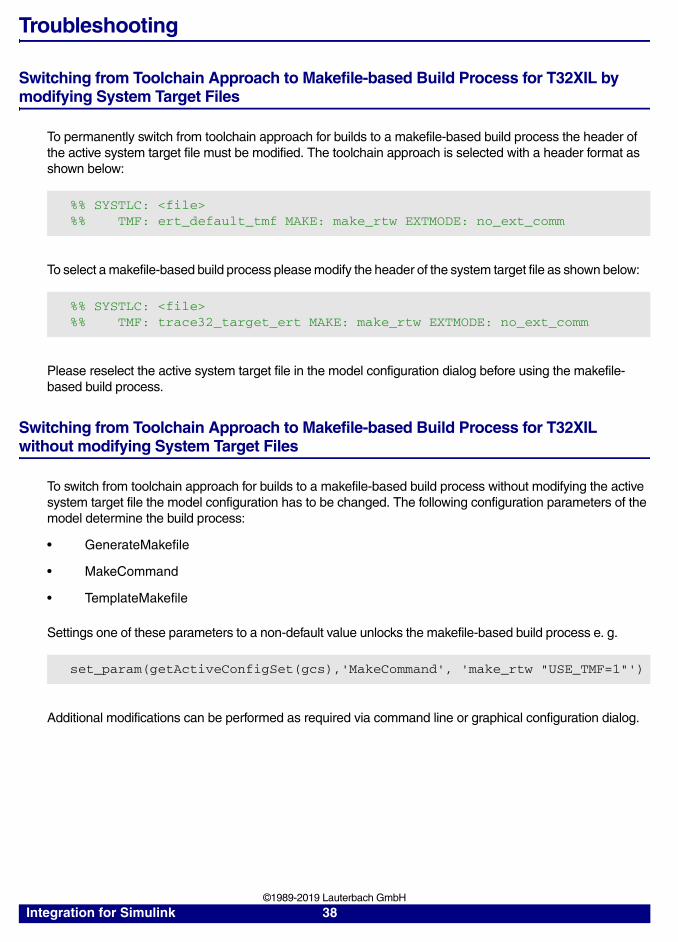
Switching from Toolchain Approach to Makefile-based Build Process for T32XIL by modifying System Target Files
To permanently switch from toolchain approach for builds to a makefile-based build process the header of the active system target file must be modified. The toolchain approach is selected with a header format as shown below:
To select a makefile-based build process please modify the header of the system target file as shown below:
Please reselect the active system target file in the model configuration dialog before using the makefile-based build process.
Switching from Toolchain Approach to Makefile-based Build Process for T32XIL without modifying System Target Files
To switch from toolchain approach for builds to a makefile-based build process without modifying the active system target file the model configuration has to be changed. The following configuration parameters of the model determine the build process:
• GenerateMakefile
• MakeCommand
• TemplateMakefile
Settings one of these parameters to a non-default value unlocks the makefile-based build process e. g.
Additional modifications can be performed as required via command line or graphical configuration dialog.
%% SYSTLC: <file>%% TMF: ert_default_tmf MAKE: make_rtw EXTMODE: no_ext_comm
%% SYSTLC: <file>%% TMF: trace32_target_ert MAKE: make_rtw EXTMODE: no_ext_comm
set_param(getActiveConfigSet(gcs),'MakeCommand', 'make_rtw "USE_TMF=1"')
Integration for Simulink 38 ©1989-2019 Lauterbach GmbH

Known Issues
This section is updated regularly with a list of common issues and workarounds.
TRACE32 XIL cannot be used for BigEndian Targets [MATLAB R2016a]
Simulation runs may fail in case of BigEndian targets with the error message:
This behavior is a known issue of MATLAB R2016a. Please see bug report #1404465 on the MathWorks homepage for additional details and an official workaround.
TRACE32 XIL cannot be used with Code Coverage Measurement and Diab Compiler [MATLAB R2016b]
Simulation runs may fail in case of code coverage measurement and Diab Compiler:
Please carry out the following steps as workaround for this issue:
1. Go to the “<MATLABROOT>\polyspace\configure\compiler_configuration” folder.
2. Open the original “diab.xml” file and search for the line: "<dialect>diab</dialect>".
3. Replace "<dialect>diab</dialect>" with "<dialect>default</dialect>".
4. Restart MATLAB.
5. Backup the file “<MATLABROOT>\polyspace\verifier\extensions\diab\tmw_builtins\powerpc.h”
6. Replace the file “<MATLABROOT>\polyspace\verifier\extensions\diab\tmw_builtins\powerpc.h” file with the version in “t32xil\targets\ppc\powerpc.h”.
Error: Invalid payload size (16777216) received during SIL/PIL communication between Simulink and the target application. Check the rtiostream implementation for the target application.
Error: The dialect 'diab' is unknown
NOTE: The modified header file is intended for use with the processor type PPCE200Z0VES. The use of the function “alloca()” is not supported.
Integration for Simulink 39 ©1989-2019 Lauterbach GmbH

Help Us Help You - Export TRACE32 Information
To help us help you, we need some data about your TRACE32 installation: which TRACE32 revision, which operating system (32-bit or 64-bit variant), which Lauterbach hardware, which firmware version you use, which target architecture and CPU you are debugging with etc.
To automatically collect this data, please follow these steps:
1. Download support.cmm from http://www.lauterbach.com/support/static/support.cmm
2. Start TRACE32 as usual. If possible, connect to the target and stop on a breakpoint.
3. Execute the downloaded support script (in TRACE32) with DO support.cmm (on Windows you can drag and drop it from the Windows Explorer window into the TRACE32 command line).
The script will first show a form for contact data.
4. If this is your first inquiry, please fill in the form.(Name, Address and Email are vital, to make sure we can reach you with our response).
5. Click the Save to File button.
6. Attach the generated output (the saved text file) in your support request.
Integration for Simulink 40 ©1989-2019 Lauterbach GmbH