Integration among Spatial Onion Markets inNigeria- A ... market integration of agricultural products...
12
© 2015. Adesola Adebola Ikudayisi & M. A.Y. Rahji. This is a research/review paper, distributed under the terms of the Creative Commons Attribution-Noncommercial 3.0 Unported License http://creativecommons.org/licenses/by-nc/3.0/), permitting all non- commercial use, distribution, and reproduction in any medium, provided the original work is properly cited. Global Journal of HUMAN-SOCIAL SCIENCE: E Economics Volume 15 Issue 3 Version 1.0 Year 2015 Type: Double Blind Peer Reviewed International Research Journal Publisher: Global Journals Inc. (USA) Online ISSN: 2249-460x & Print ISSN: 0975-587X Integration among Spatial Onion Markets in Nigeria- A Cointegration Analysis By Adesola Adebola Ikudayisi & M. A.Y. Rahji University of Ibadan, Nigeria Abstract- The study aimed at examining spatial market integration among geographically separated onion markets in Nigeria. Secondary data involving monthly retail price data of onion crop in the selected producing and consuming states were used for the analysis. The study was analysed using Ravallion model, Johansen cointegration, error correction model and granger causality. The index of market concentration indicated low short run market integration of onion market (IMC > 1), which could be as a result of poor road network in spatially separated markets. There was long run cointegration exist among the producing and consuming states and the error correction model result indicated that the rates of price transfer were generally moderate. This may be related to efficiency of information flow. The study recommends that farmers should be provided with more price information and good road network to enable them take advantage of spatial price differences. Keywords: co-integration, onion market, spatial integration and nigeria. GJHSS-E Classification : FOR Code: 340299 IntegrationamongSpatialOnionMarketsinNigeriaACointegrationAnalysis Strictly as per the compliance and regulations of:
Transcript of Integration among Spatial Onion Markets inNigeria- A ... market integration of agricultural products...

© 2015. Adesola Adebola Ikudayisi & M. A.Y. Rahji. This is a research/review paper, distributed under the terms of the Creative Commons Attribution-Noncommercial 3.0 Unported License http://creativecommons.org/licenses/by-nc/3.0/), permitting all non-commercial use, distribution, and reproduction in any medium, provided the original work is properly cited.
Global Journal of HUMAN-SOCIAL SCIENCE: E Economics Volume 15 Issue 3 Version 1.0 Year 2015 Type: Double Blind Peer Reviewed International Research Journal Publisher: Global Journals Inc. (USA) Online ISSN: 2249-460x & Print ISSN: 0975-587X
Integration among Spatial Onion Markets in Nigeria- A Cointegration Analysis
By Adesola Adebola Ikudayisi & M. A.Y. Rahji University of Ibadan, Nigeria
Abstract- The study aimed at examining spatial market integration among geographically separated onion markets in Nigeria. Secondary data involving monthly retail price data of onion crop in the selected producing and consuming states were used for the analysis. The study was analysed using Ravallion model, Johansen cointegration, error correction model and granger causality. The index of market concentration indicated low short run market integration of onion market (IMC > 1), which could be as a result of poor road network in spatially separated markets. There was long run cointegration exist among the producing and consuming states and the error correction model result indicated that the rates of price transfer were generally moderate. This may be related to efficiency of information flow. The study recommends that farmers should be provided with more price information and good road network to enable them take advantage of spatial price differences.
Keywords: co-integration, onion market, spatial integration and nigeria.
GJHSS-E Classification : FOR Code: 340299
IntegrationamongSpatialOnionMarketsinNigeriaACointegrationAnalysis
Strictly as per the compliance and regulations of:

Integration among Spatial Onion Markets in Nigeria- A Cointegration Analysis
Adesola Adebola Ikudayisi α & M. A.Y. Rahji σ
Abstract- The study aimed at examining spatial market integration among geographically separated onion markets in Nigeria. Secondary data involving monthly retail price data of onion crop in the selected producing and consuming states were used for the analysis. The study was analysed using Ravallion model, Johansen cointegration, error correction model and granger causality. The index of market concentration indicated low short run market integration of onion market (IMC > 1), which could be as a result of poor road network in spatially separated markets. There was long run cointegration exist among the producing and consuming states and the error correction model result indicated that the rates of price transfer were generally moderate. This may be related to efficiency of information flow. The study recommends that farmers should be provided with more price information and good road network to enable them take advantage of spatial price differences. Keywords: co-integration, onion market, spatial integration and nigeria.
I. Introduction
he objectives of marketing and pricing policies are to ensure stability and remunerative incomes for producers especially farmers. Marketing plays a
central role in the developmental process of the agricultural sector and the market serves as the link between the producers and the consumers. Prices are the most readily available and reliable information that guide farmers’ planting decisions in Nigeria. A farmer’s planting decisions depend on anticipated profits which depend on anticipated prices of planted crops. This has made prices important tool in the economic analysis of markets (Momoh et al., 2007). Meanwhile, agricultural commodities produced over an extensive spatial area are costly to transport relative to their total value as results in a complex set of spatial price linkages which affect the performance of markets.
Onion is one of oldest food sources in the world. Nigeria is noted as one of the highest producers in Sub Saharan Africa. Onion is a crop produced mainly in the northern parts of Nigeria. The production areas include Kaduna, Kano, Jigawa, Kastina, Kebbi, Sokoto, Plateau, and Bauchi States (Philip et al., 1996). In Nigeria, onions are the second most important vegetable after tomato (Hussain et al., 2000).
In terms of its trade value in Nigeria, onion can stand in comparison with tomatoes and pepper, Author α σ: Department of Agricultural Economics, University of Ibadan, Ibadan, Nigeria. e-mail: [email protected]
because of its unique position as a popular vegetable that is utilized almost daily in every home (Bednarz, 1986). Onion is used in cooking with other vegetables and meat in addition to be consumed as a salad. Due to its inelastic demand and perishable nature of onion, there are frequent variations in onion price and trade between different markets depending on their supply position (Lohano et al., 2005).
The supply of onions to markets is seasonal as a result of their growth and climatic requirement. The problem of assemblage and perishability of onions has resulted in relatively few market actors at the wholesale levels, as opposed to existence of a large number of buyers at the retail levels, thus increasing the number of market actors which is likely to elicit competition (Onyuma et al., 2006). The prevailing marketing system of onions suffer from a number of imperfections and problems particularly that of poor transportation and information flow concerning prices. This problem causes glut because traders are not aware of profitable marketing opportunities. Lack of viable and cheap post-harvest technologies to boost marketing are also constraining variables (Maritim, 1995). The marketing system failed to address prices stability from time to time due to information asymmetry (Okoh, 2005).
An efficient marketing system is one where there is a perfect market integration and full price transmission, with instantaneous price adjustment to changes from within or outside the system. Such a system would enable the producers, middlemen and consumers in the marketing chain to derive maximum gains. It would help in the elimination of unprofitable arbitrage and integrate spatially differentiated markets and would also ensure that efficient allocation of resources across space and time is achieved (Nkang et al., 2007).
Spatial market integration of agricultural products has been widely used to indicate overall market performance. If price changes in one market are fully reflected in alternative market, these markets are said to be spatially integrated (Goodwin & Schroeder, 1991). Spatial market integration refers to a situation in which prices of a commodity in spatially separated markets move together and price signals and information are transmitted smoothly across the markets (Ghosh, 2000). Prices in spatially integrated markets are determined simultaneously in various locations, and information of any change in price in one market is
T
V
olum
e XV
Issu
e III
Versio
n I
Globa
l Jo
urna
l of H
uman
Soc
ial Sc
ienc
e
© 2015 Global Journals Inc. (US)
-
59
Year
2015
( E)
transmitted to other markets (Gonzalez-Rivera and Helfand, 2001). In more integrated markets, farmers specialize in production activities in which they are comparatively proficient, consumers pay lower prices for purchased goods, and society is better able to reap increasing returns from technological innovations (Vollrath, 2003). In order to facilitate agricultural development process, analysis of market integration is considered pertinent and it is expected that favourable pricing efficiency will stimulate production and marketing.
It is necessary to study price movement in spatial markets because they represent the movements of equilibrium paths of demand and supply for produce e.g onions. The degree of proximity of the price movement and the speed and accuracy of price adjustment help to understand the speed and accuracy of diffusion of price information or the efficiency of price transmission between markets (Okoh, 1999). The knowledge of the state of integration in onion market system will help market intermediaries to identify the possibilities for substituting between markets and between commodities.
Examining integration among spatial onion markets in Nigeria is however important as price behaviour and dynamics would reveal the market’s ability to efficiently transfer information across markets particularly for the dichotomized Nigerian economy with its increasing population of urban food deficit centres and food surplus rural areas.
II. Material and Methods
The study covered two major onion producing states in Nigeria. Secondary data from National Bureau of Statistics (NBS), Nigeria were used for this study. The data were those on the monthly retail prices of onions in producing and corresponding consumption states. All prices are in Naira/kilogram (N / kg). The data covered the period January 2005- December 2010. The producing states were selected based on their relevance to the onion trade in Nigeria. Two production areas of Kebbi and Sokoto, and four consumption states of Abia, Oyo, Lagos and Rivers were selected for the study. The analytical tools used are Ravallion model, Cointegration, granger causality and error correction model.
a) Ravallion Model The model seeks to determine whether a
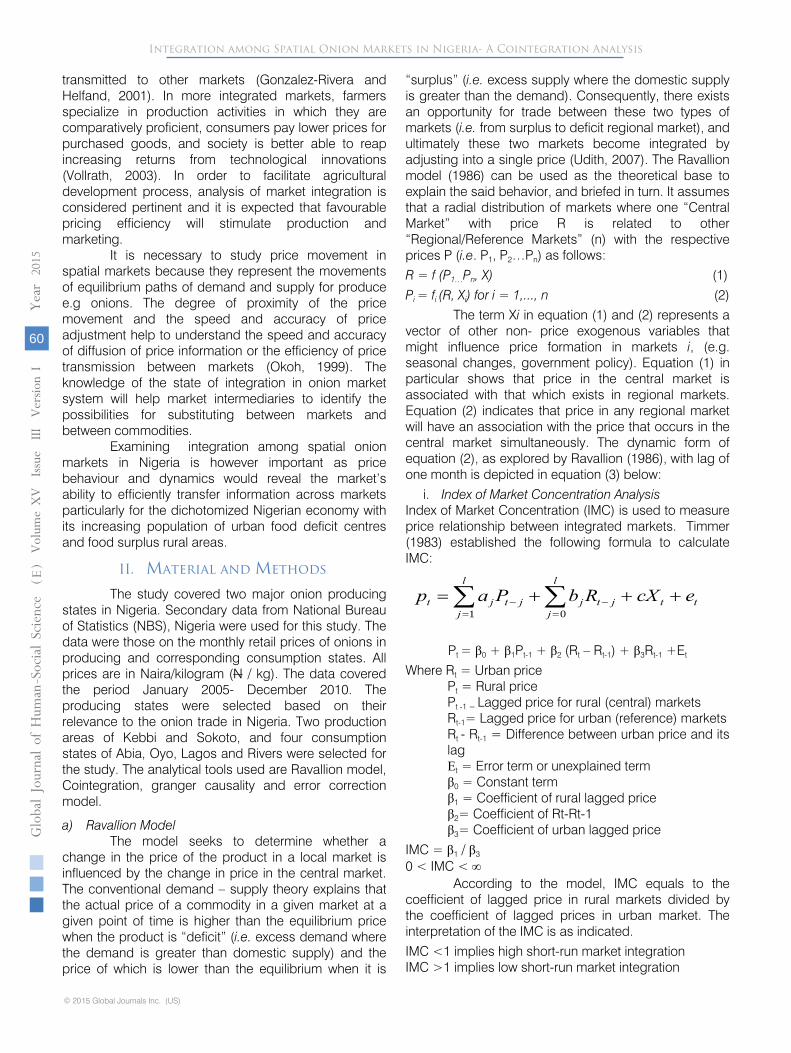
change in the price of the product in a local market is influenced by the change in price in the central market. The conventional demand – supply theory explains that the actual price of a commodity in a given market at a given point of time is higher than the equilibrium price when the product is “deficit” (i.e. excess demand where the demand is greater than domestic supply) and the price of which is lower than the equilibrium when it is
“surplus” (i.e. excess supply where the domestic supply is greater than the demand). Consequently, there exists an opportunity for trade between these two types of markets (i.e. from surplus to deficit regional market), and ultimately these two markets become integrated by adjusting into a single price (Udith, 2007). The Ravallion model (1986) can be used as the theoretical base to explain the said behavior, and briefed in turn. It assumes that a radial distribution of markets where one “Central Market” with price R is related to other “Regional/Reference Markets” (n) with the respective prices P (i.e. P1, P2…Pn) as follows: R = f (P1…Pn, X) (1) Pi = fi (R, Xi) for i = 1,..., n (2)
The term Xi in equation (1) and (2) represents a vector of other non- price exogenous variables that might influence price formation in markets i, (e.g. seasonal changes, government policy). Equation (1) in particular shows that price in the central market is associated with that which exists in regional markets. Equation (2) indicates that price in any regional market will have an association with the price that occurs in the central market simultaneously. The dynamic form of equation (2), as explored by Ravallion (1986), with lag of one month is depicted in equation (3) below:
i. Index of Market Concentration Analysis Index of Market Concentration (IMC) is used to measure price relationship between integrated markets. Timmer (1983) established the following formula to calculate IMC:
Pt = β0 + β1Pt-1 + β2 (Rt – Rt-1) + β3Rt-1 +Et
Where Rt = Urban price Pt = Rural price Pt -1 = Lagged price for rural (central) markets Rt-1= Lagged price for urban (reference) markets Rt - Rt-1 = Difference between urban price and its lag Еt = Error term or unexplained term β0 = Constant term β1 = Coefficient of rural lagged price β2= Coefficient of Rt-Rt-1 β3= Coefficient of urban lagged price
IMC = β1 / β3 0 < IMC < ∞
According to the model, IMC equals to the coefficient of lagged price in rural markets divided by the coefficient of lagged prices in urban market. The interpretation of the IMC is as indicated.
IMC <1 implies high short-run market integration IMC >1 implies low short-run market integration
∑ ∑= =
−− +++=l
j
l
jttjtjjtjt ecXRbPap
1 0
V
olum
e XV
Issu
e III
Versio
n I
60
Globa
l Jo
urna
l of H
uman
Soc
ial Sc
ienc
e
© 2015 Global Journals Inc. (US)
-
Year
2015
( E)
Integration among Spatial Onion Markets in Nigeria- A Cointegration Analysis

The closer to zero the value of the IMC is, the higher the degree of market integration
b) Cointegration analysis. i. Stationarity test
A variable is said to contain a unit root or I (1) if it is non-stationary. The use of data characterised by unit root may lead to serious error in statistical inference.
Yt= βYt-1 + Et
If β equals 1 the model is said to be characterised by unit root and the series is non –stationary. For a series to be stationary β must be less than unity in absolute value, i.e -1< β < 1. (Vaura et al, 2005). When the price series are stationary, cointegration test is carried out. Cointegration analysis is to determine the long run relationship among variables. Johansen (1988) and Johansen and Juselius (1990) developed a procedure of testing for cointegration. It constructs a test statistic, called the likelihood ratio (LR) test. This is used to determine the number of cointegrating vectors in a cointegration regression. This method treats all the variables as explicitly endogenous. It takes care of the endogenity problem by using a procedure that does not require arbitrary choice of a variable for normalization. It also allows tests for multiple cointegrating vectors (Basu, 2006). The tests are: (i) Trace test: The null hypothesis is that there are r or
fewer cointegrating vectors in the system. The test statistic is:
λtrace (r) = - T Σ ln (1 - λj) Where λj = The eigen-values. T = Total number of observations.
To determine the number of cointegrating vectors, r, we test the sequence of null hypotheses r=0, r≤1, r≤2,..., r≤(q-1). If r≤q is the first null hypothesis that is accepted then we conclude that there are r=q cointegrating vectors. (ii) Maximal eigenvalue test: The null hypothesis is that
the number of cointegrating vectors is r while the alternative hypothesis is that the number is r+1. The test statistic is
λmax (r, r+1) = −T ln(1− λ r +1) To determine the number of cointegrating
vectors, r, we test the sequence of null hypotheses r=0, r=1,..., r = q-1. If r=q is the first null accepted, then we conclude that there are r=q cointegrating vectors (Hande et al., 2009).
c) Error Correction Model Error Correction Model is a dynamic system
with the characteristics that the deviation of the current state from its long run relationship will be fed into its short run dynamics (Mukhtar, 2007). The tight linkage between cointegration and error correction models stems from the Granger representation theorem. This
theorem states that two or more integrated time series that are cointegrated have an error correction representation, and two or more time series that are error correcting are cointegrated (Engle and Granger 1987). A bivariate single-equation error correction model:
∆Yt = α0 - α1 (Yt-1 - β1Xt-1) + βo ∆Xt + Et In the equation above, current changes in Y are
a function of current changes in X (the first difference of X) and the degree to which the two series are outside of their equilibrium in the previous time period. Specifically, β0 captures any immediate effect that X has on Y, described as a contemporaneous effect or short-term effect. The coefficient, β1, reflects the equilibrium effect of X on Y. It is the causal effect that occurs over future time periods, often referred to as the long-term effect that X has on Y. Finally, the long-term effect occurs at a rate dictated by the value of α1.
d) Granger causality The Granger causality test is a statistical
hypothesis test for determining causality between variables in a time series. It is useful in forecasting if X variable granger cause Y variable or X contains useful information for predicting Y. A time series X is said to Granger-cause Y if it can be shown, usually through a series of t-tests and F-tests on lagged values of X (and with lagged values of Y also included), that those X values provide statistically significant information about future values of Y. Granger causality is sensitive to the numbers of lags introduced in the model and the direction of causality may depend critically on the number of lagged terms included (Gujarati et al., 2009). The test involves estimating the following pair of regression:
Yt = Ʃαi Xt-i+ ƩβjYt-j + u1t Xt = Ʃλi Xt-i + Ʃδj Yt-j + u2t
Where it is assumed that the disturbances u1t
and u2t are uncorrelated. There are four cases in
predicting Granger causality:
1 Unidirectional causality from x to y is indicated if the estimated coefficients on the lagged x are statistically different from zero as a group and the set of estimated coefficients on the lagged y is not statistically different from zero.
2 Conversely, unidirectional causality from y to x exists if the set of lagged x coefficient is not statistically different from zero and the set of the lagged y coefficients is statistically different from zero.
3 Feedback, or bilateral causality, is suggested when the sets of x and y coefficients are statistically significantly different from zero in both regressions
4 Finally, independence is suggested when the sets of x and y coefficients are not statistically significant in either of the regressions.
V
olum
e XV
Issu
e III
Versio
n I
Globa
l Jo
urna
l of H
uman
Soc
ial Sc
ienc
e
© 2015 Global Journals Inc. (US)
-
61
Year
2015
( E)
Integration among Spatial Onion Markets in Nigeria- A Cointegration Analysis

The test for Granger causality works by first running a regression of ΔY on lagged values of ΔY. (Here ΔY is the first difference of the variable Y — that is, Y minus its one-period-prior value. The regressions are performed in terms of ΔY rather than Y if Y is not stationary but ΔY is.) Once the set of significant lagged values for ΔY is found (via t-statistics or p-values), the regression is augmented with lagged levels of ΔX. Any particular lagged value of ΔX is retained in the regression if (1) it is significant according to a t-test and (2) it and the other lagged values of ΔX jointly add explanatory power to the model according to an F-test. Then the null hypothesis of no Granger causality is accepted if and only if no lagged values of ΔX have been retained.
III. Results and Discussion
a) Ravallion Result of the Market Pair The results in table 1 confirmed the existence of
short run market integration which is either low or high in the state pairs. The degree of market integration is measured by how close the IMC values are to zero. The closer to zero the value is, the higher the degree of market integration and thus market efficiency. From the result, price information of onions will not be transmitted instantaneously within lag periods across states, except in Sokoto and Oyo states pair that had high short run market integration. It implies that price changes in both states can be transmitted within a month. Also Oyo state which is a national market in Nigeria has direct link to Sokoto state where onion is majorly produced in Nigeria thus serves as a terminal for other markets. Using the Index of Market Concentration as a proxy for marketing efficiency, in other pairs there is presence of market inefficiencies indicating high variation in price across space and time. This can be as a result of poor storage facilities due to the perishable nature of onions and long and indirect route, poor road network from onions producing states to consuming states. This implies high handling costs which are likely to introduce imperfections into the marketing system.
V
olum
e XV
Issu
e III
Versio
n I
62
Globa
l Jo
urna
l of H
uman
Soc
ial Sc
ienc
e
© 2015 Global Journals Inc. (US)
-
Year
2015
( E)
Integration among Spatial Onion Markets in Nigeria- A Cointegration Analysis
IMC1 = a1/a4 and IMC2 = a1/a5

Fi
gure
s in
par
enth
eses
are
sta
ndar
d er
rors
. R
2 in
dica
t es
thei
r irr
elev
ance
in
dete
rmin
ing
mar
ket
inte
grat
ion
by t
he m
etho
d us
ed.
V
olum
e XV
Issu
e III
Versio
n I
Globa
l Jo
urna
l of H
uman
Soc
ial Sc
ienc
e
© 2015 Global Journals Inc. (US)
-
63
Year
2015
( E)
Integration among Spatial Onion Markets in Nigeria- A Cointegration Analysis
Prod
ucin
g
Con
sum
ing
a 1
a
2
a3
a4
a
5
T
R2
IM
C 1
IM
C 2
Cla
ssifi
catio
n
m
arke
t
m
arke
t
Keb
bi
Abi
a
0
.828
8
-0.1
880
-0
.029
3
0.1
362
0
.328
3
-0.0
025
0.
5486
6.
0852
2.52
45Lo
w S
/R m
arke
t int
egra
tion
both
per
iods
(0
.119
3)
(0.1
379)
(0
.139
9)
(0.1
407)
(0
.137
0)
(0.1
620)
-
-
-
Keb
bi
Lag
os
0.5
505
0
.089
5
0.4
606
-
0.32
17
0.2
580
-
0.02
32
0
.592
7
1.
7112
2.13
37 L
ow S
/R m
arke
t int
egra
tion
both
per
iods
(
0.13
71)
(0.1
406)
(0
.091
0)
(0.1
088)
(0
.108
6)
(0.1
137)
-
-
-
Keb
biO
yo
0
.451
8
0.1
067
0
.301
1
0.1
256
0
.097
2
-0.
1144
0.3
547
3
.597
1
4.
6481
Low
S/R
mar
ket i
nteg
ratio
n bo
th p
erio
ds
(0
.125
8)
(0.1
335)
(0
.121
4)
(0.1
347)
(0
.134
3)
(0.1
525)
-
-
-
Keb
biR
iver
s
0
.373
5
0.2
309
0
.006
8
0.
2358
0
.251
2
-0.
0802
0.
3061
1
.584
0
1
.486
8 L
ow S
/R m
arke
t int
egra
tion
both
per
iods
(
0.12
02)
(0.1
178)
(0
.109
9)
(0.1
188)
(0
.123
7)
(0.1
385)
-
-
-
Soko
toA
bia
0.7
216
-0
.246
0
–0.
0674
0
.415
2
0.1
690
0.33
09
0.60
21
1.7
380
4.2
698
Low
S/R
mar
ket i
nteg
ratio
n bo
th p
erio
ds
(0
.121
0)
(0.1
155)
(0
.164
6)
(0.2
067)
(0
.179
7)
(0.1
128)
-
-
-
Soko
toLa
gos
0.4
473
0
.141
5
0.
6253
-0.4
290
0
.159
3
0.2
382
0.5
596
1
.042
7
2.8
079
Lo
w S
/R m
arke
t int
egra
tion
both
per
iods
(
0.14
95)
(0.1
494)
(0
.126
5)
(0.1
761)
(0
.151
0)
(0.1
216)
-
-
-
Soko
toO
yo
0
.468
5
0.1
885
0.09
67
0.5
045
–
0.30
48
0.
1791
0.
4007
0
.928
6
1.5
370
H
igh
S/R
mar
ket i
nteg
ratio
n pe
riod
1
(0.1
209)
(0
.116
8)
(0.1
518)
(0
.190
5)
(0.1
621)
(0
.099
6)
-
-
Low
S/R
mar
ket i
nteg
ratio
n pe
riod
2
Soko
toR
iver
s
0.35
07
0.1
591
0
.211
2
0
.002
1
0.
2562
0.2
605
0
.340
6
16.
700
1.36
89
Low
S/R
mar
ket i
nteg
ratio
n bo
th p
erio
ds
(0.1
263)
(0
.123
6)
(0.1
481)
(0
.198
1)
(0.1
690)
(
0.10
89)
-
-
-
Tabl
e 1
:Reg
ress
ion
resu
lt fo
r the
mar
ket p
airs
b)
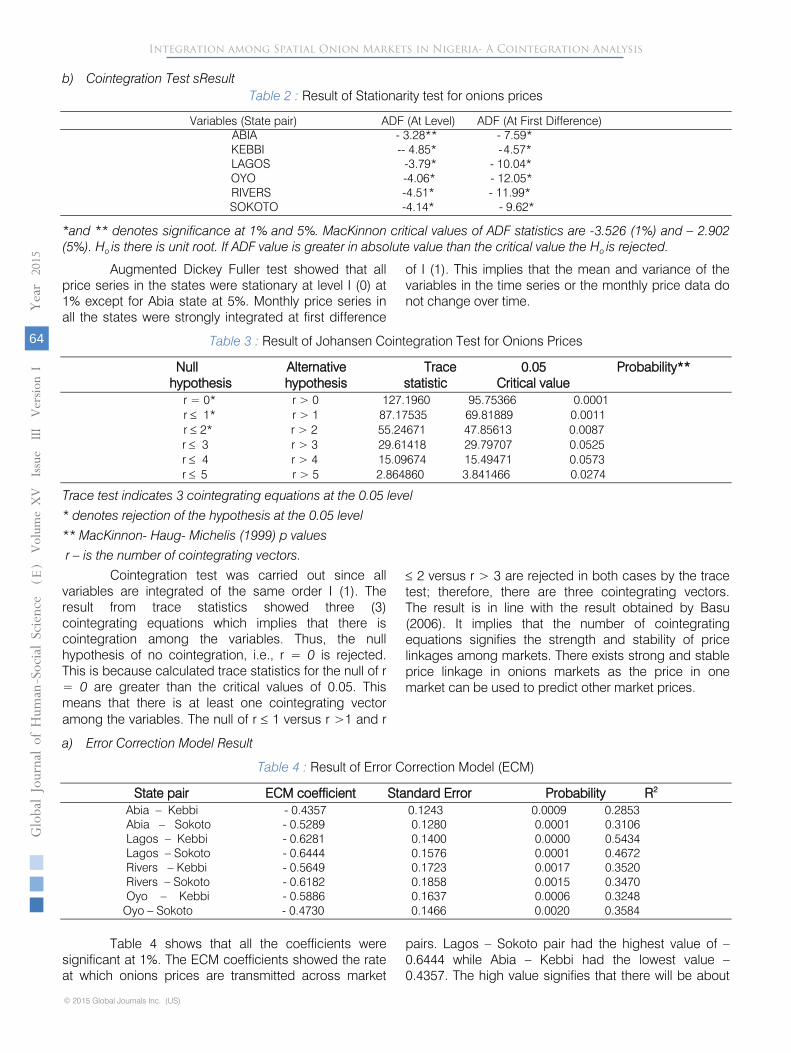
Cointegration Test sResult Table 2 : Result of Stationarity test for onions prices
Variables (State pair) ADF (At Level) ADF (At First Difference) ABIA - 3.28** - 7.59*
KEBBI -- 4.85* - 4.57* LAGOS -3.79* - 10.04*
OYO - 4.06* - 12.05* RIVERS -4.51* - 11.99*
SOKOTO - 4.14* - 9.62*
*and ** denotes significance at 1% and 5%. MacKinnon critical values of ADF statistics are -3.526 (1%) and – 2.902 (5%). Ho is there is unit root. If ADF value is greater in absolute value than the critical value the Ho is rejected.
Augmented Dickey Fuller test showed that all price series in the states were stationary at level I (0) at 1% except for Abia state at 5%. Monthly price series in all the states were strongly integrated at first difference
of I (1). This implies that the mean and variance of the variables in the time series or the monthly price data do not change over time.
Table 3 : Result of Johansen Cointegration Test for Onions Prices
Null Alternative Trace 0.05 Probability**
hypothesis hypothesis statistic Critical value
r = 0* r > 0 127.1960 95.75366 0.0001
r ≤ 1* r > 1 87.17535 69.81889 0.0011
r ≤ 2* r > 2 55.24671 47.85613 0.0087
r ≤ 3 r > 3 29.61418 29.79707 0.0525
r ≤ 4 r > 4 15.09674 15.49471 0.0573
r ≤ 5 r > 5 2.864860 3.841466 0.0274
Trace test indicates 3 cointegrating equations at the 0.05 level
* denotes rejection of the hypothesis at the 0.05 level
** MacKinnon- Haug- Michelis (1999) p values r – is the number of cointegrating vectors.
Cointegration test was carried out since all variables are integrated of the same order I (1). The result from trace statistics showed three (3) cointegrating equations which implies that there is cointegration among the variables. Thus, the null hypothesis of no cointegration, i.e., r = 0 is rejected. This is because calculated trace statistics for the null of r
= 0 are greater than the critical values of 0.05. This means that there is at least one cointegrating vector among the variables. The null of r ≤ 1 versus r >1 and r
≤ 2 versus r > 3 are rejected in both cases by the trace test; therefore, there are three cointegrating vectors. The result is in line with the result obtained by Basu (2006). It implies that the number of cointegrating equations signifies the strength and stability of price linkages among markets. There exists strong and stable price linkage in onions markets as the price in one market can be used to predict other market prices.
a) Error Correction Model Result
Table 4 : Result of Error Correction Model (ECM)
State pair ECM coefficient Standard Error Probability R2
Abia – Kebbi - 0.4357 0.1243 0.0009 0.2853
Abia – Sokoto - 0.5289 0.1280 0.0001 0.3106
Lagos – Kebbi - 0.6281 0.1400 0.0000 0.5434
Lagos – Sokoto - 0.6444 0.1576 0.0001 0.4672
Rivers – Kebbi - 0.5649 0.1723 0.0017 0.3520
Rivers – Sokoto - 0.6182 0.1858 0.0015 0.3470
Oyo – Kebbi - 0.5886 0.1637 0.0006 0.3248
Oyo – Sokoto - 0.4730 0.1466 0.0020 0.3584
Table 4 shows that all the coefficients were significant at 1%. The ECM coefficients showed the rate at which onions prices are transmitted across market
pairs. Lagos – Sokoto pair had the highest value of – 0.6444 while Abia – Kebbi had the lowest value – 0.4357. The high value signifies that there will be about
V
olum
e XV
Issu
e III
Versio
n I
64
Globa
l Jo
urna
l of H
uman
Soc
ial Sc
ienc
e
© 2015 Global Journals Inc. (US)
-
Year
2015
( E)
Integration among Spatial Onion Markets in Nigeria- A Cointegration Analysis

64% instantaneous adjustment of onions prices across the pair in the same month. Large values of ECM are indicative of how swiftly market prices are transferred from the producing states to consuming states within a particular time frame. Low values imply low efficiencies in terms of price information flow between states.
The different rates of onions price transfer from the result have implication on the performance of the
markets. States pair Lagos – Kebbi and Lagos- Sokoto, with higher rates suggests higher spatial efficiencies in onions market. Traders operating between these states could easily form correct expectation about price changes and this would help them in taking proper decisions on the volume and time of purchase of onions therefore minimising the problem of price uncertainty
b) Granger Causality Test Result
Table 5 : Price Causality Result
Number of Lags F-Statistic Direction of Causality Probability 2 3. 9082 Kebbi → Abia 0.0250*
2 6.5349 Abia ← Kebbi 0.0026** 2 7.1173 Lagos →Abia 0.0016**
2 3.4010 Sokoto→Abia 0.0394* 2 3.5655 Kebbi → Lagos 0.0339*
2 5.6341 Kebbi →Rivers 0.0055** 2 6.7986 Lagos →Oyo 0.0021** 2 6.7608 Oyo →Rivers 0.0022** 2 5.2485 Sokoto →Oyo 0.0077**
2 3.4131 Rivers →Sokoto 0.0390*
⇄ denote direction of causality. ** 1% and * 5%
There is granger causality in at least one direction since prices series are cointegrated. From the result, the null hypothesis is that there is no granger causality. The rejection of the null hypothesis is when F statistics is significant and/or the p values at 1% and 5% level of significance. The number of lag used was two (2) at least all price information should be transmitted within 2 months across states. From the result, among 15 pairs, only 10 showed causality in at least in one directional. There is unidirectional granger causality in all the variables except in Abia and Kebbi states which is bilateral (both directions).
Kebbi state granger cause Abia, Lagos, Rivers while Sokoto granger cause Abia and Oyo. Market prices in Kebbi and Sokoto States influence other consuming states because they are the producing states. They are able to increase the accuracy of the prediction of how market prices changes in consuming markets. Lagos granger cause Oyo because of their nearness and there is a direct channel of distribution from onions producing states. Absence of causality in other pairs does not mean lack of price transmission, the marketing chain or channel of distribution might be weak and also presence of market imperfections.
IV.
Summary,
Conclusion and Recommendations
Spatial market integration was examined by estimating price linkages among geographically separated onion markets in Nigeria. It was tested using
Ravallion model, cointegration, granger causality and error correction model.
The unit root test results indicate that price series are stationary at level and first difference at 1% and 5 % level of significance. The Index of Market Concentration result indicate low short run market integration in both periods except in Oyo and Sokoto state pair that had high short run market integration in the period 1. The Johansen cointegration result indicates long run relationship among variables. The result indicated three (3) cointegrating relationship among variables consider at 5% level of significance. There is a strong and stable price linkage across producing and consuming states. Presence of price transmission in the states enables producers to specialise according to comparative advantage.
The Error Correction Model result indicates that the rates of price transfer were generally moderate. This may be related to the efficiency of information flow while the Granger causality test indicated that among 15 pairs only10 granger cause one another in at least one direction. From the result, the producing states are the leading market because they predict the market price changes in all other consuming states.
It is concluded that there is spatial market integration in Onions Market in Nigeria. Based on the results of the analysis, the degree of integration and rate of price transmission have been found to differ across states. The presence of market integration is a vital tool and precondition for efficient marketing. Policy intervention for improvement of market integration in the long run may take the form of improvements of
V
olum
e XV
Issu
e III
Versio
n I
Globa
l Jo
urna
l of H
uman
Soc
ial Sc
ienc
e
© 2015 Global Journals Inc. (US)
-
65
Year
2015
( E)
Integration among Spatial Onion Markets in Nigeria- A Cointegration Analysis

marketing infrastructure, price information channels, road networks and transportation facilities, which may eventually reduce transport cost and enhance interregional trade. It is expected that this will eventually lead to expansion of the market boundary within which each onions farmer and seller operates. These improvements will prevent the inefficient allocation and / or distribution of crops in some states and further improve the efficiency of the onion market found to be currently inefficient. The study has highlighted low market integration between producing and consuming states and has suggested to devise strategies to bring about greater integration between these states, so that both the producing states and the consuming states in the country are benefitted.
References Références Referencias
1. Basu, J. P 2006. Cointegration and Market Integration: An Application to the Potato Markets in Rural West Bengal, India
2. Bednarz, F. 1986. Suggestions on Onions (Allium cepa L.).Variety improvement in Nigeria. Mimeograph, plant science department, I.A. R., ABU . Zaria.
3. Engel, R.F. and Granger, W.J. 1987. Cointegration and error correction: Re-presentation, estimation and testing. Econometrica, 55(2): 251–76.
4. Ghosh, M. 2000, Cointegration Tests and Spatial Integration of Rice Markets in India. Indian Journal of Agricultural Economics, 55(4), 616-625.
5. Gonzalez-Rivera, G. and Helfand, S.M. 2001. The Extent, Pattern, and Degree of Market Integration: A Multivariate Approach for the Brazilian Rice Market. American J. Agric. Econ., 83: 576–592.
6. Goodwin, B.K. and Schroeder, T.C. 1991. Cointegration Tests and Spatial Price Linkages in Regional Cattle Markets, American Journal of Agricultural Economics,73(2),452-464.
7. Gujarati D.N. 2009. Basic Econometrics. Fifth edition. The McGraw−Hill Companies.
8. Hande E. and Joniada Milla .2009. Analysis of Cointegration in Capital Markets of France, Germany and United Kingdom. Economics & Business Journal: Inquiries & Perspectives, 2(1), October 2009
9. Hussaini, M. A, Amans, E .B and Ramalan A.A. 2000. Yield, bulb size distribution and storability of onions (Allium cepa L) under different level of N fertilization and irrigation regime. Tropical Agriculture (Trinidad)., 77(3): 145- 149.
10. Johansen, S. 1988. Statistical analysis of cointegration vectors. Journal of economic dynamics and control, 12(2/3), 231-254.
11. Johansen, S., & Juselius, K. 1990. Maximum likelihood estimation and inference on cointegration
12.
Lohano, H.E. and Mari, F.M.2006. Testing Market Integration in Regional Onion Markets of
13.
Pakistan: Application of Error Correction Model in the Presence of Stationarity. International Research Journal of Finance and Economics. ISSN 1450-2887.
14.
MacKinnon, J.G., Haug, A.A., and Michelis, L. 1999. Numerical distribution functions of likelihood ratio tests for cointegration. Journal of Applied Econometrics, 14, 563-577.
15.
Maritim, H. K. 1995. The structure of performance of fruit and vegetable processing in Kenya. In: S. Carter (eds) "Cases and Research in agricultural marketing and agribusiness" 2:273-83.
16.
Momoh S. and Agbonlahor, M. U. 2007. Food price differences and market integration in Oyo State. ASSET Series C 2 (1): 79-86
17.
Mukhtar, T and Muhammed T. J. 2007. Price integration in wholesale maize markets in Pakistan. The Pakistan Development Review, 46(4):1075 – 1084.
18.
Nkang, M. N., Hentry, M.N. and Gabriel, N.O. 2007. Price transmission and integration of cocoa and palm oil markets in cross river state, Nigeria: Implications for rural development, Agricultural Journal, 2(4): 457-463.
19.
Okoh, R.N. 1999. An Analysis of Oligopolistic Pricing and Market Integration of Cassava
Roots and Products in Delta and Edo States, Nigeria. PhD dissertation, University of Ibadan, Ibadan.
20.
Okoh R N and
P.C. Egbon. 2005. The integration of Nigeria's rural and urban foodstuffs markets. AERC Research Paper 151 African Economic Research Consortium, Nairobi.
21.
Onyuma S. O., Icart E., and Owuor G. 2006. Testing Market Integration for Fresh Pineapples in Kenya. Poster Paper prepared for presentation at the International Association of Agricultural Economist Conference, Gold Coast, Australia, August 12-18, 2006.
22.
Philip, D.O.A and Ahmed, B. 1996. An Assessment of Farmer’s participation in the choice of crops and water use practices under large scale irrigation schemes in Nigeria. The case of Kano river project phase one (KRP - 1)”. Nigeria Journal of rural economy and society. 1(2): 39- 45.
23.
Ravallion, M. 1986. Testing market integration, American Journal of Agricultural
Economics, 68(2):292-307.
24.
Timmer, C. P., Falcon, W. P. and Pearson, R. S. 1983. Food Policy Analysis.
Baltimore, JHU Press.
V
olum
e XV
Issu
e III
Versio
n I
66
Globa
l Jo
urna
l of H
uman
Soc
ial Sc
ienc
e
© 2015 Global Journals Inc. (US)
-
Year
2015
( E)
Integration among Spatial Onion Markets in Nigeria- A Cointegration Analysis
with applications to the demand for money. Oxford Bulletin of Economics and statistics, 52(2), 169-210.
25. Udith K. Jayasinghe-Mudalige. 2007. An Economic Analysis on Spatial Integration of Regional Rice Markets in Sri Lanka.
26. Vavra, P. and Goodwin, B. K. 2005.Analysis of Price Transmission Along the Food Chain.OECD Food,

V
olum
e XV
Issu
e III
Versio
n I
Globa
l Jo
urna
l of H
uman
Soc
ial Sc
ienc
e
© 2015 Global Journals Inc. (US)
-
67
Year
2015
( E)
Integration among Spatial Onion Markets in Nigeria- A Cointegration Analysis
Agriculture and Fisheries Working Papers, No. 3, OECD Publishing. doi:10.1787/752335872456.
27. Vollrath, T.L. 2003. North American Agricultural Market Integration and its Impact on the Food and Fiber System. Agriculture Information Bulletin No. 784, Market and Trade Economics Division, Economic Research Service, USDA, USA.

This page is intentionally left blank
V
olum
e XV
Issu
e III
Versio
n I
68
Globa
l Jo
urna
l of H
uman
Soc
ial Sc
ienc
e
© 2015 Global Journals Inc. (US)
-
Year
2015
( E)
Integration among Spatial Onion Markets in Nigeria- A Cointegration Analysis

© 2015. Professor Dr. Kazi Abdur Rouf. This is a research/review paper, distributed under the terms of the Creative Commons Attribution-Noncommercial 3.0 Unported License http://creativecommons.org/licenses/by-nc/3.0/), permitting all non-commercial use, distribution, and reproduction in any medium, provided the original work is properly cited.
Global Journal of HUMAN-SOCIAL SCIENCE: E Economics Volume 15 Issue 3 Version 1.0 Year 2015 Type: Double Blind Peer Reviewed International Research Journal Publisher: Global Journals Inc. (USA) Online ISSN: 2249-460x & Print ISSN: 0975-587X
Revenue-Generating Social and Economic Mission-Entwined Praxis of Organizations
By Professor Dr. Kazi Abdur Rouf York University, Canada
Abstract- Researchers, academicians, social scientists, policy makers, executives, and state leaders realize that classical economics, profit-maximizing corporations and traditional businesses are unwilling or unable to altruistically strive for public wellbeing in fulfilling the needs of society. Profitmaximizing capitalism destroys humanity and the harmony of society. Corporations are harmful to the environment; it has created poverty, unemployment, malnutrition, inequality, injustice and abnormality in the community. Hence many economists, policy makers, executives, academicians and state leaders comprehend that business policies should be adapted to enhance public wellbeing. They think that the sociology of economics and of business as well as political economy are missing in profit-maximizing business capitalism. Therefore, many thinkers believe it is necessary to include social objectives alongside profit-maximization to establish more altruistic businesses with practices that promote rather than hinder public wellbeing.
Key Terms: Community economic development, Grameen social business design lab, Nabin Udyokta, social business, social entrepreneurship, social enterprise, social economy and social investment.
GJHSS-E Classification : FOR Code: 349999
RevenueGeneratingSocialandEconomicMissionEntwinedPraxisofOrganizations
Strictly as per the compliance and regulations of: