Integrating the Pharmaceutical Manufacturing Process and...
54
3DS.COM © Dassault Systèmes | Confidential Information | 1/5/2017 | ref.: 3DS_Document_2015 Integrating the Pharmaceutical Manufacturing Process and Quality Organizations to Drive Right First Time Performance Justin O. Neway, Ph.D. Vice President, Process Production Operations Senior Fellow, BIOVIA Science Council BIOVIA, a division of Dassault Systèmes
Transcript of Integrating the Pharmaceutical Manufacturing Process and...

3DS
.CO
M©
Das
saul
tSys
tèm
es| C
onfid
entia
l Inf
orm
atio
n | 1
/5/2
017
| ref
.: 3D
S_D
ocum
ent_
2015
Integrating the Pharmaceutical Manufacturing Process
and Quality Organizations
to Drive Right First Time Performance
Justin O. Neway, Ph.D.
Vice President, Process Production Operations
Senior Fellow, BIOVIA Science Council
BIOVIA, a division of Dassault Systèmes

2
3DS
.CO
M/B
IOV
IA ©
Das
saul
tSys
tèm
es| C
onfid
entia
l Inf
orm
atio
n | 1
/5/2
017
| ref
.: 3D
S_D
ocum
ent_
2015
Presentation Outline Our complex manufacturing process and quality environment
A quick look at:
Data integrity
FDA Guidance on Contractor Quality Agreements
Continued Process Verification (CPV)
Manufacturing Quality Metrics (MQM)
Traditional approaches and barriers
Best practices for Right First Time manufacturing
Example – Collaborative Platform for Right First Time operations
Business benefits

3
3DS
.CO
M/B
IOV
IA ©
Das
saul
tSys
tèm
es| C
onfid
entia
l Inf
orm
atio
n | 1
/5/2
017
| ref
.: 3D
S_D
ocum
ent_
2015
Recent Industry Trends

4
3DS
.CO
M/B
IOV
IA ©
Das
saul
tSys
tèm
es| C
onfid
entia
l Inf
orm
atio
n | 1
/5/2
017
| ref
.: 3D
S_D
ocum
ent_
2015
Shortening Time to Market: 2015 Challenges
LNS Research, 2015

5
3DS
.CO
M/B
IOV
IA ©
Das
saul
tSys
tèm
es| C
onfid
entia
l Inf
orm
atio
n | 1
/5/2
017
| ref
.: 3D
S_D
ocum
ent_
2015
Quality Management: 2015 Challenges
LNS Research, 2015

6
3DS
.CO
M/B
IOV
IA ©
Das
saul
tSys
tèm
es| C
onfid
entia
l Inf
orm
atio
n | 1
/5/2
017
| ref
.: 3D
S_D
ocum
ent_
2015
The Modern Manufacturing Process and Quality Network
Paper Records
Paper Records
Paper Records
7
3DS
.CO
M/B
IOV
IA ©
Das
saul
tSys
tèm
es| C
onfid
entia
l Inf
orm
atio
n | 1
/5/2
017
| ref
.: 3D
S_D
ocum
ent_
2015
Recent Regulatory Trends

8
3DS
.CO
M/B
IOV
IA ©
Das
saul
tSys
tèm
es| C
onfid
entia
l Inf
orm
atio
n | 1
/5/2
017
| ref
.: 3D
S_D
ocum
ent_
2015
A Decade of Manufacturing Regulatory InitiativesProcess Analytical Technology (PAT) - 2004
Quality by Design (QbD) - 2006
Continued Process Verification (CPV) - 2011
Contractor Quality Agreements (CQA) - 2013
Manufacturing Quality Metrics (MQM) – 2015/2016
Real-time (on-line, in-line, at-line) control of Quality
Control of Quality is designed into the process
Must continue to monitor in-process and final product Quality for all batches
Sponsor and Contractor (CMO) are both responsible for Quality
Agency requires regular submission of Manufacturing Quality Metrics

9
3DS
.CO
M/B
IOV
IA ©
Das
saul
tSys
tèm
es| C
onfid
entia
l Inf
orm
atio
n | 1
/5/2
017
| ref
.: 3D
S_D
ocum
ent_
2015 Influence of Inspections: Data Integrity Findings
A Critical Business and Regulatory Issue

10
3DS
.CO
M/B
IOV
IA ©
Das
saul
tSys
tèm
es| C
onfid
entia
l Inf
orm
atio
n | 1
/5/2
017
| ref
.: 3D
S_D
ocum
ent_
2015
What is Data Integrity? ALCOA Principles Attributable – Who performed the action and When? If a record was changed,
who did it and why? Link to the source data
Legible – Data must be recorded permanently in a durable medium and be
readable
Contemporaneous – The data should be recorded at the same time as the
work is performed, and date-and-time stamps should follow in order
Original – Is the data the original record or a certified copy?
Accurate – No errors or editing performed without documented amendments

11
3DS
.CO
M/B
IOV
IA ©
Das
saul
tSys
tèm
es| C
onfid
entia
l Inf
orm
atio
n | 1
/5/2
017
| ref
.: 3D
S_D
ocum
ent_
2015
The Data Integrity Fraud Triangle
Example: Management objectives
that measure number of tests that
pass in a limited time
Example: Falsifier can make entries
or changes without witnesses or
built-in system controls
Example: Falsifier tells themselves that
The change is really minor and may even
save the company in the long run

12
3DS
.CO
M/B
IOV
IA ©
Das
saul
tSys
tèm
es| C
onfid
entia
l Inf
orm
atio
n | 1
/5/2
017
| ref
.: 3D
S_D
ocum
ent_
2015
Influence of Drug Shortage Findings

13
3DS
.CO
M/B
IOV
IA ©
Das
saul
tSys
tèm
es| C
onfid
entia
l Inf
orm
atio
n | 1
/5/2
017
| ref
.: 3D
S_D
ocum
ent_
2015
Reasons for Drug Shortages (2007 – 2013)

14
3DS
.CO
M/B
IOV
IA ©
Das
saul
tSys
tèm
es| C
onfid
entia
l Inf
orm
atio
n | 1
/5/2
017
| ref
.: 3D
S_D
ocum
ent_
2015 The Regulatory Response
A Big Focus on Quality and Data Integrity

15
3DS
.CO
M/B
IOV
IA ©
Das
saul
tSys
tèm
es| C
onfid
entia
l Inf
orm
atio
n | 1
/5/2
017
| ref
.: 3D
S_D
ocum
ent_
2015
Continued Process Verification (CPV) Trending
CPV originated with the GMPs (21CFR211.110):
“Such control procedures shall be established to monitor the output and to validate
the performance of those manufacturing processes that may be responsible for
causing variability in the characteristics of in-process material and the drug product.”
Recently highlighted in Stage 3 of the updated FDA Validation Guidelines:
“The goal of the third validation stage is continual assurance that the process
remains in a state of control (the validated state) during commercial manufacture.”
Guidance for Industry, Process Validation: General Principles and Practices, FDA, 2011
16
3DS
.CO
M/B
IOV
IA ©
Das
saul
tSys
tèm
es| C
onfid
entia
l Inf
orm
atio
n | 1
/5/2
017
| ref
.: 3D
S_D
ocum
ent_
2015
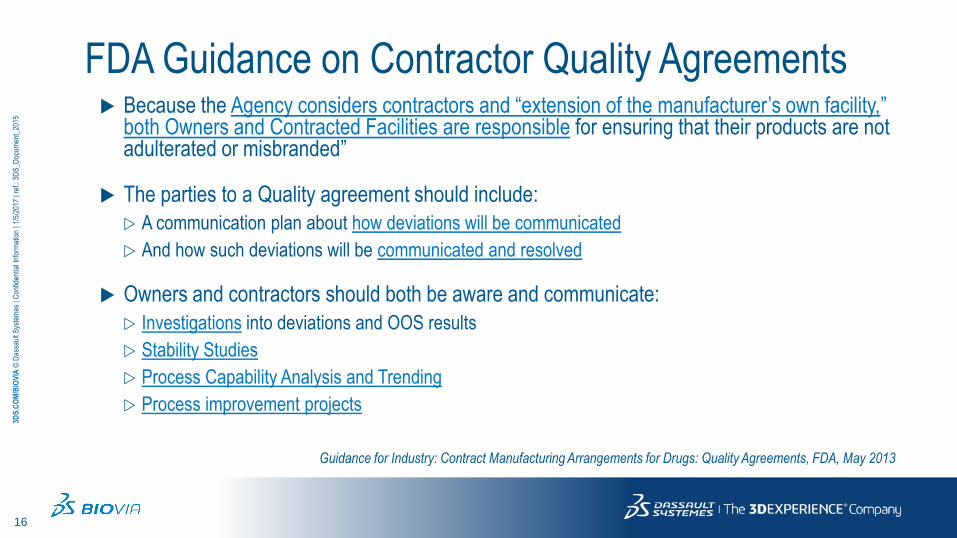
FDA Guidance on Contractor Quality Agreements Because the Agency considers contractors and “extension of the manufacturer’s own facility,”
both Owners and Contracted Facilities are responsible for ensuring that their products are not adulterated or misbranded”
The parties to a Quality agreement should include:
A communication plan about how deviations will be communicated
And how such deviations will be communicated and resolved
Owners and contractors should both be aware and communicate:
Investigations into deviations and OOS results
Stability Studies
Process Capability Analysis and Trending
Process improvement projects
Guidance for Industry: Contract Manufacturing Arrangements for Drugs: Quality Agreements, FDA, May 2013

17
3DS
.CO
M/B
IOV
IA ©
Das
saul
tSys
tèm
es| C
onfid
entia
l Inf
orm
atio
n | 1
/5/2
017
| ref
.: 3D
S_D
ocum
ent_
2015
FDA Quality Metrics Guidance, November 2016FDA intends to use quality metrics data to:
Establish a signal detection program as one factor in identifying establishments and products that may pose significant risk to consumers
Identify situations in which there may be a risk for drug supply disruption
Improve the effectiveness of establishment inspections
Improve FDA’s evaluation of drug manufacturing and control operations
FDA intends to publish an analysis of the quality metrics data received on the FDA Web site to share what the Agency has learned from the voluntary phase of the reporting program, and how analyzing these data has affected the frequency of CGMP inspections and the ability of the Agency to address potential drug shortage situations.
FDA intends to publish a list of the names of establishments that voluntarily report all or a subset of quality data as described in this guidance (Top Tier, Mid Tier)
This list may be useful to establishments within the pharmaceutical manufacturing industry when selecting contract manufacturers and component suppliers
Submission of Quality Metrics Data: Guidance for Industry (DRAFT), FDA, 2016

18
3DS
.CO
M/B
IOV
IA ©
Das
saul
tSys
tèm
es| C
onfid
entia
l Inf
orm
atio
n | 1
/5/2
017
| ref
.: 3D
S_D
ocum
ent_
2015
The Manufacturing Quality Metrics and What They Show
Lot Acceptance Rate (LAR):
Is the manufacturing process under control?
Next logical question: Please show your investigation, root cause and correction data
Product Quality Complaint Rate (PQCR):
Is the Quality system working?
Next logical question: Please show your CAPA system and results
Invalidated OOS Rate (IOOSR):
Is the organization attempting to “test until the product passes?”
Next logical question: Please show your QMS, management structure and training records

19
3DS
.CO
M/B
IOV
IA ©
Das
saul
tSys
tèm
es| C
onfid
entia
l Inf
orm
atio
n | 1
/5/2
017
| ref
.: 3D
S_D
ocum
ent_
2015
The Traditional Approach
to Process and Quality Collaboration
20
3DS
.CO
M/B
IOV
IA ©
Das
saul
tSys
tèm
es| C
onfid
entia
l Inf
orm
atio
n | 1
/5/2
017
| ref
.: 3D
S_D
ocum
ent_
2015
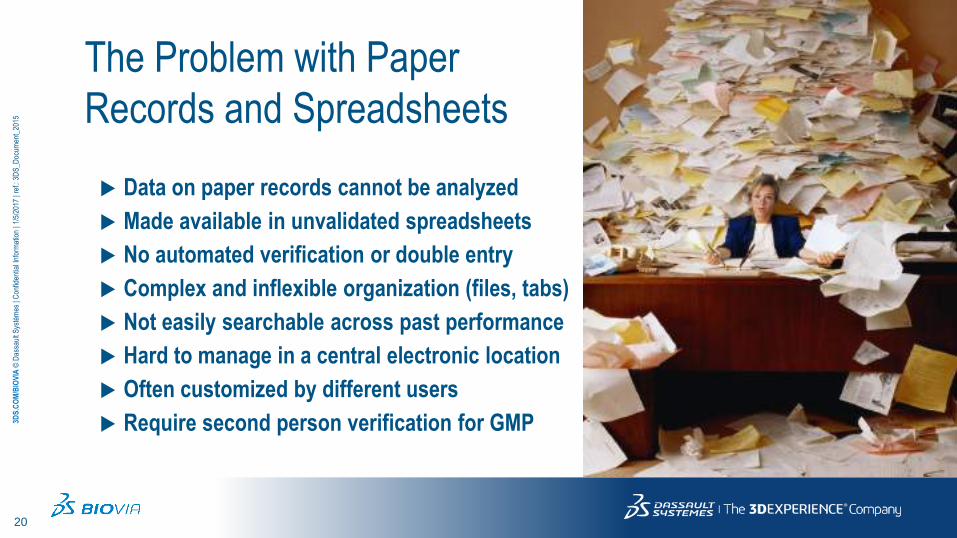
The Problem with Paper
Records and Spreadsheets
Data on paper records cannot be analyzed
Made available in unvalidated spreadsheets
No automated verification or double entry
Complex and inflexible organization (files, tabs)
Not easily searchable across past performance
Hard to manage in a central electronic location
Often customized by different users
Require second person verification for GMP

21
3DS
.CO
M/B
IOV
IA ©
Das
saul
tSys
tèm
es| C
onfid
entia
l Inf
orm
atio
n | 1
/5/2
017
| ref
.: 3D
S_D
ocum
ent_
2015
The Current State
UPSTREAMDATA
PURIFICATIONDATA
LIMS DATA(Release,..)
COLLECTION
ContinuousHistorian
Batch Records
UNICORN(Continuous I/O)
Batch Records
Excel Layout File
JMP ScriptSingle Point
Multi point/ Continuous
UNICORN“Evaluate”
Up Mfg Excel~100 variables
Pur. Mfg Excel200 variables
Manual Update
Weekly Data Report(per Product)
Control Charts/ Capability
Multi-Point / ContinuousTrend Overlays
HGS1021 S-3 pH Continuous Trend
6.7
6.8
6.9
7.0
7.1
7.2
7.3
7.4
0 20 40 60 80 100 120 140 160
S-3 Time (hours)
pH
3001001341 (Gold) 3001001768 3001001766 3001001760
HGS1021 ProSep Process 410399 cycle1 29apr10001:10_CIR102 HGS1021 ProSep Process 410399 cycle1 29apr10001:10_AIR121pH HGS1021 ProSep Process 410399 cycle1 29apr10001:10_AIR131UV1 HGS1021 ProSep Process 410401 CYCLE1 06MAY10001:10_CIR102 HGS1021 ProSep Process 410401 CYCLE1 06MAY10001:10_AIR121pH HGS1021 ProSep Process 410401 CYCLE1 06MAY10001:10_AIR131UV1 HGS1021 ProSep Process 410401 CYCLE1 06MAY10001:10_Logbook HGS1021 ProSep Process 410399 cycle1 29apr10001:10_Logbook
0.0
1.0
2.0
3.0
AU
3.0
4.0
5.0
6.0
7.0
pH
0 200 400 600 800 l
Start
Equ
il
Load
Beg
in
Was
h 1 B
egin
Was
h 2 B
egin
Eluti
on B
egin
Colle
ction
Star
t
Colle
ction
End
Start
Equ
il
Load
Beg
in
Was
h 1 B
egin
Was
h 2 B
egin
Eluti
on B
egin
Colle
ction
Star
t
Colle
ction
End
ChromatogramOverlays

22
3DS
.CO
M/B
IOV
IA ©
Das
saul
tSys
tèm
es| C
onfid
entia
l Inf
orm
atio
n | 1
/5/2
017
| ref
.: 3D
S_D
ocum
ent_
2015
The Current State
UPSTREAMDATA
PURIFICATIONDATA
LIMS DATA(Release,..)
Weekly Data Report(per Product)
Control Charts/ Capability
Multi-Point / ContinuousTrend Overlays
HGS1021 S-3 pH Continuous Trend
6.7
6.8
6.9
7.0
7.1
7.2
7.3
7.4
0 20 40 60 80 100 120 140 160
S-3 Time (hours)
pH
3001001341 (Gold) 3001001768 3001001766 3001001760
HGS1021 ProSep Process 410399 cycle1 29apr10001:10_CIR102 HGS1021 ProSep Process 410399 cycle1 29apr10001:10_AIR121pH HGS1021 ProSep Process 410399 cycle1 29apr10001:10_AIR131UV1 HGS1021 ProSep Process 410401 CYCLE1 06MAY10001:10_CIR102 HGS1021 ProSep Process 410401 CYCLE1 06MAY10001:10_AIR121pH HGS1021 ProSep Process 410401 CYCLE1 06MAY10001:10_AIR131UV1 HGS1021 ProSep Process 410401 CYCLE1 06MAY10001:10_Logbook HGS1021 ProSep Process 410399 cycle1 29apr10001:10_Logbook
0.0
1.0
2.0
3.0
AU
3.0
4.0
5.0
6.0
7.0
pH
0 200 400 600 800 l
Start
Equ
il
Load
Beg
in
Was
h 1 B
egin
Was
h 2 B
egin
Eluti
on B
egin
Colle
ction
Star
t
Colle
ction
End
Start
Equ
il
Load
Beg
in
Was
h 1 B
egin
Was
h 2 B
egin
Eluti
on B
egin
Colle
ction
Star
t
Colle
ction
End
ChromatogramOverlays
ContinuousHistorian
Batch Records
UNICORN(Continuous I/O)
Batch Records
Excel Layout File
JMP ScriptSingle Point
Multi point/ Continuous
UNICORN“Evaluate”
Up Mfg Excel~100 variables
Pur. Mfg Excel200 variables
Manual Update
COLLECTION

23
3DS
.CO
M/B
IOV
IA ©
Das
saul
tSys
tèm
es| C
onfid
entia
l Inf
orm
atio
n | 1
/5/2
017
| ref
.: 3D
S_D
ocum
ent_
2015
The Current State
UPSTREAMDATA
PURIFICATIONDATA
LIMS DATA(Release,..)
Weekly Data Report(per Product)
Control Charts/ Capability
Multi-Point / ContinuousTrend Overlays
HGS1021 S-3 pH Continuous Trend
6.7
6.8
6.9
7.0
7.1
7.2
7.3
7.4
0 20 40 60 80 100 120 140 160
S-3 Time (hours)
pH
3001001341 (Gold) 3001001768 3001001766 3001001760
HGS1021 ProSep Process 410399 cycle1 29apr10001:10_CIR102 HGS1021 ProSep Process 410399 cycle1 29apr10001:10_AIR121pH HGS1021 ProSep Process 410399 cycle1 29apr10001:10_AIR131UV1 HGS1021 ProSep Process 410401 CYCLE1 06MAY10001:10_CIR102 HGS1021 ProSep Process 410401 CYCLE1 06MAY10001:10_AIR121pH HGS1021 ProSep Process 410401 CYCLE1 06MAY10001:10_AIR131UV1 HGS1021 ProSep Process 410401 CYCLE1 06MAY10001:10_Logbook HGS1021 ProSep Process 410399 cycle1 29apr10001:10_Logbook
0.0
1.0
2.0
3.0
AU
3.0
4.0
5.0
6.0
7.0
pH
0 200 400 600 800 l
Start
Equ
il
Load
Beg
in
Was
h 1 B
egin
Was
h 2 B
egin
Eluti
on B
egin
Colle
ction
Star
t
Colle
ction
End
Start
Equ
il
Load
Beg
in
Was
h 1 B
egin
Was
h 2 B
egin
Eluti
on B
egin
Colle
ction
Star
t
Colle
ction
End
ChromatogramOverlays
ContinuousHistorian
Batch Records
UNICORN(Continuous I/O)
Batch Records
Excel Layout File
JMP ScriptSingle Point
Multi point/ Continuous
UNICORN“Evaluate”
Up Mfg Excel~100 variables
Pur. Mfg Excel200 variables
Manual Update
COLLECTION

24
3DS
.CO
M/B
IOV
IA ©
Das
saul
tSys
tèm
es| C
onfid
entia
l Inf
orm
atio
n | 1
/5/2
017
| ref
.: 3D
S_D
ocum
ent_
2015
Spreadsheet Error Rates

25
3DS
.CO
M/B
IOV
IA ©
Das
saul
tSys
tèm
es| C
onfid
entia
l Inf
orm
atio
n | 1
/5/2
017
| ref
.: 3D
S_D
ocum
ent_
2015
What do We Really Want?

26
3DS
.CO
M/B
IOV
IA ©
Das
saul
tSys
tèm
es| C
onfid
entia
l Inf
orm
atio
n | 1
/5/2
017
| ref
.: 3D
S_D
ocum
ent_
2015
Digital Collaboration for “Right-First-Time” Performance
Make Safe and Efficacious Products• Short Process Development & Start-up
• Fast Prep & Approval of CMC filings
• High Yield and Quality
• Low Process and Product Variability• Acceptable Process Economics
• Sustainable Supply Chain
AND all the Supporting Data, Information and
Institutionalized Knowledge
Regardless of Organizations or Geographies
Process Development
Manufacturing
Quality
Collaboration

27
3DS
.CO
M/B
IOV
IA ©
Das
saul
tSys
tèm
es| C
onfid
entia
l Inf
orm
atio
n | 1
/5/2
017
| ref
.: 3D
S_D
ocum
ent_
2015
What are the Barriers?

28
3DS
.CO
M/B
IOV
IA ©
Das
saul
tSys
tèm
es| C
onfid
entia
l Inf
orm
atio
n | 1
/5/2
017
| ref
.: 3D
S_D
ocum
ent_
2015
ERP LIMS HIST CAPA MES other
The Manufacturing Data Collection Landscape
Paper
Records
Raw MaterialsProcess Step 1
ProcessStep 2
ProcessStep 3
Process Steps…
Final Product

29
3DS
.CO
M/B
IOV
IA ©
Das
saul
tSys
tèm
es| C
onfid
entia
l Inf
orm
atio
n | 1
/5/2
017
| ref
.: 3D
S_D
ocum
ent_
2015
Contextualization – The Biggest Time Sink
Contextualization is the organization of related (linked) data
elements to enable a particular analysis and interpretation
Data plus metadata provides context that allows meaningful
analysis and interpretation

30
3DS
.CO
M/B
IOV
IA ©
Das
saul
tSys
tèm
es| C
onfid
entia
l Inf
orm
atio
n | 1
/5/2
017
| ref
.: 3D
S_D
ocum
ent_
2015
Contextualization: Linking Data and MetadataAnalysis question: What’s happening?

31
3DS
.CO
M/B
IOV
IA ©
Das
saul
tSys
tèm
es| C
onfid
entia
l Inf
orm
atio
n | 1
/5/2
017
| ref
.: 3D
S_D
ocum
ent_
2015
Contextualization – What we do in Spreadsheets
Contextualization is the organization of related data elements to enable a
particular analysis and interpretation
Examples of useful contexts for Process and Quality data analysis:
Data type context: enables specific types of data analyses
Batch context: enables batch-to-batch analyses
Residence time/volume: enables analyses in continuous manufacturing
Process context: enables process-to-process analyses
Site context: enables site-to-site analyses
Genealogy context: enables upstream / downstream correlations

32
3DS
.CO
M/B
IOV
IA ©
Das
saul
tSys
tèm
es| C
onfid
entia
l Inf
orm
atio
n | 1
/5/2
017
| ref
.: 3D
S_D
ocum
ent_
2015
Best Practices for
Right First Time Manufacturing

33
3DS
.CO
M/B
IOV
IA ©
Das
saul
tSys
tèm
es| C
onfid
entia
l Inf
orm
atio
n | 1
/5/2
017
| ref
.: 3D
S_D
ocum
ent_
2015
ERP Other HIST
Process and Quality Collaboration with BIOVIA Discoverant
InVisionInformation Authoring Environment
KnowledgeNet Information Visualization Environment
Ad Hoc Numerical Analysis, Statistical Modeling,
Visualization and Results Automation
Results can also be displayed in
External Applications
SharePoint, Dashboards,
Word, Crystal Reports
Data is also Available
to External
Applications
Pipeline Pilot, JMP,
Minitab, Umetrics,
MATLAB
Outputs to role-based Dashboards, Portals, Smartphones, etc.
PRIMR for Paper Record Data
Direct ConnectsOracle, jdbc, OPC-HDA, Web Services
Nexus: Data Access, Aggregation & Contextualization
Paper Data Capture Process Databases and Data Warehouses
EBR LIMS CAPA ELN LES

34
3DS
.CO
M/B
IOV
IA ©
Das
saul
tSys
tèm
es| C
onfid
entia
l Inf
orm
atio
n | 1
/5/2
017
| ref
.: 3D
S_D
ocum
ent_
2015
ERP LIMS HIST CAPA MES other
The Manufacturing Data Collection Landscape
Raw MaterialsProcess Step 1
ProcessStep 2
ProcessStep 3
Process Steps…
Final Product
Paper
Records
Data Access, Aggregation & Contextualization

35
3DS
.CO
M/B
IOV
IA ©
Das
saul
tSys
tèm
es| C
onfid
entia
l Inf
orm
atio
n | 1
/5/2
017
| ref
.: 3D
S_D
ocum
ent_
2015
What You Didn’t Have to Do to Understand Your Process
ERP
LIMS
HIST
CAPA
MES
other
Paper
Records
other
other

36
3DS
.CO
M/B
IOV
IA ©
Das
saul
tSys
tèm
es| C
onfid
entia
l Inf
orm
atio
n | 1
/5/2
017
| ref
.: 3D
S_D
ocum
ent_
2015
Spreadsheet Error Rates

37
3DS
.CO
M/B
IOV
IA ©
Das
saul
tSys
tèm
es| C
onfid
entia
l Inf
orm
atio
n | 1
/5/2
017
| ref
.: 3D
S_D
ocum
ent_
2015
Collaborating Across Manufacturing
Process and Quality Organizations

38
3DS
.CO
M/B
IOV
IA ©
Das
saul
tSys
tèm
es| C
onfid
entia
l Inf
orm
atio
n | 1
/5/2
017
| ref
.: 3D
S_D
ocum
ent_
2015
Process Development
AND
Technical Operations
Process Sciences
Process Development
AND
Technical Operations
Process Sciences
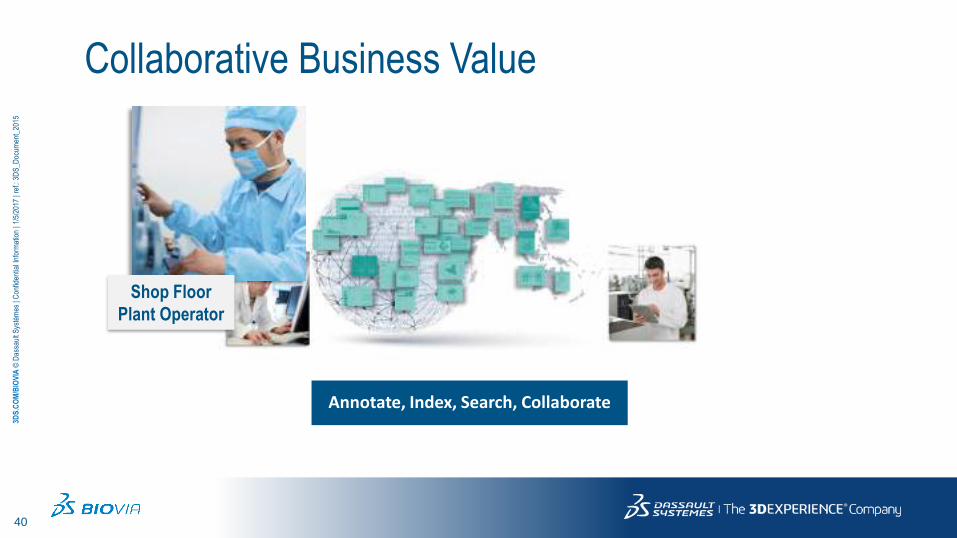
Collaborative Business Value
Annotate, Index, Search, Collaborate

39
3DS
.CO
M/B
IOV
IA ©
Das
saul
tSys
tèm
es| C
onfid
entia
l Inf
orm
atio
n | 1
/5/2
017
| ref
.: 3D
S_D
ocum
ent_
2015
Collaborative Business ValueTechnical Operations and Process Sciences
Create Analytical Results Outputs
40
3DS
.CO
M/B
IOV
IA ©
Das
saul
tSys
tèm
es| C
onfid
entia
l Inf
orm
atio
n | 1
/5/2
017
| ref
.: 3D
S_D
ocum
ent_
2015
Collaborative Business Value
Annotate, Index, Search, Collaborate
Shop Floor
Plant Operator

41
3DS
.CO
M/B
IOV
IA ©
Das
saul
tSys
tèm
es| C
onfid
entia
l Inf
orm
atio
n | 1
/5/2
017
| ref
.: 3D
S_D
ocum
ent_
2015
Collaborative Business Value
Annotate, Index, Search, Collaborate
Lab Tech
Quality

42
3DS
.CO
M/B
IOV
IA ©
Das
saul
tSys
tèm
es| C
onfid
entia
l Inf
orm
atio
n | 1
/5/2
017
| ref
.: 3D
S_D
ocum
ent_
2015
Collaborative Business Value
Annotate, Index, Search, Collaborate
Supervisor
Plant Manager

43
3DS
.CO
M/B
IOV
IA ©
Das
saul
tSys
tèm
es| C
onfid
entia
l Inf
orm
atio
n | 1
/5/2
017
| ref
.: 3D
S_D
ocum
ent_
2015
Collaborative Business Value
Annotate, Index, Search, Collaborate
Ops Exec

44
3DS
.CO
M/B
IOV
IA ©
Das
saul
tSys
tèm
es| C
onfid
entia
l Inf
orm
atio
n | 1
/5/2
017
| ref
.: 3D
S_D
ocum
ent_
2015
Collaborative Business Value
Annotate, Index, Search, Collaborate
Process Scientists Process Scientists
Executives
Lab TechsOperators
Managers
Site 1
Geography A
Site 2
Geography B

45
3DS
.CO
M/B
IOV
IA ©
Das
saul
tSys
tèm
es| C
onfid
entia
l Inf
orm
atio
n | 1
/5/2
017
| ref
.: 3D
S_D
ocum
ent_
2015 Example: Collaboration for Tech Transfer,
Process Improvement, Trusted Reports,
and Submissions

46
3DS
.CO
M/B
IOV
IA ©
Das
saul
tSys
tèm
es| C
onfid
entia
l Inf
orm
atio
n | 1
/5/2
017
| ref
.: 3D
S_D
ocum
ent_
2015
Pharma/Biotech Lifecycle: Overview
Clinical Batch & Clinical Trial
Process Development
Manufacturing Monitoring
SustainableOperations
GTM
Discovery
R&D Batch
Pre-Clinical Batch
Delivery System
Submission to Agencies
Tech Transfer to Manufacturing Operations
Approval to Manufacturing & Marketing
47
3DS
.CO
M/B
IOV
IA ©
Das
saul
tSys
tèm
es| C
onfid
entia
l Inf
orm
atio
n | 1
/5/2
017
| ref
.: 3D
S_D
ocum
ent_
2015
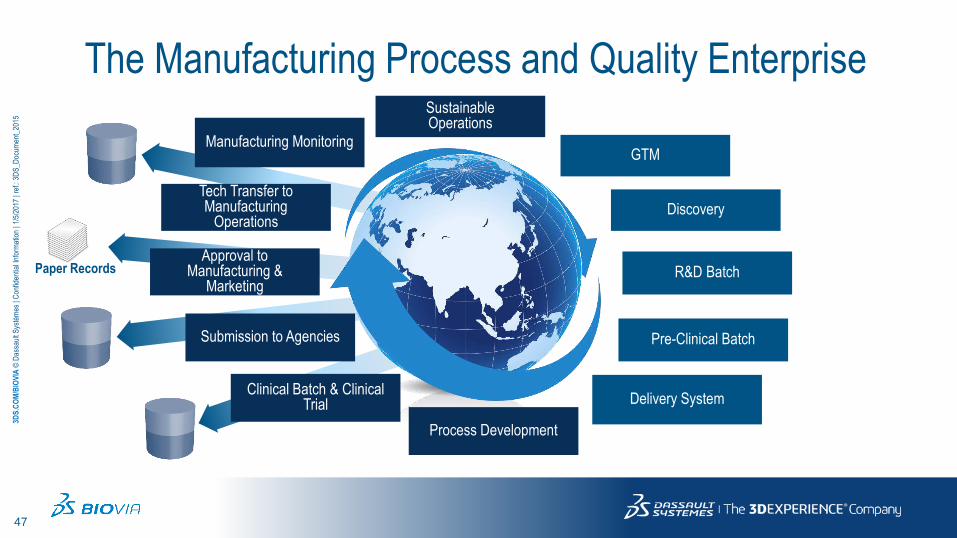
The Manufacturing Process and Quality Enterprise
Clinical Batch & Clinical Trial
Process Development
Manufacturing Monitoring
SustainableOperations
GTM
Discovery
R&D Batch
Pre-Clinical Batch
Delivery System
Submission to Agencies
Tech Transfer to Manufacturing
Operations
Approval to Manufacturing &
MarketingPaper Records

48
3DS
.CO
M/B
IOV
IA ©
Das
saul
tSys
tèm
es| C
onfid
entia
l Inf
orm
atio
n | 1
/5/2
017
| ref
.: 3D
S_D
ocum
ent_
2015
Paper Records
Self-Service Data with Automated Context
Clinical Batch & Clinical Trial
Process Development
Manufacturing Monitoring
SustainableOperations
GTM
Discovery
R&D Batch
Pre-Clinical Batch
Delivery System
Submission to Agencies
Tech Transfer to Manufacturing
Operations
Approval to Manufacturing &
Marketing
49
3DS
.CO
M/B
IOV
IA ©
Das
saul
tSys
tèm
es| C
onfid
entia
l Inf
orm
atio
n | 1
/5/2
017
| ref
.: 3D
S_D
ocum
ent_
2015
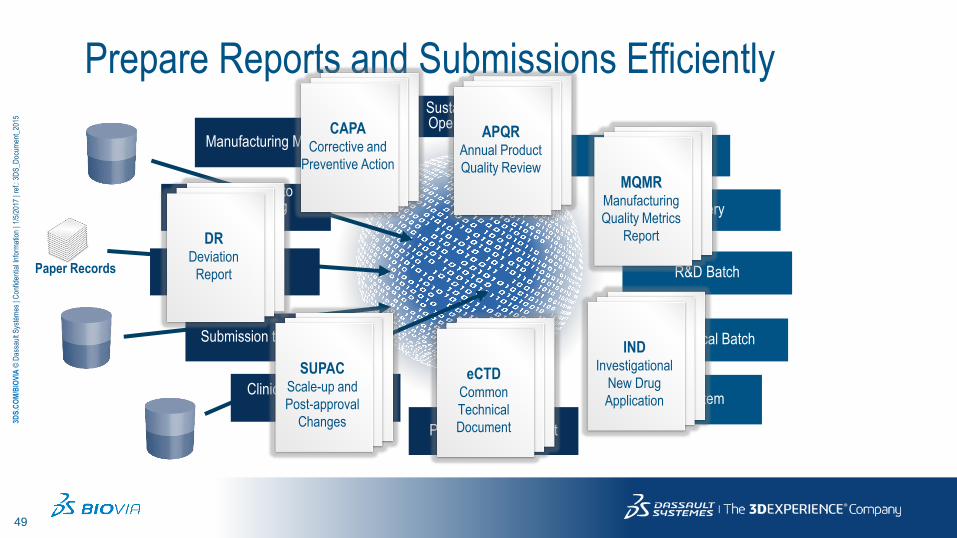
Prepare Reports and Submissions Efficiently
Paper Records
Clinical Batch & Clinical Trial
Process Development
Manufacturing Monitoring
SustainableOperations
GTM
Discovery
R&D Batch
Pre-Clinical Batch
Delivery System
Submission to Agencies
Tech Transfer to Manufacturing
Operations
Approval to Manufacturing &
Marketing
DRDeviation
Report
CAPACorrective and
Preventive Action
APQRAnnual Product
Quality Review
INDInvestigational
New Drug
Application
eCTDCommon
Technical
Document
SUPACScale-up and
Post-approval
Changes
MQMRManufacturing
Quality Metrics
Report

50
3DS
.CO
M/B
IOV
IA ©
Das
saul
tSys
tèm
es| C
onfid
entia
l Inf
orm
atio
n | 1
/5/2
017
| ref
.: 3D
S_D
ocum
ent_
2015
Business Benefits

51
3DS
.CO
M/B
IOV
IA ©
Das
saul
tSys
tèm
es| C
onfid
entia
l Inf
orm
atio
n | 1
/5/2
017
| ref
.: 3D
S_D
ocum
ent_
2015
18% Reduction
Development Studies
Mission criticalfor Product Launch
Tech Transfer Time Reduction
15% Improvement
Site Productivity
87% reduction
Materials Use
95% Reduction
Data Aggregation Time
Process Design Process ImprovementProcess Performance

52
3DS
.CO
M/B
IOV
IA ©
Das
saul
tSys
tèm
es| C
onfid
entia
l Inf
orm
atio
n | 1
/5/2
017
| ref
.: 3D
S_D
ocum
ent_
2015
Batch failures
$20M/year reduction
Batch processing
16% time reduction
Pharma C
Process performance review
90% time reduction
FDA on-site inspection
50% time reduction
Process Design Process ImprovementProcess Performance
53
3DS
.CO
M/B
IOV
IA ©
Das
saul
tSys
tèm
es| C
onfid
entia
l Inf
orm
atio
n | 1
/5/2
017
| ref
.: 3D
S_D
ocum
ent_
2015
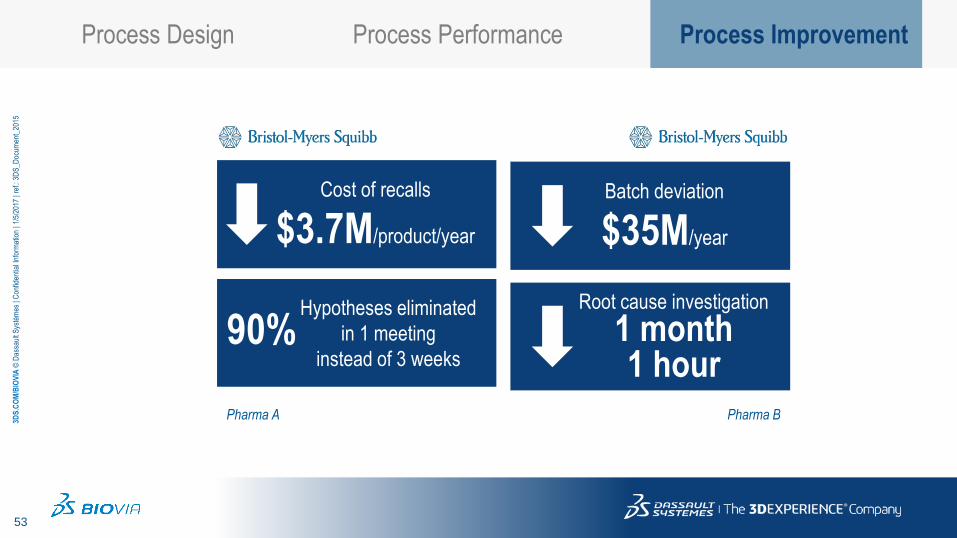
Cost of recalls
$3.7M/product/year
Batch deviation
$35M/year
Root cause investigation
1 month1 hour
90%Hypotheses eliminated
in 1 meeting
instead of 3 weeks
Pharma BPharma A
Process Design Process ImprovementProcess Performance

54
3DS
.CO
M/B
IOV
IA ©
Das
saul
tSys
tèm
es| C
onfid
entia
l Inf
orm
atio
n | 1
/5/2
017
| ref
.: 3D
S_D
ocum
ent_
2015
Questions?
Discussion?