Integrating State Administrative Records to Manage ... · PDF fileIntegrating State...
60
29 Integrating State Administrative Records To Manage Substance Abuse Treatment System Performance TAP 29 Technical Assistance Publication Series U.S. DEPARTMENT OF HEALTH AND HUMAN SERVICES Substance Abuse and Mental Health Services Administration Center for Substance Abuse Treatment www.samhsa.gov
Transcript of Integrating State Administrative Records to Manage ... · PDF fileIntegrating State...
29
Integrating State Administrative Records To Manage Substance Abuse Treatment System Performance
TAP 29 Technical Assistance Publication Series
U.S. DEPARTMENT OF HEALTH AND HUMAN SERVICES Substance Abuse and Mental Health Services Administration Center for Substance Abuse Treatment www.samhsa.gov

Integrating State Administrative Records To Manage Substance Abuse
Treatment System Performance
Technical Assistance Publication (TAP) Series
29
U.S. DEPARTMENT OF HEALTH AND HUMAN SERVICES Substance Abuse and Mental Health Services Administration Center for Substance Abuse Treatment
1 Choke Cherry Road Rockville, MD 20857
Acknowledgments This document was developed for the Substance Abuse and Mental Health Services Administration (SAMHSA), Center for Substance Abuse Treatment (CSAT), under Contract No. 277-00-6400, Task Order No. 277-00-6403—the Performance Management Technical Assistance Coordinating Center (PM TACC). This document adapts and supplements an unpublished manuscript originally prepared by Tracy Leeper, Oklahoma Department of Mental Health and Substance Abuse Services, following the State’s experiences using an integrated-data approach to treatment outcomes monitoring during their CSAT-sponsored Treatment Outcomes and Performance Pilot Studies–Enhancement (TOPPS II) project. A technical advisory group (TAG) convened under the PM TACC contract to suggest modifications to the draft manuscript that would refocus it as a field guide for integrating data on substance abuse clients with other State encounter databases to obtain information on treatment outcomes. We thank the panelists for their vision regarding revised structure and content suggestions (see appendix II for the names of the members of the TAG). Susan Heil, American Institutes for Research (AIR), served as lead author of the revision effort. Dennis Nalty, AIR, and Kevin Campbell (“The Link King”), Washington State Division of Alcohol and Substance Abuse, each provided materials and research for the technical appendix (appendix I). We also acknowledge the input and review by CSAT Project Officers Hal Krause and Rita Vandivort and colleagues from AIR and JBS International, Inc., who staff CSAT’s PM TACC.
Disclaimer The views, opinions, and content of this publication are those of the authors and do not necessarily reflect the views, opinions, or policies of SAMHSA or the U.S. Department of Health and Human Services (DHHS).
Public Domain Notice All material appearing in this report is in the public domain and may be reproduced or copied without permission from SAMHSA. Citation of the source is appreciated. However, this publication may not be reproduced or distributed for a fee without the specific, written authorization of the Office of Communications, SAMHSA, DHHS.
Electronic Access and Copies of Publication This publication may be accessed electronically through the following Internet World Wide Web connection: www.kap.samhsa. gov. For additional free copies of this document, please call SAMHSA’s National Clearinghouse for Alcohol and Drug Information at 1-800-729-6686 or 1-800-487-4889 (TTD) or visit www.ncadi.samhsa.gov.
Recommended Citation Heil, S. K. R., Leeper, T. E., Nalty, D., & Campbell, K. (2007). Integrating State administrative records to manage substance abuse treatment system performance (DHHS Publication No. [SMA] 07-4268). Technical Assistance Publication (TAP) Series 29. Rockville, MD: Center for Substance Abuse Treatment, Substance Abuse and Mental Health Services Administration.
Originating Office Division of State and Community Assistance, Center for Substance Abuse Treatment, Substance Abuse and Mental Health Services Administration, 1 Choke Cherry Road, Rockville, MD 20857.
DHHS Publication No. (SMA) 07-4268 Printed 2007

Contents
Executive Summary . . . . . . . . . . . . . . . . . . . . . . . . . . . . . . . . . . . . . . . . . . . . . . . . . . . . . . v
I. Introduction . . . . . . . . . . . . . . . . . . . . . . . . . . . . . . . . . . . . . . . . . . . . . . . . . . . . . . . . 1
A. Facilitating Performance Management With Integrated Data . . . . . . . . . . . . . . 2
B. State Examples: Using Integrated Data for Performance-Based Decision Making . . . . . . . . . . . . . . . . . . . . . . . . . . . . . . . . . . . . . . . . . . . . . . . . . . . 3
C. Using Integrated Data for Performance Reporting . . . . . . . . . . . . . . . . . . . . . . . . 4
D. Learning From Data-Integration Projects . . . . . . . . . . . . . . . . . . . . . . . . . . . . . . . 5
II. Implementing a Successful Integrated-Data System . . . . . . . . . . . . . . . . . . . . 7
A. Enhance the Quality and Content of Internal Data Sources To Enable Data Linking . . . . . . . . . . . . . . . . . . . . . . . . . . . . . . . . . . . . . . . . . . . . . 7
B. Identify Relevant External Data Sources . . . . . . . . . . . . . . . . . . . . . . . . . . . . . . . 8
C. Facilitate Access to Data by Fostering Cooperative Interagency Relationships . . . . . . . . . . . . . . . . . . . . . . . . . . . . . . . . . . . . . . . . . . . . . . . . . . . . . 11
D. Hire Skilled Staff or Train Existing Staff . . . . . . . . . . . . . . . . . . . . . . . . . . . . . . 14
E. Research Other Cost Requirements . . . . . . . . . . . . . . . . . . . . . . . . . . . . . . . . . . . 16
III. Conclusions . . . . . . . . . . . . . . . . . . . . . . . . . . . . . . . . . . . . . . . . . . . . . . . . . . . . . . . . 17
References . . . . . . . . . . . . . . . . . . . . . . . . . . . . . . . . . . . . . . . . . . . . . . . . . . . . . . . . . . . . . 19
Appendices
I. Technical Appendix on Integrated-Data Topics and Resources . . . . . . . . . . . . . . . . 21
II. Technical Advisory Group Members . . . . . . . . . . . . . . . . . . . . . . . . . . . . . . . . . . . . . 47
III. Metrics for Assessing Effectiveness of Record-Linkage Protocols . . . . . . . . . . . . . . 49
iii

Executive Summary
State agencies collect a variety of information on individuals they serve or encounter, and they maintain official records as a routine part of their operations. Developed under SAMHSA/CSAT Contract No. 277-00-6400 (Task Order No. 277-00-6403), with guidance from a technical advisory group of State/Federal representatives and field researchers (see appendix II), this document describes the utility and practice of integrating the information available in State agency data sets with information on clients of alcohol and other drug abuse (AOD) services. Integration of State agency databases with AOD services data does the following:
• Provides useful insights on effectiveness of treatment services, as measured by client encounters with other agencies after treatment (e.g., criminal justice, employment);
• Arms the State agency for substance abuse with a sustainable repository of information to support decision making and manage the treatment system;
• Enables a wide variety of analyses based on a substantial number of client records to address questions of interest to stakeholders; and
• Provides data in sufficient quantity to support meaningful analyses of outcomes for special populations of interest (e.g., pregnant women, clients receiving Temporary Assistance for Needy Families).
Developing and using integrated data afford the State a readily accessible data repository for answering questions about clients (e.g., demographics, family and social arrangements, substance use), services (e.g., modalities, length of stay, funding source), and outcomes (e.g., treatment completion, employment, arrests). Data-integration efforts by a State can range from one-time linkage of selected data sets to address a particular question of interest to developing a more comprehensive integrated-data system that regularly links AOD data with one or more other agency data sets, stores the collected data, and uses such data to support reporting requirements and systemic decision making. Data-integration strategies can also enhance State efforts to identify unique clients served by the AOD system, because admission data at the encounter level can be matched to itself to detect clients who may have had multiple encounters, have more than one identity within the client-data system, or both.
Several States have actively used information yielded by the integration of AOD services data with other State agency databases to address policy issues; evaluate program-level success; and otherwise aid in management decisions about resource allocation, service expansion, provider effectiveness, and continuous quality improvement. Case examples are provided in this document for both systemic integrated-data projects (e.g., South Carolina’s integrated database, Oklahoma’s extensive performance reporting activities, Washington’s Web-based “treatment analyzer”) and smaller scale studies that used integrated data to obtain information on client outcomes.
Developing the capability to integrate extant State data sources with AOD data is not without cost, especially at the outset. However, at the person level, costs for information yielded by integrated data are a small fraction of the cost for gathering equivalent data by means
v
Integrating State Administrative Records To Manage Substance Abuse Treatment System Performance
of surveys or client interviews (Whalen, Pepitone, Graver, & Busch, 2000). Start-up costs (in time, effort, and procurement) can be relatively high, but maintenance costs are low. Assuming a data system is already in place for routinely collecting client-level data with even a minimal set of client-identifying information (e.g., sex, date of birth), a foundation exists for matching client AOD records to other extant State data sets and using this information as a cost-effective, comprehensive management tool.
This document provides both implementation considerations and technical guidance for developing integrated-data systems to monitor performance and improve service quality. For example, the technical appendix (see appendix I) includes:
• Quick-start resources for cleaning and linking client data (e.g., citations for commercially available and public domain data-linking routines and software);
• Extensive technical discussion of procedures for unduplicating records (or “data deduplication”);
• A walk-through of a data-integration protocol; and
• Discussion of various client identifiers and their discriminating power, sensitivity, and positive predictive power for determining matched record pairs.
The integrated-data repository provides a sustainable decision tool to identify areas for targeted improvement and to evaluate quality improvement over time. In addition, such a system allows the State to address stakeholder questions about service utilization and outcomes across time within a framework that is relatively inexpensive to maintain.
Sustainability of reporting capabilities is increasingly important in light of major Federal initiatives like Access to Recovery (ATR), which requires grantees to capture and report performance data and manage providers with information derived from these data. Through the State Outcomes Monitoring and Management System (SOMMS) and changes to the Substance Abuse Prevention and Treatment Block Grant (SAPT BG) program, SAMHSA will collect a consistent set of performance measures across all of its discretionary and block grant programs under the National Outcome Measures (NOMs) framework, announced by SAMHSA in late 2004. States have agreed to report performance data on the SAPT BG by the FY 2008 application cycle. The move toward increasing performance reporting requirements in the SAPT BG program will require sustained reporting of performance measures in the client outcome domains. Within this context, States will be encouraged to be forward-thinking about their capacity for performance reporting.
Integrating client data with other State-agency administrative records provides one source of information that can be used to support decision making in a performance management framework. As NOMs develops, it may also be a practical methodology for supporting and/or supplementing NOMs requirements. This document provides examples of States’ uses of integrated-data techniques to address questions of interest and provides quick-start guidance on how a State can begin or enhance integrated-data strategies as a decision support tool.
vi

I. Introduction
State agencies collect a variety of information on individuals they serve or encounter, and they maintain official records as a routine part of their operations. These extant data sources provide a rich repository of official and individual-level information on encounters with public and behavioral health services, social services, public assistance, and public safety agencies. Developed under the Performance Management Technical Assistance Coordinating Center (PM TACC), Substance Abuse and Mental Health Services Administration/Center for Substance Abuse Treatment (SAMHSA/CSAT) Contract No. 277-00-6400 (Task Order No. 277-00-6403) and guided by a panel of State and Federal technical advisors and field experts (see appendix II), this document describes the utility of integrating the information available in State agency data sets with information on clients of alcohol and other drug abuse (AOD) services. It is a companion piece to an introductory guide on performance management practices, also developed under the PM TACC contract (Brolin, Seaver, & Nalty, 2004).
In the context of this document, data integration refers to the practice of linking (i.e., matching) diverse, routinely maintained administrative data sets at the client level to obtain a rich picture of client encounters across State agencies. Integration of State agency databases with AOD services data allows States to answer a wide range of questions about clients (e.g., demographics, family and social arrangements, substance abuse), services (e.g., modalities, length of stay, funding source), and outcomes (e.g., treatment completion, employment, arrests). Data-integration strategies can also enhance State efforts to obtain unduplicated counts of clients served, because admission data at the encounter level can be matched to themselves to detect clients who may have had multiple
encounters, have more than one identity within the client data system, or both.
The guidance provided herein is based on the lessons learned from SAMHSA-supported projects that have included a data-integration component. Additionally, input from the technical advisory group and site-visit work with various Single State Authorities (SSAs) by the PM TACC have provided insight into the various concerns, capabilities, and practices with respect to current State data-integration efforts. Guidance is provided in two parts:
(1) A brief discussion (in the body of this document) of administrative and resource considerations surrounding data-integration efforts, primarily intended for SSA administrators and agency managers; and
(2) A detailed technical appendix (appendix I) that includes a description of start-up resources and practical guidance for implementing data-integration strategies, primarily intended for research and analytic personnel at the State agency.
The purpose of this document is to enhance States’ familiarity with using integrated data as a management tool. Case examples illustrating States’ uses of integrated data as a source of decision support are presented throughout to demonstrate the utility of integrated-data systems for evaluating the effectiveness of treatment services, addressing policy issues, identifying areas for quality improvement, and monitoring progress toward service improvements. States do not have to routinely engage in data-linking activities to benefit from the richness that can be afforded by integrating AOD data with other State agency data sets. Even if States do not wish to undertake full-fledged integrated-data systems, the guidance
1

Integrating State Administrative Records To Manage Substance Abuse Treatment System Performance
provided in this document will demonstrate the feasibility and utility of pursuing data in other available data sets to address even one-time research and policy questions through linking these selected data sets with AOD services data.
This document is intended for the SSAs for substance abuse prevention and treatment services, policymakers, treatment providers, and other stakeholders. Taken as a whole, this document can also be an informational tool to be shared with administrators and information systems managers from other State agencies, as an invitation to participate in mutually beneficial data-sharing arrangements. To simplify State pursuit and use of integrated data, SAMHSA itself may want to consider an interagency data-sharing agreement at the Federal level.
The intended impact of this document is to:
• Set into a performance management context the practice of integrating AOD data with other State agency databases as one source of decision support available to States in managing their treatment systems;
• Inform SSAs of the opportunities and requirements of integrated-database strategies;
• Share best practices related to data collection, preparation, linking algorithms, and analyses; and
• Suggest specific resources that can be drawn upon in developing and enhancing State data systems that use integrated data for managing system performance.
The remainder of this section describes: (1) the use of integrated data to support information-based decision making (i.e., performance management), (2) specific case examples illustrating these practices in a small set of States, (3) the possible use of integrated data to address States’ performance reporting requirements, and (4) the context of SAMHSA’s past data-integration projects as foundation for the practical guidance offered in this document.
A. Facilitating Performance Management With Integrated Data
Today’s economic environment mandates cost-effective, performance-driven management. From large corporations, to small nonprofits, to State and Federal agencies, businesses and organizations must do more with fewer dollars and show positive outcomes. Performance management—defined as a process for using data to improve services and outcomes—provides a framework for developing and delivering quality products and services. As used in this document, performance management refers to the process of using performance measures and other data to improve the efficiency and effectiveness of organizations (Landrum & Baker, 2004). Performance measures are quantitative indicators that have been identified by program administrators as valid and reliable measures of program success or program difficulties. A well-structured performance management system can assist program administrators to improve program operations in a number of ways, including allocating and prioritizing resources, informing managers of the need to change particular policies or program directions to meet their objectives, and identifying successful approaches to meet specific program goals (Lichiello, 1999). This document explores the utility and practice of building integrated data into the performance management system by linking State AOD records with administrative records already maintained by other State agencies in order to obtain one source of performance data.
The ultimate goal of the public health performance management process is to use quantifiable data to strengthen the quality of the public health system, thereby improving health outcomes for the public. This process guides decision makers to identify and track health-related benchmarks as well as indicators of the quality of care and appropriate health outcome indicators. When well supported and appropriately implemented, a performance management process can improve the quality of the health care
�
Introduction
system over what might be attained by traditional management methods (Landrum & Baker, 2004). For example, the system can be used to identify areas of exemplary performance, which can lead to sharing information about effective practices. Public accountability is enhanced by ongoing efforts to monitor data to improve services.
Within the substance abuse treatment field, the SSAs are uniquely positioned to infuse performance management throughout the system to improve the quality of services, client satisfaction, and outcomes. Current State data systems provide a foundation on which to build a performance management approach to improving treatment results. Integrating substance abuse treatment data with other State agency data sets allows SSAs to answer an even broader range of key questions from their management, staff, service providers, legislators, service recipients, and public constituents. For example, by integrating AOD, Medicaid, and other data, a State could:
• Identify a sub-group of AOD clients with high utilization of physical health care services;
• Estimate medical care-related cost-savings that might result from increasing AOD services to this target group;
• Decide to expand treatment capacity and utilization of treatment services among this target group;
• Evaluate the impact of that programmatic decision on physical health care utilization and other client outcomes; and
• Share results with stakeholders.
B. State Examples: Using Integrated Data for Performance-Based Decision Making
Provided below are specific, practical examples of how States have used information obtained from the integration of AOD
and other State data to provide decision support for service and resource allocation, provider evaluation and management, quality assurance, and policy evaluation.
• Oklahoma identifies special needs of clients with co-occurring disorders. One application of the State’s outcomes monitoring system was a comparison study of treatment outcomes for clients with mental health, substance abuse, and cooccurring disorders (Moore & Leeper, 2002). Client data were linked with mortality, arrest, incarceration, and employment databases. The study identified only a small number of clients having both a mental health and substance abuse diagnosis, alerting the State to the need to improve its internal data systems for properly identifying clients with a co-occurring illness. Additionally, outcomes analyses revealed a series of issues with implications for clinical services management. First, mortality data indicated a higher rate of suicide among clients with co-occurring illnesses. Raising awareness of this issue could result in targeting suicide prevention or other support services to this group. Clients with co-occurring disorders also earned lower wages and were employed for fewer quarters than mental health or substance abuse clients, suggesting the need for targeting vocational and educational services to improve job readiness.
• Maryland, Oklahoma, and Washington identify posttreatment increases in likelihood of employment and decreased likelihood of posttreatment arrests. Working in collaboration (described in section I.D.), these three States developed common integrated-data collection and analytic frameworks to demonstrate cross-State treatment effectiveness with respect to employment and arrest outcomes (TOPPS II Interstate Cooperative Study Group, 2003, 2006). Studies demonstrating treatment effectiveness can be used to justify requests for additional funding and enhance accountability for services provided.
�
Integrating State Administrative Records To Manage Substance Abuse Treatment System Performance
• California and Washington demonstrate cost offsets for substance abuse treatment. Cost offset data are a powerful force in influencing policy (Krupski, 2004). Database integration supported by California’s CSAT-funded Treatment Outcomes and Performance Pilot Studies–Enhancement (TOPPS II) project facilitated State efforts to determine costs related to posttreatment reductions in criminal justice encounters and increases in employment earnings. The study found a benefit-to-cost ratio of greater than 7 to 1 associated with expenditures for substance abuse treatment over a 9-month period (Ettner et al., 2006). Washington has conducted a variety of cost offset studies that have resulted in the SSA receiving additional funding for effective programs (e.g., Estee & Norlund, 2003; Luchansky & Longhi, 1997). Additional cost offset references are provided in appendix I.
• Washington’s “treatment analyzer” supports performance management at all levels of the State treatment system. Funded through a CSAT State Data Infrastructure grant, the State of Washington has developed a Web-based query and reporting tool, the “treatment analyzer,” which draws on AOD data, employment and wage information, and arrest data to generate reports of aggregate statistics at the State, region, county, and provider levels. Such a tool, accessible by providers and State/local/ regional administrators alike, empowers administrators at all levels of the treatment system to carry out improved quality assurance, program management, and policy planning. The treatment analyzer will expand to include data on convictions and hospital admissions.
• Oklahoma advances performance reporting. The Oklahoma Department of Mental Health and Substance Abuse Services uses multiple methods of integrating data to support decision making by State administrators, providers, and other stakeholders: (1) an annual report card of provider-level performance
indicators; (2) a quarterly summary of regional performance on a set of indicators (modeled on work by the Washington Circle Group); (3) an annual report of long-term indicators (e.g., arrests for driving under the influence, mortality, incarceration, and employment). Monthly reports of performance indicators are supplied to service providers so they can monitor their own performance improvement efforts.
• South Carolina routinely links provider performance to planning and budgeting. The State of South Carolina routinely integrates data sets from numerous health care, social service, and public safety agencies to estimate disease prevalence, define populations of interest, conduct needs assessments, and evaluate outcomes. The SSA for substance abuse has used these data in association with client and provider performance measures to develop a provider performance matrix to assess programs and services of all providers in various performance domains. Once a year, measures are modified and goals established. Data are used as a decision tool for budgeting, planning, and quality improvement.
Bailey (2003) suggests that “leaps of understanding” are possible when State agencies integrate their data, including more comprehensive knowledge of the underlying problems of program participants and the impact of services the program provides. This more comprehensive understanding leads to improved decision making on the part of administrators and policymakers. Data-matching strategies that enable integration of client-level information across data sets can also be used to improve the quality of the SSA’s own AOD service and recipient data. And better reporting and better decision making begin with better data.
C. Using Integrated Data for Performance Reporting
Because data from other State agencies have already been collected for other purposes,
�
Introduction
an integrated-data system is relatively inexpensive to maintain after the initial start-up costs. Sustainability of reporting capabilities is increasingly important in light of major Federal initiatives like the development of National Outcome Measures (NOMs) and collection of these performance data via all discretionary and block grant programs through the State Outcomes Monitoring and Management System. Discretionary programs like Access to Recovery (ATR) are already collecting performance data from grantees that are consistent with the SAMHSA National Outcome Domains (abstinence from drug and alcohol use, employment/education, crime and criminal justice, family and living conditions, social support of recovery, access/capacity, and retention). The ATR program requires grantees to capture and report performance data and manage providers with information derived from those data. In a December 2004 meeting with SAMHSA, States agreed to begin reporting NOMs data as they could do so, as early as the FY 2006 Substance Abuse Prevention and Treatment Block Grant (SAPT BG) application cycle. Full reporting by all States will be in place by the FY 2008 SAPT BG application cycle, supported by a targeted technical assistance mechanism to ensure capability for NOMs reporting across all States in time for the FY 2008 target date. The inclusion of performance reporting requirements in the SAPT BG program will require sustained reporting of performance measures in the seven domains, plus measures of cost-effectiveness, client perception of care, and use of evidence-based practices. Within this context, States would do well to be forward-thinking about their capacity for performance reporting.
D. Learning From Data-Integration Projects
The impetus for this guide comes from the first-hand experiences of several States that have made significant strides in integrating data from disparate sources to provide a more complete picture of mental health and AOD services, costs, and outcomes. A basic
assumption underlying these efforts is that any given data source may provide only a partial answer to questions regarding the costs and outcomes of treatment. Two distinct integration projects illustrate this point.
The Interstate Cooperative Study. The TOPPS II program (1998–2002) supported an initiative to design or enhance State management information systems or outcomes-monitoring systems that would enable assessment of treatment effectiveness and costs for providing treatment services. To provide information about the use of integrated databases for outcome measurement, five State TOPPS II awardees (Maryland, New Jersey, Oklahoma, Virginia, and Washington) formed the Interstate Cooperative Study (ICS) project. These States used similar methods to monitor postdischarge treatment outcomes through the use of integrated-data analyses that linked client information from statewide substance abuse treatment information systems with information extant in other available State agency databases (e.g., employment, criminal justice, and vital statistics). Maryland, Oklahoma, and Washington solely used administrative data to retrospectively study the outcomes of former substance abuse treatment clients; New Jersey and Virginia augmented their collection of primary data with concurrent secondary data in a prospective investigation of client outcomes. The purpose of the ICS project was to encourage States to work together to produce objective, comparable, and feasible measures of the effectiveness of substance abuse treatment.
The States’ experiences with TOPPS II provide specific examples of SSAs that chose to develop systems that rely on the collection and analysis of integrated data. These and other State examples demonstrate the feasibility of creating ongoing, sustainable integrated-data systems; provide other States with tangible models for integrating, analyzing, and using data; and illustrate specific management decisions and guiding questions that have been addressed through the integration of AOD services data with other State
�

Integrating State Administrative Records To Manage Substance Abuse Treatment System Performance
agency data sets. The ICS contributes to the body of knowledge concerning the acquisition of data from State records, algorithms for linking records, and techniques for updating integrated-data systems as new data sources are available.
The Integrated Database project. Another example of fruitful data integration is the Integrated Database (IDB) project. This project—a joint effort of SAMHSA, its contractors, and several States—focuses exclusively on the integration of secondary data sources collected by State agencies for mental health services, substance abuse services, and State Medicaid agencies. These different data sources tend to contain substantial amounts of nonoverlapping information and thus are ideal for contributing to a larger, more detailed picture of service delivery, service costs, and service utilization for co-occurring mental health and substance abuse disorders. AOD and mental health client-level data are collected to track service use and patient characteristics and thus contain rich client information but often little detail on services and costs. If such data are collected, they are often not in an electronic format or standardized across providers and often may not be easily accessible. On the other hand, Medicaid data are collected for adjudication of claims and thus contain detailed information concerning services and costs but little information about clients. Using these data sources to develop such an integrated picture requires the implementation of methods for linking together (i.e., matching) records from independent data sources.
In Phase 1 of the IDB project, a common database was developed integrating these data sources in the States of Delaware, Oklahoma, and Washington. SAMHSA and its contractors built an integrated
database for multiple years of services data (1996–1998), creating the opportunity for both rich analytic data files to address questions about service utilization patterns and for methodological advances in the area of client-level data linking. Under the current phase of the contract, analytic work continues using the original data set, but SAMHSA contractors (Thomson Medstat) have also developed several technical assistance modules to help expand data-integration technologies to other States. Specific TA activities have since been supported in Oklahoma, South Carolina, Wisconsin, and Wyoming.
One goal of the IDB project was to develop the procedures necessary for linking these data in absence of a unique person-level identifier (i.e., unique client ID) across data sources. The IDB project sought to create and teach a model, or framework, that can be used by States for their own data-integration efforts. The IDB project developed data-linkage methods based on existing statistical theories regarding various approaches to linking and provided case studies of data-linking issues and how they were resolved. The IDB also contributed algorithms (and source code for programming in Statistical Analysis Software) for preparing and linking the disparate data sources according to probabilistic methods, as well as detailed descriptions of the logic behind the algorithms.
The lessons learned by the ICS and IDB participants provide the foundation for the practical guidance offered in this document. CSAT and State representatives for each project composed the technical advisory group gathered by CSAT’s PM TACC to collect input on topics relevant to data integration. Tasks central to implementing a successful data-integration system are presented in the next section.
�
II. Implementing a Successful Integrated-Data System
States experienced in the practice of data integration highlight several important tasks in developing and implementing a successful integrated-data system:
• Understand the intricacies, quality, and adequacy of one’s own alcohol and other drug (AOD) client data system for unduplicating records (i.e., data deduplication) and data-linking endeavors;
• Determine the external data sources that best address performance questions of interest;
• Facilitate access to available data while honoring confidentiality and data security concerns;
• Identify staff who know what to do with the data (having the necessary skill sets for data linking and analysis, decision making/ strategic planning, and communication of results to key stakeholders); and
• Be aware of other cost considerations (e.g., hardware, software licensing).
A. Enhance the Quality and Content of Internal Data Sources To Enable Data Linking
Technical advisory group (TAG) members suggested that an important starting place for data-integration efforts is ensuring the quality of the Single State Authority’s (SSA’s) own data, as well as identifying all possible data at the SSA’s disposal. In a six-State study of interagency data sharing, Giordano, Bechamps, and Barry (1998) identified data-quality concerns as a significant barrier to sharing health data across agencies. Data-quality efforts can include automation of data entry, with embedded data-quality checks, to ensure that inaccurate values or impossible
values (e.g., “pregnant male” or a discharge date that precedes the admission date) are not getting into the client data set. Provider training is another technique that can improve the quality of data entry, in addition to incentivizing timely and accurate provider data submissions.
TAG members suggested that efforts be made to identify for the readers of this document the most basic requirements (i.e., the minimal data element set) that AOD data must possess to enable data deduplication (i.e., unduplication of records) and integration efforts that adequately discriminate between valid and false client-record matches.
Most automated data-linkage programs presume that the following data elements are available in both (or all) of the data sets to be deduplicated, clustered, or linked:
• Social Security number (SSN), or at least the last four characters of the SSN;
• Date of birth (DOB);
• First name (or at least some characters or phonetic encoding of first name);
• Last name (or at least some characters or phonetic encoding of last name);
• Gender;
• Middle name or middle initial (though usually may be omitted if necessary);
• Race–ethnicity; and
• Other identifiers to the extent that they exist and are common between or among the data sets.
Performance Management Technical Assistance Coordinating Center (PM TACC) staff has explored the discriminatory power of each of these elements through actual State data
7
Integrating State Administrative Records To Manage Substance Abuse Treatment System Performance
sets, as well as synthetic databases. Detailed descriptions of these efforts and results are presented in section C of the accompanying technical appendix (appendix I). To briefly summarize these findings, the full nine-character SSN, used by itself or in combination with full first name, full last name, and full DOB, provided the greatest discriminating power of all possible client-identifying information. In situations where a full SSN, full first name, full last name, or full DOB is not available, various constructed client IDs can be created using data elements such as the last four digits of the SSN, components of names, DOB or components of DOB, or gender. Although several of the client-data elements are weak discriminators individually, when used in particular combinations, a reasonably discriminative client identifier can be developed. (See appendix I for additional detail.)
For situations in which SSN and names are not available, States can use Probabilistic Population Estimation and Caseload Segregation/Integration Ratio (PPE/CSIR) protocols to estimate the degree of overlap between or among various databases using only DOB and gender (Banks, Pandiani, & Schacht, 1996). PPE/CSIR provides a point estimate (and confidence interval) of the number of unique individuals in common across two or more databases. PPE/CSIR yields less precise shared client estimates than deterministic/probabilistic linkages (further discussed in appendix I) and cannot provide client-specific linkages for detailed analyses of client outcomes, reentry, or risk factors. Nonetheless, PPE/CSIR provides some overlap estimates in situations where SSN and names are not available.
B. Identify Relevant External Data Sources
With the development of emerging national standards as the Substance Abuse and Mental Health Services Administration (SAMHSA) moves toward the National
Outcome Measures (NOMs), States would be well served to develop performance measures and performance management protocols based on those emerging standards. SAMHSA has established the State Outcomes Monitoring and Management System (SOMMS) as the vehicle through which States will report NOMs data. For substance abuse treatment performance measures, SOMMS uses a data framework and reporting mechanism that is already familiar to the States: the Treatment Episode Data Set (TEDS). TEDS is a compilation of data on treatment events (admissions and discharges) routinely collected by States in monitoring their individual State treatment systems and includes, primarily, data on clients admitted to programs receiving public funds. Thirty-seven States were awarded SOMMS funding in January 2006. They will provide enhanced TEDS submissions that will constitute reporting of the substance abuse treatment NOMs, as collected through the SOMMS. For these States, TEDS-required reporting has been modified to include the TEDS admission Minimum Data Set; two extant measures in the TEDS optional admission Supplemental Data Set (i.e., living arrangements, detailed “not in labor force” measure); the entire TEDS Discharge Data Set; a single new admission measure (i.e., arrests in the 30 days prior); and new discharge measures of client change in the NOMs dimensions. Additional measures will be included in the SOMMS reporting requirements as the NOMs developmental measures are finalized. SAMHSA is also working to align the TEDS/SOMMS measures with the performance measures included in the Substance Abuse Prevention and Treatment Block Grant (SAPT BG).
Thus, when selecting performance and outcome measures, States would benefit from starting with Federal standards as in SOMMS, the Federal SAPT BG application, the proposed expansion of TEDS, and SAMHSA’s Government Performance and Results Act measures. Adopting the Federal BG standards is justified because:
�

Implementing a Successful Integrated-Data System
(1) Specific data elements, performance measures, and reporting will be a requirement for various Federal funding purposes;
(2) Federal endorsement of selected measures and protocols provides the backing of subject matter experts who contributed to the development of the various data elements, performance measures, and protocols;
(3) Future discretionary Federal funding projects will require these measures and procedures;
(4) Adoption of a set of measures and protocols based on the Federal standards prevents unnecessary duplication of effort that might develop if the State were to establish one set of reporting protocols for State use and a separate set for Federal use; and
(5) Most States already collect at least some of the data elements in most of the NOMs, given that the domains are based on TEDS.
Sustainability of data reporting in this environment is integral to a State’s ability to thrive and remain accountable for Federal funding. Beyond accountability, it is hoped that States will use the NOMs framework as an opportunity to begin or enhance work on performance-based decision systems that are driven by States’ own needs and goals. Many sources of information provide indications of the effectiveness of treatment and can be linked to client treatment data to obtain outcome information. Although the following review is not exhaustive, it discusses several sources of data for measuring treatment success that have been investigated by States working with integrated data. The first two of these are external data sources that could be tapped administratively through data-linking protocols to meet two of the NOMs. The following data sources were recommended by the TAG as being among the first to pursue when considering an integrated-data system or data-linkage
strategies to inform decision making on a smaller scale:
Criminal justice data. After abstinence from substance use, reduction in criminal behavior as measured by involvement with the criminal justice system may be the most valued indicator of treatment success because it relates directly to public safety and demonstrates a return on investment in treatment. Recidivism is a particularly valuable proxy indicator of treatment outcome for programs targeted at offender populations, such as drug court participants and substance-abuse-related driving offenders. Criminal behavior can be measured using arrest, conviction, incarceration, parole, and probation data sources. These indicators apply to both adults and adolescents, although data for the two groups are often collected by different agencies.
Employment and wage data. Another proven indicator of posttreatment success is employment. Each State has an agency responsible for collecting standardized information on wages and unemployment benefits. Because of this standardization, employment was the first indicator studied by the Interstate Cooperative Study (ICS) States involved with the Treatment Outcomes and Performance Pilot Studies–Enhancement (TOPPS II) study. A consistent finding across three participating ICS States (Maryland, Oklahoma, and Washington), as revealed by administrative data analyses, was that persons who completed treatment were more likely to be employed posttreatment and to have higher wages in the year after treatment than were those who did not complete their prescribed treatment plans (TOPPS II Interstate Cooperative Study Group, 2003). This finding was true despite differences in client populations and treatment delivery systems.
In addition to individual wage information, Oklahoma has also used State income tax returns to study the changes in household income before and after treatment. The results showed a significant increase in household income in the 2 years after
9
Integrating State Administrative Records To Manage Substance Abuse Treatment System Performance
substance abuse treatment, compared to the 2 years before treatment. The State has since ceased to use household income as an indicator of increased economic self-sufficiency because personal wages obtained via employment data were found to be a more sensitive measure.
Public assistance data. The employment rate of substance abuse treatment clients generally increases after treatment, but the average posttreatment wage is still low compared with that of the general population. Wage data can be supplemented with public assistance data (e.g., Technical Assistance for Needy Families (TANF), food stamps, Supplemental Security Income [SSI], Medicaid) to demonstrate additional societal cost savings after treatment. When viewed in tandem, wage and public assistance data show that clients not only are earning an income, they also are less reliant on public assistance (e.g., Wickizer et al., 2000). These findings are important because of public policy designed to move people from public assistance into the labor force.
Data on heath care utilization costs. In addition to providing a measure of public assistance, Medicaid data contain information about physical health care utilization and associated costs. In a comprehensive study conducted by Washington State (Estee & Norlund, 2003), Medicaid data were integrated with AOD-client service data and other data sources to evaluate the State’s SSI Cost Offset Pilot Project. This project targeted funding for assessment and treatment services to the State’s SSI recipients. Medicaid data were used to obtain costs for medical care, community psychiatric hospitalizations, nursing home care, detoxification services, and AOD treatment. The presence of certain medical diagnoses, diagnosis-related groups, procedure codes, and revenue codes in the Medicaid data was also used as one source of indicators of AOD treatment need. The study found that medical costs for SSI recipients who entered into treatment during the 54-month study period were significantly lower ($311 lower per client per month) than
their SSI counterparts who were identified as needing treatment, but not receiving it. State hospital expenses and nursing home care costs were also significantly lower for SSI recipients who needed and entered into treatment, compared to those who needed treatment, but did not receive it ($48 and $56 per client per month, respectively). Cost differences were even greater between SSI clients with unmet needs and their SSI counterparts who not only entered treatment, but stayed in treatment for at least 3 months.
Primary health care costs can also be studied through hospital discharge data sets. Twenty-nine States submitted data for Study Year 2000 of the Healthcare Cost and Utilization Project (Steiner, Elixhauser, & Schnaier, 2002), which is a partnership among Federal agencies, State agencies, and the health care industry to build a standardized, multi-State health data system. It is the largest collection of all-payer, uniform, State-based inpatient and ambulatory surgery administrative data, capturing 80 percent of all U.S. hospital discharges. The data set includes hospital charges, and a toolkit is available for converting charges into estimated costs. SSAs for substance abuse could investigate the availability of information contributed by their respective States for use in linking to data on client treatment outcomes.
Data on use of mental health services. Co-occurring mental illness can strongly affect the outcome of substance abuse treatment. The overlap of treatment needs among substance abuse clients and mental health clients is well documented. It is estimated that one-third of persons with a mental illness will have a substance abuse problem at some time. More than half of all persons with a substance abuse diagnosis have experienced psychiatric symptoms significant enough to fulfill diagnostic criteria for a psychiatric disorder (Regier et al., 1990). An important outcome for substance abuse clients with a dual diagnosis is the recognition and treatment of the mental illness. Thus, data on referral to and use of mental health services provide another viable indicator of treatment success.
10
Implementing a Successful Integrated-Data System
These data also provide an indication of client severity that should be incorporated into risk adjustment analyses (i.e., case mix adjustment) that may be conducted to fairly evaluate the relative effectiveness of providers in treating clients. Maynard, Cox, Krupski, and Stark (1999) looked at the posttreatment reduction in use of inpatient psychiatric services as an outcome of treatment for individuals with co-occurring illness. In the year after discharge from a residential chemical dependency treatment program for individuals with co-occurring disorders, inpatient psychiatric costs decreased significantly (~$1,000 or 15% reduction per client) compared to the year before treatment.
Mortality data. Data obtained from State health departments can be linked with client treatment data to establish whether clients have died in a given posttreatment follow-up period. These data not only comprise a specific negative outcome event (i.e., client death), they also can be used to enhance the accuracy of calculating the frequency and probability of other client outcomes by removing decedents from the appropriate equations.
The technical appendix to this document highlights the technical considerations and minimum data elements needed to reliably link client records across agencies. (See appendix I for this level of detail.)
C. Facilitate Access to Data by Fostering Cooperative Interagency Relationships
States interested in linking client-level AOD records to obtain performance data sometimes find stumbling blocks in the way of gaining access to other State agency databases. There are many reasons why agencies are not willing to share their data, such as confidentiality, “turf” protection, and resource concerns. A 1998 study of data-sharing practices among State government health agencies (defined in the study as health departments and mental health, substance abuse, and Medicaid agencies) found that, in a small six-State sample,
major barriers to data sharing included lack of formal agreements governing the sharing of data (e.g., memoranda of understanding [MOUs]) and actual or perceived confidentiality and regulatory restrictions (Giordano et al., 1998). Facilitators of interagency data sharing included individual relationships among staff at each agency, formal linkages between projects or agencies (e.g., MOUs, grant-related reporting requirements, legal mandates, and common organizational structures), and high data quality.
These barriers to and facilitators of interagency data sharing mirror those shared by the TAG members gathered to advise this document. Establishing collaborative relationships often takes time, persistence, and in some instances legislation. The following are some strategies that the TAG members found to be useful in overcoming data-sharing obstacles.
Use personal contacts and informal agreements. In some cases, it may take only an employee of one agency calling an employee of another to establish an informal agreement to collaborate on data sharing. One State has found it particularly helpful for staff members who know employees at other agencies to make the initial contact, regardless of whether either employee is involved in data services. However, after the initial contact, the persons directly responsible for data management must be committed to participating in data exchange. Even in instances where the agency chief executive agrees to collaborate, the data staff can significantly help or hinder the project.
Address confidentiality concerns head-on. States exploring the option of integrating AOD data with other State administrative databases are often concerned about the potential violations to client confidentiality brought on by using client identifiers to link the data. The current Federal confidentiality laws and regulations concerning information related to substance abuse treatment are found in 42 U.S.C. §§ 290dd-3 and 290ee-3 and 42 Code of Federal Regulations (CFR),
11
Integrating State Administrative Records To Manage Substance Abuse Treatment System Performance
Part 2. According to the Center for Substance Abuse Treatment (CSAT) Treatment Improvement Protocol (TIP) 14, Developing State Outcomes Monitoring Systems for Alcohol and Other Drug Abuse Treatment (Center for Substance Abuse Treatment, 1995), there are two ways in which substance abuse clients can be tracked through health, social welfare, and criminal justice systems without patient consent, depending on whether the SSA has jurisdiction over other databases:
• If the entity conducting the outcomes monitoring is an SSA that operates treatment programs and also has jurisdiction over medical and mental health care, the substance abuse, medical, and mental health care providers under its jurisdiction could disclose the information the SSA needs to conduct outcomes monitoring.
• If the entity conducting the outcomes monitoring is an SSA with jurisdiction solely over substance abuse treatment and satisfies the requirements of 42 CFR Part 2 §2.52 (Research activities) or §2.53 (Audit and evaluation activities), programs can disclose patient-identifying information for entry into and comparison with a database of patients’ names submitted by other providers, if those providers comply with confidentiality requirements.
Another Federal law significantly affecting some States’ abilities to link data sets is Public Law 104-191, the Health Insurance Portability and Accountability Act of 1996 (HIPAA). This law includes provisions covering patients’ rights and protections against the use or disclosure of protected health information (PHI). The final HIPAA privacy rule became effective on April 14, 2001, and as required by HIPAA, most covered entities became compliant with the final rule’s provisions by April 14, 2003. HIPAA requires patient consent before sharing client information, and it permits disclosure of PHI in some cases, such as for oversight of the health care system. States vary in their self-identification as a covered entity under HIPAA, affecting the allowabil
ity and feasibility of using client identifiers to link data.
Several useful documents concerning the use of PHI in research can be found at http://privacyruleandresearch.nih.gov/ research_repositories.asp. A useful comparison of HIPAA and 42 CFR Part 2 confidentiality and privacy issues can be found at http://www.hipaa.samhsa.gov/ Part�ComparisonCleared.htm.
The consistency of the HIPAA and 42 CFR rules with respect to disclosure of PHI is not completely clear to the States, but it appears that both HIPAA and 42 CFR allow for the disclosure of PHI in cases where oversight or management of the health care system is a focus or the activity constitutes audit or evaluation by a regulatory authority or peer review organization. Disclosure of PHI for research purposes also appears allowable under both rulings, if appropriate safeguards such as Institutional Review Board approvals have been obtained.
Additional procedural practices such as business associates agreements, qualified service organization agreements, memoranda of agreement/understanding, and appropriate language in an agency’s informed consent procedures and Notice of Privacy Practices all can help a State agency conduct data-linking projects in compliance with HIPAA and 42 CFR.
Disclosure of de-identified data is also allowable under both rulings. Hashing (encryption) algorithms such as the MD5 algorithm, which encrypt client identifiers such as SSN or DOB, are valuable for enabling data linkage across data sets while protecting the true client identifier values. The shareware algorithm is available at http://userpages. umbc.edu/~mabzug1/cs/md�/md�.html.
Some provisions in the HIPAA–42 CFR crosswalk are open to interpretation. In both the TAG meeting and the April 2005 Integrated Database (IDB) Expert Panel meeting, State representatives suggested that an interagency
1�

Implementing a Successful Integrated-Data System
data-sharing agreement at the Federal level would help alleviate the confusion with respect to the two Federal rules. Giordano et al. (1998) also urged Federal leadership to facilitate State data sharing.
Address data-security concerns head-on. Data confidentiality and security are important factors in convincing other agencies to share information. Rules for transferring and storing data and restrictions on access to and dissemination of the data should be delineated in a data-sharing agreement between participating agencies.
For the ICS States participating in the TOPPS II study, administrative data were received through removable media (tapes, disks, CDs, etc.) and electronic transfer. In addition to dedicated telecommunication lines with point-to-point security, Internet security protocols such as virtual private network, public key infrastructure, and high-level (128-bit) encryption provide means for highly secure transfer of data over the Internet. Despite these improvements in security for electronic data transfer, transporting data via removable media may still be necessary in certain situations, due to incompatibilities between firewall protocols and other system components.
After establishing the data links between and among various databases (and after assigning the new unique ID composed of non-personally identifying information in keeping with PHI requirements in HIPAA), the receiving agency should remove all of the identifier data elements from the original records and store such information in a separate data set with the corresponding new unique identifier. Links back to the original identifiers and demographics can then be made on an as-needed basis for further analysis by a limited set of authorized researchers. In all three of the ICS TOPPS II States, data were stored on a file server with firewall, virus detection, and encryption systems to prevent unauthorized access or corruption of data. In addition, file servers were kept in locked rooms with keyed digital entry. Access
was limited to project staff and system administrators, and each computer required a log-on ID and a password.
Seize the moment. At times, and sometimes serendipitously, a topic of great political interest can be used to gain access to data. In Oklahoma, an entity had to be named in statute to obtain employment data. At that time a drug court bill was being introduced, and the State used the timing to persuade the authors of the bill to add language granting the SSA access to the employment database to conduct a thorough evaluation of the drug courts and other programs.
Offer compensation. Many State agencies lack human and financial resources, placing a logistical burden on those from whom data are requested. Therefore, it is sometimes a welcome offer for the requesting agency to pay the other agency’s costs associated with producing the data. Even if it is not possible to compensate for the total cost of supplying data, paying a nominal fee expresses appreciation for the agency’s cooperation. In one State, a small amount of TOPPS II grant funds was paid to the administrative data source to compensate for computer programming costs related to the initial data compilation. If it is not possible to reimburse the supplying agency, other incentives, such as a product or service, can be provided in exchange for the agency sharing its data. For example, in one State, a laptop computer was purchased and transferred to the other agency in lieu of a monetary payment.
Seek mutually beneficial arrangements. Analyses of the integrated data are often of mutual advantage to both agencies. Most agencies are facing increasing scrutiny of their performance. Collaboration can provide useful data to all participants. For example, one of the ICS States requested TANF data from the State’s Department of Human Services (DHS) to determine whether reliance on public assistance decreased after treatment. At the same time, DHS was purchasing services for substance abuse treatment in order to increase employability among TANF
1�
Integrating State Administrative Records To Manage Substance Abuse Treatment System Performance
clients, and it was also very interested in the effects of treatment. This mutual interest led to more collaboration between the two agencies, including cross-training and other evaluation projects. The collaboration led to a new, full-time analytic position in the SSA being fully funded by the agency supplying the TANF data.
Another State’s statewide arrest database was housed at the State Bureau of Investigation (SBI). Initially, the SBI staff refused to share the data, citing insufficient resources. Soon after, the SBI staff, as a condition of processing and issuing requested gun permits, needed to determine whether an applicant for a gun permit had prior psychiatric inpatient hospitalizations. Under this circumstance, and on completion of appropriate information releases, the SBI was willing to “trade” information.
Use existing opportunities for data sharing. Federal and foundation grants requiring collaboration among agencies may provide the impetus for data sharing to ensure effective coordination of services among agencies. For instance, the U.S. Department of Labor administers Workforce Investment Act funds, which support the development of “one-stop” service centers through which consumers may receive services from multiple agencies. Data sharing among such agencies as a normal course of operations may also make data available for policy analysis and program evaluation.
Use existing infrastructure. The infrastructure of the State can affect its ability to obtain and link data. In both Maryland and Oklahoma, the SSAs are not part of a comprehensive agency with authority over multiple subdivisions. In this circumstance each administrative data source must be identified and approached individually about sharing data, and new relationships must be established with data staff at each agency. In Washington, however, several State agencies are part of the State Department of Health and Human Services. This can facilitate data sharing across agencies. Typically, agencies
that agree to share data must enter into a data-sharing agreement, which defines the reasons the data are being requested, who will have access to the information, what data elements are desired, how the identities of the people involved will be protected, and the rules of redisclosure and reporting. States should investigate the procedures that govern any joint access arrangements in their particular State.
D. Hire Skilled Staff or Train Existing Staff
Recent SAMHSA-sponsored meetings with State staff engaged in integrated-data efforts (e.g., the 2005 State Treatment Needs Assessment Project Conference, the integrated-data TAG established to develop this document, the 2005 IDB Expert Panel meeting), as well as several TA events coordinated by the PM TACC, have echoed common themes with respect to State staffing needs for outcomes monitoring and performance management efforts.
• Should you outsource? States often face hiring freezes, preventing agencies from hiring adequately skilled support for client data monitoring, outcomes measurement, and performance management activities. Outsourcing such tasks may be one option open to the States; however, some States have been left with large knowledge gaps about their own data and data-linking efforts when a specific project is over and the supporting contractors are no longer involved. States generally prefer to retain specialized skill sets in-house (e.g., programmers, analysts, and staff with research training), viewing these staff skills as an integral part of the infrastructure required to do ongoing work. In the face of hiring freezes, some States have found it useful to recruit graduate assistants and interns to assist in the data analysis and programming efforts. In such cases, new staff can be hired (or existing staff transferred) into analysis and
1�
Implementing a Successful Integrated-Data System
data support roles in a phased approach, as the workload makes the need evident and hiring restrictions subside or new dedicated funding is obtained to support such positions. States should develop staff backup and transition plans in case a key data or technology staff member should leave unexpectedly. SSAs can also promote some job sharing and cross-training of mission-critical duties. Documentation of all critical data, analysis, and technology processes and procedures should be maintained.
• How many staff do you need? On recent State site visits, PM TACC consultants have suggested that approximately 15 percent of agency staff should be engaged in performance measurement and performance management activities that may include data-integration efforts.
• How big do you build—now? Staffing needs for data-integration projects are dependent on the scope of the project. Is this just a one-time linking effort of AOD and another data source to address a particular research or policy question, or is the State planning to engage in routine outcomes-monitoring and performance-based decision making using a data warehouse? If so, is the data warehouse supported in-house? Who performs the preparation/cleansing and linking of data sets? The degree of specialization and technical skill needed to perform the linking and analytic functions depends on the extent to which a State opts to rely on automated software packages. Most data-deduplication and data-linking software currently available will accomplish calculation and technical tasks with little or no user intervention. However, a basic understanding of the concepts, protocols, and calculations will provide the user with a more comprehensive understanding of the methods, options, and results from such analyses. Further discussion of automated software options is presented in the technical appendix (appendix I).
• What technical skills do you need? Data-analysis steps beyond the actual deduplication and linking stages managed by available software (e.g., patterns of client overlap, patterns of service re-entry, detailed cross-tabulations of common clients, and risk factor analyses) will require some basic database skills (query skills, at the minimum) in whichever data structures the user prefers. Almost all datadeduplication and data-linking programs allow the user to export (and import) data to and from Access, SAS, SPSS, Excel, and text files. As noted previously, staff should also include analysts and those skilled in research methods and data interpretation.
• How can you supplement/edify your staff’s skills? To the extent that specialized expertise is not currently represented within a State, SSAs can use resources such as technical assistance from SAMHSA to develop the needed skill base, transferring knowledge from expert consultants to State staff who will routinely pick up these duties.
• How much staff time is required by data-linking projects? Analytic time (start-to-finish) for linking client AOD data with other data sets will depend on extant familiarity and history with the data sets to be linked, use of a data-linkage program, the quality of the data, the need for manual inspection of linked records, and the size of the data sets. A start-to-finish example of data linking for client arrest required linking 344,730 client service episode records with 593,613 arrest episode records. This analysis was completed in 3 full days by using a public domain data-linking product. It should be noted that most software packages allow “batch processing,” in which the user can make some initial selections and then set the deduplication or linkage program to run certain steps automatically (e.g., during lunch, during a meeting, or overnight).
1�
Integrating State Administrative Records To Manage Substance Abuse Treatment System Performance
E. Research Other Cost Requirements
Hardware requirements and costs can range from modest to substantial, depending on the need to house equipment such as dedicated servers for analysis and data warehousing. For analytic tasks described in the technical appendix example discussed above, hardware requirements were minimal: analyses ran on a desktop Windows PC with a 3 GHz single CPU with 2 GB memory and a 75 GB
hard drive (of which approximately 35–45 GB should be available for the analysis).
Software costs will vary—commercial data-linking software can range from $300 to more than $100,000. There are also public domain algorithms and products that are freely available. Some may require licensing fees for other software used by the linking algorithms. (See section A of appendix I for more information about commercial and public domain products for data deduplication and data linking.).
1�
III. Conclusions
The integrated-data repository provides a sustainable decision tool for identifying areas for targeted improvement and monitoring progress toward quality improvement goals. In addition, such a system allows the State to address stakeholder questions about service utilization and outcomes across time within a framework that is relatively inexpensive to maintain after the initial start-up costs. Sustainability of reporting capabilities is increasingly important in light of increasing public scrutiny, such as the Federal initiatives and increased local stakeholder interest previously mentioned. Linking extant data sets is an efficient and effective approach to meeting these reporting demands. Federal and State efforts like the Integrated Database (IDB) and Treatment Outcomes Performance Pilot Studies–Enhancement (TOPPS II) can be used as a foundation for improving State proficiency in outcomes monitoring and data-linking practices. Additional and broader Federal interagency data-sharing agreements should be developed to alleviate some of the
confusion surrounding Federal confidentiality rulings of the Health Insurance Portability and Accountability Act of 1996 and 42 Code of Federal Regulations Part 2.
In addition to sharing information through forums such as the technical advisory group that advised the development of this document, States already experienced in data-linking strategies have generally expressed willingness to provide peer-topeer technical assistance and other forms of support (e.g., sharing written interagency agreements; data analysis techniques; and matching algorithms, programs, and software) to assist other States in their exploration of administrative data as a performance management resource. States are encouraged to take advantage of technical assistance opportunities using these peer-based skills that could be supported by the Substance Abuse and Mental Health Services Administration/ Center for Substance Abuse Treatment.
17

References
Bailey, W. P. (2003). Integrated state data systems: Tools for monitoring the health care safety net. Rockville, MD: Agency for Healthcare Research and Quality. http://www.ahrq.gov/data/safetynet/ bailey.htm
Banks, S., Pandiani, J., & Schacht, L. M. (1996). The probabilistic population estimator applied to estimating statewide mental health and corrections community and institutional caseload size, overlap, and outcomes. Presented at the National Conference on Mental Health Statistics, Washington, DC.
Brolin, M., Seaver, C., & Nalty, D. (2004). Performance management: Improving State systems through information-based decision-making (DHHS Publication No. [SMA] 05-3983). Rockville, MD: Center for Substance Abuse Treatment, Substance Abuse and Mental Health Services Administration.
Center for Substance Abuse Treatment. (1995). Developing State outcomes monitoring systems for alcohol and other drug abuse treatment. Treatment Improvement Protocol #14 (DHHS Publication No. [SMA] 95-3021). Rockville, MD: Substance Abuse and Mental Health Services Administration.
Estee, S., & Norlund, D. J. (2003). Washington State Supplemental Security Income (SSI) Cost Offset Pilot Project: 2002 progress report. Olympia, WA: Washington State Department of Social and Health Services.
Ettner, S. L., Huang, D., Evans, E., Ash, D. R., Hardy, M., Jourbachi, M., & Hser, Y. I. (2006). Benefit-cost in the California treatment outcome project: Does substance abuse treatment “pay for itself”? Health Services Research, 41(1), 192–213.
State governmental health agencies. Washington, DC: U.S. Department of Health and Human Services, Office of Disease Prevention and Health Promotion.
Giordano, L., Bechamps, M., & Barry, M. (1998). Examining data sharing among
Krupski, A. (2004). Using data to foster quality improvement in Washington State. Presented to the Academy Health Annual Research Meeting, San Diego, CA.
Landrum, L. B., & Baker, S. L. (2004). Managing complex systems: Performance management in public health. Journal of Public Health Management & Practice, 10(1), 13–18.
Lichiello, P. (1999). Guidebook for performance measurement. Seattle, WA: Turning Point National Program Office.
Luchansky, B. & Longhi, D. (1997). Cost savings in Medicaid medical expenses: An outcome of publicly funded chemical dependency treatment in Washington State. Olympia, WA: Washington State Department of Social and Health Services.
Maynard, C., Cox, G. B., Krupski, A., & Stark, K. (1999). Utilization of services for mentally ill chemically abusing patients discharged from residential treatment. Journal of Behavioral Health Services and Research, 26, 219–228.
Moore, B., & Leeper, T. (2002). Outcomes of persons with co-occurring conditions compared to those with substance abuse only and mental health illness only. Presented to the Final Meeting of TOPPS II Grantees, Bethesda, MD.
Regier, D. A., Farmer, M. E., Rae, D. S., Locke, B. Z., Keith, S. J., Judd, L. L., & Goodwin, F. K. (1990). Comorbidity of mental disorders with alcohol and other drug abuse: Results from the Epidemiological Catchment Area (ECA) study. Journal of the American Medical Association, 264(19), 2511–2518.
19

Integrating State Administrative Records To Manage Substance Abuse Treatment System Performance
Steiner, C., Elixhauser, A., & Schnaier, J. (2002). The healthcare cost and utilization project: An overview. Effective Clinical Practice, 5(3), 143–151.
TOPPS II Interstate Cooperative Study Group. (2003). Drug treatment completion and post-discharge employment in the TOPPS II Interstate Cooperative Study. Journal of Substance Abuse Treatment, 25, 9–18.
TOPPS II Interstate Cooperative Study Group. (2006). Drug treatment completion and post-discharge arrest in the TOPPS-II Interstate Cooperative Study. Submitted.
Whalen, D., Pepitone, A., Graver, L., & Busch, J. D. (2000). Linking client records from substance abuse, mental health and Medicaid state agencies (DHHS Publication No. [SMA] 01-3500). Rockville, MD: Center for Substance Abuse Treatment and Center for Mental Health Services, Substance Abuse and Mental Health Services Administration.
Wickizer, T. M., Campbell, K., Krupski, A., & Stark, K. D. (2000). Employment outcomes among AFDC recipients treated for substance abuse in Washington State. The Milbank Quarterly, 78(4), 585–608.
�0

Appendix I. Technical Appendix on Integrated-Data Topics and Resources
State agency personnel interested in adopting integrated-data approaches often have questions about issues such as how to “sell” the investment of time, staff, political, and financial resources to start such a practice; what data are needed (at minimum) to develop effective linking protocols; what software packages and linking resources are available to help a State get started; and the general steps involved in data-linking protocols.
Over the last several years, the availability of user-friendly, low-cost, or public domain software has dramatically reduced the cost and technical barriers to effective State use of data-deduplication and data-linking routines. (Note: Many current software programs refer to the unduplication of individual records as “deduplication”; thus, the authors use “deduplication” as the label for this activity, although we acknowledge that others in the field call this “unduplication.”) As a result, States can now use such software programs for unique client counts and client outcome analyses that were simply not feasible for the average State agency just a few years ago.
The intent of this technical appendix is to jump-start States’ ability to begin data deduplication and data linking. Using many practical examples, recommendations, resources, and protocols, it aims to move the reader quickly from an abstract understanding to a more practical grasp of the procedures and capabilities of data deduplication and data linking. This appendix is intended to be as tangibly useful as possible, with detailed discussion of the steps involved; practical, example-based descriptions of most of the key terminology and protocols used in data deduplication and data linking; hints on procedures; and lessons learned.
Some calculation examples are included, but just enough to give the reader a basic understanding. Most data-deduplication and data-linking software currently available will accomplish all of the calculations and most of the technical tasks with little or no user intervention. However, a basic understanding of the concepts, protocols, and calculations will provide the user with a more comprehensive understanding of the methods, options, and results from such analyses.
The primary audience for this technical appendix is data analysis and research staff at State agencies. Agency directors, treatment directors, and policy, planning, and legislative directors may find it useful on a cursory-review basis.
A. Quick-Start Resources: Data-Deduplication and Data-Linking Software and Algorithms
Although the costs of automated data-linking software were once prohibitive, several good programs are now either affordable or free and require minimal technical skills to operate them effectively. A recent report (detailed below) by the California Health Care Foundation (CHCF) describes a number of commercial record-linkage programs ranging in price from $350 to $11,000 (Jones & Sujansky, 2004). The CHCF, however, did not evaluate the performance of the software reviewed, citing a lack of a widely accepted method to evaluate how well this type of tool performs. An extensive list of currently available record-linkage and deduplication software can be found at a comprehensive Web site sponsored by the Australian National University Data Mining Group (URL http://datamining. anu.edu.au/projects/linkage-links.html).
�1
Integrating State Administrative Records To Manage Substance Abuse Treatment System Performance
An extensive literature and Internet search identified two public domain applications for record linkage and deduplication: The Link King and Link Plus. Particular attention is given to these products for the practical reasons that these products are sophisticated, public domain applications that are readily available for potential users to evaluate.
Other public domain solutions (Wajda, Roos, Layefsky, & Singleton, 1991), including the Substance Abuse and Mental Health Services Administration’s (SAMHSA’s) Integrated Database (IDB) project’s linking protocols, are also available in a series of macros (i.e., sample programming code) rather than a fully developed application. Adaptation of these macros to a given agency’s particular needs would require an experienced programmer.
The software packages identified below can vary in the details and sophistication of the data preparation stage, the record screening stage, or the emphasis on deterministic linking, probabilistic linking, or a combination thereof. Persons and entities interested in developing data-deduplication and data-linking capacities should review the Web sites for the various products listed above and select the product that best suits their needs and budget.
Public domain software for record linkage and deduplication
The Link King is a public domain deduplication and linkage program developed by Washington State’s Division of Alcohol and Substance Abuse (DASA). Portions of The Link King protocol were adapted from algorithms developed by Thomson Medstat for the SAMHSA IDB project. The URL for The Link King site is http://the-link-king.com. The Link King requires a SAS license but no SAS programming experience. Features include a data importing and formatting wizard, artificial intelligence to determine appropriate linking protocols, an interface for manual review of “uncertain” record pair matches,
and an ability to generate random samples of record matches to allow for validation of matched pairs.
Link Plus is a public domain probabilistic record-linkage program developed at the Centers for Disease Control and Prevention’s (CDC’s) Division of Cancer Prevention and Control in support of the CDC’s National Program of Cancer Registries. It is an easy-to-use, stand-alone, Microsoft Windows-based application that can be used to either detect duplicates in a database or to link two administrative data set files. (URL http://www.cdc. gov/cancer/npcr/tools/registryplus/lp.htm).
Commercial software for record linkage and deduplication
An independent review of relatively low-cost commercially available client data-matching software (Jones & Sujansky, 2004) from the CHCF is available at http://www. chcf.org/documents/ihealth/ PatientDataMatchingBuyersGuide.pdf. Using decision criteria provided by five California health care organizations that integrate patient data into clinical data repositories, the authors screened various stand-alone commercial patient-matching tools to determine cost-effective products that can assist small- to medium-sized provider organizations in developing clinical data repositories for the purposes of quality measurement and quality improvement. Decision criteria included the following:
• Ease of use;
• Availability for hands-on evaluation;
• Availability on a desktop platform;
• Use of advanced matching algorithms;
• Ability to match on parameters other than names and addresses;
• Ability to export findings to other programs for subsequent processing; and
• Total cost of ownership not exceeding $50,000.
��
The authors identified four products that met the above criteria: LinkageWiz, Data set V, SureMatch, and DeDupe�Excel. Costs of the products ranged from $350 to $11,000. The authors recommended all but DeDupe4Excel as viable candidates for the patient-matching needs of most providers, as this product is limited to processing 64,000 records at a time and may be better suited to very small providers. In general, each of the tools follows a similar sequencing of steps involved in data integration: import data, prepare data for field-by-field comparison, specify match weights for each demographic field, run various matching algorithms that produce scores for evaluating likelihood of a matched pair, display actual and possible matches for manual inspection, and export matched records for further processing. (See the review at http:// www.chcf.org/documents/ihealth/ PatientDataMatchingBuyersGuide.pdf for detailed descriptions of each of these products.)
Public-domain SAS macros for record linkage and deduplication
SAMHSA IDB project linking protocols are described in the technical monograph for the IDB project. The monograph (Whalen et al., 2000) and linking routines are available on the SAMHSA Web site at the following URL: http://www.csat.samhsa.gov/IDBSE/ idb/modules/linking/recordlink.aspx. Data-linking protocols for the IDB project are written in SAS code. SAS routines are included for data-deduplication and linking algorithms. The IDB project is a joint effort of SAMHSA, its contractors, and several States, focusing exclusively on the integration of administrative data maintained by State agencies for mental health services, substance abuse services, and State Medicaid agencies.
It is beyond the scope of this appendix to address any one of these products or tools in
Appendix I
extensive detail. The intent of this section is to provide the interested SSA with a shortcut to several readily available resources and products that could facilitate data-integration efforts.
Section references
Jones, L., & Sujansky, W. (2004). Patient data matching software: A buyer’s guide for the budget conscious. Oakland, CA: California Health Care Foundation.
Wajda, A., Roos, L., Layefsky, M., & Singleton, J. (1991). Record linkage strategies: Part II. Portable software and deterministic matching. Methods of Information in Medicine, 30, 210–14.
Whalen, D., Pepitone, A., Graver, L., & Busch, J. D. (2000). Linking client records from substance abuse, mental health and Medicaid State agencies (SAMHSA Publication No. [SMA] 01-3500). Rockville, MD: Center for Substance Abuse Treatment and Center for Mental Health Services, Substance Abuse and Mental Health Services Administration.
B. Data-Deduplication and Data-Linking Protocols
Data-deduplication and data-linking software packages may vary in the particular protocols used to determine whether any two records (within or across data sets) represent the same unique individual. However, most software approaches to deduplication and linking follow a core set of sequential steps: data preparation, record screening (blocking), assessment of similarity for each client identifier, record comparisons (deterministic, probabilistic, or both), record comparison review (i.e., manual review), and output of the final set of records for uniquely identified linked clients. This section of the appendix provides a walkthrough of the various technical considerations involved at each step.
��
Integrating State Administrative Records To Manage Substance Abuse Treatment System Performance
Step 1: Data preparation
Cleaning and preparing client treatment and administrative databases are vital for the linking and analysis of the databases. To enable reliable linking, the identifying fields must be formatted identically (e.g., removing dashes or spaces from Social Security numbers [SSNs], removing extra characters like hyphens and apostrophes from the name fields). Often, all text fields are converted to only uppercase letters. Certain fields stored in “numeric” format in the input data sets may require conversion to “text” or “character” fields (or the converse). All date fields are generally converted to a single format, such as YYYYMMDD. Most of such “low level” formatting is accomplished automatically by the software routines. Considerations and common sources of errors across data sets for client-identifying data fields are discussed below.
Name fields. In health and social services databases, the same individual may have multiple service records with discrepant first name, last name, and middle name fields. Many name discrepancies are due to name changes and can be addressed by alias fields. State data sets often include multiple alias name fields for first names, nicknames, last names, maiden names, married names, criminal alias names, and so on. Alias fields are valuable for record matching. For example, females’ last names often change with marriage or divorce. Names can also change through adoption or personal preference. Many State data sets include three to six alias fields for first name and for last name, all of which are considered by the matching protocol either during the data preparation stage or during the linking algorithm, or both. Other name discrepancies include the unavoidable character-bycharacter typographical errors, character transpositions, dropped characters, added characters, nicknames (e.g., Bob vs. Robert), transpositions of first and middle names, transpositions of middle and last names, homonym names (e.g., Gene and Jean), embedded names (e.g., Jo Anne vs. Joanne), hyphenated names (e.g., Zeta vs. Zeta-Jones vs. Jones),
and names composed of two or more words (e.g., De La Rosa and Running Deer). Datadeduplication and data-linking software typically will assess whether name discrepancies across database records might be due to reasons such as the above and, if so, will consider such records as representing the same unique individual.
Social Security number field. In health and social services databases, the same individual may have multiple service records with discrepant SSNs. Such discrepancies can occur because of simple character-bycharacter typographical errors, the clinician having heard the SSN incorrectly or written it incorrectly, the client having been confused and not remembering his or her exact SSN, transcription errors (e.g., 1s look like 7s, 3s look like 8s), transpositions (e.g., 92 vs. 29), and provision of deliberately bogus SSNs by some clients (especially criminal justice clients). Many service agencies do not require that the client present a verifiable social security number (e.g., SSN card, payroll stub with SSN). For all these reasons, the same individual may have more than one putative SSN within and across databases and across providers over time. During the data preparation stage, most data-linking programs will attempt to identify all the potential discrepant SSNs that may in fact belong to the same individual. Data-deduplication and data-linking programs cannot determine which of the multiple SSNs for a given individual is the “correct” SSN, but they can identify clusters of SSNs that may represent the same person and use such information to effect a record match that may otherwise be missed.
Date of birth fields. The date of birth (DOB) for a given individual can be discrepant within and across databases over time. In addition to the usual typographical and transcription errors, the MM and DD fields are frequently transposed (e.g., civilian dates vs. military dates), clients may shave a year off their age (i.e., add a year to DOB), or clients may deliberately provide bogus DOBs. Algorithms may be constructed to allow for such variations in the order and accuracy
��

of month, day, and year fields in providing weights for field matches on DOB.
Gender field. Gender is usually reliably coded, except for occasional typographical errors (e.g., a data entry error of “1” versus “2”). In some situations, a clinician or data entry staffer may incorrectly presume a client’s gender, especially for persons with gender-neutral or gender-ambiguous first names (e.g., Shannon, Chris, Lynn, Pat, Sandy, Casey, Frankie, Bobbie, Billie, Jessie).
Race–ethnicity fields. For many reasons, a given person’s coded race–ethnicity can be discrepant within and across databases: A person may change his or her self-identified racial or ethnic group over time, persons with mixed racial–ethnicity heritage may select different racial–ethnicity labels over time, clinicians may code (and miscode) their impressions of a client’s race–ethnicity without asking the client, different databases may use different race–ethnicity codes that must be crosswalked prior to linking, the same data set may change the available race– ethnicity response codes over time, and clients and staff often confuse race and ethnicity (resulting in inconsistent coding of persons as White vs. Hispanic, Asian vs. White, etc.). A moderate amount of inconsistent coding is to be expected on race–ethnicity. For this reason, race–ethnicity is not a particularly good linking variable.
Data field coding and crosswalk prepa-ration. Different databases (and even the same database over time) may code similar fields using different values. For example, one database may code gender using 1 = male, 2 = female. Another database may code gender using M = male, F = female. Race–ethnicity is often coded in different ways across databases. Phone numbers and addresses may have different formatting across data sets. Prior to deduplication or linking, all such coding schemes for the identifying data elements must be defined, recoded, or cross-walked to a common set of categorical labels and formats. Other data fields (such as employment status, living arrangements, and
Appendix I
income) are not likely to be data-linking fields but may be fields used in the subsequent analysis of the linked data sets. The coding structure and formatting for these analysis fields could be recorded, crosswalked, and scrubbed at this stage as well.
Step 2: “Blocking” data to be linked/ deduplicated
The central process in any data-linking protocol is “record pair” comparisons (RPCs). “Record pairs” refer to two sets of client-identifying information that are being evaluated to determine if they refer to the same individual. The following is an example of a “record pair”:
Tony Dorsey Hutchison 869-93-2927 12-03-1971 White Male
Tim Dorsey Hutcheson 869-93-2935 03-12-1971 White Male
As detailed below, the number of potential RPCs can be quite large.
Example 1: Assume your State admits 40,000 clients to services per year. If you wanted to determine the total number of unique AOD treatment clients who were admitted to services by any provider in the State during a particular 12-month period, you would potentially compare all 40,000 admission records to each other to identify the clients who had more than one admission anywhere in the State during that period. This would theoretically result in 799,980,000 RPCs (the number of unique combinations of 40,000 items taken 2 at a time).
Example 2: Match those same 40,000 AOD treatment clients against a hypothetical arrest database of 60,000 records to determine the number of AOD clients with an arrest in the year after discharge from treatment. This would yield between 2.4 billion and 5 billion potential RPCs (depending on whether or not AOD treatment clients and/or the arrest data set were unduplicated as part of the process).
Detailed comparisons of such large numbers of RPCs are unnecessary because the vast majority of the theoretical number of RPCs
��
MGNB7MWC
Integrating State Administrative Records To Manage Substance Abuse Treatment System Performance
will be between records that are clearly different people and do not need any sophisticated probabilistic comparisons to arrive at that decision.
For example:
Marcus Michael Cole 633-55-5907 5-18-1952 Black Male
Lisa Marvin McKnight 780-71-8023 11-26-1971 White Female
are records from clearly different individuals and the user does not need to spend any additional efforts comparing these records to determine if they represent the same individual.
However, other potential record comparisons may clearly be the same person or may be similar enough to warrant additional analysis to help determine whether these records represent the same individual. The following records:
Tony Dorsey Hutchison 869-93-2927 12-03-1971 White Male
Tim Dorsey Hutcheson 869-93-2935 03-12-1971 White Male
might represent the same individual, and additional analysis will be required to quantify the likelihood that these two records represent the same person.
Deduplication and data-linking protocols provide various methods to screen-in only those RPCs worthy of additional analysis (and screen-out the large number of RPCs that are clearly “non-matches”). The screening procedure used in record-linkage and deduplication software is called “blocking.” Blocking involves quickly screening (electronically) all the RPCs that have a sufficient number of features in common to warrant more detailed review. All RPCs not meeting these “screen-in” criteria are considered automatic “non-matches” and are not analyzed any further. In many datadeduplication and data-linking projects, these blocking protocols remove from further analysis 95–99 percent or more of all the possible RPCs.
Various software packages provide differing approaches to blocking. Some software packages may employ only a few screen-in criteria; other packages may employ 25 or
��
more screen-in criteria. Even within a single software package, the user may be able to select from among various protocols and options and determine the number of RPCs that would be screened in for further analysis. As an example of blocking criteria, SAMHSA IDB project linking protocols “block” records if any one of the following four conditions are met:
1. SSNs match;
2. Last names match (based on a phonetic equivalence algorithm) and birthdates match;
3. First names match (based on phonetic equivalence algorithm), birthdates match, and there is a match on gender; or
4. Both the first name and last name fields match (based on phonetic equivalence algorithm), and there is a match on gender.
As a result of the blocking procedure(s), only the much smaller pool of RPCs that have some potential to represent the same person are retained for further analysis. Only these RPCs are candidates for additional “match”/ “no match” analysis.
Step 3: Comparison of client-identifying data fields
Once the data have been blocked, each record pair under comparison can be assessed in terms of the similarity of the linking data elements (i.e., the client-identifying data fields). For example, consider the following record pair:
Record A—Mary Johnson SSN = 984-65-3478 DOB = 11-20-1965
Record B—Marie Johnston SSN = 984-65-4487 DOB = 11-02-1966
Most data-deduplication and data-linking programs can measure and quantify how similar or dissimilar “Mary” is to “Marie,” “Johnson” is to “Johnston,” “984-65-3478” is to “984-65-4487,” and “11-20-1965” is to “11-02-1966.” Approximate String Matching (ASM), phonetic equivalence algorithms, and
Appendix I
related measures provide a quantification of the degree of similarity “agreement” or “disagreement” for these data elements.
Name similarity. Name similarity is determined through application of ASM and phonetic equivalence algorithms. ASM (used by SAMHSA’s IDB linking protocols and The Link King) is a continuous comparison that calculates the percentage of agreement between two strings. The methodology subtracts the number of additions, deletions, and changes necessary to “force” complete agreement in the strings, divided by the length of the longer string from 1 (Landau & Vishkin, 1989). For example, approximate string matching of the names “Gilford” and “Guilford” requires either the addition of a “u” to “Gilford,” or the deletion of “u” from “Guilford.” The methodology subtracts 1 divided by 8 (the length of “Guilford”) from 1, with the result of 0.875. In other words, there is an 87.5 percent agreement between “Gilford” and “Guilford.” To prevent misleading results, in the IDB protocols, string comparisons showing less than 70 percent agreement were reclassified as “disagreements” (Whalen et al., 2000).
Almost all data-deduplication and data-linking protocols will assess whether any two names under comparison “sound alike” using various phonetic equivalence algorithms. The most commonly used phonetic algorithms are NYSIIS (New York State Identification and Intelligence System) and Soundex. For example, consider the first names Katrina and Catreena. Under the NYSIIS phonetic coding scheme, KATRINA is “phonetically” coded as CATRAN and CATREENA is coded as CATRAN as well, suggesting a potential match. Soundex encoded names consist of a letter and three numbers. Under Soundex, D’ANGELO is coded as D524 and DEANGELIS is coded as D524, suggesting a potential match. Note: NYSIIS and Soundex have multiple versions that can result in slightly different coding. NYSIIS is a more sophisticated phonetic equivalence algorithm than Soundex. Other software packages use
other phonetic encoding algorithms such as Metaphone and Double Metaphone.
Some data-deduplication and data-linking software will assess all name comparisons for nickname status (e.g., William vs. Bill, Regina vs. Gina) and common misspellings (Charles vs. Chrales) and will flag such comparisons as potential name matches worthy of further review. Some software packages provide basic nickname and misspelling tables that the user can update over time.
At this stage, most software will also assess whether any two records under review contain embedded names (i.e., one of the names is fully embedded within the other, as in Mary vs. Maryanne), hyphenated names (Zeta vs. Zeta-Jones), names composed of two or more words (De La Rosa vs. Delarosa), swapped names (Douglas Olin Fowler vs. Olin Douglas Fowler), and/or possible marital names (Patricia Demi Geise vs. Patricia Geise Hamilton), and flag such as potential name matches worthy of additional review.
First names, middle names, and last names on each record also are assessed for relative rarity using name distributions in the data set (ideally) or name lists from Census and Social Security data sources. Typically, probabilistic protocols use the distribution of names in the data set to develop “scaling factors” that reflect the “rarity” of a particular name. The most common last names in the United States include Smith, Johnson, Williams, and Jones. The most common first names for males are James, Robert, John, and Michael. The most common first names for females are Mary, Patricia, Linda, and Jennifer. The name rarity calculations are used in a subsequent step (see “probabilistic evaluation” section for more discussion of “scaling” factors) to help assign a degree of confidence in a potential name match decision.
A deterministic algorithm may also use name rarity indicators. For example, independent of its probabilistic algorithm, The Link King’s deterministic algorithm classifies first name/last name combinations on a scale
�7
Integrating State Administrative Records To Manage Substance Abuse Treatment System Performance
of 1.0 (extremely common) to 0.1 (extremely rare) and considers the rarity of a name in making deterministic linkage decisions. Essentially, two records that match on a relatively rare first name/last name combination (e.g., Myesha Esperone) are considered a more probable match than two records that match on a relatively common first name/last name (e.g., Robert Smith) since there are probably more Robert Smiths than Myesha Esperones in any given data set(s). Thus, all other factors being equal, two records containing both a rare first name and a rare last name are more likely to represent the same individual than are two records containing a more common first name/last name combination.
SSN similarity. Approximate string matching protocols can also be used to compare two SSNs for similarity. One approach would be to assess the number of characters in the two SSNs under comparison that are character and positional matches and assign an SSN similarity value ranging from 0.0 to 1.0. For example: 908-38-0010 and 908-33-0010 match on 8 of the 9 positions (ASM SSN similarity score = 0.888). Note that this similarity measure will detect simple character transpositions in the SSN (e.g., 989-43-6413 vs. 989-34-6413 match on 7 of the 9 positions, score = 0.777).
Date of birth similarity. Linking protocols can detect and flag potential date element transpositions, for example:
07/ 10/ 1965 vs. 10/ 07/ 1965 (MM DD tandem element
transposition), and
07/ 12/ 1965 vs. 07/ 21/ 1965 (date element transposition).
Step 4: Determine appropriateness of linking a record pair
Once the degree of similarity has been quantified for each data element in a record pair, deterministic and/or probabilistic algorithms are used to make a decision regarding the appropriateness of linking the record pair. Most record-linkage/data-deduplication
software programs available today use a probabilistic algorithm as a basis for deciding the appropriateness of linking a record pair. Deterministic algorithms are used to varying degrees. For example, SAMHSA IDB linking protocols use results of deterministic evaluation as “tie breakers” to decide the appropriateness of linking record pairs wherever the probabilistic algorithm is unsure of the appropriateness of the link. On the other end of the spectrum, The Link King conducts an elaborate deterministic evaluation and makes a deterministic decision regarding the appropriateness of a link independent of the probabilistic decision. A crosswalk of The Link King’s deterministic and probabilistic solutions provides guidance to the user in the selection of links.
Deterministic evaluation. Deterministic linking is accomplished by establishing specific criteria that define the combination of data elements that must match in order to accept the link as valid. Deterministic criteria in some software programs require exact matches on selected data elements. Other software programs, as detailed below, consider some similarity measures (e.g., phonetic equivalence, approximate string matching) as potential components of a “deterministic” match. Data-linking protocols may use a varying number of deterministic criteria to determine the appropriateness of linking a record pair. While the SAMHSA IDB project linking protocols use 6 deterministic criteria, 40–50 deterministic criteria are employed by The Link King. By way of example, deterministic rules similar to those used by SAMHSA IDB project linking protocols would consider a record pair to be a deterministic match if any of the following six conditions are met:
1. SSN, birthdate, and gender match exactly;
2. First name ASM score is at least 0.8 (out of 1.0), last name ASM score is at least 0.9 (out of 1.0), and both birth date and gender match exactly;
��
Appendix I
3. First name ASM score is at least 0.8 (out of 1.0), last name ASM score is at least 0.9 (out of 1.0), SSN ASM score is at least 0.9 (out of 1.0), and birth date matches exactly;
4. First name ASM score is at least 0.8 (out of 1.0), last name ASM score is at least 0.9 (out of 1.0), and both birth date and middle initial match exactly;
5. First name ASM score is at least 0.8 (out of 1.0), last name ASM score is at least 0.9 (out of 1.0), SSN ASM score is at least 0.9 (out of 1.0), and gender matches; or
6. First name ASM score is at least 0.8 (out of 1.0), last name ASM score is at least 0.9 (out of 1.0), and both SSN and middle initial match exactly.
Probabilistic evaluation. Probabilistic linking is accomplished through statistical analysis of the similarity between data elements in record pairs. The end result is a formula that generates a score for each record pair and establishes cut-points (i.e., “thresholds”) to identify “definite” matches, “possible” matches, and “non-matches.” The formula incorporates weights specific to each of the data elements and scaling factors for many of the data elements. Weights reflect the relative importance of specific data elements in predicting a match. Scaling factors adjust the weights based on the “rarity” of the data value.
Even if an RPC is assessed through the deterministic evaluations as a match, the record pair is still re-assessed at the probabilistic evaluation stage as a further check on the record pair and to add additional certainty that the particular record pair is indeed a match. Also, even if a record pair comparison in the screened-in blocked subset fails to be assessed as a potential match via the deterministic evaluations, the record pair is still re-assessed at the probabilistic evaluation stage, in the event that the probabilistic stage detects a potential match that the deterministic stage may have missed.
The statistical processes underlying a given software program’s probabilistic estimation protocol may vary, and commercial software may consider such processes proprietary. Details regarding the probabilistic estimation process used by SAMHSA’s IDB linking protocols (and The Link King) are available on the SAMHSA Web site at the following URL: http://www.csat.samhsa.gov/IDBSE/idb/ modules/linking/recordlink.aspx.
Step 5: Manual review of uncertain matches
After probabilistic and/or deterministic evaluation, the linking program may provide the user with the opportunity to manually review record pairs when there is still uncertainty regarding the appropriateness of a link. The software may classify these uncertain links into categories based on the relative certainty of the linkage or may simply rank the linkages in descending order by probabilistic score.
The user will then need to make decisions regarding how many of the “uncertain” RPCs he or she wishes to manually review. Categorical decisions can often be made to speed the review of the “uncertain” record pairs. For example, the user may “spot check” a random sample of certain categories of these pairs and may elect to classify as “matches,” for example, all those uncertain RPCs that fall between a user-defined range of probabilistic scores or fall into a particular “certainty level” classification assigned by the software program. In many software programs, the definition of “uncertain” is fairly conservative and many of the uncertain pairs with higher likelihoods of being true matches can safely be classified automatically as “matches” without significant human review.
Spot checking a random sample of linkages is most efficiently done using a software program that allows the user to generate the random sample, review the random sample, and implement the user’s decision regarding the appropriateness of linkages in the sample
�9

Integrating State Administrative Records To Manage Substance Abuse Treatment System Performance
from within the software application. This functionality, to the best of our knowledge, is only available in one public domain application: The Link King.
The “less certain” subgroups of RPCs must be manually reviewed by a human. The datadeduplication and data-linking program will ideally display each of these remaining uncertain RPCs on the screen to the user two records at a time, with the dissimilar data elements highlighted and all the attendant similarity measures and probabilistic scores and deterministic decisions displayed for each RPC. Some applications, however, simply present the user with a scrollable listing of all record pairs, in descending order by probabilistic score. The user can then review these RPCs and make quick decisions (e.g., “same person” vs. “different person”) via on-screen mouse clicks. Users typically will review a relatively large number of the “uncertain” RPCs the first couple of times a deduplication or linking project is attempted with a new data set(s). With experience with each particular database, however, users typically can identify which subgroups of uncertain RPCs really require human review and which subsets of RPCs can be safely coded categorically as “matches.” Some programs will provide a time estimate for the human review process (typically based on an assumption of 4–6 RPCs reviewed per minute).
Step 6: Obtaining final output of matched records
When the user has completed the manual review phase, the linking program may consolidate all of the RPC decisions (e.g., “same individual” vs. “different individual”) made
automatically by the program and manually by the user and then cluster all the original input records into unique client groupings and assign a new unique client ID to each cluster of records that has been identified as the same person. This process is often termed “mapping.” Mapping creates the final client grouping tables (consolidated records that are “clustered” by the new unique ID).
Some programs (e.g., Link Plus) may not “map” the record linkages. The final product from such programs is simply a listing of record pairs that have been linked. This may be sufficient when a one-to-one linkage is expected (e.g., linking client identifiers for AOD treatment clients to birth or death records); however, when multiple linkages for a given client are expected (e.g., linking client identifiers for AOD treatment clients to statewide hospital admissions), additional programming would be required to consolidate all related links for a given individual.
The example below illustrates the multiple linkage scenario. In this scenario, the analytic data set contained 344,730 client service episodes, representing an undetermined number of unique individuals from across all providers in the State across an 8-year period. After the deterministic and probabilistic evaluations, the linking program identified (in this example database) 197,587 unique individuals and has assigned new unique client IDs to all of the service records for each of these identified individuals. Many clients (as illustrated below) received services from multiple providers with slight variations on how the client’s identifying information was recorded. For example, Anthony Daryn Wachter has had five service episodes across three providers under five different provider IDs over
Provider Provider Client ID
Date Admitted
First Name
Middle Name
Last Name SSN DOB GEN RCE
New Unique ID Cluster
P05 2031446 2/11/1997 ANTHONEY DARYN WACHTER 928059930 23-Aug-66 M W 1934
P04 AW74844 5/16/1998 ANTHONEY DARYN WACHTER 928059930 20-Sep-66 M W 1934
P01 0094028 6/22/2002 TONY DARYN WACHTER 928059930 20-Sep-66 M W 1934
P01 0095232 3/27/2003 TOÑO DARYN WACHTER 928059930 20-Sep-66 M W 1934
P01 0096103 10/4/2004 TOMMY DARYN WACHTER 928050230 20-Sep-66 M W 1934
�0

approximately 8 years. Also note that Anthony’s first name had some different spellings over the years and there were some inconsistencies in his SSN and DOB as well. Despite these variations, an automated linking protocol will still be able to identify all five of these records as belonging to the same individual and will assign a new common Unique ID (e.g., New UID = “1934”) to Anthony’s five records.
Section reference
Landau, G. M., & Vishkin, U. (1989). Fast parallel and serial approximate string matching. Journal of Algorithms, 10(2), 157–169.
C. Unique Client Identifiers States and service providers vary in their approach to unique client identification. Some States may use SSNs to uniquely identify clients. Other States may use centrally assigned, statewide-unique identifiers such as a master client index (MCI) or master patient index (MPI). Many States and providers generate (or at least have the potential to generate) primary or secondary client identifiers created from concatenated component client-data elements representing fixed or relatively fixed client characteristics (e.g., date of birth, gender code, perhaps the last four characters of the SSN, certain characters from the client’s first and last names). As the weakest protocol, some States may allow each provider to develop and submit idiosyncratic, provider-specific client identification numbering that contains little or no fixed client characteristic data elements.
The ability to determine the total number of unique individuals receiving services (across all providers in a State) is a key component of National Outcome Measures and the annual Substance Abuse Prevention and Treatment Block Grant application. A well-designed client identification protocol (in association
Appendix I
with the deterministic and probabilistic deduplication routines described earlier) can help the State obtain such unduplicated client counts.
The ability to collect and use data elements (e.g., DOB, name components, and SSN components) is central to the ability of a State AOD treatment agency to link to external databases (e.g., arrests, emergency room, social services) for purposes of outcome evaluation and shared-client analyses. Such linking analyses often involve the generation (directly or indirectly during the linking process) of constructed client IDs created from the client-identifying data elements common to the data sets being linked. However, States are cautioned that it is a rare circumstance where a client identifier constructed from components of full identifying information (e.g., last 4 digits of SSN, first 3 characters of first and last name) will solve a State’s data-linkage problems. Linking administrative data sets by relying solely on a constructed client identifier is, essentially, application of a rudimentary deterministic protocol. A rudimentary deterministic protocol can generate high “positive predictive value” (i.e., nearly all the records linked will, in fact, be valid links). Unfortunately, rudimentary deterministic protocols usually suffer from low sensitivity (i.e., many valid links will be overlooked).
Note: In following discussions, epidemiological metrics “sensitivity” and “positive predictive value” (PPV) are used as indicators of the accuracy of record-linkage protocols. See appendix III for definitions of these indicators.
To illustrate this point, using the administrative data set maintained by Washington State’s DASA (known as TARGET), 14 client identifiers were constructed according to the criteria specified in Table 1. Each of the constructed IDs was used to unduplicate TARGET. Results of each unduplication run were compared to unduplication results generated by The Link King. When compared to manual review, The Link King’s sensitivity
�1
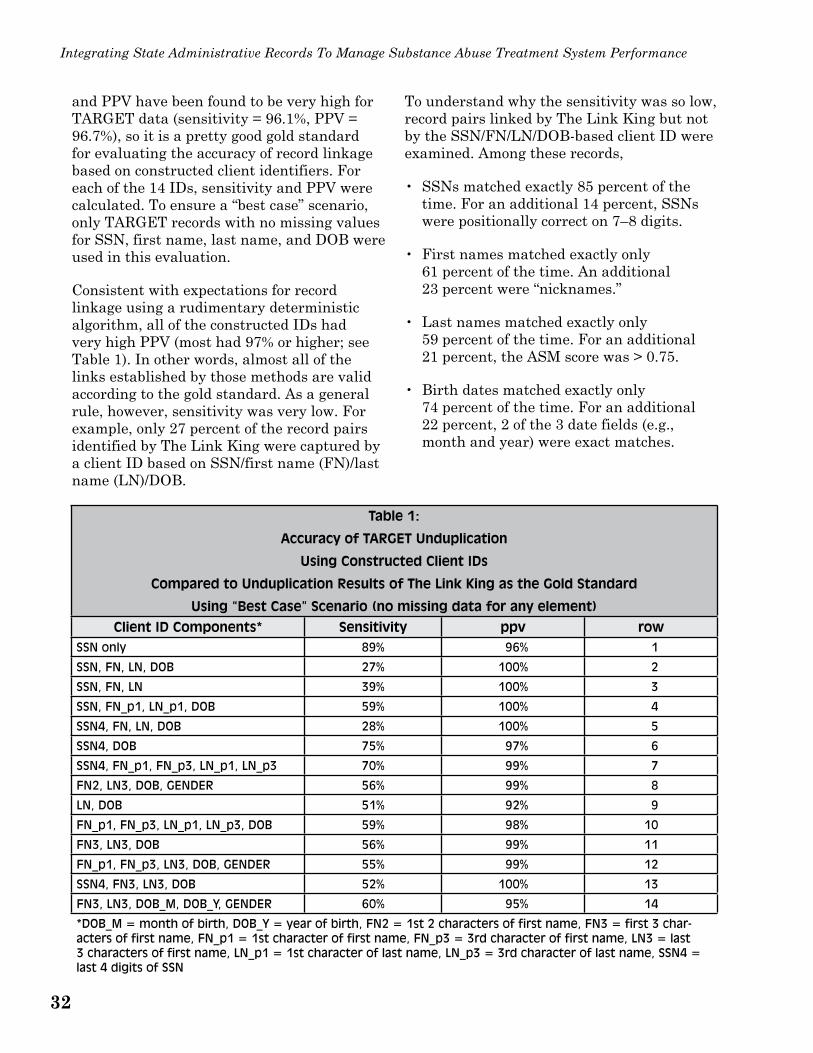
Integrating State Administrative Records To Manage Substance Abuse Treatment System Performance
and PPV have been found to be very high for TARGET data (sensitivity = 96.1%, PPV = 96.7%), so it is a pretty good gold standard for evaluating the accuracy of record linkage based on constructed client identifiers. For each of the 14 IDs, sensitivity and PPV were calculated. To ensure a “best case” scenario, only TARGET records with no missing values for SSN, first name, last name, and DOB were used in this evaluation.
Consistent with expectations for record linkage using a rudimentary deterministic algorithm, all of the constructed IDs had very high PPV (most had 97% or higher; see Table 1). In other words, almost all of the links established by those methods are valid according to the gold standard. As a general rule, however, sensitivity was very low. For example, only 27 percent of the record pairs identified by The Link King were captured by a client ID based on SSN/first name (FN)/last name (LN)/DOB.
To understand why the sensitivity was so low, record pairs linked by The Link King but not by the SSN/FN/LN/DOB-based client ID were examined. Among these records,
• SSNs matched exactly 85 percent of the time. For an additional 14 percent, SSNs were positionally correct on 7–8 digits.
• First names matched exactly only 61 percent of the time. An additional 23 percent were “nicknames.”
• Last names matched exactly only 59 percent of the time. For an additional 21 percent, the ASM score was > 0.75.
• Birth dates matched exactly only 74 percent of the time. For an additional 22 percent, 2 of the 3 date fields (e.g., month and year) were exact matches.
Table 1:
Accuracy of TARGET Unduplication
Using Constructed Client IDs
Compared to Unduplication Results of The Link King as the Gold Standard
Using “Best Case” Scenario (no missing data for any element)
Client ID Components* Sensitivity ppv row SSN only 89% 96% 1
SSN, FN, LN, DOB 27% 100% 2
SSN, FN, LN 39% 100% 3
SSN, FN_p1, LN_p1, DOB 59% 100% 4
SSN4, FN, LN, DOB 28% 100% 5
SSN4, DOB 75% 97% 6
SSN4, FN_p1, FN_p3, LN_p1, LN_p3 70% 99% 7
FN2, LN3, DOB, GENDER 56% 99% 8
LN, DOB 51% 92% 9
FN_p1, FN_p3, LN_p1, LN_p3, DOB 59% 98% 10
FN3, LN3, DOB 56% 99% 11
FN_p1, FN_p3, LN3, DOB, GENDER 55% 99% 12
SSN4, FN3, LN3, DOB 52% 100% 13
FN3, LN3, DOB_M, DOB_Y, GENDER 60% 95% 14
*DOB_M = month of birth, DOB_Y = year of birth, FN2 = 1st 2 characters of first name, FN3 = first 3 characters of first name, FN_p1 = 1st character of first name, FN_p3 = 3rd character of first name, LN3 = last 3 characters of first name, LN_p1 = 1st character of last name, LN_p3 = 3rd character of last name, SSN4 = last 4 digits of SSN
��

Appendix I
Identifying information in many administrative data sets likely suffers from the same “problems” that TARGET does and one should be VERY careful in assuming that a constructed client ID will solve data-linkage problems. Use of a verified SSN (with minimal missing values) would be the only ID that would likely generate reasonably high sensitivity.
However, if a State constructed a 19character client ID comprising:
• Last 4 SSN digits;
• First 3 characters of first name and last name;
• DOB; and
• Gender
then, when using the data set for record linkage, the constructed ID could be parsed into its various components and the 8 IDs represented in rows 6 to 8 and 10 to 14 of Table 1 could be created. A record-linkage algorithm could then be constructed that linked records that matched on any of these 8 IDs. One might consider excluding row 14 (the lowest PPV). Application of this “parsed ID” solution (excluding row 14) to the deduplication of TARGET data (with no missing data elements) yielded 95 percent sensitivity and 96 percent PPV (again, using The Link King’s solution as the gold standard).
Application of this “parsed ID” solution to deduplication of the complete TARGET data set (which contains 32% missing values for SSN) yielded 89 percent sensitivity and 96 percent PPV (using The Link King’s solution as the gold standard). Note how missing values for SSN impacted sensitivity: 32 percent missing SSN dropped sensitivity from 95 percent to 89 percent. If significant data were missing for date of birth, first name, or last name, sensitivity would likely decline further.
The following section of the technical appendix discusses the discriminating power of client identifiers and methods for evaluating the effectiveness of various unique client identification protocols that a State may employ, either for routine administrative purposes or for purposes of client data linking.
Discriminating power of common client identifier variables
Discriminating power is an overall measure of the power of a generated client ID (or data components thereof) to uniquely identify clients and discriminate among unique clients. Larger values of the discriminating power indicate greater information provided by the data elements of the ID string for discriminating among unique individuals. Data elements with a large number of potential values, such as date of birth, will have greater discriminating power than data elements with few potential values (such as gender or race). However, the distribution of the data element values also affects the discriminating power. If a data element has significant missing data (e.g., SSN is missing for 70% of clients) or if the values of a data element are heavily skewed (such as a database where the gender variable is 80% male), then such data elements will not be particularly useful for uniquely identifying or linking clients in this particular data set. Analysis of the discriminating power of various elements of client-identifying information or combinations of elements can inform the construction of a synthetic client ID for use in record link-age/unduplication. Once again, States must realize that record-linkage results based on constructed client IDs will, in most cases, be inferior to those based on probabilistic protocols or multi-faceted deterministic protocols.
The most discriminating client identifier would be a “universal” ID, such as a verified, full nine-character SSN. In situations where SSN is not available for use as an identifier (e.g., due to privacy concerns, State
��
Integrating State Administrative Records To Manage Substance Abuse Treatment System Performance
policy, client preference not to disclose, or the AOD treatment agency collects it but a partner data-linking agency does not), States and providers often choose to generate client identifiers based on concatenated client data elements (such as date of birth, gender code, perhaps the last four characters of the SSN, certain characters from the client’s first and last names). One common “constructed” identifier based on fixed client characteristics might be composed of the following data elements: first and third characters of client’s first name, middle initial, first and third characters of client’s last name, full eight-character date of birth, gender, and last four characters of client’s SSN. Thus Tony Dorsey Hutchison, Gender=Male, DOB=December 3, 1971, SSN=869-93-2927, would have a primary client ID (or perhaps a secondary client ID used for deduplication and linking purposes) of TNDHT12031971M2927.
Many variations of this theme are possible. A State may decide to use the first three characters of each name, or the NYSIIS transformation of each name, or even the full name itself. States might decide to include in the constructed ID a race–ethnicity code, or perhaps a code for client’s county of residence or ZIP Code (although this is not a fixed characteristic as clients move from one geographical area to another), or characters from the client’s mother’s maiden name.
Each data element used in the creation of a client ID (or of a temporary client ID during deduplication and linking analyses) has strengths and weaknesses in terms of the availability of each data element in the data set or sets, confidentiality concerns, the amount of missing data associated with each data element, the quality of the collected data, and the reliability and stability of each data analysis (e.g., people change their last name or use nicknames, their self-identified race–ethnicity, and address).
The discussion that follows provides some observations and suggestions based on analyses of various data sets for AOD treatment as well as synthetic test databases and
offers some metrics that would allow a State to assess the discriminating power of its own potential client identification protocols. Although the observations that follow might be representative of a “typical” State client database for AOD treatment, the particular unique ID strategy that would work best for any given State depends on the availability, completeness, and accuracy of the component data elements in each State’s client database for AOD treatment, plus the availability, completeness, and accuracy of the various data elements in other target databases with which the State AOD treatment agency would like to link. In addition, the distribution of particular data elements and the total number of unique values for each data element in each State’s database can affect the decision on the most efficient client ID for a State.
Developing a test database for dis-criminating power analysis. The general approach to assessing the discriminating power of a particular unique client identification scheme is to generate a data set of uniquely identified clients with each unique client’s record populated with his or her identifiers, as available—SSN or partial SSN, names (or components of names), DOB, gender, etc. Configure the data set to contain one record per uniquely identified individual. One approach to generating the unique client data set is to employ the deterministic and probabilistic deduplication protocols described in a previous section. In the example described above, 344,730 client episode records (across all providers in the State over an 8-year period) were deduplicated by the deterministic and probabilistic protocols to yield 197,587 uniquely identified individuals. Select one record (for example, select the record representing the most recent service episode) for each of these 197,587 individuals.
Using this unique individual data set, one can calculate a measure of the power of each client data element (DOB, gender, part of SSN, part of name, etc.) alone, or in combination, to discriminate among unique clients. Estimates of the discriminating power of a variety of data elements and combinations
��

of data elements are provided later in this section. Note that the observations in this section are fairly universal and can be assumed to fairly reliably model the results that any given State might achieve, even without conducting a full evaluation. Note, however, that the completeness and quality of a given State’s data, the distribution of the values for each of the client data elements (for example, a client database where gender is distributed 50% male and 50% female will yield different results than a State client database that is 70% male and 30% female), and the total number of records upon which the analysis is based can affect the discriminating power values for any given potential synthetic client ID under consideration by a State. Thus, where possible, a State may wish to consider conducting discriminating power analysis using the State’s own client data sets.
Calculating discriminating power. Discriminating power is calculated as ln|(1/sum(p(i)^2))|, where p(i) = proportion of total clients in each value of the data element or data element string under consideration and sum = summation of p(i)^2 across all values of the data element or data element string.
Below is an example of the calculation of discriminating power for the race–ethnicity data element from a particular client database for AOD treatment (approximately 60% White, 30% Black, 7% Hispanic, and 3% of
Discriminating Power Calculation for Race–Ethnicity—RCE
Category Count p(i) p(i)^2 White Black Hispanic Other Race–Ethnicities
118,809 60,047 13,337
5,394
0.6013 0.3039 0.0675
0.0273
0.3616 0.0924 0.0046
0.0007
Total 197,587 1.0000 0.4592
Calculation 1/sum(p(i)^2) 2.178
Discriminating Power In(1/sum(p(i)^2)) 0.778
Maximum Possible DP This Database If Perfect Discrimination 12.194
Relative Discrim Power (RDP) for RCE DP/Max Poss DB 6.4%
Appendix I
other race–ethnicity). Note that race– ethnicity is not a particularly useful data element by itself for unique identification and linking purposes, but it has a small enough set of possible values (four race– ethnicity codes) to allow for easy illustration.
The calculated discriminating power for the race–ethnicity data elements in this particular data set is 0.778. Under theoretical conditions, a client identifier that perfectly discriminated all 197,587 individuals in this particular data set would have a discriminating power value of 12.194. (The maximum possible discriminating power value can be calculated using the new unique identifier that is specific to each of the 197,587 individuals in this data set.) Thus, race–ethnicity in this particular database has a relative discriminating power of only 6.4 percent (which is to be expected because race–ethnicity alone is insufficient to distinguish individuals. Race–ethnicity was used in this example for illustrative convenience, not as a recommended data element for unique client identifiers). Note that the particular calculated values for every data element (or combination of data elements) will vary by the number of unique individuals in the particular data set and by the distribution of the number of individuals in each category (e.g., the racial distribution of clients, in this example).
Discriminating power is an overall measure of the power of a generated client ID (or data components thereof) to uniquely identify
��

Integrating State Administrative Records To Manage Substance Abuse Treatment System Performance
clients and discriminate among unique clients. Larger values of the discriminating power calculation indicate greater information provided by the data elements of the ID string for discriminating among unique individuals. Data elements with a large number of potential values, such as date of birth, will have greater discriminating power than data elements with few potential values (such as gender or race). However, the distribution of the data element values also affects the discriminating power. If a data element has significant missing data (e.g., SSN is missing for 70% of clients) or if the values of a data element are heavily skewed (such as a database in which the gender variable is 80% male), then such data elements will not be particularly useful for uniquely identifying or linking clients in this particular data set.
Note that other measures of discriminating ability exist (such as Shannon’s entropy index). However, the discriminating power measure described above is more stable and less biased in databases with the potential for significant missing data (e.g., clients with a missing SSN or with no middle name).
Discriminating power of common client identifiers. This section describes typical data elements used as identifiers in various AOD treatment client databases and provides some general description of the discriminating power of each data element (or combinations of elements).
The data sets used in this analysis have relatively few missing data. Missing data often can be minimized through the use of data input software that does not allow “mandatory” fields to be skipped and which prevents the entry (in real time) of most invalid data (e.g., gender value of “4”) and most obviously bogus data (e.g., DOB = 01/01/01 or SSN = 123-45-6789). As a result, the discriminatory power estimates for the data elements in the data sets used in this analysis are close to the “best case” obtainable for databases of this type. If another State data set has significant amounts of invalid or bogus data values, or if another data set
has a lot of missing values for various data elements, the corresponding discriminatory power estimates will be lower. The fact that this analysis does have relatively complete data for all variables (except middle initial and ZIP Code, neither of which is a particularly recommended data element) does provide a relatively “fair” comparison of the discriminating power of each data element without biases introduced by significant amounts of missing data on any given data element.
SSN. In theory a unique SSN should be associated with each individual in a given data set and, under ideal situations, a relative discriminating power of 100 percent would be expected. In practice, the value of the relative discriminating power calculation for SSN is usually some value less than 100 percent, since some SSNs in any database are incorrect. In general, however, the Relative Discriminating Power (RDP) value for SSN in a database with minimal missing values for SSN will be 99 percent or better.
SSN4. For situations in which it is not possible to collect or link to the full nine-character SSN, use of the last four characters of the SSN (SSN4) is an alternative data element with relatively high discriminating power, while preserving some level of confidentiality. The RDP for SSN4 in a database with minimal missing values for SSN4 is often around 75 percent.
Last name. The RDP of last name is often in the 50–55 percent range. Note that there is not always a direct association between the number of values that a data element can take on and the relative discriminating power of that particular data element. In a data set of this size, there may be approximately 24,000 last names. Last name (with 24,110 unique values in this data set) will have less RDP (53%) than the last four characters of the SSN (only 9,999 unique values, but a relative discriminating power of 75%). The reason that the total number of possible values of a data element (e.g., last name) is potentially misleading as an indicator of
��

Appendix I
discriminating power is that the simple count of possible last name values does not take into account the distribution of last names. The 1,000 most common last names in the United States (e.g., Smith, Johnson, Williams, Jones) are shared by 43 percent of the U.S. population and the top 30 last names in the United States account for 11 percent of all last names used in the United States. Thus, even though there are far more last names than there are possible combinations of the last four characters of SSN, many of these last names have relatively little discriminating power since so many people share a small set of a few last names. The distribution of the last four characters of SSN is relatively uniform with no predominance toward any one four-character string (e.g., no inordinately large number of persons with, for example, a “3667” SSN4 character string). Thus, the SSN4 string has more discriminating power than does last name.
Note: All client ID strings using full first name, full last name, NYSIIS FN, or NYSIIS LN will be variable length IDs, since name lengths can vary. States using such name components as part of a synthetic ID may wish to establish a maximum estimated fixed length field for such IDs and right-fill shorter names with spaces, etc.
First name. The RDP of first name (often in the range 44–50%) is generally less than the RDP for last name. A data set of this size and type might have 11,000–16,000 first names (compared to 24,000 or so last names). There are fewer first names in use in this country than last names. As with last names, the discriminating power of first name is less than the RDP of SSN4 (even though there are more distinct values of first name than SSN4) due to the unequal distributions of first names (and middle names) in the United States (concentrations among James, Robert, John, Michael, Mary, Pat, Linda, Jennifer, etc.). Also over the last several decades, there has been a compression of first names selected for babies in the United States, as increasing numbers of parents opt for a relatively small set of trendy names (e.g., Jacob, Joshua,
Emily, Madison) each year. Thus, identifiers that utilize first names or components of first names are likely to continue to decrease in discriminatory power unless this trend is reversed. Also note that in general, there are fewer unique first names for males in the United States compared to the larger variety of first names for females. Thus, in data sets in which males predominate, the discriminating power of first name is reduced further.
NYSIIS phonetic transformation of last name (LNN). Use of phonetic transformations helps reduce the impact of missed record linkages due to misspellings and alternative spellings and helps provide a measure of confidentiality. One could also use Soundex, Double Metaphone, and other phonetic algorithms. However, use of any phonetic transformation as part of an assigned ID will require that the assigning parties (clinicians, etc.) have access to an electronic version of the phonetic algorithm and that all assigning parties are using the same version of NYSIIS, etc. In most database-linking projects, it will be necessary to apply the phonetic transformation algorithm to the names in target linkable data sets. The RDP for LNN will be less than that for the full last name, but still often in the 48–50 percent range.
NYSIIS phonetic transformation of first name (FNN). The issues addressed above for the LNN apply to the FNN as well. RDPs for FNN are often in the 38–42 percent range.
First four characters of last name (LN4). Note that if the intent of using partial names is to preserve some confidentiality, four-character names will not do that. With four-character names (even with three-character names), it is often possible to guess client names and identities fairly easily. If a name is less than five characters, then the maximum available characters in the name will have been used in the LN4 data element. The first four characters of last name have less discriminating power than last four characters of SSN since the last four characters of SSN are random and not constrained, whereas adjacent characters of a name are constrained by
�7

Integrating State Administrative Records To Manage Substance Abuse Treatment System Performance
commonality (e.g., SMIT representing Smiths) and constrained by phoneme rules of the language (e.g., HLGE is an improbable first four characters of a last name). The RDPs for LN4 (51–52%) are often marginally higher than the RDPs for the phonetic transformation of LNN but at a cost in confidentiality.
First four characters of first name (FN4). FN4 provides very little confidentiality since many first names are four characters or shorter (e.g., John, Ann) and a full first name of any length is often easily guessed on the basis of the first four characters. RDPs for FN4 (41– 47%) are often marginally higher than the RDPs for the phonetic transformation of FNN but at a cost in confidentiality.
First three characters of last name (LN3). The issues addressed above apply to this component as well. RDPs often range from 46–47 percent.
First three characters of first name. (FN3). The issues addressed above apply to this component as well. RDPs often range from 39–42 percent.
First three characters of NYSIIS transformed LN (LNN3). RDPs often range from 37–38 percent.
First three characters of NYSIIS transformed FN (FNN3). RDPs often range from 32–34 percent.
First two characters of last name (LN2). RDPs for LN2 are often 35–36 percent.
First two characters of first name (FN2). RDPs for FN2 are often 32–33 percent.
First and third characters of last name (L1L3). Note that the L1L3 approach yields more unique values and higher discriminatory power than the LN2 element, even though both elements are two characters in length. The L1L3 advantage is due to the fact that two adjacent characters are more restrained in possible combinations, e.g., an adjacent “WL” is seldom seen in a name, but a “W_L” combination (as in Williams, Wales, etc.) is
��
quite possible. If a client’s last name is only one or two characters (e.g., “Yi”) then L1L3 will be only one alpha character long (“Y”). RPCs for L1L3 are often 40–41 percent. A State considering using any two-character name segment as a data element may wish to consider L1L3 and F1F3 rather than LN2 or FN2, since the 1_3 approach yields more discriminating power and since the 1_3 approach yields some extra confidentiality. A three-character name element (e.g., LN3, FN3) offers even more discriminating power than L1L3, F1F3, but less confidentiality. Components can be scrambled for greater confidentiality (e.g., use L3L1—third character of last name, followed by first character of last name).
First and third characters of first name (F1F3). Note: If client’s first name is only one or two characters (e.g., “Al”), then F1F3 is only one alpha character long (“A”). RPCs for F1F3 are often 35–38 percent. Again, components can be scrambled for greater confidentiality (e.g., F3F1—third character of first name, followed by first character of first name, etc.).
First character of last name (LN1). RDPs for LN1 are generally 22–23 percent.
First character of first name (FN1). RDPs for FN1 are generally 22–23 percent.
Middle initial (MI). Number of expected unique values of MI equals 27 (26 alpha characters plus a missing value indicator). Middle initial is often missing in up to 20–30 percent of client records, since MI is often an optional field and some people do not have a middle name. In a database with, for example, 25 percent missing data on MI, 25 percent of the unique clients will, in effect, “share” the “missing” value indicator for MI. Such relatively large amounts of missing data will lower the relative discriminating power for the particular data element accordingly. RDPs for MI in a data set with minimal missing data (e.g., 1% missing) on MI may be around 23 percent. RDPs for MI in a data set with approximately 27 percent missing values on MI may be around 18 percent. Thus, MI is
Appendix I
not particularly recommended as a data element since some people have no middle name and since middle initial can change in situations where a woman’s birth middle name is supplanted by use of her maiden last name as her new middle name after marriage (and the possible reverse after divorce, etc.).
Date of birth. DOB was coded in MMDDYYYY format in these examples. In large data sets (e.g., approximately 200,000 unique individuals or more) with relatively large age ranges (e.g., 60-plus year span of potential ages among the clients in any given year), the discriminating power of DOB is usually slightly better than SSN4. DOB in such databases often has greater discriminating power than last name even if there are more distinct values of last name than DOB. DOB will have greater discriminating power than last name due to its more uniform distribution of values (dates of birth are relatively evenly distributed whereas last names have a skewed distribution, with a large number of persons sharing a relatively small number of last names). RDPs for DOB in databases of this type are often in the 78–79 percent range.
DOB may be less useful as a potential identifier element if the data set under consideration has a relatively compressed age range. For example, a database of middle school students (grades 6–8) would have only approximately 1,095 randomly distributed potential DOBs across an approximate 3-year range (365 days * 3 years). In such a database, DOB is likely to have less discriminating power than SSN4.
Note the necessity of using the full four-digit year in date elements. Many States currently assign unique client numbers to infants (born 2000 and later) e.g., children of clients in women’s residential care or children receiving therapeutic child care while the parent is in intensive outpatient group. Also note that within a few years, States will be providing services to adolescents who were born in year 2000 and later. Thus, States will need the full four-character year of birth format to clearly
distinguish clients born in the 1900s from clients born in the 2000s.
Year of birth (YOB). RDPs for YOB will depend upon the number of distinct years of birth present in the data set(s) under review. In the case of a longitudinal data set covering, for example, 8–10 years of client data, one may find 95 or more distinct years of birth in the data set. Such longitudinal data sets, with client age distributions appropriate to a typical AOD treatment clientele, may have RDPs for YOB around 30–31 percent.
Month of birth (MOB). RPCs for MOB are typically around 20 percent, reflecting the relatively even distributions of clients across the 12 potential months of birth. It is useful to store MOB in the leading zeros (01 .. 09 .. 12) format (e.g., January is coded as “01”, not “1”) such that future combinations of MM DD are not ambiguous (e.g., does “111” represent “01-11” or “11-01”). It is best to define the full synthetic ID field (and all component date elements) as a “character” or “text” field (not as a numeric field) so that the database users can input leading zeros as well as character strings (M F codes, initials of first and last name, etc.).
Date of month of birth (DMB). RDPs for DMB are typically around 28 percent, reflecting the relatively even distributions of clients across the 31 potential days of the month of birth. Again, it is best to store DMB in the leading zeros (01 .. 09 .. 31) format (e.g., January is coded as “01”, not “1”) such that future combinations of MM DD are not ambiguous (e.g., does “111” represent “01-11” or “11-01”).
Current ZIP 5 of residence (ZIP). Most medium- and larger-sized States will have 600–700 or more five-character ZIP Codes. RDPs for ZIP can range up to 41–42 percent. However, use of ZIP as a component in a unique identifier is not recommended, since people change addresses frequently.
Current county of residence (COR). Most medium- and larger-sized States will have 50–100 or more counties. RDPs for COR can
�9
Integrating State Administrative Records To Manage Substance Abuse Treatment System Performance
range up to 20–27 percent. However, use of COR as a component in a unique identifier is not recommended, since people change addresses frequently (and since some smaller States—and DC—have as few as 1–3 “counties”). Also note that COR would not be very discriminating in a geographically limited client data set.
Race–ethnicity (RCE). A combined race and ethnicity code is not recommended since people may change their self-identified race– ethnicity over time and since target linkable data sets may not code race–ethnicity the same or as extensively or may not code ethnicity at all, or may combine Hispanic ethnicity as an “other” race, etc. Therefore race– ethnicity by itself is a weak client identifier. RPCs for RCE are often in the 5–7 percent range. Race–ethnicity becomes less useful as an identifier in databases that are skewed toward one or two race–ethnicity groups. In many client data sets, 70 percent or more of the client population may be coded under one race–ethnicity category (and frequently 90% or more of a State’s client population is coded under two race–ethnicity categories, e.g., 60% White, 30% Black).
Gender (GEN). As with most of the above data elements, by itself, gender is a weak client identifier (RDPs for gender are typically in the 4% range). Gender does become useful as a client identifier data element when used in combination with other more discriminating data elements (such as SSN4, DOB, etc.). However, gender becomes less useful as an identifier as a database population becomes increasingly skewed to one gender. For example, clients in juvenile detention facilities are often 85 percent male (or higher). Thus, a gender data element would not be particularly useful as part of a client ID in this database, nor would gender be a particularly efficient variable for linking this database to another. Such a skewed distribution variable can, however, be useful in the exceptional case. For example, if you linked this juvenile incarceration database to an AOD treatment database and found a possible record match in which both data sets indicated that the
client was female, you would have a greater degree of “value-specific” confidence in that particular potential match than if any two records showed a link in which both records matched on male.
Data elements not assessed in this analysis. Data elements not tested in this analysis include client’s county or city of birth, client’s birth last name, mother’s maiden name, mother’s first name, father’s first name, provider agency client number, street address, phone number, and Soundex phonetic coding of names. Some States do collect data elements such as the above throughout all of the State’s health and social services agencies. In these States, such data elements may be useful as client ID components and linkable variables (depending upon the accuracy and completeness of such data elements). However, most States do not appear to collect these variables routinely in their State data sets. As such, these data elements were not included in this review.
Similarly, no attempt was made to assess provider-specific (non-centrally assigned) client numbers, since such identifiers, by definition, are inadequate to track clients who may receive services across multiple providers in a State under separate provider-specific client numbers over time.
No attempt was made to assess the effectiveness of a centrally assigned and centrally managed master client (patient) index (MCI, MPI) simply because the test data sets available for this analysis did not use such an identifier or, if an MCI-MPI was available, such was only available on a subset of all clients receiving services (e.g., State-funded clients whose services were paid or coordinated by an umbrella health and human service agency that administers the MCI-MPI). Such centrally assigned client numbers are generally inadequate as linking data elements to other data sets that do not employ the same master client index protocol.
�0
Appendix I
Discriminating power of multi-element client identifier strings
The most effective approach to generating a synthetic potentially unique client identifier is to combine multiple client data elements into one client identifier as a string of characters, either directly as part of a formal client identifier or indirectly as part of a temporary client identifier used during client deduplication and client data-linking analyses.
Obviously, the full nine-character SSN, used by itself or in combination with full first name, full last name, and full DOB, will provide the greatest discriminating power of all possible client IDs. In situations where full SSN, full names, and possibly full DOB are not available, various synthetic client IDs can be created using data elements such as SSN4, components of names, DOB or components of DOB, GEN, etc. While several of the client data elements are weak discriminators individually, when used in particular combinations, a reasonably discriminative client identifier can be developed.
The various client data elements described in this section can be combined in hundreds of potential configurations (such as L1L3 + F1F3 + DOB + SSN4 + GEN) to create a synthetic client ID. Over 150 such synthetic ID combinations were reviewed for this analysis.
In an attempt to restrict the analyses to just those client data combinations with the potential to be reasonably discriminating, a series of four screening thresholds were used, the chief criteria of which were that the client ID string must yield a relative discriminating power of 97.5 percent or higher and that incomplete or missing data on any of the component data elements in the data element string should not exceed 25 percent. Using
these thresholds, the most discriminating client identifiers are summarized below:1
SSN alone or in combination with other elements
SSN4, FN, LN, DOB
SSN4, DOB
SSN4, FN_p1, FN_p3, LN_p1, LN_p3
FN2, LN3, DOB, GENDER
LN, DOB
FN_p1, FN_p3, LN_p1, LN_p3, DOB
FN3, LN3, DOB
FN_p1, FN_p3, LN3, DOB, GENDER
SSN4, FN3, LN3, DOB
FN3, LN3, DOB_M, DOB_Y, GENDER
Note that all client identifiers that met the effectiveness screening thresholds contained last name (or component) in combination with SSN (or component) and/or DOB (or component). Beyond a certain level of complexity, all multi-element data strings perform similarly. States can select an ID strategy depending upon the availability, reliability, accuracy, and completeness of the component data elements in the State’s own AOD treatment client database and in the databases to which the State AOD treatment agency would like to link.
Ideally, as explained at the start of section C, the most useful synthetic client identifier would be one that could be parsed into a variety of component combinations to maximize linkage identification. As previously
1DOB_M = month of birth, DOB_Y = year of birth, FN2 = 1st 2 characters of first name, FN3 = first 3 characters of first name, FN_p1 = 1st character of first name, FN_p3 = 3rd character of first name, LN3 = last 3 characters of first name, LN_p1 = 1st character of last name, LN_p3 = 3rd character of last name, SSN4=last 4 digits of SSN
�1
Integrating State Administrative Records To Manage Substance Abuse Treatment System Performance
illustrated, if a State constructed a 19character client ID comprising the last 4 SSN digits, first 3 characters of first name and last name, DOB, and gender, it can be parsed to create the following 8 component IDs:2
SSN4, DOB
SSN4, FN_p1, FN_p3, LN_p1, LN_p3
FN2, LN3, DOB, GENDER
FN_p1, FN_p3, LN_p1, LN_p3, DOB
FN3, LN3, DOB
FN_p1, FN_p3, LN3, DOB, GENDER
SSN4, FN3, LN3, DOB
FN3, LN3, DOB_M, DOB_Y, GENDER
Analysis Note: A good practice for handling missing values in an identifier data element is to replace missing values (such as missing middle initials) with a non-alpha placeholder character (such as dash [-] or an asterisk [*]). Using a non-character placeholder value for missing data for middle initial (and for all other data elements) allows the creation of multi-element data strings, containing both known values and missing data placeholder characters as necessary. Retaining these “partial information” records in all the multi-element analyses allows the use of all discrete known information available in a multi-element identifier and improves the discriminating power of the resultant ID (as compared to a less favorable analysis approach in which multi-element data strings with any missing data values are simply excluded from the analysis).
General recommendations regarding the discriminating power of unique client identifiers
The best specific client ID approach for any given State will depend on the particular component data elements collected by the State AOD treatment agency and by its potential database linkage partners. However, a few general recommendations are possible.
A State may wish to select a relatively discriminating unique ID to meet its own internal client identification needs for service delivery purposes (e.g., SSN or from a centrally assigned and administered master client index) or construct a synthetic ID following guidelines in the previous section.
In addition, for maximum flexibility to link to external data sets, a State may wish to consider collecting all of the following: SSN (or partial SSN), first name, last name, middle name, DOB, gender, and race (in as many categories as possible), and possibly COR and ZIP.
States also should develop the ability to generate NYSIIS and Soundex phonetic translations of names (programming code for NYSIIS and Soundex and other phonetic transformations is readily available on the Internet).
If possible and appropriate, States should collect other client identifiers that may be useful for matching against other data sets (e.g., identifiers such as Medicaid number, corrections number, driver’s license number).
From these data elements, a State AOD treatment agency should be able to uniquely identify 99 percent or more of its clients and should be able to successfully link to almost
2DOB_M = month of birth, DOB_Y = year of birth, FN2 = 1st 2 characters of first name, FN3 = first 3 characters of first name, FN_p1 = 1st character of first name, FN_p3 = 3rd character of first name, LN3 = last 3 characters of first name, LN_p1 = 1st character of last name, LN_p3 = 3rd character of last name, SSN4 = last 4 digits of SSN
��
Appendix I
any external client database (mental health, hospital discharge, arrests, etc.).
Of course, the success of any client ID strategy is contingent upon the reliability and accuracy of the data elements used in the client ID (both on the part of the AOD treatment agency and on the part of potential linking client database partners).
Assessing the accuracy of record-linkage protocols
After analysis of discriminating power has been conducted and combinations of identifier components with high discriminating power have been identified, then assessment of accuracy of using component combinations for record linkage can be made. Such an assessment requires States to first deduplicate (or link) the data sets of interest using record-linkage software with demonstrated accuracy.3 Subsequently, record linkage using a particular synthetic ID (or combination of synthetic IDs) is conducted. Results from the two protocols are then compared and sensitivity and PPV values are calculated where:
# record pairs linked by the synthetic ID that are known to be “true”
Sensitivity = total # of “true” record pairs linked
# record pairs linked by the synthetic ID that are known to be “true”
PPV = total # of record pairs linked by the synthetic ID
The optimal linking protocol for any given project may vary by project and may depend in part on the consequences of a false negative versus a false positive. Relying on a synthetic client ID for record-linkage/deduplication limits a State’s flexibility to adjusting record-
linkage parameters. For purposes of outcome studies, false positives are generally considered the greater problem (i.e., it is worse to incorrectly link one person’s AOD treatment service record to a different person’s arrest record [a false positive] than it would be to simply miss a potential match between this person’s AOD treatment service record and this person’s arrest record that you failed to identify and link to [a false negative]). Usually, you will want to select your linking data elements and linking strategies such that you generate as few false positives as possible (even though such will necessarily result in an increase in false negatives). Thus, the selection and tweaking of a linking protocol always involves some balance and trade-off between acceptable levels of sensitivity and PPV: Maximizing sensitivity may reduce PPV and vice versa.
In some situations, full client-identifying information may not be available in one or more of the outcome data sets of interest, preventing the use of record-linkage software. Client-identifying information in a particular administrative activity may be limited to a synthetic ID comprising components of full client identifiers. In such instances, States should fully understand the limitations of record linkage relying on such limited information.
If a State AOD treatment agency does have some or all of the critical full identifiers in its administrative data set and intends to link with another entity that has only partial identifiers, the State AOD treatment agency can create the abbreviated identifiers that would match that target agency’s identifier format and then run various queries against its own data set to determine how frequently the abbreviated identifier results in missed links and false links (as determined by the
3As mentioned in section A, Link Plus and The Link King are public domain applications readily available for this purpose.
��

Integrating State Administrative Records To Manage Substance Abuse Treatment System Performance
“true knowledge” linkages based on results from record-linkage software with demonstrated accuracy). Under these test runs, the State AOD treatment agency may find an optimum partial identifier to maximize sensitivity and PPV. For example, the State AOD treatment agency might discover that a linking strategy based on simultaneous matching on all of the following data elements (F1F3L1L3 + MI + DOB + GEN + SSN4) results in unacceptably low sensitivity, while a strategy that requires a match on two or more of the following (SSN4 + DOB + GEN, F1F3L1L3 + DOB + GEN, F1F3L1L3 + SSN4 + GEN) produces an optimal balance of sensitivity and PPV. Of course, the actual performance of these various client-identification and client-linking strategies will depend on the quality and completeness of the identifiers in the arrest database as well.
In some States, the State agency may not have full identifiers in its electronic database, but the local or regional provider agencies do have full identifiers in their electronic databases (or, at the minimum, in their client paper chart files). Under these situations, the State could conduct a comparison analysis to determine the prevalence of missed links and false links for various configurations of client identifiers that are available at the State database level. Ideally such periodic analyses can be accomplished using electronic data sampled or compiled from the local or regional databases. If such electronic identifiers do not exist at the local or regional database levels, the State may need to conduct paper chart audits on a sufficiently large, representative sample of client files to estimate the effectiveness of its various client-identification and client-linking strategies.
D. Selected Resources on Cost Offsets of Treatment
Cost offset data are a powerful force in influencing policy (Krupski, 2004), and integrating AOD treatment data with the official
records held by relevant State agencies can be an alternative or supplement to obtaining encounter data via primary data collection that relies on sometimes unreliable self-reports. The following resources are suggested as examples of what States and field researchers have done to demonstrate the larger societal cost savings attributable to substance abuse treatment. Frequently, these studies have relied on the integration of client AOD data and administrative data from other State agencies to obtain relevant information on societal cost savings. The ability to routinely and cost-effectively document these cost savings is a major selling point in obtaining the resources needed to develop the infrastructure for data-integration systems and projects. The technical advisory group members advising the development of this document wanted to ensure that the utility of data-integration technologies for capturing ongoing funding was noted in this technical appendix.
Aos, S. (2004). Washington State’s family integrated transitions program for juvenile offenders: Outcome evaluation and benefit-cost analysis. Olympia, WA: Washington State Institute for Public Policy.
Aos, S., Lieb, R., Mayfield, J., Miller, M., & Pennucci, A. (2004). Benefits and costs of prevention and early intervention programs for youth (technical appendix). Olympia, WA: Washington State Institute for Public Policy.
Aos, S., Phipps, P., & Barnoski, R. (2004). Washington’s drug offender sentencing alternative: An evaluation of benefits and costs. Olympia, WA: Washington State Institute for Public Policy.
Belenko, S., Patapis, N., & French, M. T. (2005). Economic benefits of drug treatment: A critical review of the evidence for policy makers. Philadelphia: Treatment Research Institute, University of Pennsylvania.
Cartwright, W. S. (2005). Bibliography: Economics of drug abuse treatment services. Bethesda, MD: National Institute on Drug Abuse.
��
Appendix I
*Estee, S., & Norlund, D. J. (2003). Washington State Supplemental Security Income (SSI) Cost Offset Pilot Project: 2002 progress report. Olympia, WA: Washington State Department of Social and Human Services.
Ettner, S. L., Huang, D., Evans, E., Rose, D. A., Hardy, M., Jourabchi, M., & Hser, Y. (2006). Cost-offset in the California Treatment Outcome Project (CalTOP): Does substance abuse treatment ‘pay for itself’? Health Services Research, 41(1), 192–213.
Finigan, M. (1996). Societal outcomes of drug and alcohol treatment in the state of Oregon. Salem, OR: Oregon Office of Alcohol and Drug Abuse Programs.
French, M. T., Salomé, H. J., Sindelar, J. L., & McLellan, A. T. (2002). Benefit-cost analysis of addiction treatment: Methodological guidelines and application using the DATCAP and ASI. Health Services Research, 37(2),433–455.
Gerstein, D. R., Johnson, R. A., Harwood, H., Fountain, D. F., Suter, N., & Mallory, K. (1994). Evaluating recovery services: The California Drug and Alcohol Treatment Assessment (CALDATA) (Contract No. 92-001100). Sacramento, CA: State of California, Health and Welfare Agency, Department of Alcohol and Drug Programs.
**Harwood, H., Malhotra, D., Villarivera, C., Liu, C., Chong, U., & Gilani, J. (2002). Cost effectiveness and cost benefit analysis of substance abuse treatment: A literature review. Rockville, MD: Substance Abuse and Mental Health Services Administration.
MD: Substance Abuse and Mental Health Services Administration.
**Harwood, H., Malhotra, D., Villarivera, C. Liu, C., Chong, U., & Gilani, J. (2002). Cost effectiveness and cost benefit analysis of substance abuse treatment: An annotated bibliography. Rockville,
Koening, L., Denmead, G., Nguyen, R., Harrison, M., & Harwood, H. (1999). The costs and benefits of substance abuse treatment: Findings from the National Treatment Improvement Evaluation Study (NTIES). Rockville, MD: Substance Abuse and Mental Health Services Administration.
McVray, D., Schiraldi, V., & Ziedenberg, J. (2004). Treatment or incarceration? National and state findings on the efficacy and cost savings of drug treatment versus imprisonment. Washington, DC: Justice Policy Institute.
National Center on Addiction and Substance Abuse (CASA) at Columbia University. (2001). Shoveling up: The impact of substance abuse on state budgets. New York: Author.
E. Summary Over the last several years, the availability of user-friendly, low-cost or public domain software has dramatically reduced the cost and technical barriers to effective State use of data-deduplication and data-linking routines. As a result, States can now use such software for unique client counts and client-outcome analyses that were simply not feasible for the average State agency just a few years ago. The intent of this technical appendix is to help States move to a practical understanding of the steps and technical considerations involved in client data deduplication and data linking.
States can begin using data-deduplication and data-linking software initially to obtain unique client counts and to evaluate the effectiveness of its client identifiers. States
*References and links to additional cost offset studies from Washington State are provided at the following Intranet address: http://www1.dshs.wa.gov/dasa/services/research/reports.shtml **In addition to these resources, various analytic summaries and fact sheets developed for SAMHSA/CSAT under the National Evaluation Data Services (NEDS) contract are also suggested resources. These may be found online at http://www.icpsr.umich.edu/SAMHDA/NTIES/ebmindex.html
��

Integrating State Administrative Records To Manage Substance Abuse Treatment System Performance
can begin these analyses now to gain experience with the protocols. Starting with data-deduplication and client-identifier analysis is useful because such analyses require no interagency agreements or reviews. Once a State
agency is comfortable with the deduplication procedures (and once all necessary data-sharing agreements are implemented), the AOD treatment agency can embark on client data-linking analyses with partner agencies.
��

Appendix II. Technical Advisory Group Members, Center for Substance Abuse Treatment, Administrative Data Analysis Issues and Techniques
State Treatment and Research Experts Amelia M. Arria, Ph.D. Deputy Director of Research Center for Substance Abuse Research (CESAR) College Park, MD
Yih-Ing Hser, Ph.D. Adjunct Professor UCLA Integrated Substance Abuse Programs Los Angeles, CA
Robert L. Hubbard, Ph.D., M.B.A. Institute Director National Development and Research Institutes (NDRI) Raleigh, NC
Antoinette Krupski, Ph.D. Research Administrator Washington State Division of Alcohol and Substance Abuse Olympia, WA
Tracy Leeper, M.A. Grant Projects Manager Oklahoma Department of Mental Health and Substance Abuse Services Oklahoma City, OK
Bill Luchansky, Ph.D. Vice President Looking Glass Analytics Olympia, WA
Peter Luongo, Ph.D. Director Alcohol & Drug Abuse Administration Maryland Department of Health and Mental Hygiene Catonsville, MD
Dennis McCarty, Ph.D. Department of Public Health and Preventive Medicine Oregon Health Sciences University Portland, OR
Minakshi Tikoo, Ph.D. Acting Director Department of Mental Health, Mental Retardation & Substance Abuse Services Richmond, VA
Federal Representatives Joan Dilonardo, Ph.D. Branch Chief Division of Services Improvement Center for Substance Abuse Treatment Substance Abuse and Mental Health Services Administration Rockville, MD
Javaid Kaiser, Ph.D. Branch Chief Data Infrastructure Branch Division of State and Community Assistance Center for Substance Abuse Treatment Substance Abuse and Mental Health Services Administration Rockville, MD
�7
Integrating State Administrative Records To Manage Substance Abuse Treatment System Performance
Hal C. Krause, M.P.A. Public Health Analyst Division of State and Community Assistance Center for Substance Abuse Treatment Substance Abuse and Mental Health Services Administration Rockville, MD
Rita Vandivort-Warren, M.S.W. Public Health Analyst Division of Services Improvement Center for Substance Treatment Substance Abuse and Mental Health Services Administration Rockville, MD
Contractors Kazi Ahmed, Ph.D. PM TACC Technical Assistance Director JBS International, Inc. Silver Spring, MD
Susan Heil, Ph.D. PM TACC Project Director American Institutes for Research Silver Spring, MD
��
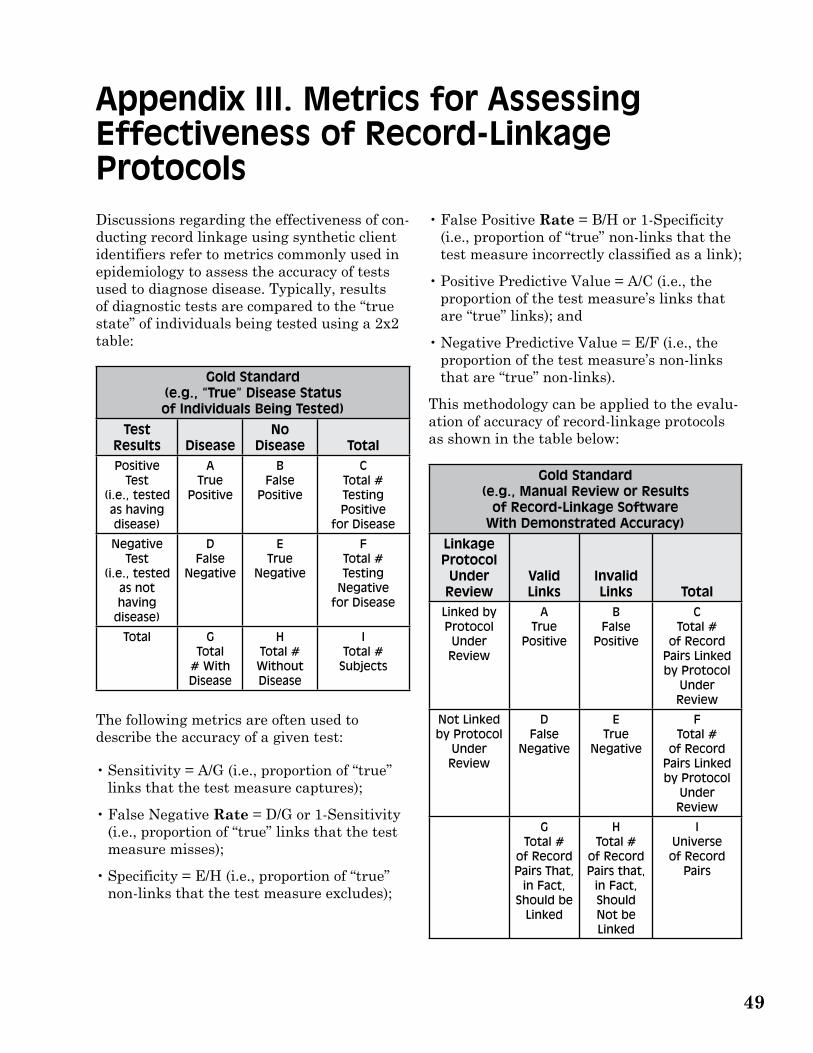
Appendix III. Metrics for Assessing Effectiveness of Record-Linkage Protocols Discussions regarding the effectiveness of conducting record linkage using synthetic client identifiers refer to metrics commonly used in epidemiology to assess the accuracy of tests used to diagnose disease. Typically, results of diagnostic tests are compared to the “true state” of individuals being tested using a 2x2 table:
Gold Standard (e.g., “True” Disease Status of Individuals Being Tested)
Test Results Disease
No Disease Total
Positive Test
(i.e., tested as having disease)
A True
Positive
B False
Positive
C Total # Testing Positive
for Disease
Negative Test
(i.e., tested as not having
disease)
D False
Negative
E True
Negative
F Total # Testing
Negative for Disease
Total G Total
# With Disease
H Total # Without Disease
I Total #
Subjects
The following metrics are often used to describe the accuracy of a given test:
• Sensitivity = A/G (i.e., proportion of “true” links that the test measure captures);
• False Negative Rate = D/G or 1-Sensitivity (i.e., proportion of “true” links that the test measure misses);
• Specificity = E/H (i.e., proportion of “true” non-links that the test measure excludes);
• False Positive Rate = B/H or 1-Specificity (i.e., proportion of “true” non-links that the test measure incorrectly classified as a link);
• Positive Predictive Value = A/C (i.e., the proportion of the test measure’s links that are “true” links); and
• Negative Predictive Value = E/F (i.e., the proportion of the test measure’s non-links that are “true” non-links).
This methodology can be applied to the evaluation of accuracy of record-linkage protocols as shown in the table below:
Gold Standard (e.g., Manual Review or Results
of Record-Linkage Software With Demonstrated Accuracy)
Linkage Protocol Under Review
Valid Links
Invalid Links Total
Linked by Protocol Under Review
A True
Positive
B False
Positive
C Total #
of Record Pairs Linked by Protocol
Under Review
Not Linked by Protocol
Under Review
D False
Negative
E True
Negative
F Total #
of Record Pairs Linked by Protocol
Under Review
G Total #
of Record Pairs That,
in Fact, Should be
Linked
H Total #
of Record Pairs that,
in Fact, Should Not be Linked
I Universe of Record
Pairs
�9
Integrating State Administrative Records To Manage Substance Abuse Treatment System Performance
Note that record pairs falling into cells A, B, C, D, and G are readily identified through comparison of linkages found by the Gold Standard and the Linkage Protocol Under Review.
• Cell A represents record pairs found by both protocols. These “true positive” represent the number of record pairs that the Protocol Under Review correctly linked.
• Cell B contains record pairs found by the Linkage Protocol Under Review but not the Gold Standard. These “false positive” represent the number of record pairs that the Protocol Under Review incorrectly linked.
• Cell C represents the total number of record pairs linked by the Protocol Under Review.
• Cell D contains record pairs found by the Gold Standard but not the Linkage Protocol Under Review. These “false negative”
represent the number of record pairs that the Protocol Under Review incorrectly failed to capture.
• Cell G represents the total number of record pairs linked by the Gold Standard.
Record pairs falling into cells E, F, H, and I are not readily identified through comparison of linkages found by the Gold Standard and the Linkage Protocol Under Review because the output of linkage protocols contains only linked records and not the multitude of record pairs that were correctly classified as non-links. The contents of these cells can be calculated;1 however, adequate assessment of accuracy of the Linkage Protocol Under Review can be made without such calculations. Arguably, sensitivity (A/G) and positive predictive value (A/C) will provide interested parties with information necessary to determine the usefulness of a given record-linkage protocol.
1When unduplicating a single data set, cell I (the total number of distinct pairs of records in the sample data set) is calculated as n!/2!(n-2)! where n is the number of records in the data set. Cells E, F, and G can then be calculated as F=I-C, H-I=G, E=B-H. When linking 2 data sets without deduplicating either, cell I is calculated as n1*n2 where n1 and n2 represent the number of records in the data sets being linked.
�0

Other Technical Assistance Publications (TAPs) include:
TAP 1 Approaches in the Treatment of Adolescents with Emotional and Substance Abuse Problems PHD580
TAP 2 Medicaid Financing for Mental Health and Substance Abuse Services for Children and Adolescents PHD581
TAP 3 Need, Demand, and Problem Assessment for Substance Abuse Services PHD582 TAP 4 Coordination of Alcohol, Drug Abuse, and Mental Health Services PHD583 TAP 5 Self-Run, Self-Supported Houses for More Effective Recovery from Alcohol and Drug Addiction
PHD584 TAP 6 Empowering Families, Helping Adolescents: Family-Centered Treatment of Adolescents with
Alcohol, Drug Abuse, and Mental Health Problems BKD81 TAP 7 Treatment of Opiate Addiction With Methadone: A Counselor Manual BKD151 TAP 8 Relapse Prevention and the Substance-Abusing Criminal Offender BKD121 TAP 9 Funding Resource Guide for Substance Abuse Programs BKD152 TAP 10 Rural Issues in Alcohol and Other Drug Abuse Treatment PHD662 TAP 11 Treatment for Alcohol and Other Drug Abuse: Opportunities for Coordination PHD663 TAP 12 Approval and Monitoring of Narcotic Treatment Programs: A Guide on the Roles of Federal and
State Agencies PHD666 TAP 13 Confidentiality of Patient Records for Alcohol and Other Drug Treatment BKD156 TAP 14 Siting Drug and Alcohol Treatment Programs: Legal Challenges to the NIMBY Syndrome
BKD175 TAP 15 Forecasting the Cost of Chemical Dependency Treatment Under Managed Care: The Washington
State Study BKD176 TAP 16 Purchasing Managed Care Services for Alcohol and Other Drug Abuse Treatment: Essential
Elements and Policy Issues BKD167 TAP 17 Treating Alcohol and Other Drug Abusers in Rural and Frontier Areas BKD174 TAP 18 Checklist for Monitoring Alcohol and Other Drug Confidentiality Compliance PHD722 TAP 19 Counselor’s Manual for Relapse Prevention With Chemically Dependent Criminal Offenders
PHD723 TAP 20 Bringing Excellence to Substance Abuse Services in Rural and Frontier America BKD220 TAP 21 Addiction Counseling Competencies: The Knowledge, Skills, and Attitudes of Professional
Practice (SMA) 07-4171 TAP 21A Competencies for Substance Abuse Treatment Clinical Supervisors (SMA) 07-4243 TAP 22 Contracting for Managed Substance Abuse and Mental Health Services: A Guide for Public
Purchasers BKD252 TAP 23 Substance Abuse Treatment for Women Offenders: Guide to Promising Practices BKD310 TAP 24 Welfare Reform and Substance Abuse Treatment Confidentiality: General Guidance for
Reconciling Need to Know and Privacy BKD336 TAP 25 The Impact of Substance Abuse Treatment on Employment Outcomes Among AFDC Clients in
Washington State BKD367 TAP 26 Identifying Substance Abuse Among TANF-Eligible Families BKD410 TAP 27 Navigating the Pathways: Lessons and Promising Practices in Linking Alcohol and Drug
Services with Child Welfare BKD436 TAP 28 The National Rural Alcohol and Drug Abuse Network Awards for Excellence 2004, Submitted
and Award-Winning Papers BKD552 TAP 29 Integrating State Administrative Records To Manage Substance Abuse Treatment System
Performance (SMA) 07-4268
Other TAPs may be ordered by contacting the National Clearinghouse for Alcohol and Drug Information (NCADI), (800) 729-6686 or (240) 221-4017; TDD (for hearing impaired) (800) 487-4889.

DHHS Publication No. (SMA) 07-4268 Substance Abuse and Mental Health Services Administration Printed 2007