Integrating Sea Level Rise and Storm Surges in Local … sea level rise and storm surges in ......
18
Integrating Sea Level Rise and Storm Surges in Local Planning October 2017
Transcript of Integrating Sea Level Rise and Storm Surges in Local … sea level rise and storm surges in ......
Integrating Sea Level Rise and Storm Surges in Local PlanningOctober 2017

ISBN: ISBN 978-82-7768-447-5 (PDF)
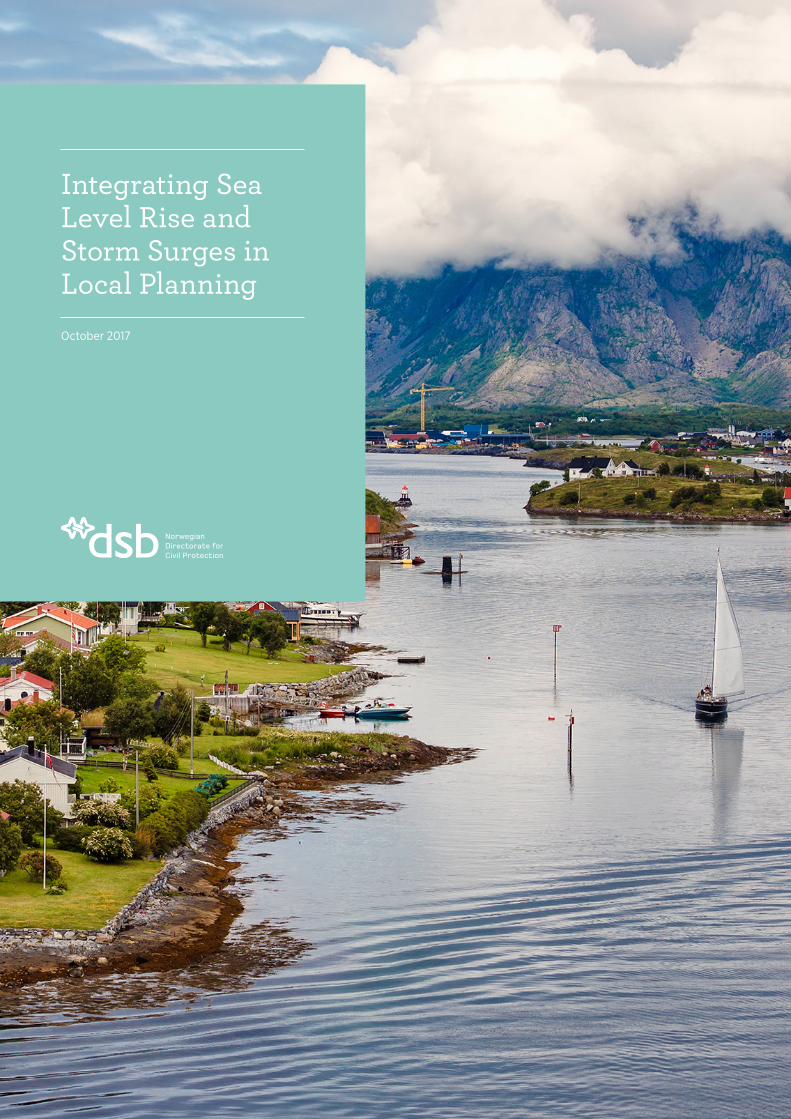
Front cover photo: Norway's total coastline is approximately 100,000 km long, including all fjords, inlets, islands, etc. Photo: Colourbox.com Layout and print: Erik Tanche Nilssen AS, Skien
Published by: Norwegian Directorate for Civil Protection Rambergveien 93115 Tønsberg, Norway Phone 33 41 25 00Fax 33 31 06 60 [email protected]
Integrating Sea Level Rise and Storm Surges in Local Planning
October 2017

2 INTEGRATING SEA LEVEL RISE AND STORM SURGES IN LOCAL PLANNING
3INTEGRATING SEA LEVEL RISE AND STORM SURGES IN LOCAL PLANNING
CO NTE NT S
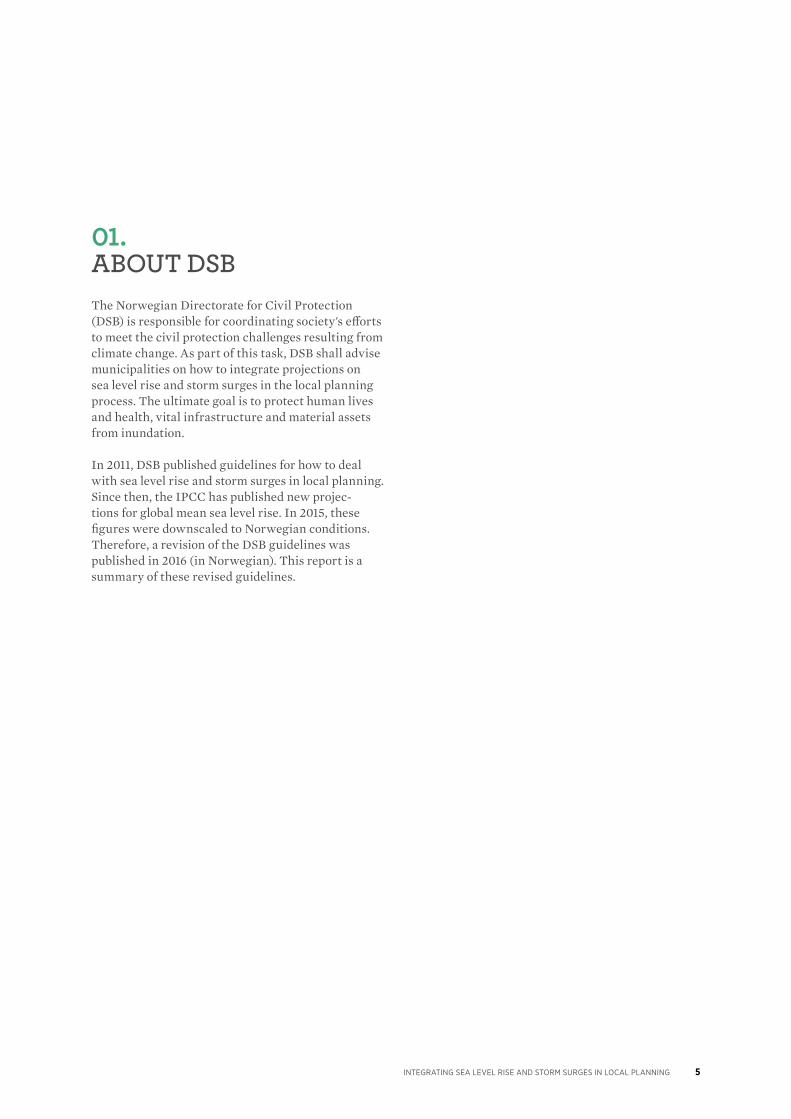
01 About DSB ........................................................................................................................................................................................................................ 05
02 A Coastal Country .................................................................................................................................................................................................. 06
03 Sea Level Rise in Norway.................................................................................................................................................................................. 07 04 Integrating Sea Level Rise in Municipal Planning .................................................................................................................. 08
05 Calculating Planning Levels .......................................................................................................................................................................... 11
06 Presenting the Data ................................................................................................................................................................................................ 13
07 List of Resources ........................................................................................................................................................................................................ 15

5INTEGRATING SEA LEVEL RISE AND STORM SURGES IN LOCAL PLANNING
01. ABOUT DSBThe Norwegian Directorate for Civil Protection (DSB) is responsible for coordinating society's efforts to meet the civil protection challenges resulting from climate change. As part of this task, DSB shall advise municipalities on how to integrate projections on sea level rise and storm surges in the local planning process. The ultimate goal is to protect human lives and health, vital infrastructure and material assets from inundation.
In 2011, DSB published guidelines for how to deal with sea level rise and storm surges in local planning. Since then, the IPCC has published new projec-tions for global mean sea level rise. In 2015, these figures were downscaled to Norwegian conditions. Therefore, a revision of the DSB guidelines was published in 2016 (in Norwegian). This report is a summary of these revised guidelines.
6 INTEGRATING SEA LEVEL RISE AND STORM SURGES IN LOCAL PLANNING
02. A COASTAL COUNTRYIt is generally believed that the name 'Norway' is derived from Old Norse norđvegr (the way northwards), referring to the sailing route along the Norwegian coast. In other words, Norway always has been, and still is, primarily a coastal nation.
Including all fjords, inlets, islands, etc., Norway's total coastline is approximately 100,000 km long. Of the country's 5.3 million inhabitants, about 75 % live along the coast. All major cities are coastal communi-ties. Of the country's 426 municipalities, 280 have a coastline. See map on page 14.
However, most of the coastline is rocky and often steep. In many places, only a narrow strip of land lies lower than two meters above sea level, although a lot of commercial and cultural heritage infrastructure is located within this zone.
A recent study of low-lying buildings in Norway showed that approximately 5 % of garages and residential buildings and about 8 % of industrial and storage buildings were below 1 m above today's sea level. Finally, there is considerable ongoing development of former shipyards and port areas into housing, retail and office space. All in all, Norway is considered to be at a relatively low risk of widespread impact from sea level rise and storm surges; partially due to its generally "favourable" topography, but also to post-glacial land uplift that offsets sea level rise in parts of the country. Nevertheless, due to the increasing concentration of the population in coastal urban areas and the long-term nature of many near-sea level infrastructure investments, it is crucial for Norway to develop a framework for integrating the IPCC projections into local and regional planning.
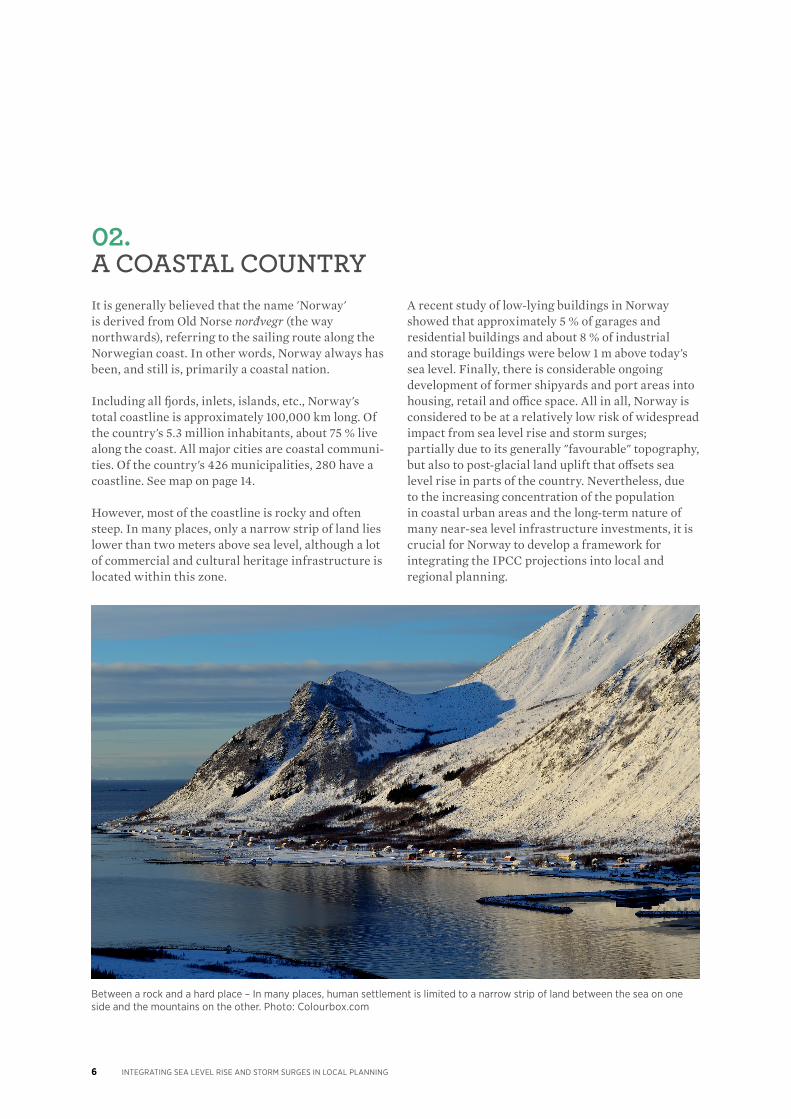
Between a rock and a hard place – In many places, human settlement is limited to a narrow strip of land between the sea on one side and the mountains on the other. Photo: Colourbox.com
7INTEGRATING SEA LEVEL RISE AND STORM SURGES IN LOCAL PLANNING
03. SEA LEVEL RISE IN NORWAY There are several causes of sea level rise – the main ones being the expansion of ocean water due to increasing temperature and mass input from melting land ice (glaciers, Greenland and Antarctic ice sheets). In Norway, as throughout all of Fennoscandia, sea-level rise is to varying degrees offset by the still ongoing post-glacial uplift after the last ice age.
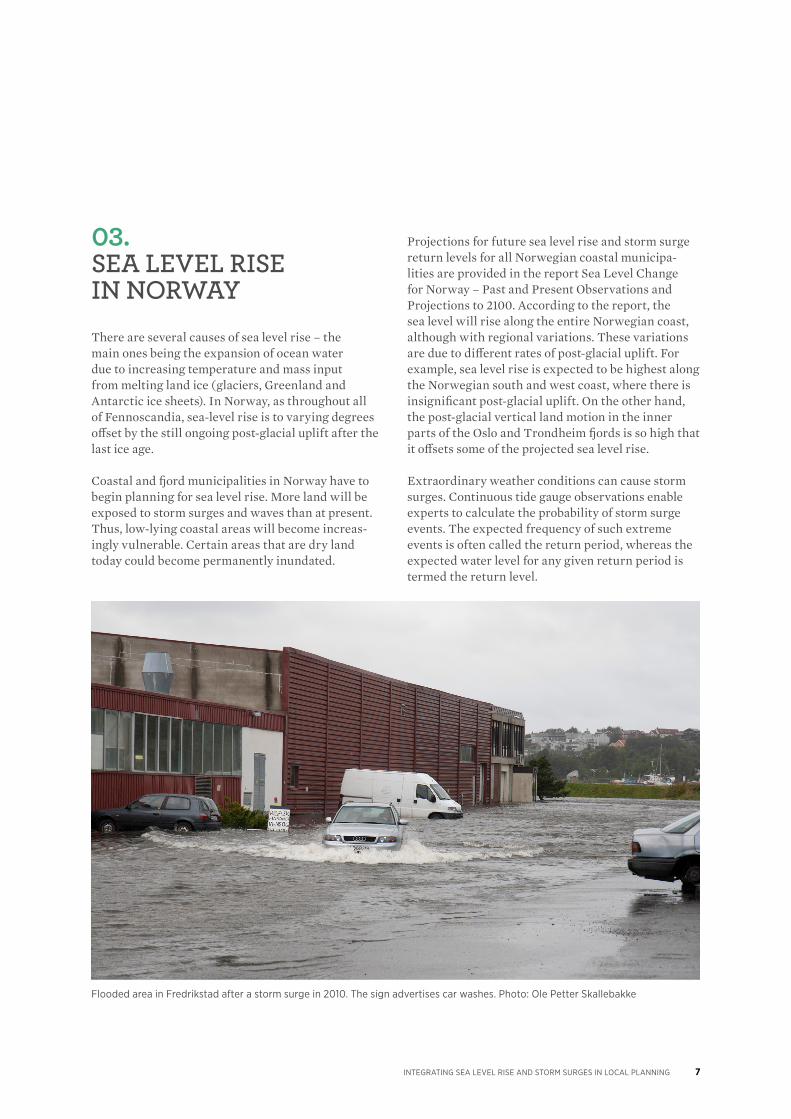
Coastal and fjord municipalities in Norway have to begin planning for sea level rise. More land will be exposed to storm surges and waves than at present. Thus, low-lying coastal areas will become increas-ingly vulnerable. Certain areas that are dry land today could become permanently inundated.
Projections for future sea level rise and storm surge return levels for all Norwegian coastal municipa-lities are provided in the report Sea Level Change for Norway – Past and Present Observations and Projections to 2100. According to the report, the sea level will rise along the entire Norwegian coast, although with regional variations. These variations are due to different rates of post-glacial uplift. For example, sea level rise is expected to be highest along the Norwegian south and west coast, where there is insignificant post-glacial uplift. On the other hand, the post-glacial vertical land motion in the inner parts of the Oslo and Trondheim fjords is so high that it offsets some of the projected sea level rise.
Extraordinary weather conditions can cause storm surges. Continuous tide gauge observations enable experts to calculate the probability of storm surge events. The expected frequency of such extreme events is often called the return period, whereas the expected water level for any given return period is termed the return level.
Flooded area in Fredrikstad after a storm surge in 2010. The sign advertises car washes. Photo: Ole Petter Skallebakke
8 INTEGRATING SEA LEVEL RISE AND STORM SURGES IN LOCAL PLANNING
Statistical calculations of storm surge events are based on historical data, and do not consider the effects of climate change, since current climate models are not reliable enough when it comes to predicting future changes in storms and low-pres-sure patterns. Storm surge levels that are relatively frequent today, but which often have little impact, will cause more flooding in the future as a result of sea level rise.
In cooperation with the national Meteorological Institute, the Norwegian Mapping Authority publishes observed water level data, tide tables and 5-day tidal forecasts on its website http://www.kartverket.no/en/sehavniva/
04. INTEGRATING SEA LEVEL RISE IN MUNICIPAL PLANNINGA number of regulatory instruments ensure the inclusion of sea level rise considerations in muni-cipal planning. Essentially, there are two "points of entry" for intervention by local authorities: regu-lations that cover already existing buildings and infrastructure as well as those that regulate the planning and construction of new buildings and infrastructure.
EXISTING BUILDINGS AND INFRASTRUCTUREAccording to the Norwegian Civil Protection Act, "[… ] municipalities are obliged to identify and assess potential hazards, including their probability and subsequent impact on the local community. The results of such an analysis are to be presented in a comprehen-sive risk and vulnerability assessment. These assess-ments shall be used as a basis for municipalities' civil protection work […]"
Thus, sea level rise and storm surges must also be considered as a potential hazard by all coastal communities. However, beyond this requirement to develop and maintain an overview of hazards, municipalities so far have limited leverage when it comes to imposing measures on existing buildings and infrastructure assessed as being vulnerable. Even when protective or adaptive measures cannot be implemented, it is essential to include inundation from storm surges/sea level rise in municipal contingency plans.
Storm surge
A storm surge is caused by a combination of low pressure and strong winds that push the sea water towards the coast. Around new moon and full moon, when the Sun, Moon, and Earth form a line, the tidal forces of the sun and the moon are reinforced. This is called the spring tide, and the high tides are at a maximum. When a storm surge coincides with a spring tide, water levels can thus be even higher.
Return period
The return period of a storm surge refers to the average amount of time between a specific sea level being exceeded at a particular location. However, '200-year return period' does not necessarily mean that the event occurs once every 200 years. Rather, it can be thought of having a 1/200 (0.5 %) chance of occurring in any given year, regardless of when the last similar event was.
9INTEGRATING SEA LEVEL RISE AND STORM SURGES IN LOCAL PLANNING
A recent survey conducted among all of Norway's coastal and fjord municipalities showed that 75 % of the responding municipalities had included storm surges combined with sea level rise among the hazards considered in their risk and vulnerabi-lity assessments. However, the municipalities also underlined that they primarily see this hazard as a planning challenge – to be met through appropriate spatial planning, zoning ordinances, etc. Thus, consi-dering the long-term nature of the issue at hand, the most important focus is presumably to include these considerations in the municipal planning process.
PLANNING FUTURE DEVELOPMENTRegarding general risk assessments in connection with preparing development plans, the Norwegian Planning and Building Act states that "… the planning authority shall make sure that a risk and vulnerability assessment is carried out for the planning area." Such an assessment should "… show all the risk and vulne-rability factors of significance for determining whether the land is suitable for development purposes […] Areas where there is a danger, risk or vulnerability shall be indicated in the plan as an area requiring special consideration."
Areas facing the risk of temporary or permanent inundation from sea level rise and storm surges are thus covered by this section.
When it comes to granting building permits, the Norwegian building code (TEK17) is very specific, stating in §7.2 that:
(1) Structures that would suffer particularly severe consequences due to flooding shall not be sited in areas prone to flooding.
(2) The flood safety category of structures in areas prone to flooding shall be stipulated. Structures shall be sited, designed or protected against flooding such that the largest nominal annual probability (return period) in the table below is not exceeded.
The three flood safety categories are linked to the degree of impact (e.g., value and societal importance of building(s) in question), which in turn is linked to increasing return periods. In other words, the more vital a building, the lower the risk of inundation should be.
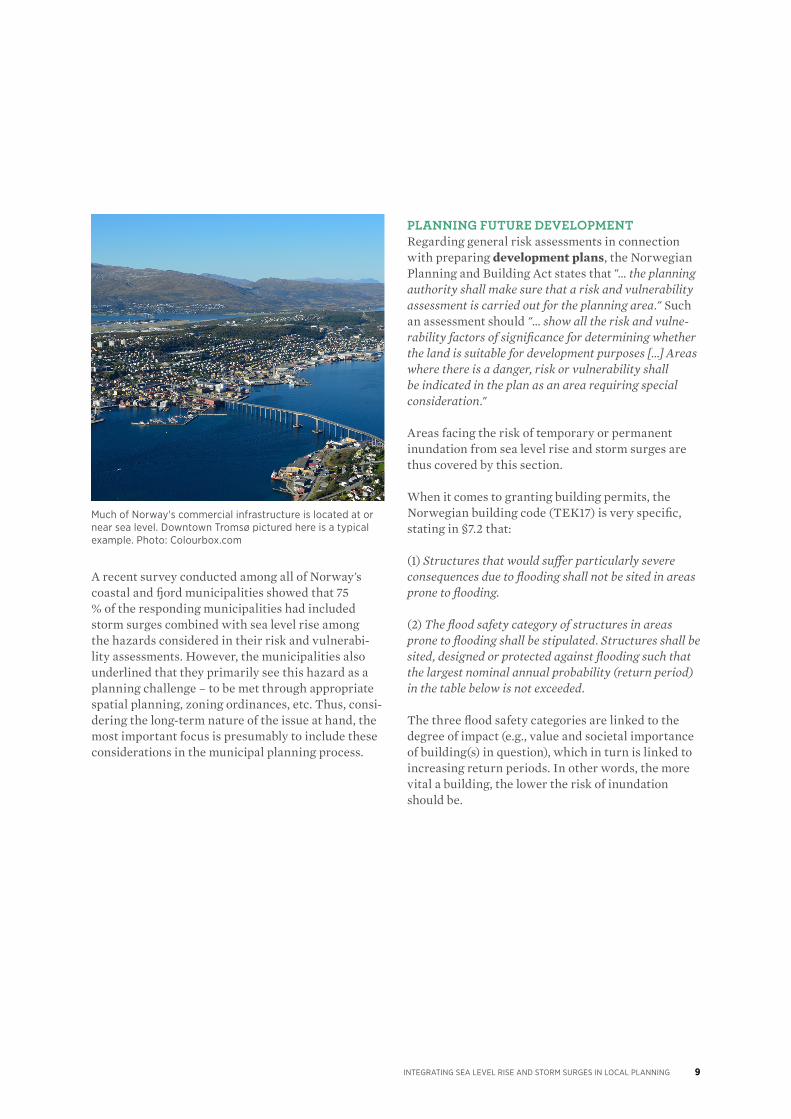
Much of Norway's commercial infrastructure is located at or near sea level. Downtown Tromsø pictured here is a typical example. Photo: Colourbox.com
10 INTEGRATING SEA LEVEL RISE AND STORM SURGES IN LOCAL PLANNING
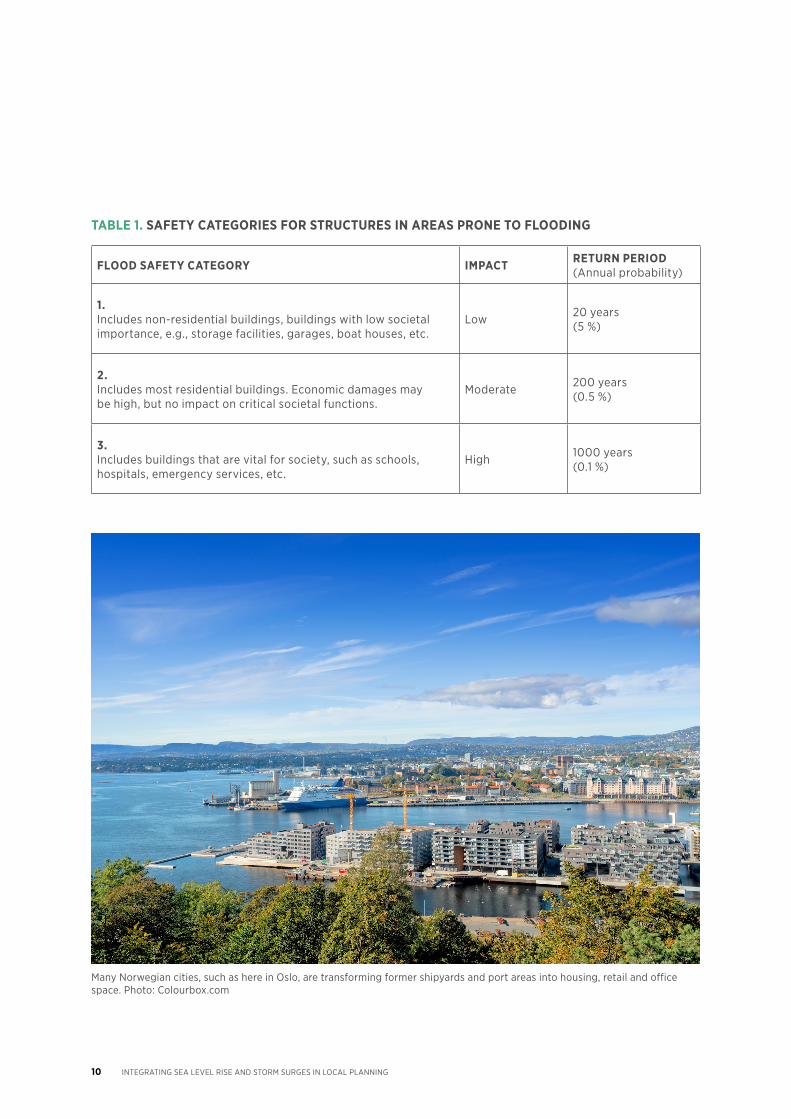
FLOOD SAFETY CATEGORY IMPACT RETURN PERIOD(Annual probability)
1. Includes non-residential buildings, buildings with low societal importance, e.g., storage facilities, garages, boat houses, etc.
Low 20 years (5 %)
2. Includes most residential buildings. Economic damages may be high, but no impact on critical societal functions.
Moderate 200 years (0.5 %)
3. Includes buildings that are vital for society, such as schools, hospitals, emergency services, etc.
High 1000 years (0.1 %)
Many Norwegian cities, such as here in Oslo, are transforming former shipyards and port areas into housing, retail and office space. Photo: Colourbox.com
TABLE 1. SAFETY CATEGORIES FOR STRUCTURES IN AREAS PRONE TO FLOODING
11INTEGRATING SEA LEVEL RISE AND STORM SURGES IN LOCAL PLANNING
RISK AND VULNERABILITY ASSESSMENTSThe Civil Protection Act states that comprehensive risk and vulnerability assessments are to form the basis for municipalities' civil protection work, "[…] including planning and permitting procedures, pursuant to the Planning and Building Act [emphasis added]."
In other words, if coastal flooding from storm surges and/or sea level rise is identified as a potential hazard for a specific planning area or object, the local autho-rities can require certain (flood-protection) stan-dards to be met before granting building permits.
HAZARD MAPPINGMunicipal planners use maps to detail the potential risks of different sea level rise/storm surge scenarios. Depending on the phase of the planning process in question, such maps can range from rather large-scale mapping of potential hazards to detailed risk maps that can be used to prioritize specific preven-tive measures.
MEETING THE CHALLENGESCase studies of Norwegian coastal communities re- vealed a number of measures that municipalities can implement to counter or mitigate the threat from sea level rise and storm surges. In addition to the initial mapping and assessment of the potential hazards and the development of appropriate contingency plans, most measures fall into two categories: either "plan-ning" or "municipal engineering".
Planning-related measures are often linked to requirements, such as the compulsory assessment of storm surge hazard, including future sea level rise, minimum flood construction levels and being able to document sufficient protection against wave impact and water intrusion. In a longer-term perspective, rezoning enables the relocation of infrastructure from increasingly flood-prone areas.
Municipal engineering measures include eleva-ting roadbeds, designing buildings/structures that tolerate water intrusion, relocating houses, installing check valves to prevent backflow and moving elec-trical installations above the flood zone.
05. CALCULATING PLANNING LEVELS Although projections of future storm surge and sea levels are (well-founded) estimates and thus uncer-tain, municipalities need agreed-upon figures for their mid- and long-term planning. Also, having such a long and varied coastline, Norway needs a cohe-rent approach to this issue to ensure that planners in different parts of the country are on the same page.
Projections for future sea level rise will naturally vary, depending on such factors as choice of IPCC climate change scenario and time horizon. In order to harmonize the data used for planning across all municipalities, the projected sea level rise figures presented in the guidelines are based on the following parameters:
Storm surge levelsMean return levels are shown for the 20-year, 200-year and 1000-year return periods. To facilitate the use of these figures in municipal planning, the storm surge return periods were harmonized with the return periods used in the flood safety categories of the Norwegian Building Code (TEK17).
Greenhouse gas emission scenarioThe guidelines recommend using the sea level rise projections for 2081-2100, based on the IPCC's RCP8.5 scenario. By using this 'worst case' scenario (based on increasing GHG emissions), one is assured that the figures used in local planning are robust, in keeping with the precautionary principle.
To accommodate the uncertainty associated with the sea level rise projections, the guidelines furthermore recommend using the 95th percentile of the projec-tions (instead of the mean values).
12 INTEGRATING SEA LEVEL RISE AND STORM SURGES IN LOCAL PLANNING
MEAN SEA LEVELMean sea level is the average sea level over a certain period, determined by regular observations through-out that period. Usually, a period of 19 years is preferred because the Earth, Moon and Sun’s relative positions repeat almost exactly once every 19 years, also known as the Metonic cycle. Today's "mean sea level" is based on the observations from the 1996-2014 cycle.
TIME HORIZONSo far, the IPCC has only issued sea level rise projec-tions until 2100; thus the Norwegian guidelines recommend to use the 2081-2100 figures for plan-ning purposes. However, the IPCC states that it is "virtually certain that global mean sea level rise will continue for many centuries beyond 2100, with the amount of rise dependent on future emissions".
LOCAL CONDITIONSLocal factors such as wave impact or a city's location on a river mouth should also be considered when planning the development of coastal infrastructure.
Wave impact is determined by wind, currents and topography. Since the climate projections do not indicate any significant changes in wind conditions, there is considerable uncertainty regarding any changes in coastal wave impact. Thus, the sea level rise guidelines do not include wave projections. It is nevertheless important to include local knowledge about present-day wind and wave conditions in planning.
Areas on or near river mouths can be extra suscep-tible to flooding, especially in a situation where a storm surge and a fluvial flood coincide. Although these events are not linked, a concurrent river flood would raise the flood level above the projected storm surge levels. The Norwegian Water Resources and Energy Directorate publishes flood maps that take the combined effect of storm surge and fluvial flood into consideration.
13INTEGRATING SEA LEVEL RISE AND STORM SURGES IN LOCAL PLANNING
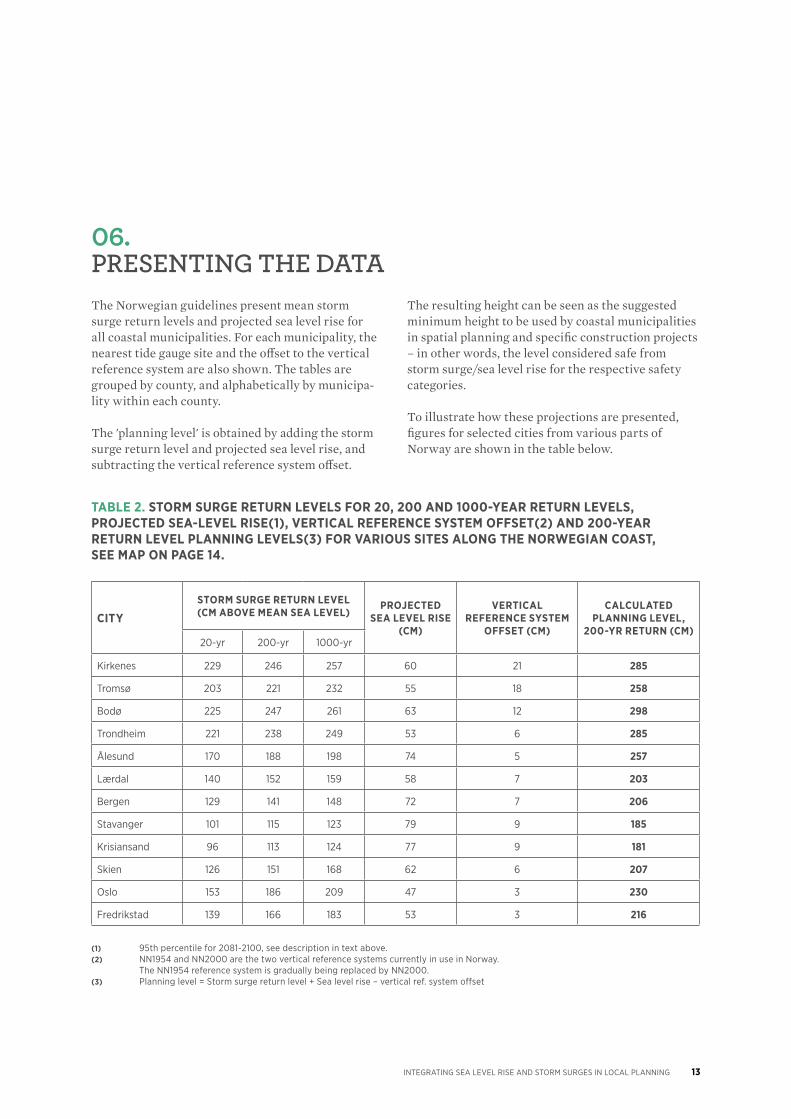
06. PRESENTING THE DATAThe Norwegian guidelines present mean storm surge return levels and projected sea level rise for all coastal municipalities. For each municipality, the nearest tide gauge site and the offset to the vertical reference system are also shown. The tables are grouped by county, and alphabetically by municipa-lity within each county.
The 'planning level' is obtained by adding the storm surge return level and projected sea level rise, and subtracting the vertical reference system offset.
The resulting height can be seen as the suggested minimum height to be used by coastal municipalities in spatial planning and specific construction projects – in other words, the level considered safe from storm surge/sea level rise for the respective safety categories.
To illustrate how these projections are presented, figures for selected cities from various parts of Norway are shown in the table below.
(1) 95th percentile for 2081-2100, see description in text above.(2) NN1954 and NN2000 are the two vertical reference systems currently in use in Norway. The NN1954 reference system is gradually being replaced by NN2000.(3) Planning level = Storm surge return level + Sea level rise – vertical ref. system offset
CITYSTORM SURGE RETURN LEVEL(CM ABOVE MEAN SEA LEVEL)
PROJECTED SEA LEVEL RISE
(CM)
VERTICAL REFERENCE SYSTEM
OFFSET (CM)
CALCULATED PLANNING LEVEL,
200-YR RETURN (CM)20-yr 200-yr 1000-yr
Kirkenes 229 246 257 60 21 285
Tromsø 203 221 232 55 18 258
Bodø 225 247 261 63 12 298
Trondheim 221 238 249 53 6 285
Ålesund 170 188 198 74 5 257
Lærdal 140 152 159 58 7 203
Bergen 129 141 148 72 7 206
Stavanger 101 115 123 79 9 185
Krisiansand 96 113 124 77 9 181
Skien 126 151 168 62 6 207
Oslo 153 186 209 47 3 230
Fredrikstad 139 166 183 53 3 216
TABLE 2. STORM SURGE RETURN LEVELS FOR 20, 200 AND 1000-YEAR RETURN LEVELS, PROJECTED SEA-LEVEL RISE(1), VERTICAL REFERENCE SYSTEM OFFSET(2) AND 200-YEAR RETURN LEVEL PLANNING LEVELS(3) FOR VARIOUS SITES ALONG THE NORWEGIAN COAST, SEE MAP ON PAGE 14.
14 INTEGRATING SEA LEVEL RISE AND STORM SURGES IN LOCAL PLANNING
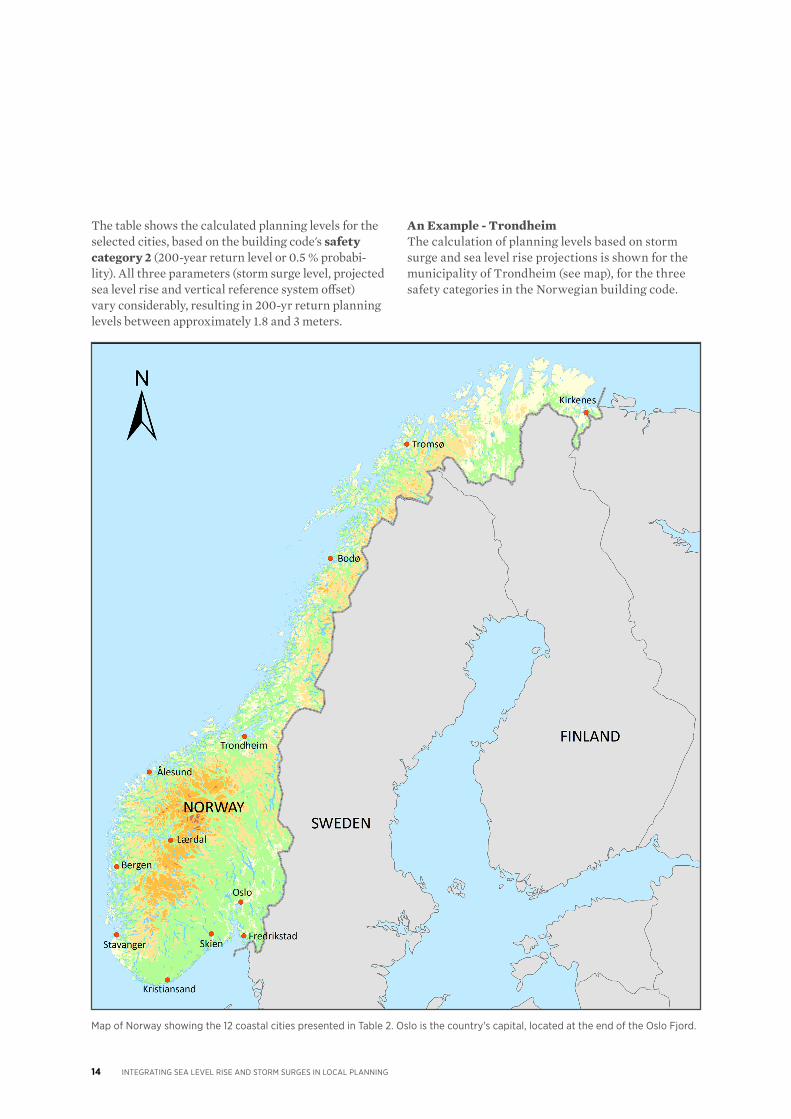
The table shows the calculated planning levels for the selected cities, based on the building code's safety category 2 (200-year return level or 0.5 % probabi-lity). All three parameters (storm surge level, projected sea level rise and vertical reference system offset) vary considerably, resulting in 200-yr return planning levels between approximately 1.8 and 3 meters.
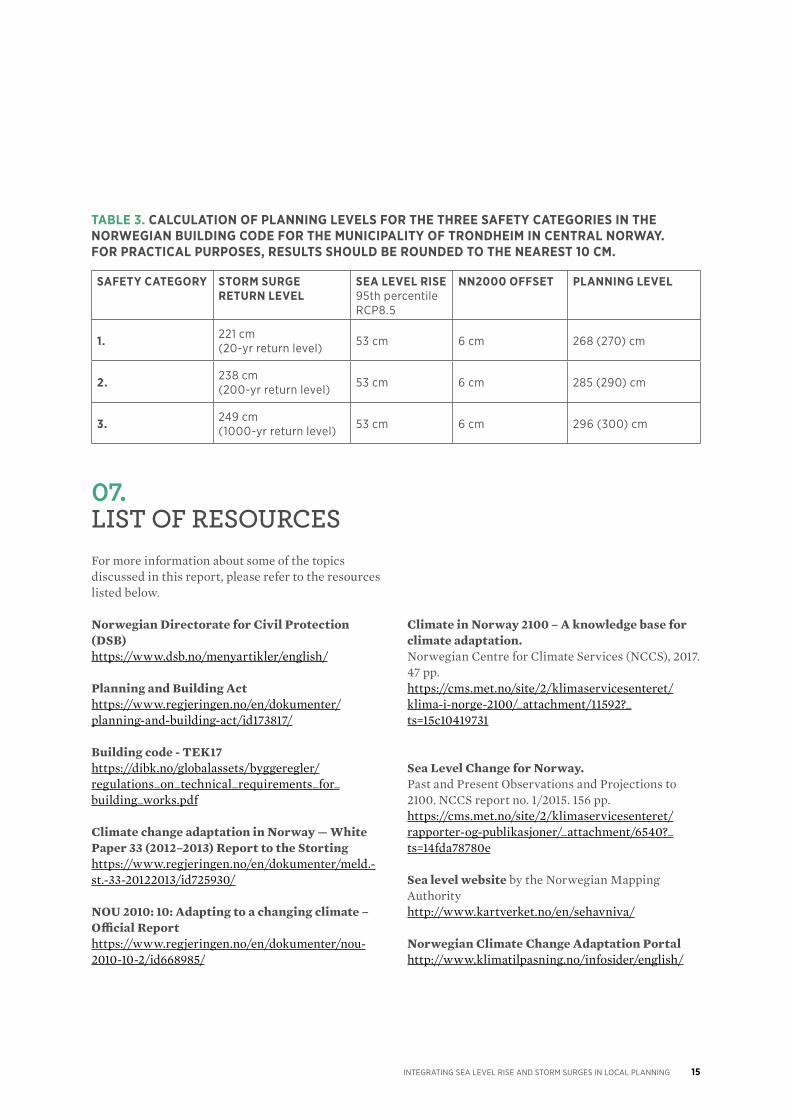
An Example - TrondheimThe calculation of planning levels based on storm surge and sea level rise projections is shown for the municipality of Trondheim (see map), for the three safety categories in the Norwegian building code.
Map of Norway showing the 12 coastal cities presented in Table 2. Oslo is the country's capital, located at the end of the Oslo Fjord.
15INTEGRATING SEA LEVEL RISE AND STORM SURGES IN LOCAL PLANNING
07. LIST OF RESOURCESFor more information about some of the topics discussed in this report, please refer to the resources listed below.
Norwegian Directorate for Civil Protection (DSB)https://www.dsb.no/menyartikler/english/
Planning and Building Acthttps://www.regjeringen.no/en/dokumenter/planning-and-building-act/id173817/
Building code - TEK17 https://dibk.no/globalassets/byggeregler/regulations_on_technical_requirements_for_building_works.pdf
Climate change adaptation in Norway — White Paper 33 (2012–2013) Report to the Storting https://www.regjeringen.no/en/dokumenter/meld.-st.-33-20122013/id725930/
NOU 2010: 10: Adapting to a changing climate – Official Report https://www.regjeringen.no/en/dokumenter/nou-2010-10-2/id668985/
Climate in Norway 2100 – A knowledge base for climate adaptation. Norwegian Centre for Climate Services (NCCS), 2017. 47 pp. https://cms.met.no/site/2/klimaservicesenteret/klima-i-norge-2100/_attachment/11592?_ts=15c10419731
Sea Level Change for Norway. Past and Present Observations and Projections to 2100. NCCS report no. 1/2015. 156 pp. https://cms.met.no/site/2/klimaservicesenteret/rapporter-og-publikasjoner/_attachment/6540?_ts=14fda78780e
Sea level website by the Norwegian Mapping Authority http://www.kartverket.no/en/sehavniva/
Norwegian Climate Change Adaptation Portalhttp://www.klimatilpasning.no/infosider/english/
SAFETY CATEGORY STORM SURGERETURN LEVEL
SEA LEVEL RISE95th percentile RCP8.5
NN2000 OFFSET PLANNING LEVEL
1. 221 cm (20-yr return level) 53 cm 6 cm 268 (270) cm
2. 238 cm (200-yr return level) 53 cm 6 cm 285 (290) cm
3. 249 cm (1000-yr return level) 53 cm 6 cm 296 (300) cm
TABLE 3. CALCULATION OF PLANNING LEVELS FOR THE THREE SAFETY CATEGORIES IN THE NORWEGIAN BUILDING CODE FOR THE MUNICIPALITY OF TRONDHEIM IN CENTRAL NORWAY. FOR PRACTICAL PURPOSES, RESULTS SHOULD BE ROUNDED TO THE NEAREST 10 CM.
ISBN 978-82-7768-447-5 (PDF) HR 2380October 2017
Norwegian Directorate for Civil Protection Rambergveien 93115 Tønsberg, Norway Phone 33 41 25 00Fax 33 31 06 60 [email protected]