Integrating occupancy modeling and camera-trap data … to camera-trap data and our results suggest...
15
Mongabay.com Open Access Journal - Tropical Conservation Science Vol.6 (6):781--795, 2013 Tropical Conservation Science | ISSN 1940-0829 | Tropicalconservationscience.org 781 Research Article Integrating occupancy modeling and camera-trap data to estimate medium and large mammal detection and richness in a Central American biological corridor Michael V. Cove 1,2 * R. Manuel Spínola 3 , Victoria L. Jackson 1 , Joel C. Sáenz 3 , and Olivier Chassot 4 1 Department of Biology and Earth Science, University of Central Missouri, Warrensburg, MO 64093, USA. Email: [email protected], [email protected]; 2 Selva Verde Lodge, Chilamate de Sarapiquí, Costa Rica, Central America; 3 Instituto Internacional en Conservación y Manejo de Vida Silvestre, Universidad Nacional, Apartado 1350-3000, Heredia, Costa Rica. Email: [email protected], [email protected]; 4 Centro Científico Tropical, Apartado 8-3870-1000 San José, Costa Rica. Email: [email protected] ; *Present Address of Corresponding author: NC Cooperative Fish and Wildlife Research Unit, Department of Applied Ecology, North Carolina State University. E-mail: [email protected] Abstract Noninvasive camera-traps are commonly used to survey mammal communities in the Neotropics. This study used camera-traps to survey medium and large mammal diversity in the San Juan – La Selva Biological Corridor, Costa Rica. The connectivity of the corridor is affected by the spread of large-scale agriculture, cattle ranching, and a growing human presence. An occupancy modeling approach was used to estimate corridor species richness and species-specific detection probabilities in 16 forested sites within four different matrix-use categories: eco-lodge reserves, tree plantations/general reforestation, cattle ranches, and pineapple/agricultural plantations. Rarity had a highly negative effect (β = -1.96 ± 0.65 SE) on the ability to detect species presence. Corridor richness was estimated at 20.4 ± 0.66 species and was lower than that observed in protected areas in the Neotropics. Forest cover was significantly less at pineapple plantations than other land-use matrices. Richness estimates for different land-use matrices were highly variable with no significant differences; however, pineapple plantations exhibited the highest observed richness. Given the limited forest cover at those sites, we believe that this reflects the concentrated occurrence of medium and large mammals in small forest patches, particularly because the majority of pineapple plantation communities were generalist mesopredators. Fragmentation and connectivity will need to be addressed with reforestation and limitations on pineapple production for the region to function as an effective corridor. Occupancy modeling has only recently been applied to camera-trap data and our results suggest that this approach provides robust richness and detection probability estimates and should be further explored. Key Words: camera-traps, corridor, Costa Rica, detection probability, mammal community, occupancy modeling, San Juan–La Selva Biological Corridor, species richness Resumen Cámaras-trampa no invasivas son comúnmente utilizadas para estudiar las comunidades de mamíferos en los Neotrópicos. En éste estudio se utilizaron cámaras-trampa para estudiar la diversidad de mamíferos de tamaños medianos y grandes en el Corredor Biológico San Juan - La Selva en Costa Rica. La conectividad del corredor se ve afectada por la expansión de la agricultura a gran escala, la ganadería y continuo crecimiento poblacional humano. Se desarrolló un modelo de ocupación para estimar la riqueza de especies y especies específicas para el corredor, con probabilidades de detección en 16 localizaciones forestales en cuatro diferentes categorías de uso de la matriz: reservas eco-lodge, plantaciones de árboles / reforestación general, ranchos ganaderos y piñas / plantaciones agrícolas. Rareza tenía un efecto altamente negativo (β = -1,96 ± 0,65 SE) en la capacidad de detectar la presencia de especies. La riqueza de especies en el corredor se estimó en 20,4 ± 0,66 especies y fue menor que la observada en las áreas protegidas en los Neotrópicos. La cubierta forestal fue significativamente menor en las plantaciones de piña que en otras matrices de uso de suelo. Las estimaciones de riqueza para matrices diferentes de uso del suelo fueron muy variables sin diferencias significativas. Sin embargo, las plantaciones de piña exhibieron la mayor riqueza de especies observadas. Dada a la cobertura forestal limitada en estos sitios, consideramos que lo antes mencionado refleja una incidencia concentrada de mamíferos medianos y grandes en pequeños parches de bosque, sobre todo porque la mayoría de las comunidades de las plantaciones de piña sumaron mesodepredadores generalistas. Por esta razón, tendrán que ser abordados con la reforestación y las limitaciones de la producción de piña para que la región bajo estudio pueda funcionar como un corredor eficaz. Modelos de ocupación se han aplicado recientemente a los datos de la cámara-trampa y nuestros resultados sugieren que éste enfoque proporciona un estimado robusto de riqueza de especies y sólida probabilidad de detección, lo cual propone estudiarse a cabalidad en el futuro. Palabras clave: cámaras-trampa, corredor, Costa Rica, probabilidad de detección, comunidad de mamíferos, modelos de ocupación, Corredor Biológico San Juan-La Selva, riqueza de especies
Transcript of Integrating occupancy modeling and camera-trap data … to camera-trap data and our results suggest...
Mongabay.com Open Access Journal - Tropical Conservation Science Vol.6 (6):781--795, 2013
Tropical Conservation Science | ISSN 1940-0829 | Tropicalconservationscience.org781
Research Article
Integrating occupancy modeling and camera-trap data toestimate medium and large mammal detection and richnessin a Central American biological corridor
Michael V. Cove1,2* R. Manuel Spínola3, Victoria L. Jackson1, Joel C. Sáenz3,and Olivier Chassot41Department of Biology and Earth Science, University of Central Missouri, Warrensburg, MO 64093, USA. Email:[email protected], [email protected]; 2Selva Verde Lodge, Chilamate de Sarapiquí, Costa Rica, Central America;3Instituto Internacional en Conservación y Manejo de Vida Silvestre, Universidad Nacional, Apartado 1350-3000, Heredia,Costa Rica. Email: [email protected], [email protected]; 4Centro Científico Tropical, Apartado 8-3870-1000 San José,Costa Rica. Email: [email protected] ; *Present Address of Corresponding author: NC Cooperative Fish and WildlifeResearch Unit, Department of Applied Ecology, North Carolina State University. E-mail: [email protected]
AbstractNoninvasive camera-traps are commonly used to survey mammal communities in the Neotropics. This study used camera-traps to surveymedium and large mammal diversity in the San Juan – La Selva Biological Corridor, Costa Rica. The connectivity of the corridor is affectedby the spread of large-scale agriculture, cattle ranching, and a growing human presence. An occupancy modeling approach was used toestimate corridor species richness and species-specific detection probabilities in 16 forested sites within four different matrix-usecategories: eco-lodge reserves, tree plantations/general reforestation, cattle ranches, and pineapple/agricultural plantations. Rarity hada highly negative effect (β = -1.96 ± 0.65 SE) on the ability to detect species presence. Corridor richness was estimated at 20.4 ± 0.66species and was lower than that observed in protected areas in the Neotropics. Forest cover was significantly less at pineapple plantationsthan other land-use matrices. Richness estimates for different land-use matrices were highly variable with no significant differences;however, pineapple plantations exhibited the highest observed richness. Given the limited forest cover at those sites, we believe that thisreflects the concentrated occurrence of medium and large mammals in small forest patches, particularly because the majority of pineappleplantation communities were generalist mesopredators. Fragmentation and connectivity will need to be addressed with reforestationand limitations on pineapple production for the region to function as an effective corridor. Occupancy modeling has only recently beenapplied to camera-trap data and our results suggest that this approach provides robust richness and detection probability estimates andshould be further explored.Key Words: camera-traps, corridor, Costa Rica, detection probability, mammal community, occupancy modeling, San Juan–La SelvaBiological Corridor, species richnessResumenCámaras-trampa no invasivas son comúnmente utilizadas para estudiar las comunidades de mamíferos en los Neotrópicos. En ésteestudio se utilizaron cámaras-trampa para estudiar la diversidad de mamíferos de tamaños medianos y grandes en el Corredor BiológicoSan Juan - La Selva en Costa Rica. La conectividad del corredor se ve afectada por la expansión de la agricultura a gran escala, la ganaderíay continuo crecimiento poblacional humano. Se desarrolló un modelo de ocupación para estimar la riqueza de especies y especiesespecíficas para el corredor, con probabilidades de detección en 16 localizaciones forestales en cuatro diferentes categorías de uso de lamatriz: reservas eco-lodge, plantaciones de árboles / reforestación general, ranchos ganaderos y piñas / plantaciones agrícolas. Rarezatenía un efecto altamente negativo (β = -1,96 ± 0,65 SE) en la capacidad de detectar la presencia de especies. La riqueza de especies en elcorredor se estimó en 20,4 ± 0,66 especies y fue menor que la observada en las áreas protegidas en los Neotrópicos. La cubierta forestalfue significativamente menor en las plantaciones de piña que en otras matrices de uso de suelo. Las estimaciones de riqueza para matricesdiferentes de uso del suelo fueron muy variables sin diferencias significativas. Sin embargo, las plantaciones de piña exhibieron la mayorriqueza de especies observadas. Dada a la cobertura forestal limitada en estos sitios, consideramos que lo antes mencionado refleja unaincidencia concentrada de mamíferos medianos y grandes en pequeños parches de bosque, sobre todo porque la mayoría de lascomunidades de las plantaciones de piña sumaron mesodepredadores generalistas. Por esta razón, tendrán que ser abordados con lareforestación y las limitaciones de la producción de piña para que la región bajo estudio pueda funcionar como un corredor eficaz. Modelosde ocupación se han aplicado recientemente a los datos de la cámara-trampa y nuestros resultados sugieren que éste enfoque proporcionaun estimado robusto de riqueza de especies y sólida probabilidad de detección, lo cual propone estudiarse a cabalidad en el futuro.Palabras clave: cámaras-trampa, corredor, Costa Rica, probabilidad de detección, comunidad de mamíferos, modelos de ocupación,Corredor Biológico San Juan-La Selva, riqueza de especies
Mongabay.com Open Access Journal - Tropical Conservation Science Vol.6 (6):781--795, 2013
Tropical Conservation Science | ISSN 1940-0829 | Tropicalconservationscience.org782
IntroductionThe use of camera-traps for ecological studies has increased dramatically over the past two decades [1-2].Cameras are often used to estimate abundance and density of large carnivores, particularly large cats [3-4]. Because cameras will photograph many species that pass the infrared sensor, they are also valuabletools for medium and large mammal and terrestrial bird inventories [5-6]. Such inventories are importantbecause they allow the community structure to be examined and compared over time and betweengeographic regions. Differences can reflect habitat suitability and forest integrity, and also the impact ofexpanding human development [7].
Large mammals are often considered keystone species and serve critical roles in maintaining balancedcommunity structure [8]. In the absence of large carnivores, mesopredators can become abundant assuggested by the Mesopredator Release Hypothesis (MRH, [e.g. 9-10]), while herbivores can also becomeabundant due to release from predation [7, 11-12]. Large herbivores such as tapirs and social artiodactyls(e.g. peccaries) play important roles in forest plant communities through seed dispersal and seed and plantconsumption [13-14]. Entire community changes are common because large mammals are often the firstspecies to disappear upon human encroachment [7], typically due to agricultural land cover changes,hunting, and poaching in the Neotropics.
Given that many mammals are elusive and difficult to detect, the objective of most medium and largemammal inventories is to maximize the area covered and confidently estimate the number of speciespresent while minimizing the time requirements [1]. For several decades ecologists have incorporateddetection probability parameters when estimating individual abundance by using a capture-recapturemodeling framework [15-16]. This framework also underlies many species richness models [5]. Recently,the approach was modified for use in species occupancy modeling, which utilizes presence/absence datato estimate the probability of occurrence (Ψ) by incorporating the additional parameter of detectionprobability (p̂), both of which can be affected by habitat and survey-specific covariates [15, 17]. Thismodeling approach can also be applied to community data to estimate species-specific detectionprobabilities and appropriately estimate species richness for an area [15, 17-18]. Although occupancymodeling has been used extensively in recent years, there have been few studies applying this approachto camera-trap data [19]. Following the recommendations of O’Brien [19], Tobler et al. [6, 20] reanalyzedtheir community camera-trap data using the occupancy modeling approach. Their subsequent occupancy-based richness models performed well compared to other richness estimators, but they did not include orexplore the effects of species-specific covariates.
In this study, we used camera-traps to survey medium- and large- mammal diversity in a fragmentedbiological corridor and used an occupancy approach to estimate species richness within the corridor.Specifically, we explored how different species’ traits affect their detection. We then explored and
Received: 11 April 2013; Accepted 22 July 2013; Published: 16 December 2013
Copyright: © Michael V. Cove, R. Manuel Spínola, Victoria L. Jackson, Joel C. Sáenz and Olivier Chassot. This is an openaccess paper. We use the Creative Commons Attribution 3.0 license http://creativecommons.org/licenses/by/3.0/us/. Thelicense permits any user to download, print out, extract, archive, and distribute the article, so long as appropriate credit isgiven to the authors and source of the work. The license ensures that the published article will be as widely available aspossible and that your article can be included in any scientific archive. Open Access authors retain the copyrights of theirpapers. Open access is a property of individual works, not necessarily journals or publishers.
Cite this paper as: Cove, M. V., Spínola, R. M., Jackson, V. L., Sáenz, J. C. and Chassot, O. 2013. Integrating occupancymodelling and camera-trap data to estimate medium and large mammal detection and richness in a Central Americanbiological corridor. Tropical Conservation Science Vol.6 (6):781-795. Available online:www.tropicalconservationscience.org
Mongabay.com Open Access Journal - Tropical Conservation Science Vol.6 (6):781--795, 2013
Tropical Conservation Science | ISSN 1940-0829 | Tropicalconservationscience.org783
compared medium and large mammal richness and individual species-specific occurrence among forestsites in variable matrix land-uses within the corridor.
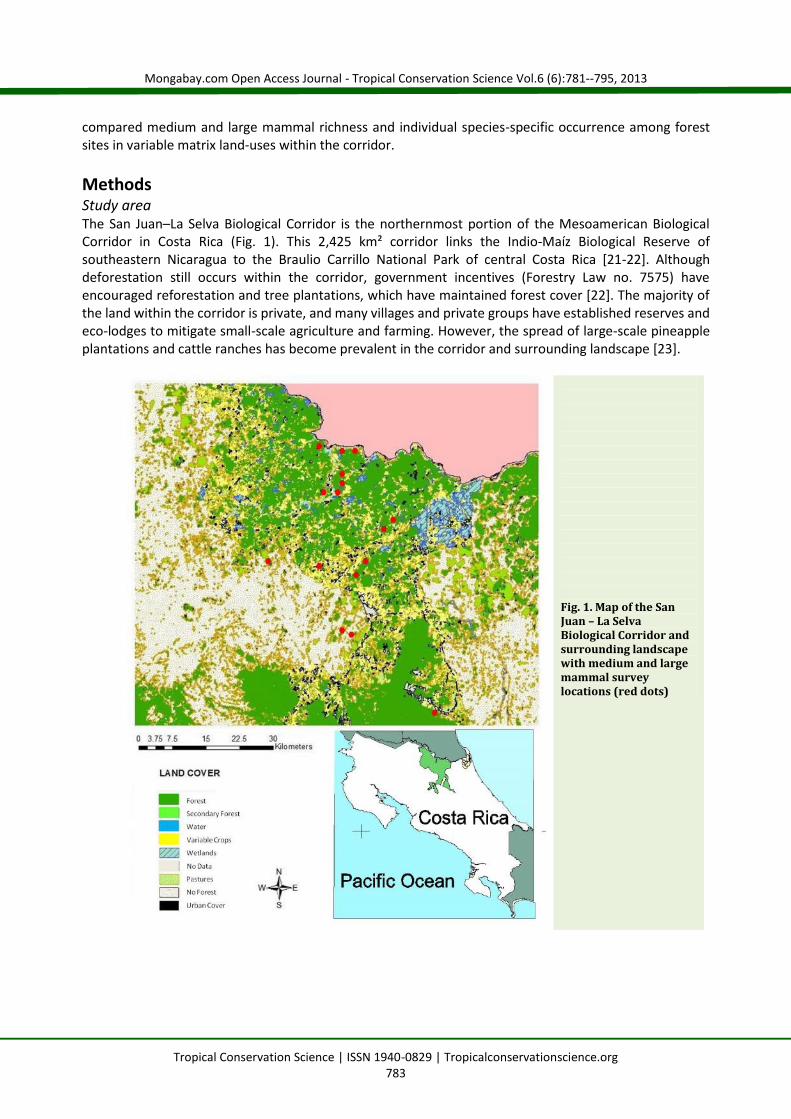
MethodsStudy areaThe San Juan–La Selva Biological Corridor is the northernmost portion of the Mesoamerican BiologicalCorridor in Costa Rica (Fig. 1). This 2,425 km² corridor links the Indio-Maíz Biological Reserve ofsoutheastern Nicaragua to the Braulio Carrillo National Park of central Costa Rica [21-22]. Althoughdeforestation still occurs within the corridor, government incentives (Forestry Law no. 7575) haveencouraged reforestation and tree plantations, which have maintained forest cover [22]. The majority ofthe land within the corridor is private, and many villages and private groups have established reserves andeco-lodges to mitigate small-scale agriculture and farming. However, the spread of large-scale pineappleplantations and cattle ranches has become prevalent in the corridor and surrounding landscape [23].
Fig. 1. Map of the SanJuan – La SelvaBiological Corridor andsurrounding landscapewith medium and largemammal surveylocations (red dots)
Mongabay.com Open Access Journal - Tropical Conservation Science Vol.6 (6):781--795, 2013
Tropical Conservation Science | ISSN 1940-0829 | Tropicalconservationscience.org784
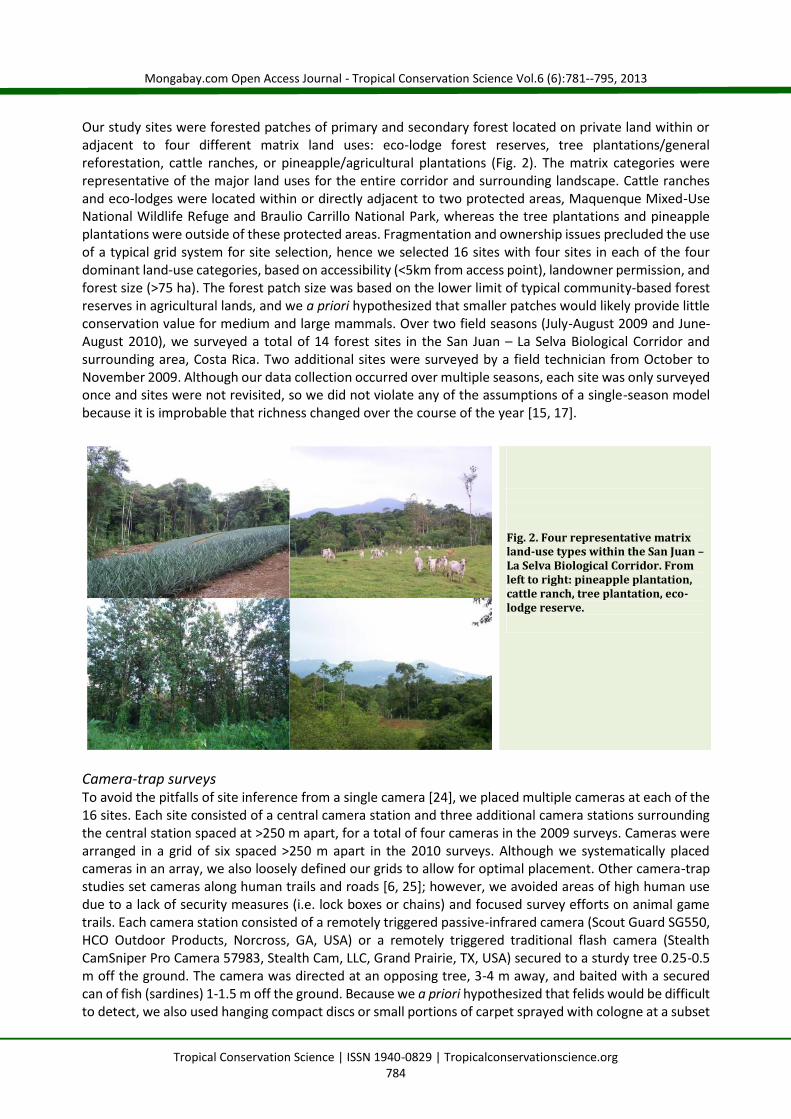
Our study sites were forested patches of primary and secondary forest located on private land within oradjacent to four different matrix land uses: eco-lodge forest reserves, tree plantations/generalreforestation, cattle ranches, or pineapple/agricultural plantations (Fig. 2). The matrix categories wererepresentative of the major land uses for the entire corridor and surrounding landscape. Cattle ranchesand eco-lodges were located within or directly adjacent to two protected areas, Maquenque Mixed-UseNational Wildlife Refuge and Braulio Carrillo National Park, whereas the tree plantations and pineappleplantations were outside of these protected areas. Fragmentation and ownership issues precluded the useof a typical grid system for site selection, hence we selected 16 sites with four sites in each of the fourdominant land-use categories, based on accessibility (<5km from access point), landowner permission, andforest size (>75 ha). The forest patch size was based on the lower limit of typical community-based forestreserves in agricultural lands, and we a priori hypothesized that smaller patches would likely provide littleconservation value for medium and large mammals. Over two field seasons (July-August 2009 and June-August 2010), we surveyed a total of 14 forest sites in the San Juan – La Selva Biological Corridor andsurrounding area, Costa Rica. Two additional sites were surveyed by a field technician from October toNovember 2009. Although our data collection occurred over multiple seasons, each site was only surveyedonce and sites were not revisited, so we did not violate any of the assumptions of a single-season modelbecause it is improbable that richness changed over the course of the year [15, 17].
Camera-trap surveysTo avoid the pitfalls of site inference from a single camera [24], we placed multiple cameras at each of the16 sites. Each site consisted of a central camera station and three additional camera stations surroundingthe central station spaced at >250 m apart, for a total of four cameras in the 2009 surveys. Cameras werearranged in a grid of six spaced >250 m apart in the 2010 surveys. Although we systematically placedcameras in an array, we also loosely defined our grids to allow for optimal placement. Other camera-trapstudies set cameras along human trails and roads [6, 25]; however, we avoided areas of high human usedue to a lack of security measures (i.e. lock boxes or chains) and focused survey efforts on animal gametrails. Each camera station consisted of a remotely triggered passive-infrared camera (Scout Guard SG550,HCO Outdoor Products, Norcross, GA, USA) or a remotely triggered traditional flash camera (StealthCamSniper Pro Camera 57983, Stealth Cam, LLC, Grand Prairie, TX, USA) secured to a sturdy tree 0.25-0.5m off the ground. The camera was directed at an opposing tree, 3-4 m away, and baited with a securedcan of fish (sardines) 1-1.5 m off the ground. Because we a priori hypothesized that felids would be difficultto detect, we also used hanging compact discs or small portions of carpet sprayed with cologne at a subset
Fig. 2. Four representative matrixland-use types within the San Juan –La Selva Biological Corridor. Fromleft to right: pineapple plantation,cattle ranch, tree plantation, eco-lodge reserve.
Mongabay.com Open Access Journal - Tropical Conservation Science Vol.6 (6):781--795, 2013
Tropical Conservation Science | ISSN 1940-0829 | Tropicalconservationscience.org785
of cameras at each site to increase felid detections [26]. Cameras were left at each site for 24-38 d andchecked weekly (or as often as possible due to logistics) for rebaiting and battery changes.
Data analysesAfter the surveys were complete, we combined all photos from both field seasons to organize and managebinary detection histories for each species detected (1 = species detected, 0 = species not detected). Wecalculated detection frequency for each species as the number of independent detections/1000 trapnightsfor comparison to previous camera studies in the Neotropics [6].
We then used an occupancy modeling approach, as described by Mackenzie et al. [15, 17], to estimatespecies richness and individual species detection probabilities for the corridor. The modeling processrequires an a priori list of species and treats each species as a ‘site’ to determine the proportion of speciespresent (Ψ) corrected by incorporating species-specific detection probability [17-18]. The a priori list ofspecies contained 29 terrestrial mammal species [21, 27]. We excluded all arboreal species includingprimates, some small carnivores, and arboreal marsupials, because these species rarely come to the forestfloor and most likely go undetected by cameras. We then ranked each species in five a priori categories toexamine and account for species-specific parameter effects on detection and occurrence. Each species wascategorized as either large (>10 kg) or medium (<10 kg). The species were also categorized as rare orcommon and hunted/poached if the species was targeted by humans [M. Cove pers. obs., 27-28]. Coyotes(Canis latrans) have only recently invaded northeastern Costa Rica [29], so we considered them to be rareeven though they are considered common in other regions of Costa Rica. Finally, we categorized animalsby diet as herbivores, omnivores, or carnivores. Obligate insectivores, northern tamandua (Tamanduamexicana) and giant anteater (Myrmecophaga tridactyla), were classified as carnivores due to their highlyspecialized diet.
Each detection history was partitioned into 5-d survey blocks for a maximum total of seven repeat surveys.These detection histories and species covariates (categories) were the input for a single-season occupancymodel in the program PRESENCE 4.3 [30]. The assumption for the corridor richness model is that speciestraits (i.e. rarity, hunted/poached, etc.) affect local abundance and therefore affect detection, but do notremove species from the corridor. We used five a priori models to estimate species richness and species-specific detection probabilities, including a global model containing all covariates. The best approximatingmodels were selected based on the Akaike Information Criterion, corrected for small sample size (AICc) andAkaike weights (wi). We then selected the 95% confidence set and conducted model averaging [31] usingspreadsheet software designed by B. Mitchell (www.uvm.edu/%7Ebmitchel/software.html) to estimatespecies-specific detection probabilities and effects of covariates in multiple models. We used theestimated detection probabilities per sample unit to predict the total trap effort (number of trapnights)required to detect each species with 95% confidence.
We had anticipated estimating richness for each individual forest site for multiple comparisons, butdetection rates were too low to reliably estimate such parameters; instead, we pooled the data from thefour sites within each of the land-use matrix categories. Because all sites were at least 2 km apart, wemeasured the proportion of forest cover within a 1km radius circular buffer surrounding the cameras at asite for each matrix in ArcGIS 10.0 (ESRI, 380 New York Street, Redlands, CA 92373, USA). The buffer sizeensured independence between sites and served as an index of forest integrity and connectivity (i.e. higherforest cover proportion has more conservation value) for the different land-use matrices adjacent to forestsites [7, 32]. We also measured the mean distance to nearest village at each site as an index of humandisturbance, which is also a landscape component affecting richness and detection within matrix types [7,32]. We then compared these measures for each land-use matrix with a one-way ANOVA and a post-hocTukey’s Honest Significant Difference Test. Forest proportions and mean distances were log-transformedand α-value was set to 0.05. Geographic information system (GIS) data were derived from Landsat imagerywith field validation data [23].
Mongabay.com Open Access Journal - Tropical Conservation Science Vol.6 (6):781--795, 2013
Tropical Conservation Science | ISSN 1940-0829 | Tropicalconservationscience.org786
Prior to the individual land-use matrix analyses, we conducted an analysis to determine if number ofcameras (4 vs. 6) and duration of the survey (24-36 d) affected detection probability. Because no singlemodel contained significant support, we did not include number of cameras per site or survey length ascovariates in our candidate models. Survey length was accounted for in the detection histories as missingvalues, which are accommodated by the occupancy modeling approach [17]. We used the significantdetection covariates from the primary analysis as the constant detection model and implemented the samepreliminary richness models, except with covariates affecting richness (Ψ) for each of the four land-covermatrix categories. Model selection and model averaging among those models followed the sameprocedure as for the corridor analysis. We compared model-based richness estimates with observedrichness via a one-sample t-test and determined estimates to be significantly different if confidenceintervals did not overlap.
All animal research was in accordance with the guidelines established by The American Society ofMammalogists [33]. The camera-trapping protocol was approved by the University of Central MissouriInstitutional Animal Care and Use Committee (IACUC -- Permit No. 10-3202).
ResultsFrom 2,286 trapnights, we detected 17 native medium and large mammal species (Appendix 1 – specieswith capture frequencies). The model-averaged estimate (± SE) for species richness of the corridor was20.4 ± 0.66 species and was significantly different from the naïve (observed) richness estimate (P < 0.001),suggesting that we missed 3-5 species due to detection bias. The top three models contained > 95 % of thesupport for corridor richness (Table 1), leading to the model averaged β-coefficients in Table 2. Rarity wasthe only covariate that was contained in all three top models and had a strong model-averaged negativeeffect (β1 = -1.96 ± 0.65) on mammal detection probability. Although hunted/poached and diet also hadnegative effects (β3 = -1.50 ± 0.98, β5 = -1.54 ± 1.10, respectively) on detection, the coefficients were notsignificant in that 95% confidence intervals strongly overlapped 0. Other coefficients were also notsignificantly different from 0 effects. For this reason, we only included rarity as a detection covariate in thesubsequent land-use matrix models.
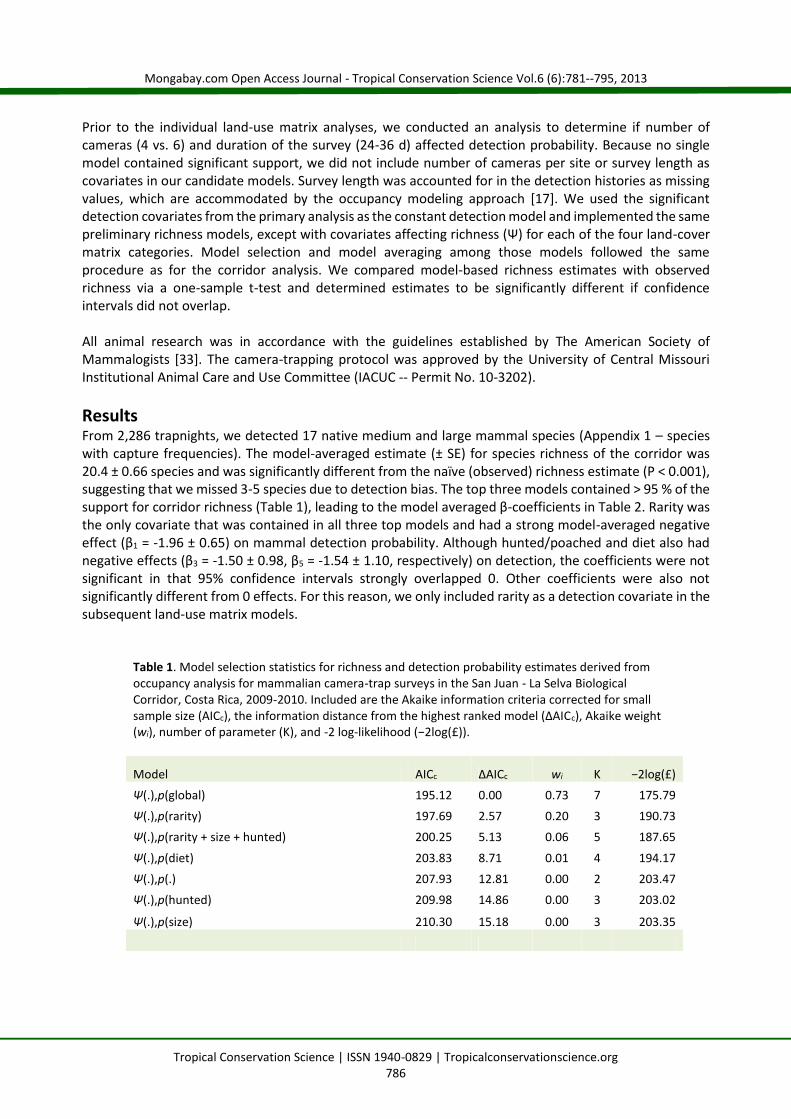
Table 1. Model selection statistics for richness and detection probability estimates derived fromoccupancy analysis for mammalian camera-trap surveys in the San Juan - La Selva BiologicalCorridor, Costa Rica, 2009-2010. Included are the Akaike information criteria corrected for smallsample size (AICc), the information distance from the highest ranked model (ΔAICc), Akaike weight(wi), number of parameter (K), and -2 log-likelihood (−2log(£)).
Model AICc ΔAICc wi K −2log(£)Ψ(.),p(global) 195.12 0.00 0.73 7 175.79Ψ(.),p(rarity) 197.69 2.57 0.20 3 190.73Ψ(.),p(rarity + size + hunted) 200.25 5.13 0.06 5 187.65
Ψ(.),p(diet) 203.83 8.71 0.01 4 194.17Ψ(.),p(.) 207.93 12.81 0.00 2 203.47Ψ(.),p(hunted) 209.98 14.86 0.00 3 203.02
Ψ(.),p(size) 210.30 15.18 0.00 3 203.35
Mongabay.com Open Access Journal - Tropical Conservation Science Vol.6 (6):781--795, 2013
Tropical Conservation Science | ISSN 1940-0829 | Tropicalconservationscience.org787
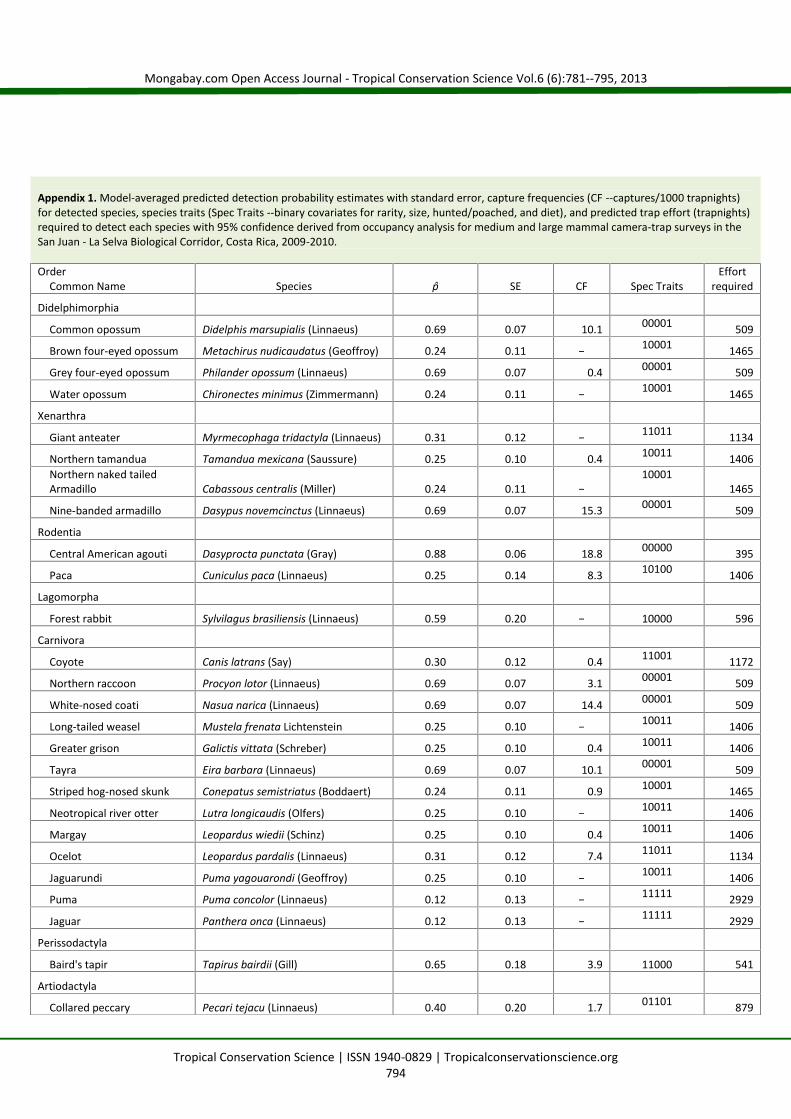
Predicted detection probabilities (Appendix 1) ranged from very low 0.12 ± 0.13 for jaguar (Panthera onca),puma (Puma concolor), and white-lipped peccary (Tayassu pecari) to very high 0.88 ± 0.06 for the CentralAmerican agouti (Dasyprocta punctata). The estimated trap effort required to catalogue a species usingcamera-traps with 95% certainty ranged from 395 trapnights to detect agouti to 2,929 trapnights to detectjaguar, puma, and white-lipped peccary. Capture frequencies were computed for detected species forgeneral comparisons to other previously published camera surveys (Appendix 1).
Forest cover at our sites varied significantly among the matrix land-use categories (One-way ANOVA: F3,12
= 13.05; P < 0.001). Forest patches located adjacent to pineapple plantations had significantly less forestcover (33.8% ± 6.07 SE) within their buffers than the other three matrix land-use categories (Tukey HSD;P< 0.01). Forest sites adjacent to the other land-use categories maintained >75% forest cover within sitebuffers. Distance to nearest village was marginally significantly different (One-way ANOVA: F3,12 = 3.38; P=0.05), with post-hoc comparisons of forest sites in pineapple matrices occurring >1km closer to villagesthan sites adjacent to cattle ranches (Tukey HSD; P= 0.07) and >1km closer than sites located in eco-lodgeforest reserves also approaching significance (Tukey HSD; P= 0.08). In the detection analysis to examinesurvey effects, no model contained significant support, so the number of cameras per site and the durationof camera survey were excluded as covariates in further analyses (Table 3).
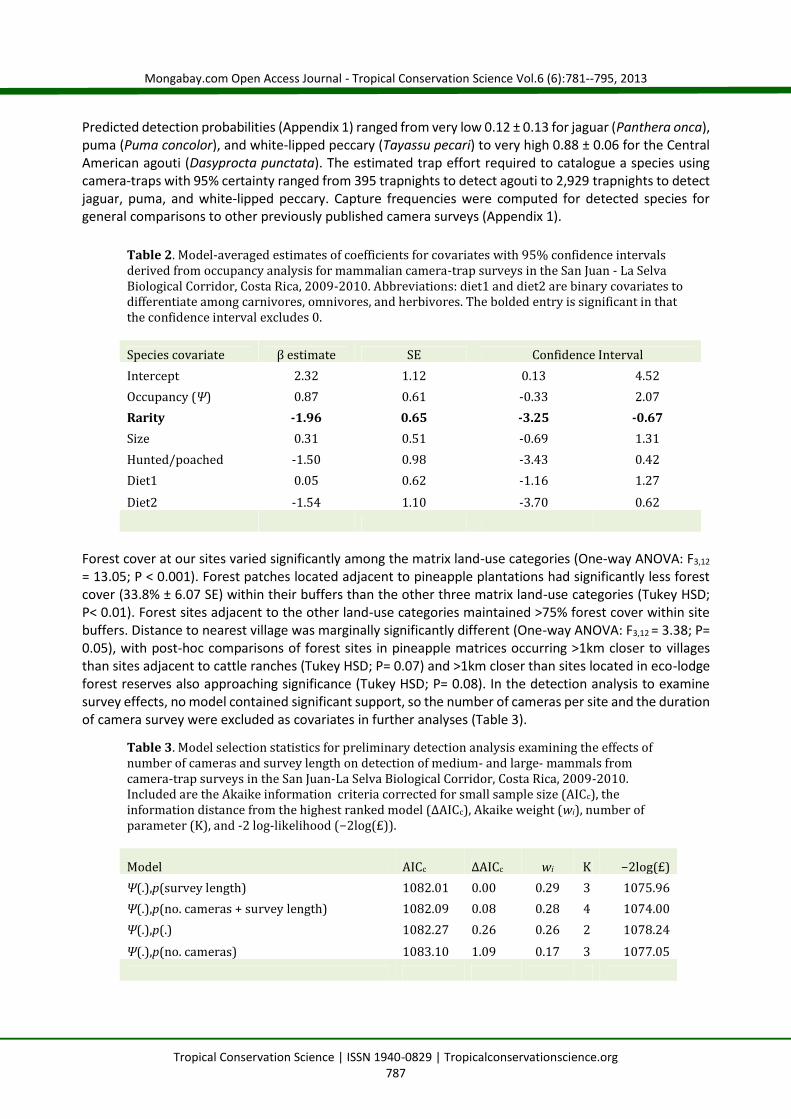
Table 2. Model-averaged estimates of coefficients for covariates with 95% confidence intervalsderived from occupancy analysis for mammalian camera-trap surveys in the San Juan - La SelvaBiological Corridor, Costa Rica, 2009-2010. Abbreviations: diet1 and diet2 are binary covariates todifferentiate among carnivores, omnivores, and herbivores. The bolded entry is significant in thatthe confidence interval excludes 0.Species covariate β estimate SE Confidence IntervalIntercept 2.32 1.12 0.13 4.52Occupancy (Ψ) 0.87 0.61 -0.33 2.07Rarity -1.96 0.65 -3.25 -0.67Size 0.31 0.51 -0.69 1.31Hunted/poached -1.50 0.98 -3.43 0.42Diet1 0.05 0.62 -1.16 1.27Diet2 -1.54 1.10 -3.70 0.62
Table 3. Model selection statistics for preliminary detection analysis examining the effects ofnumber of cameras and survey length on detection of medium- and large- mammals fromcamera-trap surveys in the San Juan-La Selva Biological Corridor, Costa Rica, 2009-2010.Included are the Akaike information criteria corrected for small sample size (AICc), theinformation distance from the highest ranked model (ΔAICc), Akaike weight (wi), number ofparameter (K), and -2 log-likelihood (−2log(£)).Model AICc ΔAICc wi K −2log(£)Ψ(.),p(survey length) 1082.01 0.00 0.29 3 1075.96Ψ(.),p(no. cameras + survey length) 1082.09 0.08 0.28 4 1074.00Ψ(.),p(.) 1082.27 0.26 0.26 2 1078.24Ψ(.),p(no. cameras) 1083.10 1.09 0.17 3 1077.05
Mongabay.com Open Access Journal - Tropical Conservation Science Vol.6 (6):781--795, 2013
Tropical Conservation Science | ISSN 1940-0829 | Tropicalconservationscience.org788
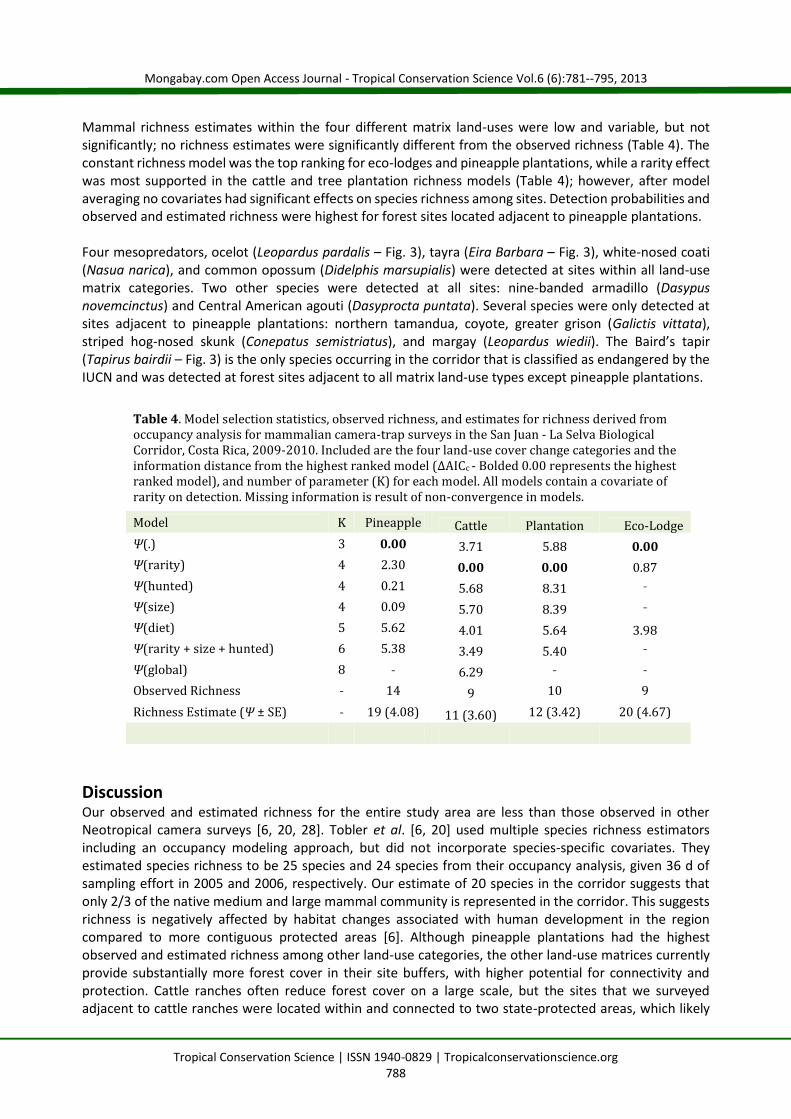
Mammal richness estimates within the four different matrix land-uses were low and variable, but notsignificantly; no richness estimates were significantly different from the observed richness (Table 4). Theconstant richness model was the top ranking for eco-lodges and pineapple plantations, while a rarity effectwas most supported in the cattle and tree plantation richness models (Table 4); however, after modelaveraging no covariates had significant effects on species richness among sites. Detection probabilities andobserved and estimated richness were highest for forest sites located adjacent to pineapple plantations.
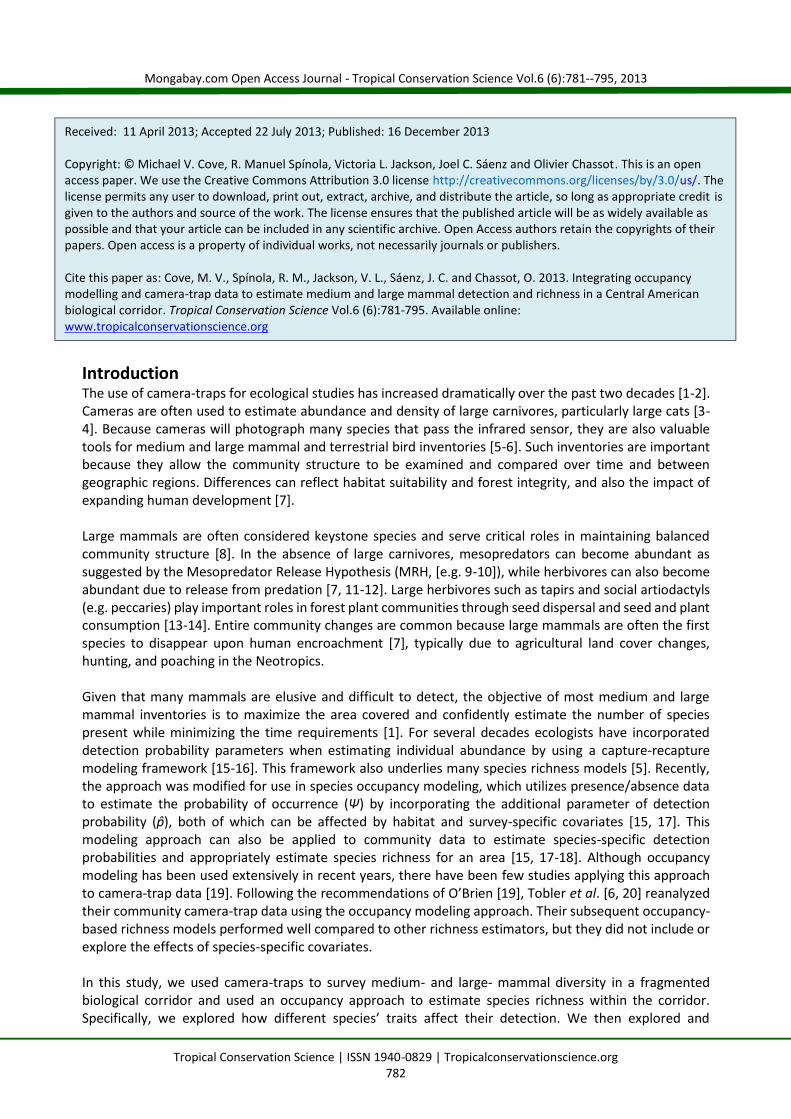
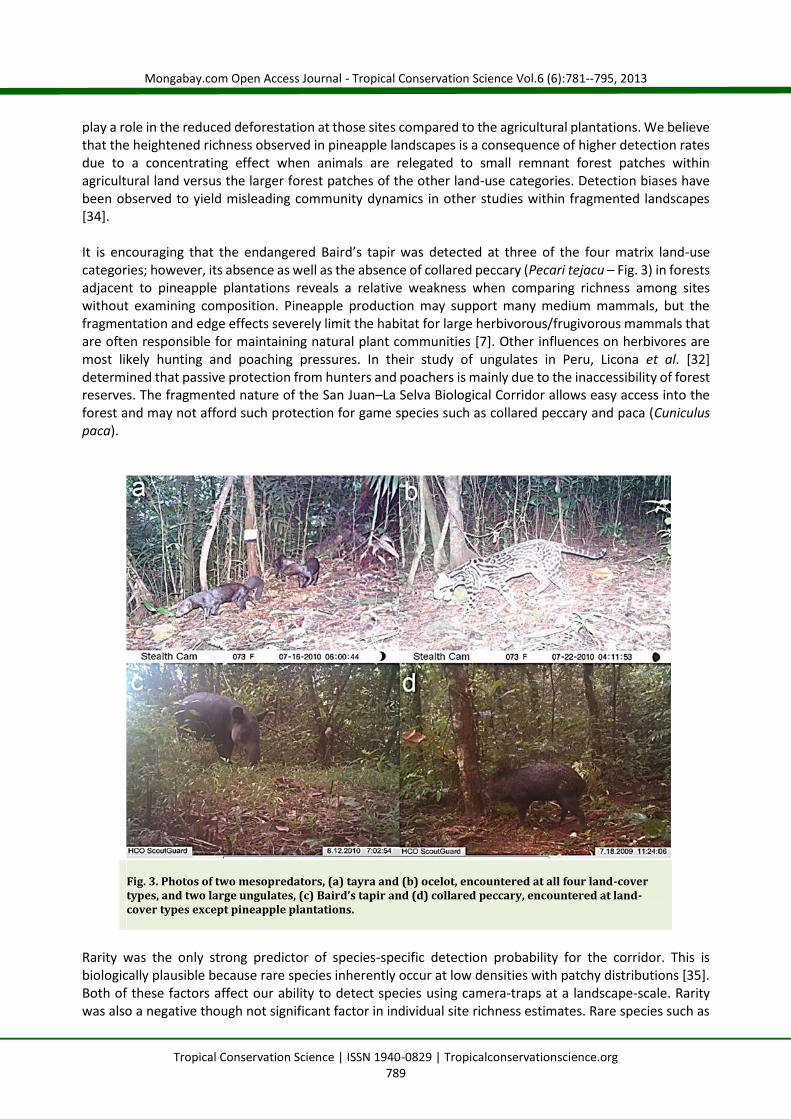
Four mesopredators, ocelot (Leopardus pardalis – Fig. 3), tayra (Eira Barbara – Fig. 3), white-nosed coati(Nasua narica), and common opossum (Didelphis marsupialis) were detected at sites within all land-usematrix categories. Two other species were detected at all sites: nine-banded armadillo (Dasypusnovemcinctus) and Central American agouti (Dasyprocta puntata). Several species were only detected atsites adjacent to pineapple plantations: northern tamandua, coyote, greater grison (Galictis vittata),striped hog-nosed skunk (Conepatus semistriatus), and margay (Leopardus wiedii). The Baird’s tapir(Tapirus bairdii – Fig. 3) is the only species occurring in the corridor that is classified as endangered by theIUCN and was detected at forest sites adjacent to all matrix land-use types except pineapple plantations.
Table 4. Model selection statistics, observed richness, and estimates for richness derived fromoccupancy analysis for mammalian camera-trap surveys in the San Juan - La Selva BiologicalCorridor, Costa Rica, 2009-2010. Included are the four land-use cover change categories and theinformation distance from the highest ranked model (ΔAICc - Bolded 0.00 represents the highestranked model), and number of parameter (K) for each model. All models contain a covariate ofrarity on detection. Missing information is result of non-convergence in models.Model K Pineapple Cattle Plantation Eco-LodgeΨ(.) 3 0.00 3.71 5.88 0.00Ψ(rarity) 4 2.30 0.00 0.00 0.87Ψ(hunted) 4 0.21 5.68 8.31 ˗Ψ(size) 4 0.09 5.70 8.39 ˗Ψ(diet) 5 5.62 4.01 5.64 3.98Ψ(rarity + size + hunted) 6 5.38 3.49 5.40 ˗Ψ(global) 8 ˗ 6.29 ˗ ˗Observed Richness ˗ 14 9 10 9Richness Estimate (Ψ ± SE) ˗ 19 (4.08) 11 (3.60) 12 (3.42) 20 (4.67)
DiscussionOur observed and estimated richness for the entire study area are less than those observed in otherNeotropical camera surveys [6, 20, 28]. Tobler et al. [6, 20] used multiple species richness estimatorsincluding an occupancy modeling approach, but did not incorporate species-specific covariates. Theyestimated species richness to be 25 species and 24 species from their occupancy analysis, given 36 d ofsampling effort in 2005 and 2006, respectively. Our estimate of 20 species in the corridor suggests thatonly 2/3 of the native medium and large mammal community is represented in the corridor. This suggestsrichness is negatively affected by habitat changes associated with human development in the regioncompared to more contiguous protected areas [6]. Although pineapple plantations had the highestobserved and estimated richness among other land-use categories, the other land-use matrices currentlyprovide substantially more forest cover in their site buffers, with higher potential for connectivity andprotection. Cattle ranches often reduce forest cover on a large scale, but the sites that we surveyedadjacent to cattle ranches were located within and connected to two state-protected areas, which likely
Mongabay.com Open Access Journal - Tropical Conservation Science Vol.6 (6):781--795, 2013
Tropical Conservation Science | ISSN 1940-0829 | Tropicalconservationscience.org789
play a role in the reduced deforestation at those sites compared to the agricultural plantations. We believethat the heightened richness observed in pineapple landscapes is a consequence of higher detection ratesdue to a concentrating effect when animals are relegated to small remnant forest patches withinagricultural land versus the larger forest patches of the other land-use categories. Detection biases havebeen observed to yield misleading community dynamics in other studies within fragmented landscapes[34].
It is encouraging that the endangered Baird’s tapir was detected at three of the four matrix land-usecategories; however, its absence as well as the absence of collared peccary (Pecari tejacu – Fig. 3) in forestsadjacent to pineapple plantations reveals a relative weakness when comparing richness among siteswithout examining composition. Pineapple production may support many medium mammals, but thefragmentation and edge effects severely limit the habitat for large herbivorous/frugivorous mammals thatare often responsible for maintaining natural plant communities [7]. Other influences on herbivores aremost likely hunting and poaching pressures. In their study of ungulates in Peru, Licona et al. [32]determined that passive protection from hunters and poachers is mainly due to the inaccessibility of forestreserves. The fragmented nature of the San Juan–La Selva Biological Corridor allows easy access into theforest and may not afford such protection for game species such as collared peccary and paca (Cuniculuspaca).
Fig. 3. Photos of two mesopredators, (a) tayra and (b) ocelot, encountered at all four land-covertypes, and two large ungulates, (c) Baird’s tapir and (d) collared peccary, encountered at land-cover types except pineapple plantations.
Rarity was the only strong predictor of species-specific detection probability for the corridor. This isbiologically plausible because rare species inherently occur at low densities with patchy distributions [35].Both of these factors affect our ability to detect species using camera-traps at a landscape-scale. Raritywas also a negative though not significant factor in individual site richness estimates. Rare species such as
Mongabay.com Open Access Journal - Tropical Conservation Science Vol.6 (6):781--795, 2013
Tropical Conservation Science | ISSN 1940-0829 | Tropicalconservationscience.org790
tapirs, jaguars, and other charismatic mammals are also typically the species of interest in conservationassessments or may serve as umbrella and flagship species [36], so allotting survey effort to increasedetections of these community members is vital to assessing habitat suitability and communitycomposition. Allocating the appropriate survey effort may be accomplished by increasing camera coverageor extending the survey length [37], particularly to reach the predicted trap effort required to detectflagship and umbrella species.
Our derived detection probabilities were similar to another Neotropical survey with large cats (jaguar) andwhite-lipped peccary exhibiting low detection probabilities, while medium-sized rodents and armadillosexhibited high detection probabilities, and other ungulates exhibited moderate detection probabilities[38]. Zeller et al. [38] observed higher detection probabilities than those in our study, but we believe thisis because the authors used interview-based occupancy modeling as opposed to camera-traps. The use ofinterviews about wildlife trends is useful, but the assumption that repeat surveys (multiple interviews) areindependent may be inaccurate. People within the villages and communities most likely communicate witheach other and influence the perceived presence/absence of species in the area, leading to higherdetection probabilities than observed with camera-traps.
We did not detect jaguar, puma, or white-lipped peccary during our sampling period, but we observed fieldevidence, cattle depredations, and reported sightings of both big cat species and white-lipped peccaries atthe northern portion of the corridor. The lack of detections for these species may be an artifact of samplingdesign, because we did not set camera stations along roads or heavily-used human trails. In a critique ofcamera-trap studies for the large cats [39], the authors suggest that roads and human trails are oftenheavily used by large predators and camera placement can highly affect detection rates. However, weselected camera locations based on apparent use by other animals, particularly prey species, and usedfelid-specific attractants, so the lack of detections might more appropriately reflect the true rarity of largecats in the corridor and hence their low detection probabilities. Other non-detected species such as redbrocket deer (Mazama americana), forest rabbit (Sylvilagus brasiliensis), Neotropical river otter (Lutralongicaudis), and water opossum (Chironectes minimus) are most likely present but difficult to detect withcameras due to local hunting pressure for the first two and preference for waterways for the latter. Thegiant anteater is very rare in Costa Rica and may have been extirpated [27], so they are most likely absentfrom the study area.
With the apparent rarity of large carnivores in our surveys and in the different land-use matrices,mesopredators were the most commonly detected guild at all sites. Although this may provide evidencefor the MRH, this is likely a consequence of concentrated populations of the smaller carnivores and theeffect of scent lures at cameras [40]. Additionally, mesopredators may be tolerant of habitat disturbanceand utilize agricultural food resources. This highlights the difficulties in comparing indices such as capturefrequencies for landscape associations of mesopredators, because landscape influences and concentrationof individuals in forest fragments have been observed to affect detection probability and inference [40].
Mesopredators accounted for 64% of the medium and large mammal community observed at forest siteslocated near pineapple plantation landscapes, with four of those species only observed in that matrix-use.This is most likely an effect of additional food resources from pineapple production leading to higher localabundance or concentrated foraging activities in pineapple-forest edge habitats. The fruits provide directfood resources, and other food resources may be indirectly provided from pineapple pests such as smallrodents, insects, and ground-nesting birds [27, 41]. The expansion of pineapple plantations, as well as otherexport crops, has also decreased reforestation rates [23] which may have facilitated the invasion of thecoyote to Caribbean slope, which may affect the rest of the community [29]. This also highlights thenegative influences of pineapple production, even though richness appears to be higher than otherhabitats. Given that pineapple production, as well as other export crops, have increased dramatically inrecent years in the region [23], the resultant forest patches in those matrices may be carrying a high
Mongabay.com Open Access Journal - Tropical Conservation Science Vol.6 (6):781--795, 2013
Tropical Conservation Science | ISSN 1940-0829 | Tropicalconservationscience.org791
extinction debt (i.e. local extinction is imminent) if connectivity is reduced to prevent immigration andemigration [42, 43].
The occupancy modeling approach applied in this study demonstrates the usefulness of this tool toestimate species richness and habitat use when all species exhibit different detection probabilities. Byusing an a priori species list, this approach can also be applied to other taxonomic groups with datacollected from repeated surveys [15, 17]. Investigators in multiple ecological disciplines can benefit fromoccupancy analysis to estimate species richness and detection probabilities from their community surveydata, particularly with regard to continuously shifting baselines of diversity into the future [44]. Furtherstandardization will also allow more robust comparisons over time and between regions and should beexplored further in biodiversity assessments.
Implications for conservationThe camera trapping protocol, as well as the occupancy modeling approach, provide a standardizedanalytical framework for monitoring medium and large mammal diversity in the region and throughout theNeotropics. Although large cats and white-lipped peccaries were not directly observed and appear absentor very rare, field evidence as well as our richness estimates suggest that these species likely occur at lowdensities and are thus very difficult to detect. Although forests within pineapple plantation matrices hadthe highest observed and estimated medium and large mammal richness estimates, we suggest that thisis not a good indicator of a healthy mammal community. Of the mammals observed in pineappleplantations, the majority were opportunistic mesopredators and an invasive mesopredator, which haveless community value than flagship species such as the Baird’s tapir [45], peccaries, or large carnivores. Ourmonitoring protocol will help to further evaluate the effects of inherent species rarity, as well as hunting,agricultural expansion, and the loss of connectivity as potential limiting factors influencing the mammalcommunity within the San Juan - La Selva Biological Corridor.
AcknowledgementsWe thank all the field assistants, lodges, and communities that helped with logistics for this research.Special thanks to D. Corrales, R. Salom, and J. Carazo of Panthera-Costa Rica, L. Pardo, M. Fagen, SelvaVerde Lodge, Cinco Ceibas Rainforest Reserve, Laguna del Largarto Lodge, Maquenque Eco Lodge, andHolbrook Travel for their assistance and continued support. Funding for this research was provided by theUniversidad Nacional de Costa Rica and the University of Central Missouri International Center. Ourmanuscript was largely improved by incorporating comments from E. Henry, as well as the editor andanonymous reviewers.
References[1] O’Connell, A. F., Nichols, J. D. and Karanth, K. U. 2011. Camera-traps in animal ecology: methods and
analyses. Springer, New York.[2] Rowcliffe, J. M. and Carbone, C. 2008. Surveys using camera-traps: are we looking to a brighter future?
Animal Conservation 11:185-186.[3] Karanth, K. U. and Nichols, J. D. 1998. Estimation of tiger densities in India using photographic captures
and re-captures. Ecology 79:2852-2862.[4] Silver, S. C., Ostro, L. E. T.,Marsh, L. K.,Maffei, L.,Noss, A. J.,Kelly, M. J.,Wallace, R. B.,Gomez, H. and
Ayala, G. 2004. The use of camera-traps for estimating jaguar Panthera onca abundance and densityusing capture/recapture analysis. Oryx 38:148-154.
[5] Kéry. M. 2011. Species richness and community dynamics: A conceptual framework. In: Camera-trapsin animal ecology: methods and analyses. O’Connell, A. F., Nichols, J. D., and Karanth, K. U. (Eds.) pp.207-231. Springer, New York.
Mongabay.com Open Access Journal - Tropical Conservation Science Vol.6 (6):781--795, 2013
Tropical Conservation Science | ISSN 1940-0829 | Tropicalconservationscience.org792
[6] Tobler, M. W., Carrillo-Percastegui, S. E., Leite Pitman, R., Mares, R. and Powell, G. 2008a. An evaluationof camera-traps for inventorying large and medium sized terrestrial rainforest mammals. AnimalConservation 11:169-178.
[7] Morrison, J. C., Sechrest, W., Dinerstein, E., Wilcove, D. S. and Lamoreux, J. F.2007. Persistence of largemammal faunas as indicators of global human impacts. Journal of Mammalogy 88:1363-1380.
[8] Mills, L. S., Soulé, M. E. and Doak, D. F. 1993. The keystone-species concept in ecology and conservation.Bioscience 43:219-224.
[9] Elmhagen, B. and Rushton, S. P. 2007. Trophic control of mesopredators in the terrestrial ecosystems:top-down or bottom-up? Ecology Letters 10:197-206.
[10] Palomares, F. and Caro, T. M. 1999. Interspecific killing among mammalian carnivores. AmericanNaturalist 153:492-508.
[11] Terborgh, J., Lopez, L., Nuñez, P. V.,Rao, R., Shahabuddin, G., Orihuela, G., Riveros, M., Ascanio, R.,Adler, G. H., Lambert, T. D. and Balbas, L. 2001. Ecological meltdown in predator-free forest fragments.Science 294:1923-1926.
[12] Wright, S. J., Gompper, M. E. and DeLeon B. 1994. Are large predators keystone species in Neotropicalforests? The evidence from Barro Colorado Island. Oikos 71: 279-294.
[13] Fragoso, J. M. V., Silvius, K. M., Correa, J. A. 2003. Long distance seed dispersal by tapirs increases seedsurvival and aggregates tropical trees. Ecology 84:1998-2006.
[14] Smythe, N. 1986. Competition and resource partitioning in the guild of Neotropical terrestrialfrugivorous mammals. Annual Review of Ecology and Systematics 17:169-188.
[15] MacKenzie, D. I., Nichols, J. D.,Sutton, N.,Kawanishi, K. and Bailey, L. L. 2005. Improving inferences inpopulation studies of rare species that are detected imperfectly. Ecology 86:1101-1113.
[16] Otis, D. L., Burnham, K. P., White, G. C. and Anderson, D. R. 1978. Statistical inference from capturedata on closed animal populations. Wildlife Monographs 62:1-135.
[17] MacKenzie, D. I., Nichols, J. D., Royle, J. A., Pollock, K. H., Bailey, L. L. and Hines, J. E. 2006. Occupancyestimation and modeling. Academic Press, Burlington.
[18] O’Brien, T. G. 2008. On the use of automated cameras to estimate species richness for large- andmedium-sized rainforest mammals. Animal Conservation 11:179-181.
[19] O’Brien, T. G., Kinnaird, M. F., and Wibisono, H. T. 2011. Estimation of species richness of largevertebrates using camera traps: An example from an Indonesian rainforest. In: Camera-traps in animalecology: methods and analyses. O’Connell, A. F., Nichols, J. D., and Karanth, K. U. (Eds.) pp. 233-252.Springer, New York.
[20] Tobler, M. W., Carrillo-Percastegui, S. E., Leite Pitman, R., Mares, R. and Powell, G. 2008b. Furthernotes on the analysis of mammal inventory data collected with camera-traps. Animal Conservation11:187-189.
[21] Chassot, O., Monge, G., Powell, G. V. N., Wright, P. and Palminteri, S. 2005. San Juan-La Selva BiologicalCorridor, Costa Rica. A project of the Mesoamerican Biological Corridor to protect the Great GreenMacaw and its environment. Tropical Science Center, San José, Costa Rica.
[22] Morse, W. C., Schedlbauer, J. L., Sensie, S. E., Finegan, B., Harvey, C. A., Hollenhorst, S. J., Kavanagh, K.L., Stoian, D. and Wulfhurst, J. D. 2009. Consequences of environmental service payments for forestretention and recruitment in a Costa Rican biological corridor. Ecology and Society 14:23.
[23] Fagen, M. E., DeFries, R. S., Sensie, S. E., Arroyo, J. P., Walker, W., Soto, C., Chazdon, R. L. and Sanchum,A. 2013. Land cover dynamics following a deforestation ban in northern Costa Rica. EnvironmentalResearch Letters 8:034017.
[24] Efford, M. G. and Dawson, D. K. 2012. Occupancy in continuous habitat. Ecosphere 3:32.[25] Kelly, M. J., Noss, A. J., Di Bitetti, M. S., Maffei, L., Arispe, R. L., Paviolo, A., De Angelo, C. D. and Di
Blanco, Y. E.2008. Estimating puma densities from camera-trapping across three study sites: Bolivia,Argentina, and Belize. Journal of Mammalogy 89:408-418.
[26] Long, R. A., MacKay, P., Zielinski, W. J. and Ray, J. C. 2008. Noninvasive survey methods for carnivores.Island Press, Washington, DC.
Mongabay.com Open Access Journal - Tropical Conservation Science Vol.6 (6):781--795, 2013
Tropical Conservation Science | ISSN 1940-0829 | Tropicalconservationscience.org793
[27] Wainwright, M. 2007. The mammals of Costa Rica: a natural history and field guide. Cornell UniversityPress, Ithaca.
[28] Thornton, D., Branch, L., and Sunquist, M. 2011. Passive sampling effects and landscape location alterassociations between species traits and response to fragmentation. Ecological Applications 21:817-829.
[29] Cove, M. V., Pardo, L., Spínola, R. M., Jackson, V. L., and Saenz, J. C. 2012a. Coyote Canis latrans(Carnivora: Canidae) range extension in northeastern Costa Rica: possible explanations andconsequences. Latin American Journal of Conservation 3:82-86.
[30] Hines, J. E. 2012. Presence 4.3 – software to estimate patch occupancy and related parameters: USGS-PWRC. <http://www.mbr-pwrc.usgs.gov/software/presence.html>. Accessed 20 April 2012.
[31] Burnham, K. P. and Anderson, D. R. 2002. Model selection and multimodel inference: a practicalinformation-theoretic approach. (Second edition). Springer-Verlag, New York.
[32] Licona, M., McCleery, R., Collier, B., Brighsmith, D. J. and Lopez, R.2011. Using ungulate occurrence toevaluate community-based conservation within a biosphere reserve model. Animal Conservation14:206-214.
[33] Gannon, W. L., Sikes, R. S. and the Animal Care and Use Committee of the American Society ofMammalogists. 2007. Guidelines of the American Society of Mammalogists for the use of wild animalsin research. Journal of Mammalogy 88:809-823.
[34] Ruiz-Gutierrez, V. and Zipkin, E. F. 2011. Detection biases yield misleading patterns of speciespersistence and colonization in fragmented landscapes. Ecosphere 2(5): 61.
[35] Arita, H. T., Robinson, J. G. and Redford, K. H. 1990. Rarity in Neotropical forest mammals and itsecological correlates. Conservation Biology 4:181-192.
[36] Walpole, M. J. and Leader-Williams, N. 2002. Tourism and flagship species in conservation. Biodiversityand Conservation 11:543-547.
[37] MacKenzie, D. I. and Royle, J. A. 2005. Designing occupancy studies: general advice and allocatingsurvey effort. Journal of applied Ecology 42:1105-1114.
[38] Zeller, K. A., Nijhawan, S., Salom-Perez, R., Potosme, S. H. and Hines, J. E. 2011. Integrating occupancymodeling and interview data for corridor identification: a case study for jaguars in Nicaragua. BiologicalConservation 144:892-901
[39] Foster, R. J. and Harmsen, B. J. 2012. A critique of density estimation from camera-trap data. TheJournal of Wildlife Management 72:224-236.
[40] Cove, M. V., Niva, L. M., and Jackson, V. L. 2012b. Use of probability of detection when conductinganalyses of surveys of mesopredators: A Case Study from the Ozark Highlands of Missouri. TheSouthwestern Naturalist 57:258-262.
[41] Suasa-ard, K. and Charoenrak, T. 1999. Study of rodent pest species in pineapple plantation.Entomology and Zoology Gazette 21:175-180.
[42] Hanski, I. 2013. Extinction debt at different spatial scales. Animal Conservation 16:12-13.[43] Halley, J. M., Sgardeli, V. and Triantis, K. A. 2013. Extinction debt and the species-area relationship: a
neutral perspective. Global Ecology and Biogeography DOI: 10.1111/geb.12098.[44] Gardner, T. A., Barlow, J., Chazdon, R., Ewers, R. M., Harvey, C. A., Peres, C. A. and Sodhi, N. S. 2009.
Prospects for tropical forest biodiversity in a human-modified world. Ecology Letters 12:561-582.[45] Cove, M. V., Pardo Vargas, L. E., de la Cruz, J. C., Spínola, R. M., Jackson, V. L., Saenz, J. C. and Chassot,
O. 2013. Factors influencing the occurrence of the endangered Baird’s tapir Tapirus bairdii: potentialflagship species for a Costa Rican biological corridor. Oryx DOI:10.1017/S0030605313000070.
Mongabay.com Open Access Journal - Tropical Conservation Science Vol.6 (6):781--795, 2013
Tropical Conservation Science | ISSN 1940-0829 | Tropicalconservationscience.org794
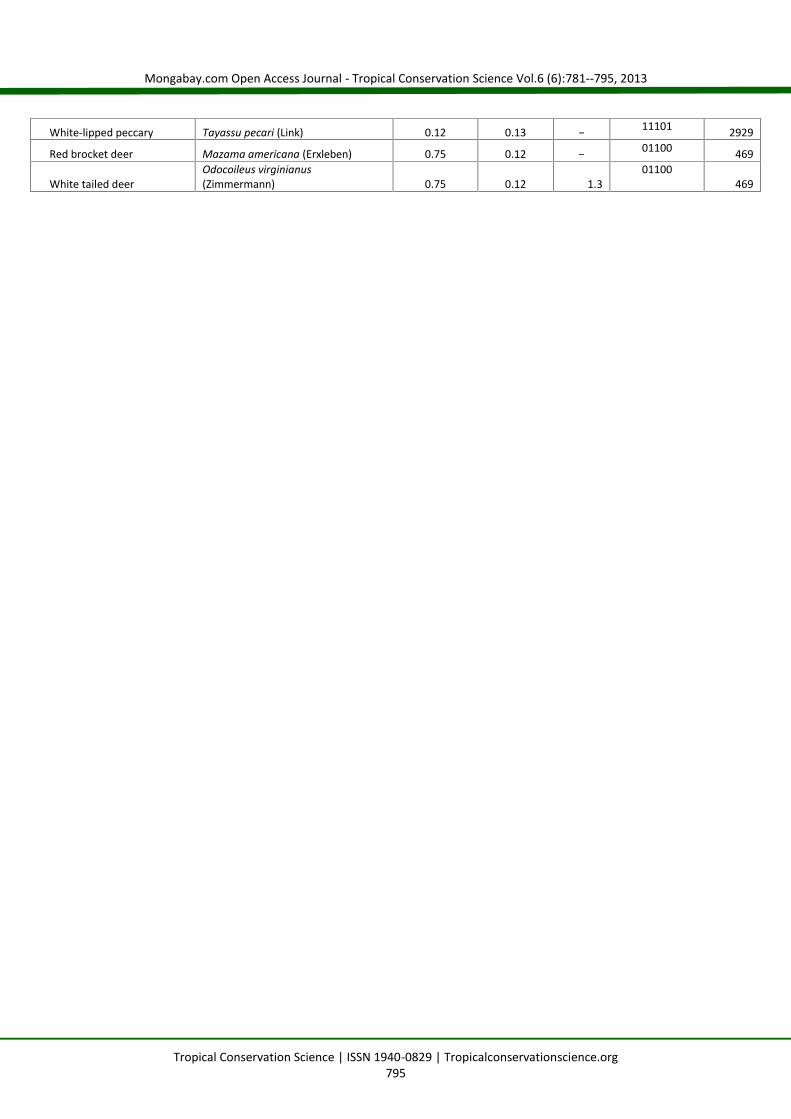
Appendix 1. Model-averaged predicted detection probability estimates with standard error, capture frequencies (CF --captures/1000 trapnights)for detected species, species traits (Spec Traits --binary covariates for rarity, size, hunted/poached, and diet), and predicted trap effort (trapnights)required to detect each species with 95% confidence derived from occupancy analysis for medium and large mammal camera-trap surveys in theSan Juan - La Selva Biological Corridor, Costa Rica, 2009-2010.
OrderCommon Name Species p̂ SE CF Spec Traits
Effortrequired
Didelphimorphia
Common opossum Didelphis marsupialis (Linnaeus) 0.69 0.07 10.1 00001 509
Brown four-eyed opossum Metachirus nudicaudatus (Geoffroy) 0.24 0.11 − 10001 1465
Grey four-eyed opossum Philander opossum (Linnaeus) 0.69 0.07 0.4 00001 509
Water opossum Chironectes minimus (Zimmermann) 0.24 0.11 − 10001 1465
Xenarthra
Giant anteater Myrmecophaga tridactyla (Linnaeus) 0.31 0.12 − 11011 1134
Northern tamandua Tamandua mexicana (Saussure) 0.25 0.10 0.4 10011 1406Northern naked tailedArmadillo Cabassous centralis (Miller) 0.24 0.11 −
100011465
Nine-banded armadillo Dasypus novemcinctus (Linnaeus) 0.69 0.07 15.3 00001 509
Rodentia
Central American agouti Dasyprocta punctata (Gray) 0.88 0.06 18.8 00000 395
Paca Cuniculus paca (Linnaeus) 0.25 0.14 8.3 10100 1406
Lagomorpha
Forest rabbit Sylvilagus brasiliensis (Linnaeus) 0.59 0.20 − 10000 596
Carnivora
Coyote Canis latrans (Say) 0.30 0.12 0.4 11001 1172
Northern raccoon Procyon lotor (Linnaeus) 0.69 0.07 3.1 00001 509
White-nosed coati Nasua narica (Linnaeus) 0.69 0.07 14.4 00001 509
Long-tailed weasel Mustela frenata Lichtenstein 0.25 0.10 − 10011 1406
Greater grison Galictis vittata (Schreber) 0.25 0.10 0.4 10011 1406
Tayra Eira barbara (Linnaeus) 0.69 0.07 10.1 00001 509
Striped hog-nosed skunk Conepatus semistriatus (Boddaert) 0.24 0.11 0.9 10001 1465
Neotropical river otter Lutra longicaudis (Olfers) 0.25 0.10 − 10011 1406
Margay Leopardus wiedii (Schinz) 0.25 0.10 0.4 10011 1406
Ocelot Leopardus pardalis (Linnaeus) 0.31 0.12 7.4 11011 1134
Jaguarundi Puma yagouarondi (Geoffroy) 0.25 0.10 − 10011 1406
Puma Puma concolor (Linnaeus) 0.12 0.13 − 11111 2929
Jaguar Panthera onca (Linnaeus) 0.12 0.13 − 11111 2929
Perissodactyla
Baird's tapir Tapirus bairdii (Gill) 0.65 0.18 3.9 11000 541
Artiodactyla
Collared peccary Pecari tejacu (Linnaeus) 0.40 0.20 1.7 01101 879
Mongabay.com Open Access Journal - Tropical Conservation Science Vol.6 (6):781--795, 2013
Tropical Conservation Science | ISSN 1940-0829 | Tropicalconservationscience.org795
White-lipped peccary Tayassu pecari (Link) 0.12 0.13 − 11101 2929
Red brocket deer Mazama americana (Erxleben) 0.75 0.12 − 01100 469
White tailed deerOdocoileus virginianus(Zimmermann) 0.75 0.12 1.3
01100469