INTEGRATING METABOLIC PATHWAYS IN POST-EXERCISE
15
J. exp. Biol. 166, 181-195 (1992) 181 Printed in Great Britain © The Company of Biologists Limited 1992 INTEGRATING METABOLIC PATHWAYS IN POST-EXERCISE RECOVERY OF WHITE MUSCLE BY PATRICIA M. SCHULTE*, CHRISTOPHER D. MOYESf AND PETER W. HOCHACHKA Department of Zoology, University of British Columbia, Vancouver, BC, Canada V6T 2A9 Accepted 6 January 1992 Summary Purine nucleotides (ATP, ADP, AMP, IMP), creatine, phosphocreatine, lactate, pyruvate and glycogen were measured in rainbow trout (Oncorhynchus my kiss) white muscle following exercise to exhaustion. Estimates of intracellular pH permitted calculation of free concentrations of nucleotides ([nucleotide] f ) required for most models of control of energy metabolism. Creatine charge, [PCr]/([PCr] + [Cr]), fell from 0.49±0.05 (mean±s.E.M.) to 0.08±0.02 with exercise but recovered completely by the first sample (2h). Although [ATP] declined to 24% of resting levels and recovered very slowly, /? A TP, [ATP]/ ([ATP] + [ADP] f +[AMP] f ), and energy charge, EC, ([ATP]+0.5[ADP] f )/ ([ATP] + [ADP] f +[AMP] f ), recovered as quickly as creatine charge. Changes in [IMP] mirrored those in [ATP], suggesting that AMP deaminase is responsible for maintaining RATP and EC. Recovery of carbon status was much slower than recovery of energy status. Lactate increased from 4 ftmol g" 1 at rest to 40 ^mol g~' at exhaustion and did not recover for more than 8h. Glycogen depletion and resynthesis followed a similar time course. During the early stages of recovery, calculated [ADP] f declined by more than 10-fold relative to the resting values. The resulting high [ATP]/[ADP] f ratios may limit the rate at which white muscle mitochondria can produce ATP to fuel glycogenesis in situ. It is postulated that the high [ATP]/[ADP]f ratios are required to drive pyruvate kinase in the reverse direction for glyconeogenesis in recovery. Introduction There have been many studies addressing the metabolic changes occurring in fish white muscle during recovery from high-intensity exercise (Milligan and Wood, 1986a,b; Milligan and McDonald, 1988; Dobson and Hochachka, 1987; * Present address: Hopkins Marine Station, Stanford University, Pacific Grove, CA 93950, USA. t Present address: Kinesiology, Simon Fraser University, Burnaby, BC, Canada V5A 1S6. Key words: rainbow trout, Oncorhynchus mykiss, exercise, purine nucleotide cycle, ATP, AMP deaminase, ADP, IMP, phosphocreatine, energy charge.
Transcript of INTEGRATING METABOLIC PATHWAYS IN POST-EXERCISE
J. exp. Biol. 166, 181-195 (1992) 1 8 1Printed in Great Britain © The Company of Biologists Limited 1992
INTEGRATING METABOLIC PATHWAYS IN POST-EXERCISERECOVERY OF WHITE MUSCLE
BY PATRICIA M. SCHULTE*, CHRISTOPHER D. MOYESfAND PETER W. HOCHACHKA
Department of Zoology, University of British Columbia, Vancouver, BC,Canada V6T 2A9
Accepted 6 January 1992
Summary
Purine nucleotides (ATP, ADP, AMP, IMP), creatine, phosphocreatine,lactate, pyruvate and glycogen were measured in rainbow trout (Oncorhynchusmy kiss) white muscle following exercise to exhaustion. Estimates of intracellularpH permitted calculation of free concentrations of nucleotides ([nucleotide]f)required for most models of control of energy metabolism. Creatine charge,[PCr]/([PCr] + [Cr]), fell from 0.49±0.05 (mean±s.E.M.) to 0.08±0.02 withexercise but recovered completely by the first sample (2h). Although [ATP]declined to 24% of resting levels and recovered very slowly, /?ATP, [ATP]/([ATP] + [ADP]f+[AMP]f), and energy charge, EC, ([ATP]+0.5[ADP]f)/([ATP] + [ADP]f+[AMP]f), recovered as quickly as creatine charge. Changes in[IMP] mirrored those in [ATP], suggesting that AMP deaminase is responsible formaintaining RATP and EC. Recovery of carbon status was much slower thanrecovery of energy status. Lactate increased from 4 ftmol g"1 at rest to 40 ^mol g~'at exhaustion and did not recover for more than 8h. Glycogen depletion andresynthesis followed a similar time course. During the early stages of recovery,calculated [ADP]f declined by more than 10-fold relative to the resting values. Theresulting high [ATP]/[ADP]f ratios may limit the rate at which white musclemitochondria can produce ATP to fuel glycogenesis in situ. It is postulated that thehigh [ATP]/[ADP]f ratios are required to drive pyruvate kinase in the reversedirection for glyconeogenesis in recovery.
Introduction
There have been many studies addressing the metabolic changes occurring infish white muscle during recovery from high-intensity exercise (Milligan andWood, 1986a,b; Milligan and McDonald, 1988; Dobson and Hochachka, 1987;
* Present address: Hopkins Marine Station, Stanford University, Pacific Grove, CA 93950,USA.
t Present address: Kinesiology, Simon Fraser University, Burnaby, BC, Canada V5A 1S6.
Key words: rainbow trout, Oncorhynchus mykiss, exercise, purine nucleotide cycle, ATP, AMPdeaminase, ADP, IMP, phosphocreatine, energy charge.
182 P. M. SCHULTE, C. D . MOYES AND P. W. HOCHACHKA
Mommsen and Hochachka, 1988; Pearson et al. 1990) but no single study hasdetermined all of the variables required to understand the control of post-exerciseenergy metabolism. While measurement of total (i.e. free+bound) tissue levels ofadenylates and phosphocreatine (PCr) can give some insight into the energy statusof the tissue, the appropriate metabolite ratios and calculated free concentrationsare much more informative.
During intense exercise, trout white muscle quantitatively converts as much as90% of its ATP pool to IMP (Mommsen and Hochachka, 1988). Because of thehigh activity of the purine nucleotide cycle enzyme AMP deaminase, changes in[ATP] do not adequately reflect adenylate status in white muscle. Although totaltissue concentrations of adenylates have been determined (Dobson andHochachka, 1987; Mommsen and Hochachka, 1987), large proportions of the totalpools of ADP and AMP are bound. Only the free proportion of the adenylatesinteract with glycolytic and mitochondrial pathways. Since PCr and creatine (Cr)are assumed to be unbound, the free adenylate concentrations can be calculatedby rearranging the following equilibrium expressions (Connett, 1988):
Cr + MgATP2" ^± MgADp- + PCr2" + H + (creatine phosphokinase), (1)
AMP2" + MgATP2" ^± ADP3" + MgADP" (adenylate kinase). (2)
As these equilibria are pH-dependent, intracellular pH must be determined toestimate free adenylate levels and interactions of the adenylates with magnesiumions must also be taken into account. The free concentrations of these metabolitescannot be calculated if PCr and Cr levels are not measured in parallel.
This study addresses changes in energy metabolism following high-intensityexercise in rainbow trout using analysis of pH (intracellular, arterial) and thesubstrates of carbon (lactate, pyruvate, glycogen) and energy (Cr, PCr, ATP,ADP, AMP, IMP) metabolism. Our goal was to obtain a more comprehensiveappraisal of the regulation of recovery metabolism than is presently available,through the use of appropriate metabolite ratios and calculation of free metaboliteconcentrations.
Materials and methods
Animals
Rainbow trout [Oncorhynchus mykiss (Walbaum)] of both sexes (mean mass560±89g; S.E.M.; N=75), obtained from West Creek Trout Ponds, Aldergrove,BC, were held outdoors in a circular tank supplied with flow-through dechlori-nated tap water at 8-12°C. Fish were fed daily by hand to satiation (Ocor PacificSalmon Feed; Moore-Clarke).
Surgical procedure
Trout (starved for one day) were anaesthetized in a buffered (NaHCO3, 2 g 1~l)MS-222 solution at a concentration of 1:6000. Cannulations were performed
Recovery metabolism in trout white muscle 183
during forced ventilation with a buffered, chilled (15°C), aerated (100% oxygen)MS-222 solution (1:16000). Fish were cannulated in the dorsal aorta (Soivio etal.1972) and allowed to recover for 48 h in an opaque black acrylic box (5cmx40cmx20cm) at 8-12°C.
Exercise protocol
Fish were transferred by net to a Brett-type swim tunnel. After 15-20min at0.25 body lengths s~\ flow was increased to the maximum the fish could attain.The speed was held constant until the fish could no longer maintain this velocity(about 3min), at which time the speed was decreased by about 30%. This speedwas held for about 5 min and then gradually increased and the cycle begun again.The flow rate was continually oscillated in this way, as the maximum attainablespeed gradually decreased, until the fish could no longer maintain its position inthe swim tunnel even at the slowest speeds. At this point, the fish did not respondto being grasped by the investigator. The entire exercise procedure tookapproximately 25-30 min to complete.
Fish were either killed immediately following exercise (at exhaustion) ortransferred back to the holding box. Fish were then randomly assigned to atreatment group and killed after 2, 4, 8 or 24 h of recovery, as required. Resting(unexercised) fish were kept in the holding box for at least 48 h prior to sampling.
At the specified sampling time, 2 ml of blood was withdrawn via a dorsal aorticcannula and placed on ice. Fish were then killed by a 2 ml injection of Somnitol(65mgml-1 sodium pentobarbitol) to minimize struggling. Once ventilationceased, a 1 cm thick cross-sectional slice was taken immediately posterior to thedorsal fin and freeze-clamped in aluminium tongs pre-cooled in liquid nitrogen.
Muscle homogenization, extraction and neutralization
A section of epaxial white muscle was ground to a fine powder in a mortarcooled in liquid nitrogen. Care was taken to remove any pieces of skin and boneprior to grinding. The sample was kept submerged in liquid nitrogen throughout.The sample (approximately 1 g) was then transferred to a pre-weighed chilled testtube containing 1 ml of ice-cold 7 % perchloric acid (PCA) and re-weighedimmediately any remaining liquid nitrogen had boiled off. 3 ml of cold PCA wasadded and the mixture was homogenized using an Ultra turrax tissue grinder.Throughout homogenization the tube was held in a slurry of salt water and ice at—5 to —10°C. Two samples (200 ̂ 1) of the homogenate were removed and storedat —80°C for later determination of glycogen. The remainder was centrifuged at12 000 g for 9 min (4°C). A sample of the supernatant was removed and neutralizedwith Tris and KOH and centrifuged at 12 000g for 3 min at 4°C. The supernatantpH was checked and adjusted with lOmolP1 KOH or HC1 as necessary. Theneutralized extract was stored at —80°C until needed. The extraction efficiency ofthis method for the labile high-energy phosphates was assessed, and both ATP andPCr were shown to undergo less than 5 % hydrolysis.
184 P. M. SCHULTE, C. D . MOYES AND P. W. HOCHACHKA
Biochemical analyses
Chromatography
High performance liquid chromatography (HPLC) was used to measure ATP,ADP, AMP and IMP, each clearly separated from other purine and pyrimidinenucleotide phosphates. The procedure was carried out using an LKB2152 HPLCcontroller and 2150 titanium pump coupled to a 2220 recording integrator. Theseparation was performed on an Aquapore AX-300 7 pum. weak anion exchanger(Brownlee laboratories) eluting at 2mlmin~1 at 55°C (Parkhouse et al. 1987, withmodifications). Elution wasisocraticfor thefirst5min, using60mmolP1 KH2PO4
(pH3.2) followed by a linear gradient from eOmmolP1 KH2PO4 (pH3.2) to750mmoir1 KH2PO4 (pH3.5) over lOmin. This concentration and pH were thenmaintained for 12min. The column was re-equilibrated for 6min with startingbuffer before the next run. Adenylates were detected at 254 nm using a Bio-Radflow-through ultraviolet monitor. Standard curves were constructed for allmetabolites over the relevant concentrations by preparing a mixed solution in60mmoir1 KH2PO4. The standard curves were linear throughout the rangerequired (^=0.99). The coefficient of variation between duplicates was always lessthan 5 %.
Analytical reagent grade KH2PO4 was pre-purified (Reiss etal. 1984, withmodifications) by passing a lmoll"1 stock solution through a Bio-Rad Econocolumn, 5 cm diameterx30 cm) packed with an anion exchange resin (AG1X8,chloride form), a cation exchanger (chelex 100, sodium form) and activatedcharcoal (14-60 mesh). The solution was kept at 4°C and constantly recirculatedthrough the column by a peristaltic pump. Immediately prior to use, the stockbuffer was diluted, brought to the appropriate pH and vacuum filtered (0.22 ^tm).With this technique, baseline disturbances caused by the impurities present in thehigh-concentration buffer were reduced by 74 %.
Spectrophotometry
All determinations were performed on a Perkin-Elmer Lambda 2 ultraviolet/visible spectrophotometer. Lactate, pyruvate, PCr and glucose were measuredusing routine NAD+/NADH-linked assays, according to Bergmeyer (1974). If thecoefficient of variation between duplicate determinations was greater than 5 %, athird run was performed and the outlier discarded. All assays were validated withappropriate standards.
Intracellular pH
Mean intracellular pH (pHi) was determined using 5,5 dimethyl oxazolidine 2,4dione (DMO) distribution (Milligan and Wood, 1986ft) and a tissue homogenatetechnique (Portner et al. 1991).
DMO distribution
Approximately 12 h prior to sampling, trout were injected through the dorsal

Recovery metabolism in trout white muscle 185
aortic cannula with 10 fid of [3H]mannitol and 2.5/iCi of [14C]DM0 (NewEngland Nuclear) in Cortland's fish physiological saline (total volume 500^1). ThepH of the arterial blood sample collected just prior to Somnotol injection wasmeasured within 4min using a Radiometer microelectrode (type E5021) main-tained at 10°C using a recirculating water bath and linked to a Radiometer 26 pHmeter.
White muscle levels of 3H and 14C radioactivity were measured in 1 ml of thePCA extract used for metabolite assays using Amersham ACSII aqueous fluor. Allsamples were counted on an LKB 1214 Rackbeta liquid scintillation counter usingdual-label quench correction. Total tissue water was determined by drying a 1-2 gsample to constant mass in an oven at 75 °C. The pK for DMO was taken fromMalan et al. (1976).
Measurement of homogenate pH
Approximately 200 mg of muscle was ground under liquid nitrogen and added toa 1.5 ml Eppendorf tube. The tube was then quickly filled with a solution of160mmoll~' KF and l m m o l F 1 disodium nitrilotriacetate, stirred briefly with aneedle and capped. The insoluble fraction was spun down (3-5 s in a microcentri-fuge at room temperature). Samples of the supernatant were taken for repeatedmeasurement of pH as with the blood samples. Variation in pH between replicatesfrom the supernatant was usually less than ±0.005 pH units and from the samemuscle powder less than ±0.02 pH units.
Free adenylates
Free cytoslic concentrations of ADP and AMP were calculated while taking intoaccount the dependence of the equilibrium conditions on pH and [Mg2+](Connett, 1988, 1990). We assessed three variables that reflect the energy state ofthe cell: Cr charge=[PCr]/([Cr] + [PCr]), JRATP=[ATP]/([ATP] + [ADP]f+[AMP]f); and EC=([ATP]+0.5[ADP])/([ATP] + [ADP] + [AMP]). The values ofequilibrium constants {Kcq) selected (Table 1) were corrected to conditions ofionic strength equivalent to that in vivo (^=0.17-0.2) and wherever possible to atemperature of 10°C using the Van't Hoff equation. Implicit in these calculationsis the assumption that all species involved are homogeneously distributedthroughout the cell.
Total magnesium was calculated for values of [Mg2+]f between 0 and20mmol I"1 using a binding site approach (Connett, 1985). Known values for totalmagnesium concentration of rainbow trout white muscle (approximately19mmoir ' both at rest and at exhaustion; Parkhouse et al. 1987) were then usedto select the most likely value for the actual intracellular [Mg2+]f. Since thisapproach yields only an estimate of [Mg2+]f, the effects of reasonable variations in[Mg2+]f on the model calculations were assessed.
Statistical analyses
All data are reported as means±s.E.M. Metabolite differences between rest

186 P. M. SCHULTE, C D . MOYES AND P. W. HOCHACHKA
Table 1. Equilibrium constants
KATP
^AfpH
^ATP
KA6P
^ A D P
^A6PH
^ A D P
KPCV
ATpJ8
K$,KP,
K™hp/CAMP
^CPKis
AAHK
Constant
26.69 (mmoir1)-1
1.13X10⁷ (moir1)550.69 (rnoir1)"1
5.84 (moll"1)-1
1534 (moir1)-1
6.10X10⁶ (moll"1)83.99 (moir1)-1
2.92 (moir1)-1
20 (moir1)-1
3.31X10⁴ (moir1)46.05 (moir1)-1
8.91 xlO6 (moir1)1.76 (moir1)-1
36.66 (moir1)-1
0.99 (moir1)-1
4.86xl09(moir1)8.1
- i
- '
- l
- l
- l
A//(kcalmor1)
3.30.0871.56.03.30.5221.06.0**
5.59-11.59
6.143.246.0
-2.4
t
Reference
11,21,3411,314221,2541,256,76
All values are corrected to ionic strength ft=O. 17-0.2.Values were corrected to 10°C except where noted (* at 25°C, t at 38°C). References: 1,
Phillips et al. (1966); 2, Smith and Alberty (1956a); 3, O'Sullivan and Perin (1964); 4, Smith andAlberty (19566); 5, Phillips et al. (1965); 6, Lawson and Veech (1979); 7, Eldar and Degani(1989).
and/or the various recovery times were assessed using a one-way analysis ofvariance (ANOVA) followed by Tukey's HSD on those variables that showed asignificant F ratio. The data were log transformed where necessary.
In the case of pH, all statistical analyses were performed using calculated [H+].The two techniques for estimating intracellular pH were compared using non-parametric tests (sign test, signed-rank test and Wilcoxon signed-rank test)because the DMO distribution technique produces pH estimates with greatervariance than the homogenate technique.
ResultsArterial and intracellular pH
The homogenate technique gave estimates of pHi which were not statisticallydistinguishable from the estimates obtained using the DMO distribution technique(Table 2). Since the homogenate technique appeared to yield greater precision, allsubsequent calculations were based on estimates of pHi derived from thehomogenate technique.

Recovery metabolism in trout white muscle 187
Table 2. Arterial pH (pHa) and intracellular pH (pHi) estimated by DMO andhomogenate methods
Time pHapHi
(homogenate)pHi
(DMO) N
RestExhaustion2h4h8h24 h
7.77±0.017.20±0.07*7.3610.07*7.31±0.07*7.63±0.177.77±0.05
7.27±0.036.6410.03*6.59±0.03*6.58±0.02*6.89±0.11*7.22±0.02
7.14±0.126.78±0.11*6.52±0.13*6.49±0.24*7.01±0.197.12±0.11
Results are expressed as mean±s.E.M.* Significantly different from resting value (P<0.05).
R Exh
Recovery time (h)
I 1 1 1 1 1 I 1 1 1 1
Fig. 1. ATP and IMP levels in trout white muscle during recovery. Bars are ±S.E.M..Numbers of animals at each time are given in the legend to Table 2. R, resting fish;Exh, immediately post-exercise.
Adenylates and PCr
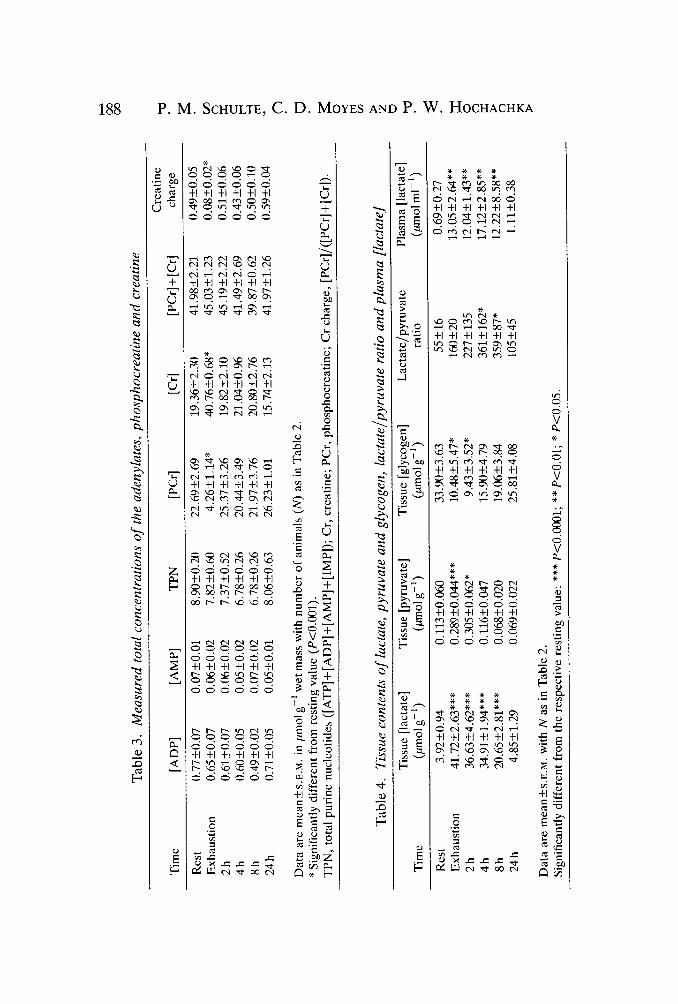
There was a stoichiometric relationship between [ATP] and [IMP] at all times(Fig. 1). Since neither [AMP] nor [ADP] changed significantly during exercise orrecovery, total purine nucleotides (TPN) also did not change (Table 3). Similarly,[PCr] + [Cr] remained unchanged, with the decrease in [PCr] due to exercise beingaccounted for by the increase in [Cr]. In contrast to [ATP] (Fig. 1), [PCr] was fullyrecovered by 2 h post-exercise (Table 3) and did not change significantly there-after. Changes in creatine charge paralleled the changes in [PCr] (Table 3),declining to approximately 16% of the resting value at exhaustion. By 2h post-exercise, creatine charge had fully recovered.

Recovery metabolism in trout white muscle 189
Carbohydrate metabolism
[Lactate] increased more than 10-fold at exhaustion and this increase could beaccounted for by the decrease in glycogen content (Table 4). Recovery of [lactate]to resting levels was relatively slow (approximately 2iumolg~"1h~1) but by 24h[lactate] had returned to resting levels. Glycogen repletion was similarly slow butby 24h [glycogen] was significantly different from the value at exhaustion.[Pyruvate] increased at exhaustion to nearly three times the resting value andremained elevated over the first 2h of recovery, after which time it decreasedrapidly, recovering entirely by 8h post-exercise. The lactate/pyruvate ratioincreased at exhaustion and over 8 h of recovery such that by 4 h post-exercise itwas significantly different from the resting value (Table 4) but by 24 h it was fullyrecovered.
Plasma [lactate] increased nearly 20-fold at exhaustion and remained elevatedthrough 8 h of recovery, but by 24 h was not significantly different from the restingvalue.
Energy metabolism
Intracellular [Mg2+]f was estimated to be close to lOmmoll"1 at rest, increasingto as high as ISmmoll"1 at exhaustion. In general, the effects on the modelcalculations of changing [Mg2+]f were small; in most cases less than 5%.Calculated [ADP]f showed the greatest variation. Resting [ADP]f ranged from18.2±2.9 to 22.3±3.6nmolg~1 tissue, with [Mg2+]f between 1 and 20mmoH"1.
[AMP]r increased significantly at exhaustion although [ADP]f did not. By 2 h ofrecovery both had declined by at least an order of magnitude (Table 5). [ADP]f
and [AMP],- gradually increased over the remainder of the recovery period so thatby 24 h post-exercise neither was significantly different from the resting values.
Energy charge (EC) and 7?ATP estimated using free metabolite concentrationsdecreased slightly at exhaustion but had recovered by 2h post-exercise (Table 5).In contrast, EC calculated without taking into account that large fractions of theADP and AMP pool are bound in vivo (ECtotai) decreased significantly atexhaustion and remained depressed until 24 h post-exercise (Table 5).
Discussion
Recovery of fish white muscle from exercise is very slow. The exact time when afish is deemed 'recovered' is highly dependent on which metabolite is measured.One of the most interesting observations of this study is the rapid recovery of [PCr]when [ATP] is approximately half of the resting levels. Conclusions about energystatus at this time would be highly dependent on which variable was favoured.Once a metabolite is chosen, the conclusion may be erroneous if the concentrationterm is inappropriate (i.e. using absolute instead of relative concentrations or totalinstead of free concentrations). When two common indices of adenylate status(/?ATP and EC) are calculated using free metabolite concentrations (Table 5), it isclear that adenylate status recovers much faster than the changes in [ATP] would

Tab
le 5
. C
alcu
late
d fr
ee c
once
ntra
tion
s of
AD
P a
nd A
MP
and
ind
ices
of
aden
ylat
e st
atus
Tim
e [A
DP
lf
[AM
PIf
EC
totd
E
Cf
RA
TP
Res
t 22
.0k3
.5
1.73
+0.
04
0.94
5kO
.004
0.
9998
+5.
9x10
K5
0.99
69k5
.1 x
10"
E
xhau
stio
n 19
.0k5
.6
5.75
k 2.
41**
0.
843
+0.
011*
* 0
.99
68
+1
.4~
10
-~
0.98
72k4
.0X
lo
p3
2
h
1.9+
0.5*
* 0.
02f
0.01
**
0.91
2+0.
012*
* 0
.99
99
k2
.7~
0
.99
95
+9
.0~
10
-5
4h
2
.7k
l.l*
*
0.07
+0.
05**
0.
914+
0.00
8**
0.99
99f
1.
5~
lo
-' 0.
9992
k3.1
x
8h
4
.2k
1.9
**
0.15
+0.
11**
0.
919+
0.00
8**
0.9
99
9+
2.0
~1
0-~
0
.99
89
+3
.3~
10
-~
24 h
11
.9k
2.6
0.55
+0.
20
0.94
7kO
.002
0.
9999
k2.5
x
0.9
98
4k
2.9
~
Cal
cula
ted
valu
es a
re m
ea
ns
ks
.~.~
. in
nm
olg-
' w
et m
ass
with
N a
s in
Tab
le 2
. **
Sig
nifi
cant
ly d
iffe
rent
fro
m r
esti
ng v
alue
(P
<0.
01).
E
nerg
y ch
arge
was
cal
cula
ted
eith
er w
ith t
he t
otal
mea
sure
d m
etab
olit
e co
ncen
trat
ions
or
usin
g th
e ca
lcul
ated
fre
e co
ncen
trat
ions
(ass
umin
g [M
g2+
If=
10 m
mol
I-'
).
RA
TP
, [ATP]/([ATP]+[ADP]~+[AMP]~);
EC
tOta
I, tota
l ad
enyl
ate
ener
gy c
harg
e; E
Cf,
fre
e cy
toso
lic
ener
gy c
harg
e; [
AD
PIf
, [A
MP
If, f
ree
cyto
soli
c co
ncen
trat
ions
of
AD
P a
nd A
MP
.

Recovery metabolism in trout white muscle 191
suggest. Comparison of energy charge calculated with free vs total metabolitesillustrates the importance of considering the free pools only. Arguments based on[ATP] alone are less meaningful. This is particularly true in trout white muscle,which has an active purine nucleotide cycle (Mommsen and Hochachka, 1988).Indeed, calculation of free adenylate concentrations offers insight into theregulation of the purine nucleotide cycle and its temporal separation intodeaminating and reaminating arms during exercise and recovery.
During exercise, a large fraction (80%) of the ATP in white muscle isstoichiometrically converted to IMP (Fig. 1) via AMP deaminase. The purpose ofthis enzyme, the deaminating arm of the purine nucleotide cycle, is to maintainadenylate status (i.e. /?ATP) at high levels to support mechanical work. AMPdeaminase is expected to be exquisitely sensitive to the changes in [AMP]f
observed in this study (Table 5). At rest [AMP]f is less than 2,umol I"1, well belowthe apparent Michaelis constant (^m,app) of rabbit muscle AMP deaminase(400^moll~1, Smiley and Suelter, 1967). The activity of AMP deaminase inrainbow trout white muscle is approximately 40Jumolmin~1g~1 (Fijisawa andYoshino, 1987). If, as a first approximation, we assume that the rate is linearlyrelated to [AMP]f up to the Kmapp, then, at the [AMP]f observed at exhaustion,there would be enough AMP deaminase activity to produce about 9/imolIMPg"1 muscle over the 30min protocol (assuming 6lumoll~1 [AMP]f), close to theobserved increase in [IMP] of about S^molg"1. At rest and during recovery,[AMP]f is much lower and IMP production would be expected to decrease. At the[AMPJf calculated for the 2 h post-exercise group (Table 5) at most 0.042 ^mol g~L
IMP could be formed over the same 30min period, less than 0.5% of the rateexpected during exercise. These changes in [AMP]f may be one of the causes ofthe separation of the purine nucleotide cycle into two temporally distinct arms infish white muscle (Mommsen and Hochachka, 1988). Furthermore, the import-ance of changes in [AMP] is obscured if the total [AMP], rather than [AMP]f, isconsidered.
During recovery, adenylate status is an important signal to intermediarymetabolism and, again, it is the free concentration of metabolites such as ADPthat influences rates of glycolysis and mitochondrial respiration. In the presentstudy, resting [ADP]f represents less than 3 % of the measured total ADP (seeTables 3 and 5). The cost of recovery metabolism (phosphagen resynthesis,glycogen repletion, ion homeostasis) is largely met by mitochondrial metabolism.The availability of free ADP relative to ATP ([ATP]/[ADP]f) is a criticaldeterminant of mitochondrial respiration in skeletal muscle, but the exact natureof the relationship is complex (see Balaban, 1990). Although total [ADP] changeslittle in rest, exercise and recovery (Table 3), [ADP]f undergoes pronouncedchanges (Table 5), which have an important influence on white muscle metab-olism. There is a strong dependence of mitochondrial oxygen uptake on ADPavailability at these low concentrations (Moyes etal 1992). At [ATP]/[ADP]f
ratios greater than 200, as is the case in trout at rest (Fig. 1 and Table 5), whitemuscle respiration is less than 10 % of the maximal capacity (Moyes et al. 1992). In

192 P. M. SCHULTE, C. D . MOYES AND P. W. HOCHACHKA
fact, if [ATP]/[ADP]f is an important determinant of respiration in vivo, it isperplexing that, relative to rest, it becomes even more inhibitory during recoverywhen metabolic demands are expected to be greater. In a parallel study, wesuggest that the added cost of recovery, as indicated by the excess post-exerciseoxygen consumption, is met by mitochondria, which are stimulated primarily bychanges in [phosphate] and influenced by pHi (Moyes et al. 1992). Instead of asignal for mitochondrial respiration, the elevated post-exercise [ATP]/[ADP]f
apparent in this study may be involved in regulation of carbohydrate metabolism.Two main questions dominate current interest in carbohydrate metabolism
during recovery from high-intensity exercise in fish white muscle. What is the fateof lactate? What is the pathway of glycogen resynthesis? Glycogen could beformed from lactate in situ or via export to the liver, where hepatic gluconeogene-sis produces glucose, which serves as a precursor for white muscle glycogen (Coricycle). There is abundant evidence to suggest that Cori cycling is not necessary, atleast for some skeletal muscles. In salmonids, there is little evidence for Coricycling as an important route of lactate metabolism and glycogen resynthesis.After injection of [14C]lactate into the blood of coho salmon following exhaustiveexercise, more than 80% of the total blood radioactivity was recovered as lactate(Milligan and McDonald, 1988). Less than 10% of the glycogen resynthesizedfollowing exhaustive exercise in the trout can be accounted for by glucose uptakeinto white muscle, based on the uptake of 2-deoxyglucose (T. G. West, P. M.Schulte and P. W. Hochachka, unpublished results). Since the sum of [glycogen] +2[lactate] is equal in rest and throughout recovery, it is unlikely that oxidation is animportant fate of lactate in recovery in this study. It appears that, in fish, themajority of the lactate formed during exhaustive exercise is converted to glycogenwithin the white muscle. The route for this pathway has not been established butthe results of this study are consistent with a pathway involving reversal ofpyruvate kinase.
In liver gluconeogenesis, phosphoenolpyruvate carboxykinase (PEPCK) andpyruvate carboxylase are required to reverse the step catalyzed by pyruvate kinasein glycolysis. Pyruvate kinase is normally thought to be an irreversible enzyme.Skeletal muscle of vertebrates lacks pyruvate carboxylase and two schemes havebeen suggested to bypass this step in skeletal muscle: (1) PEPCK+malic enzymeand (2) reversal of pyruvate kinase. Connett (1979) has argued that the metaboliteconcentrations found in recovering frog skeletal muscle suggest that pyruvatekinase is too far from equilibrium to be reversed. He suggests the PEPCK-malicenzyme route is more feasible in frog. Fish white muscle, however, also lacksPEPCK (e.g. Moon and Johnston, 1980). Consequently, glyconeogenesis in troutwhite muscle may require the reversal of pyruvate kinase. Reversal requires high[ATP] and [pyruvate] and low [ADP] and [PEP] (Dyson et al. 1975). The[ATP]/[ADPf] ratios observed in this study (500-2000) are higher than thoseobserved in liver (20, Morikofer-Zwez and Walter, 1989) and those employed byConnett for frog skeletal muscle (30-80). They are similar to ratios reported inmammalian studies (e.g. Shoubridge and Radda, 1984). Unfortunately, PEP was
Recovery metabolism in trout white muscle 193
not measured in our study so we cannot assess how close to equilibrium lie thereactants of pyruvate kinase. Newsholme and Crabtree (1986) suggest that if theratio of the mass action ratio to the equilibrium constant is between 0.2 and 5, thereaction can be assumed to be near equilibrium and reversible in vivo. Using thisas a guideline, PEP concentrations of 10-60/imolI"1 would bring this reactionnear to equilibrium in recovery. [pH-independent i£eq
= [pyruvate]x[ATP]/([PEP]x[ADP]fx[H+])=2xl0u (molT1)"1 , as used by Connett (1979).] Theseconcentrations are physiologically realistic.
The high [ATP]/[ADP]f ratios seen during recovery could be required toreverse flux through pyruvate kinase. The fact that high [ATP]/[ADP]f ratios mayalso limit oxidative metabolism well below its capacity (see Moyes et al. 1992) maybe of lesser significance. Thus, there may be a trade-off involved in which the rateof glycogen synthesis is optimized relative to the rate of oxidative phosphoryl-ation. ATP replenishment via the purine nucleotide cycle need not occur prior tothese events.
Fish white muscle exhibits, albeit to an exaggerated degree, many of the typicalcharacteristics of fast twitch glycolytic muscles from all animals. Energy metab-olism and carbohydrate metabolism in these types of muscle must be regarded asan integrated system responding to a number of controlling factors including[ADP]f and pHi. Energy metabolism and purine nucleotide cycling, however, areless closely linked, resulting in a dissociation of [ATP] and energy status. Byutilizing the calculated free concentrations of ATP, ADP and AMP, it is possibleto understand more fully these relationships and the control of muscle metabolismduring exercise and recovery.
We would like to thank Dr Peter Arthur for helpful discussions. This study wassupported by a Natural Sciences and Engineering Research Council of Canadaoperating grant to P.W.H. and a postgraduate scholarship to P.M.S.
ReferencesBALABAN, R. S. (1990). Regulation of oxidative phosphorylation in the mammalian cell. Am. J.
Physiol. 258, 377-389.BERGMEYER, H. U. (1974). Methods of Enzymatic Analysis. New York: Academic Press.CONNETT, R. J. (1979). Glyconeogenesis from lactate in frog striated muscle. Am. J. Physiol.
237, C231-C236.CONNETT, R. J. (1985). In vivo glycolytic equilibria in dog gracilis muscle. J. biol. Chem. 260,
3314-3320.CONNETT, R. J. (1988). Analysis of metabolic control: new insights using scaled creatine kinase
model. Am. J. Physiol. 254, R949-R959.CONNETT, R. J. (1990). Scaled creatine kinase model. Am. J. Physiol. 258, R1092-R1093.DOBSON, G. P. AND HOCHACHKA, P. W. (1987). Role of glycolysis in adenylate depletion and
repletion during work and recovery in teleost white muscle. J. exp. Biol. 129, 125-140.DYSON, R. D., CARDENAS, J. M. ANDBARSOTTI, R. J. (1975). The reversibility of skeletal muscle
pyruvate kinase and an assessment of its capacity to support glyconeogenesis. J. biol. Chem.250, 3316-3321.

194 P. M. SCHULTE, C. D . MOYES AND P. W. HOCHACHKA
ELDAR, H. AND DEGANI, H. (1989). 31P-NMR studies of the thermodynamics and kinetics of thecreatine kinase reaction. Mag. Res. Med. 11, 121-126.
FIJISAWA, K. AND YOSHINO, M. (1987). Activities of adenylate degrading enzymes in musclesfrom vertebrates and invertebrates. Comp. Biochem. Physiol. 86B, 109-112.
LAWSON, J. W. R. AND VEECH, R. L. (1979). Effects of pH and free Mg2+ on the Keq of thecreatine kinase reaction and other phosphate hydrolyses and phosphate transfer reactions./. biol. Chem. 254, 6528-6537.
MALAN, A., WILSON, T. L. AND REEVES, R. B. (1976). Intracellular pH in cold bloodedvertebrates as a function of body temperature. Respir. Physiol. 28, 29-47.
MILLIGAN, C. L. AND MCDONALD, D. G. (1988). In vivo lactate kinetics at rest and duringrecovery from exhaustive exercise in coho salmon (Oncorhynchus kitsuch) and starry flounder(Platichthys stellatus). J. exp. Biol. 135, 119-131.
MILLIGAN, C. L. AND WOOD, C. M. (1986a). Intracellular and extracellular acid-base status andH+ exchange with the environment after exhaustive exercise in the rainbow trout. J. exp.Biol. 123, 93-121.
MILLIGAN, C. L. AND WOOD, C. M. (1986ft). Tissue intracellular acid-base status and the fate oflactate after exhaustive exercise in the rainbow trout. J. exp. Biol. 123, 123-144.
MOMMSEN, T. P. AND HOCHACHKA, P. W. (1988). The purine nucleotide cycle as two temporallyseparated metabolic units: a study on trout muscle. Metabolism 37, 552-556.
MOON, T. W. AND JOHNSTON, I. A. (1980). Starvation and the activities of glycolytic andgluconeogenic enzymes in skeletal muscles and liver of the plaice, Pleuronectes platessa.J. comp. Physiol. 136, 31-38.
MORIKOFER-ZWEZ, S. AND WALTER, P. (1989). Binding of ADP to rat liver cytosolic proteins andits influence on the ratio of free ATP/free ADP. Biochem. J. 259, 117-124.
MOYES, C. D., SCHULTE, P. M. AND HOCHACHKA, P. W. (1992). Recovery metabolism of troutwhite muscle: The role of the mitochondria. Am. J. Physiol. (in press).
NEWSHOLME, E. A. AND CRABTREE, B. (1986). Maximum catalytic activity of some key enzymesin provision of physiologically useful information about metabolic fluxes. J. exp. Zool. 239,159-167.
O'SULLIVAN, W. J. AND PERIN, D. D. (1964). The stability constants of metal-adeninenucleotide complexes. Biochemistry, N.Y. 3, 18-26.
PARKHOUSE, W. S., DOBSON, G. P., BELCASTRO, A. N. AND HOCHACHKA, P. W. (1987). The roleof intermediary metabolism in the maintenance of proton and charge balance during exercise.Molec. cell. Biochem. 77, 37-47.
PEARSON, M. P., SPRIET, L. L. AND STEVENS, E. D. (1990). Effect of sprint training on swimperformance and white muscle metabolism during exercise and recovery in rainbow trout(Salmo gaidneri). J. exp. Biol. 149, 45-60.
PHILLIPS, R., EISENBERG, P., GEORGE, P. AND RUTMAN, R. J. (1965). Thermodynamic data forthe secondary phosphate ionizations of adenosine, guanosine, inosine, cytidine and uridinenucleotides and triphosphates. /. biol. Chem. 240, 4393-4397.
PHILLIPS, R. C , GEORGE, P. AND RUTMAN, R. J. (1966). Thermodynamic studies of theformation and ionization of the magnesium (II) complexes of ADP and ATP over the pHrange 5-9. J. Am. chem. Soc. 88, 2631-2640.
PORTNER, H. O.,BOUTILIER, R. G.,TANG, Y. AND TOEWS, D. P. (1991). The use of fluoride andnitriloacetic acid in tissue acid-base physiology. II. Intracelluar pH. Respir. Physiol. 81,255-274.
REISS, P. D., ZUURENDONK, P. F. AND VEECH, R. L. (1984). Measurement of tissue purinepyrimidine and other nucleotides by radial compression high performance liquidchromatography. Analyt. Biochem. 140, 162-171.
SHOUBRIDGE, E. A. AND RADDA, G. K. (1984). A 31P-NMR study of skeletal muscle metabolismin rats depleted of creatine with the analogue guanidinopropionic acid. Biochim. biophys.Ada 805, 79-88.
SMILEY, K. L. AND SUELTER, C. H. (1967). Univalent cations as allosteric activators of muscleadenosine 5'-phosphate deaminase. /. biol. Chem. 242, 1980-1981.
SMITH, R. M. AND ALBERTY, R. A. (1956a). The apparent stability constants of ionic complexesof various adenosine phosphates with divalent cations. J. Am. chem. Soc. 78, 2376-2380.

Recovery metabolism in trout white muscle 195
SMITH, R. M. AND ALBERTY, R. A. (19566). The apparent stability constants of ionic complexesof various adenosine phosphates with monovalent cations. J. phys. Chem. 60, 180-184.
SOIVIO, A. K., WESTMAN, K. AND NYHOLM, K. (1972). Improved method of dorsal aortacatheterization: haemotological effects followed for three weeks in rainbow trout. FinnishFish Res. 1, 11-21.