Integrating knowledge of ecosystem services into land-use decisions
24
Integrating knowledge of ecosystem services into land-use decisions Dr Daniel Rutledge Manaaki Whenua Landcare Research Presentation to Royal Society Ecosystem Services Workshop 09 August 2011, Wellington
-
Upload
howard-avery -
Category
Documents
-
view
24 -
download
0
description
Integrating knowledge of ecosystem services into land-use decisions. Dr Daniel Rutledge Manaaki Whenua Landcare Research Presentation to Royal Society Ecosystem Services Workshop 09 August 2011, Wellington. Ecosystem Services: Issues. - PowerPoint PPT Presentation
Transcript of Integrating knowledge of ecosystem services into land-use decisions

Integrating knowledge of ecosystem services into land-use decisions
Dr Daniel RutledgeManaaki Whenua Landcare Research
Presentation to Royal SocietyEcosystem Services Workshop
09 August 2011, Wellington

Ecosystem Services: Issues• Uneven/no consideration in policy, planning, and
resource management, including land-use planning
• Receiving increasing emphasis given concerns over long-term sustainability of human society
• Appealing in concept but challenging to implement in practice, especially when little or nothing is known about them

Key Questions
1. What is the current state of ecosystem services in New Zealand? How have they fared historically?
2. In the future how will changes in land use affect ecosystem services? Conversely how will changes in ecosystem services influence land-use decisions?
3. How can better knowledge about the states and trends of ecosystem services be incorporated into policy, planning and resource management?

Key Questions
1. What is the current state of ecosystem services in New Zealand and how have they fared historically?
2. In the future how will changes in land use affect ecosystem services and, conversely, how will changes in ecosystem services influence land-use decisions?
3. How can better knowledge about the states and trends of ecosystem services be incorporated into policy, planning and resource management?
Important Note
Our values and policies will influence our knowledge of ecosystem services by
influencing what information and data we decide to collect or not to collect.
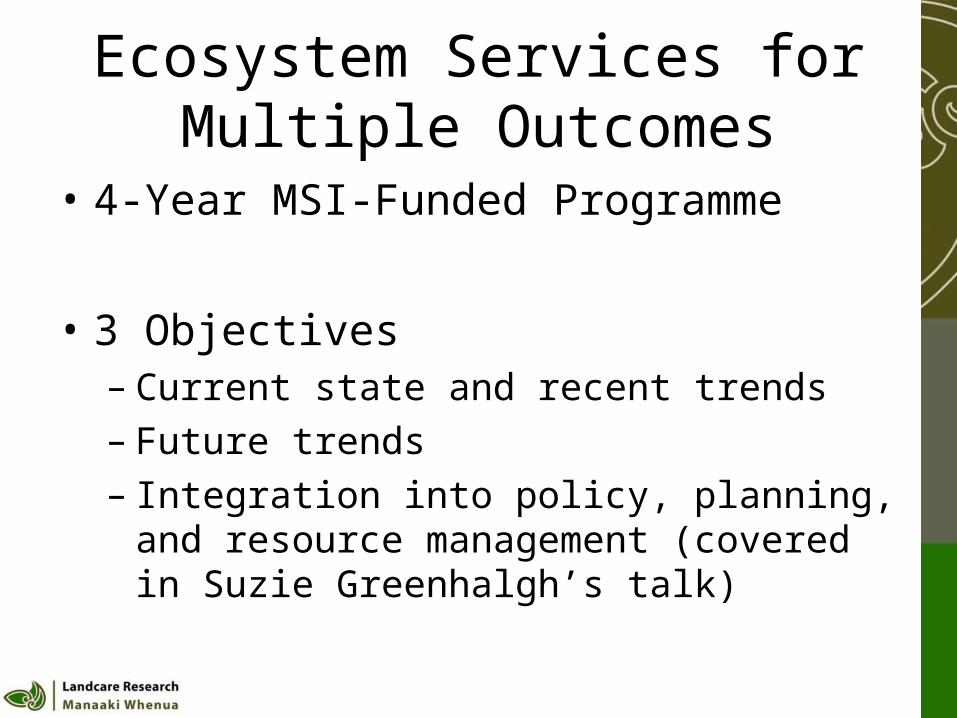
Ecosystem Services forMultiple Outcomes
• 4-Year MSI-Funded Programme
• 3 Objectives– Current state and recent trends– Future trends– Integration into policy, planning, and resource
management (covered in Suzie Greenhalgh’s talk)

CurrentState
The Approach
Past State
Identifyfuture drivers &
trends
Explore futurepossible states
Characterise past and current states and trends
?Decision Making
Understand past
drivers & trends
Monitor
Influence
Definedesired
state
Discuss & Deliberate
POLICY, PLANNING,AND MANAGEMENT
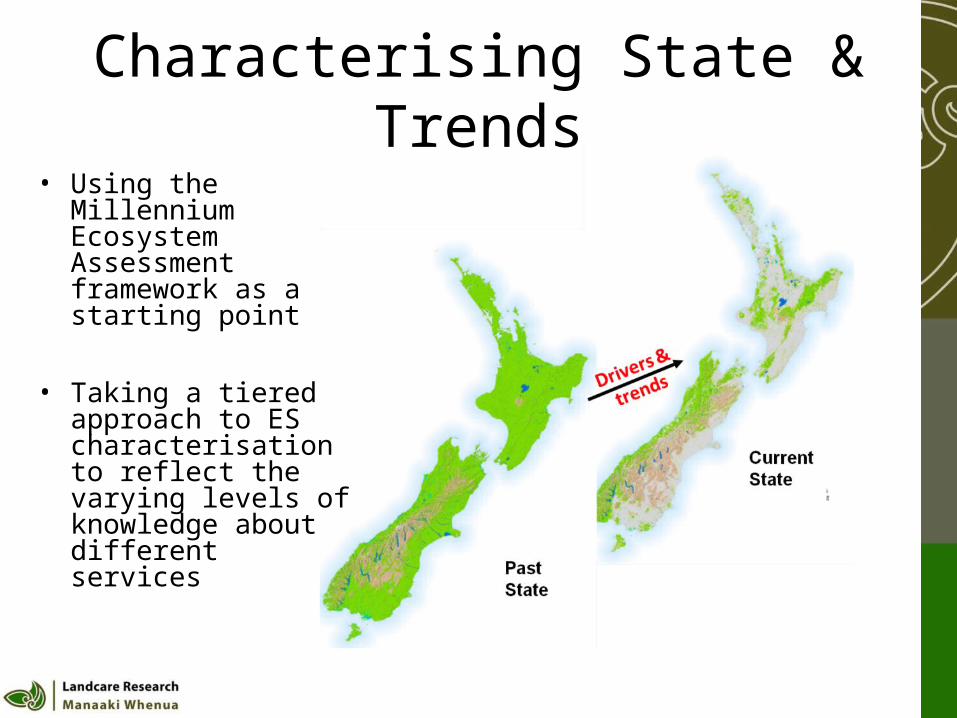
Characterising State & Trends• Using the Millennium
Ecosystem Assessment framework as astarting point
• Taking a tiered approach to ES characterisation to reflect the varying levels of knowledge about differentservices

NZ Ecosystem Services ClassificationPROVISIONING
Products obtained from ecosystems
REGULATINGBenefits from regulation of
ecosystem processes
CULTURALNon-material benefits obtained
from ecosystems
Biochemical, naturalmedicines & pharmaceuticalsFood & FibreFreshwaterFuelGenetic ResourcesOrnamental Resources
Air Quality MaintenanceBiological ControlClimate RegulationErosion ControlHuman Disease RegulationPollinationStorm ProtectionWater PurificationWater Regulation
Aesthetic ValuesCultural Heritage ValuesCultural DiversityEducational ValuesInspirationKnowledge SystemsRecreation & EcotourismSense of PlaceSpiritual & Religious ValuesSocial Relations
SUPPORTINGServices necessary for the production of all other ecosystem services
Nutrient & water cyclingPrimary productionProduction of atmospheric oxygen
Provisioning of habitatSoil formation & retention
Adapted from the Millennium Ecosystem Assessment (2005)

Tiered Approach to Ecosystem Service Characterisation
TIER I TIER II TIER IIIQualitative Quantitative Quantitative
Simple Trendsor
Knowledge Lacking
Estimate ES based on simple models or relationships with broad ecosystem conditions, e.g., land cover/use
Estimate ES based on process-based models such as erosion models, hydrological models, etc.
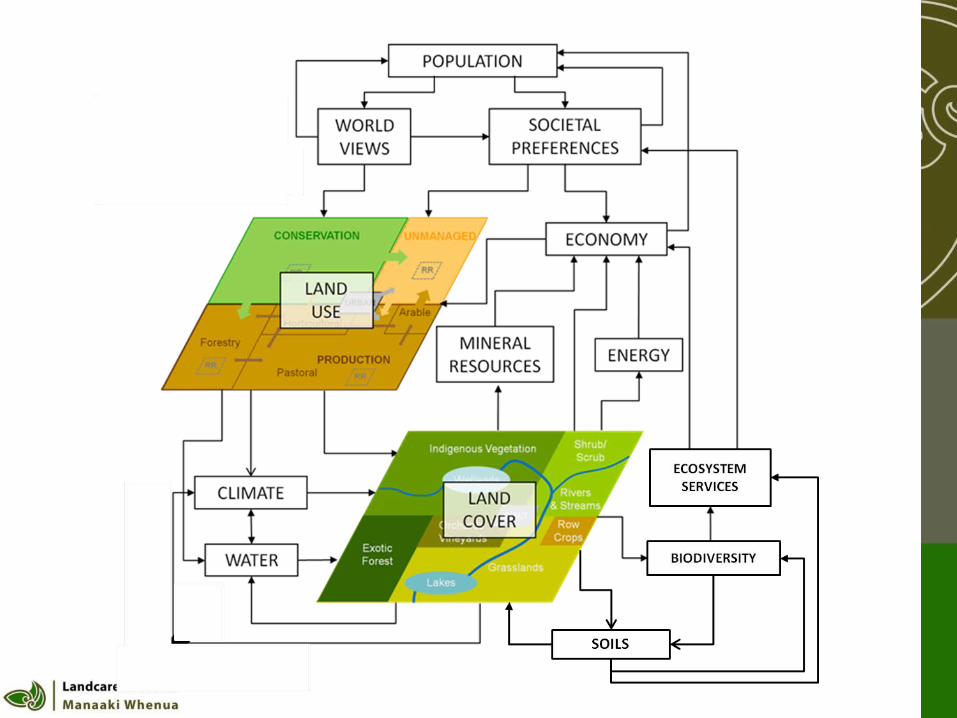
Conservation
Urban
Production
Services Land Use
Tenure
Climate
Components Services
Activity
Cover
Soils
or
?

Ecosystem Services AtlasMeat Milk
Wood Wool Sediment Retention
ClimateRegulation
WaterRegulation
Freshwater Provision

Trend Analysis ofGreenhouse Gases 1990-2003

Trend Analysis ofGreenhouse Gases 1990-2003

Exploring Future States
• Approach– Multi-scale spatially-explicit
systems modelling– National extent within a
global context– Fine resolution (1 ha or less)– 100-year time horizon
• Future Drivers & Trends– Population– Climate Change– Energy & Natural Resources– Economic Development– Societal Trends– Technology & Innovation

Land Systems Modelling• Aims to overcome some limitations of typical land-use/
land-cover change modelling– Confounding of land cover and land use– Single cover/use at any one place– Simple characterisations (e.g., dairy, urban, conservation)– Same model for different processes
• Help explore– Triggers and threshold of change– Cumulative effects – positive and negative– Shocks from rare but significant events
• Provide the ability ask more meaningful questions from a policy, planning, and resource management perspective

Example:Estimating Food Production in Urban Areas

Map Land Use Patterns
Land Use Categories Area in hectares
Site Area 15.5 ( 100%)
Building Roof Area 2.3 ( 15.1%)
Vegetation Cover 2.2 ( 14.6%)
Impervious Pathways 1.3 ( 8.5%)
Roads 1.4 ( 8.9%)
Pedestrian Pathways Impervious 0.64 ( 4.1%)
Productive Land 7.5 ( 48.8%)
Land use categoriesArea in hectares
Site Area 2.8 ( 100%)
Building Roof Area 0.62 ( 22.2%)
Vegetation Cover 0.16 ( 5.7%)
Impervious Pathways 0.57 ( 20.5%)
Roads 0.23 (8.5%)
Pedestrian Pathways Impervious 0.13 (4.7%)
Built impervious 0.1 ( 3.7%)
Productive Land 0.96 (34.7%)GLEN INNES
GRAFTONGRAFTONGhosh, S, Vale. RJD, Vale. BA, (2008) Local Food production in home gardens: measuring onsite sustainability potential of residential development, International Journal of Environment and Sustainable Development 7(4): 430-451.

Study Area: Hamilton
Image: Google Maps (maps.google.co.nz)

Residential
Parks
IndigenousForest
Study Area: Hamilton
(cover not use)
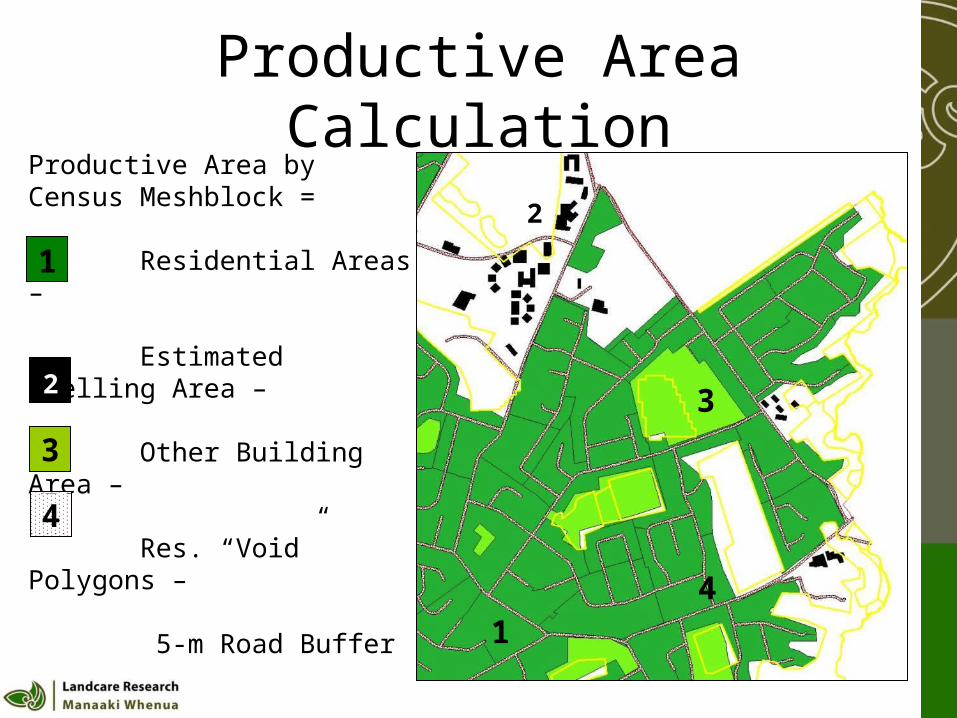
Productive Area CalculationProductive Area by Census Meshblock =
Residential Areas –
Estimated Dwelling Area –
Other Building Area –
Res. “Void” Polygons –
5-m Road Buffer
1
1
2
2
3
3
4
4

Results: Productive
Area

Land Systems Modelling Appraoch
• Advantages– Scalability– Processes operate at their own inherent scales– Able to address multiple outcomes, questions, and
issues (e.g., multiple land use)
• Disadvantages– Data hungry – how feasible is it really?– How much do we know about complexity & dynamics?– What is the appropriate level of characterisation?
Is complex necessarily better than simple?

Integration into Policy, Planning, and Resource Management
• Models and approaches to improve characterisation of ecosystem services
• Tools to explore the consequences of different land-use planning scenarios on ecosystem services (and vice-versa)

More information
www.ecosystemservices.co.nz