Integrating GIS and hydraulic modelling for efficient ... · PDF fileIntegrating GIS and...
49
Integrating GIS and hydraulic modelling for efficient water networks management March 2011, Cape Town, SA Slavco Velickov, PhD Water Industry Sales Director, EMEA
-
Upload
trankhuong -
Category
Documents
-
view
234 -
download
2
Transcript of Integrating GIS and hydraulic modelling for efficient ... · PDF fileIntegrating GIS and...

Integrating GIS and hydraulic modelling for efficientwater networks management March 2011, Cape Town, SA
Slavco Velickov, PhDWater Industry Sales Director, EMEA
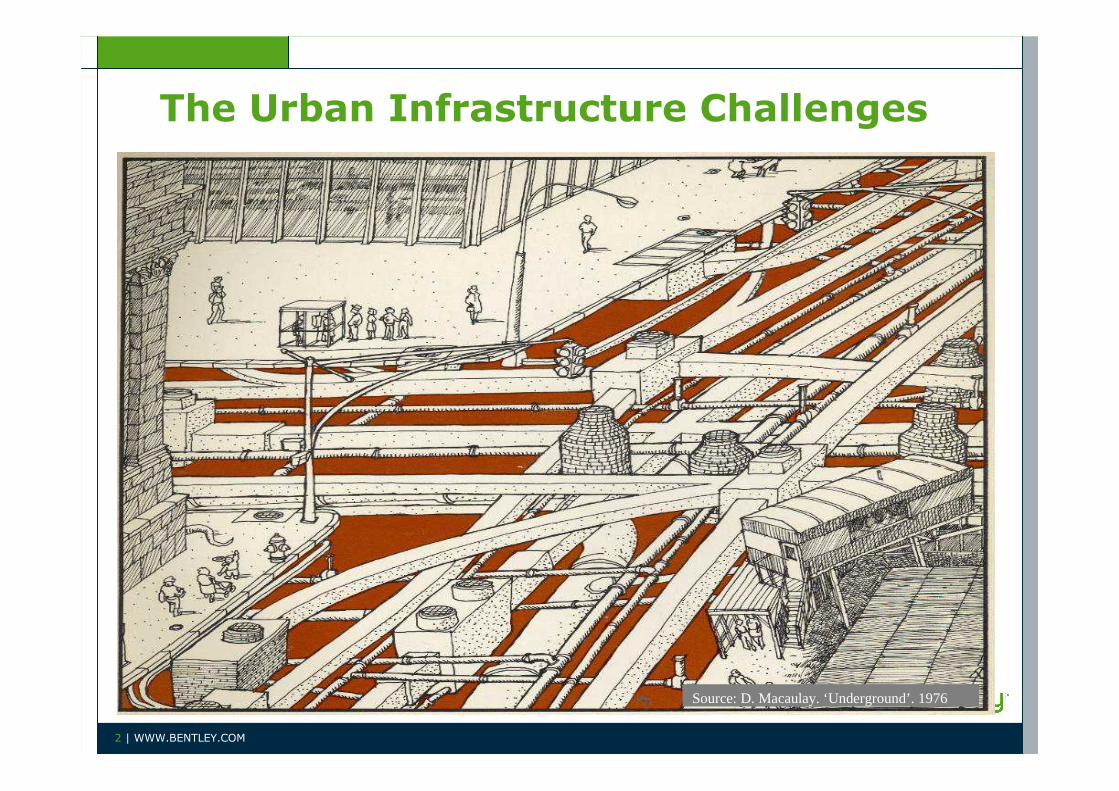
The Urban Infrastructure Challenges
2 | WWW.BENTLEY.COM
Source: D. Macaulay. ‘Underground’. 1976
Agenda
1.Bentley Solutions
2.Water Geospatial and Modelling Solutions Overview
3.Water Products Description
4.Application Examples
5.Demo
6.Contact Information
3 | WWW.BENTLEY.COM

Revenues by RegionRevenues by Region
About Bentley
4 | WWW.BENTLEY.COM

Solutions
Bridges
Oil and Gas
Electric and Gas Utilities
CommunicationsBuildings
Roads
Power Generation
FactoriesCampuses
Cadastre and Land Development
Metals and Mining
Water and Water and WastewaterWastewater
Rail and Transit
5 | WWW.BENTLEY.COM
Bentley Solutions
1. Intra-operable infrastructure software portfolio• Multi-discipline built on a common V8i platform
• Supports the Design-Build-Operate lifecycle
• Encompasses the full spectrum of infrastructure
2. Professional services and learning• Support for implementation and all change issues
3. Professional communities networking• Local and global communication opportunities
6 | WWW.BENTLEY.COM

The Water Industry Scope
• The Water Industry provides:1. Drinking water services
2. Wastewater services (including sewage treatment) and
3. Drainage and flood protection services
To: households, industry and governmental organizations.
• The Haestad family of products integrated within Geospatial framework is a backbone of the Bentley Water Solutions offer to the Water Industry market segments
7 | WWW.BENTLEY.COM

Water & Wastewater Industry Drivers
• Regulatory Compliance –Adequate Supply & Treatment capacity
–Protecting Water Quality
–Business performance
• Reliability & Safety of Infrastructure–Consistently achieving target levels of services
–Maintaining aging infrastructure
–Avoiding failure and emergency planning
• Budget–Reducing costs while improving services
–Asset investment planning for aging infrastructure
–Aging workforce
8 | WWW.BENTLEY.COM

Water Industry Solutions Architecture
sisNET WWater (BentleyWWater)
sisNET WWater (BentleyWWater)
ExpertDesigner
ExpertDesigner
MicroStationMicroStation
GeoSpatial Server & ProjectWiseGeoSpatial Server & ProjectWise
Interoperability Connectors
Interoperability Connectors
Enterprise
Connectors
Enterprise
Connectors
Web Publishing
Web Publishing
SpatialDocuments
SpatialDatabases
BusinessDocuments
ProprietaryGIS Databases
EnterpriseData Stores
Ancillary Filesw/ RDBWS
sisNET Water(BentleyWater)
sisNET Water(BentleyWater) GasAnalysisGasAnalysisHammerHammer StormCAD /
HEC-Pack
StormCAD / HEC-Pack
WebServices
Data FilesData Files
w/ Database Linkages
WaterGEMS/CAD
WaterGEMS/CAD
SewerGEMS / CAD
SewerGEMS / CAD
CivilStorm / PondPack
CivilStorm / PondPack
Industry FrameworkIndustry Framework Modeling FrameworkModeling Framework
AutoCADAutoCAD ArcGISArcGIS
SCADA &Loggers
Webclients
Webclients
Hydraulic modelling productsGIS AM products
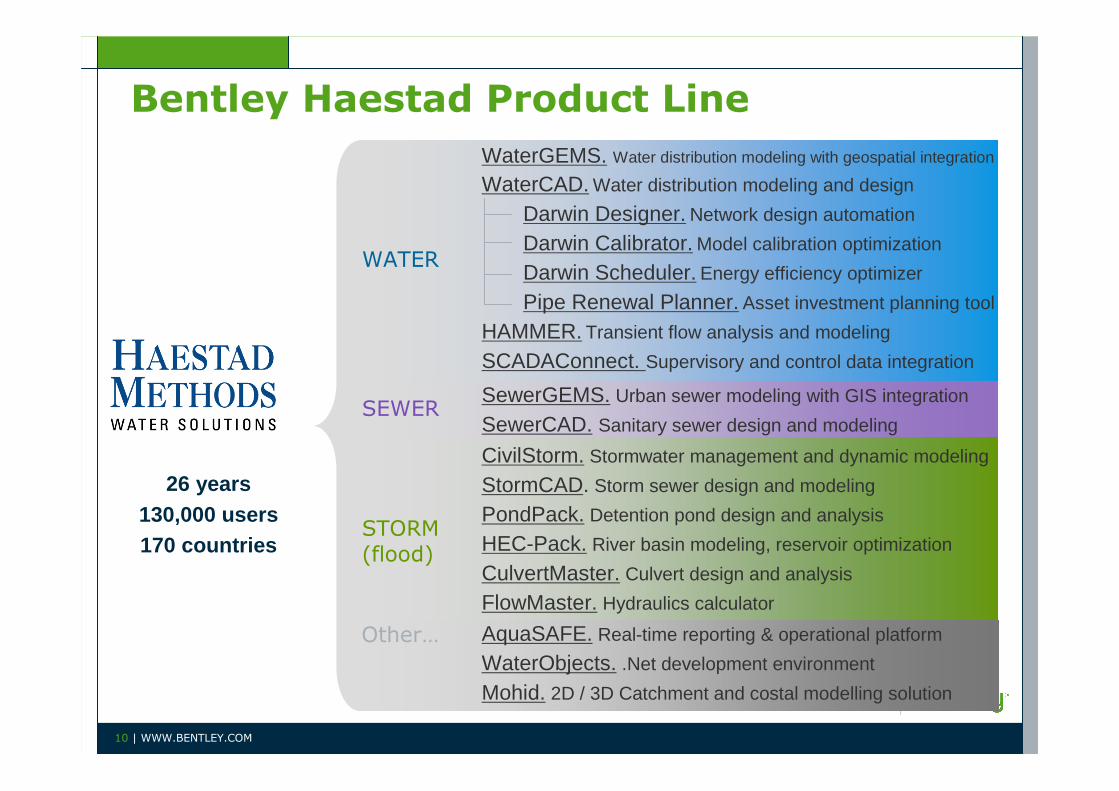
WaterGEMS. Water distribution modeling with geospatial integration
WaterCAD. Water distribution modeling and design
Darwin Designer. Network design automation
Darwin Calibrator. Model calibration optimization
Darwin Scheduler. Energy efficiency optimizer
Pipe Renewal Planner. Asset investment planning tool
HAMMER. Transient flow analysis and modeling
SCADAConnect. Supervisory and control data integration
SewerGEMS. Urban sewer modeling with GIS integration
SewerCAD. Sanitary sewer design and modeling
CivilStorm. Stormwater management and dynamic modeling
StormCAD. Storm sewer design and modeling
PondPack. Detention pond design and analysis
HEC-Pack. River basin modeling, reservoir optimization
CulvertMaster. Culvert design and analysis
FlowMaster. Hydraulics calculator
WATER
SEWER
STORM(flood)
AquaSAFE. Real-time reporting & operational platform
WaterObjects. .Net development environment
Mohid. 2D / 3D Catchment and costal modelling solution
Other…
26 years130,000 users170 countries
Bentley Haestad Product Line
10 | WWW.BENTLEY.COM

What Makes our Water Solutions GIS-integrated?
1. Multi platform environmentAn environment for every user with full GIS integration
5. Results interpretation From model results to engineering knowledge
2. Model buildingLeverage virtually any data source
3. Model management Streamlined editing with hydraulic intelligence
4. Hydraulic analysis Engineering tools for real world decisions
11 | WWW.BENTLEY.COM
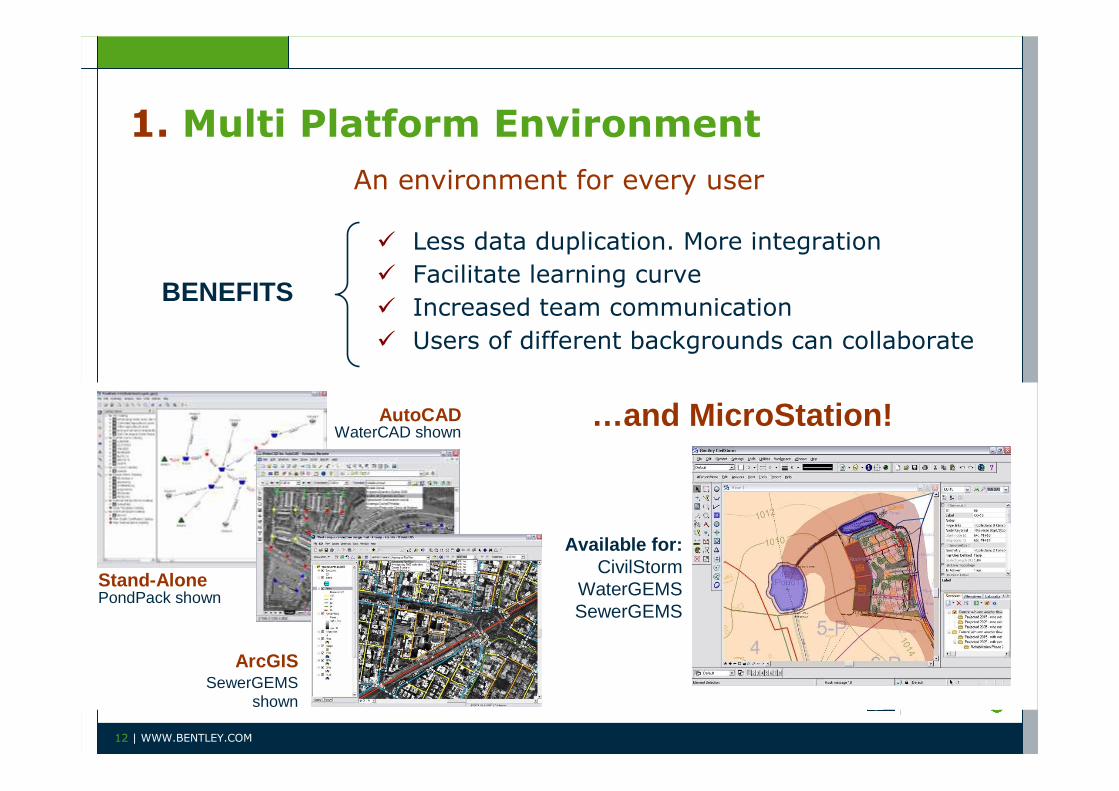
1. Multi Platform Environment
� Less data duplication. More integration
� Facilitate learning curve
� Increased team communication
� Users of different backgrounds can collaborate
ArcGIS
AutoCAD
Stand-Alone
…and MicroStation!
An environment for every user
BENEFITS
PondPack shown
WaterCAD shown
SewerGEMS shown
Available for:CivilStorm
WaterGEMSSewerGEMS
12 | WWW.BENTLEY.COM
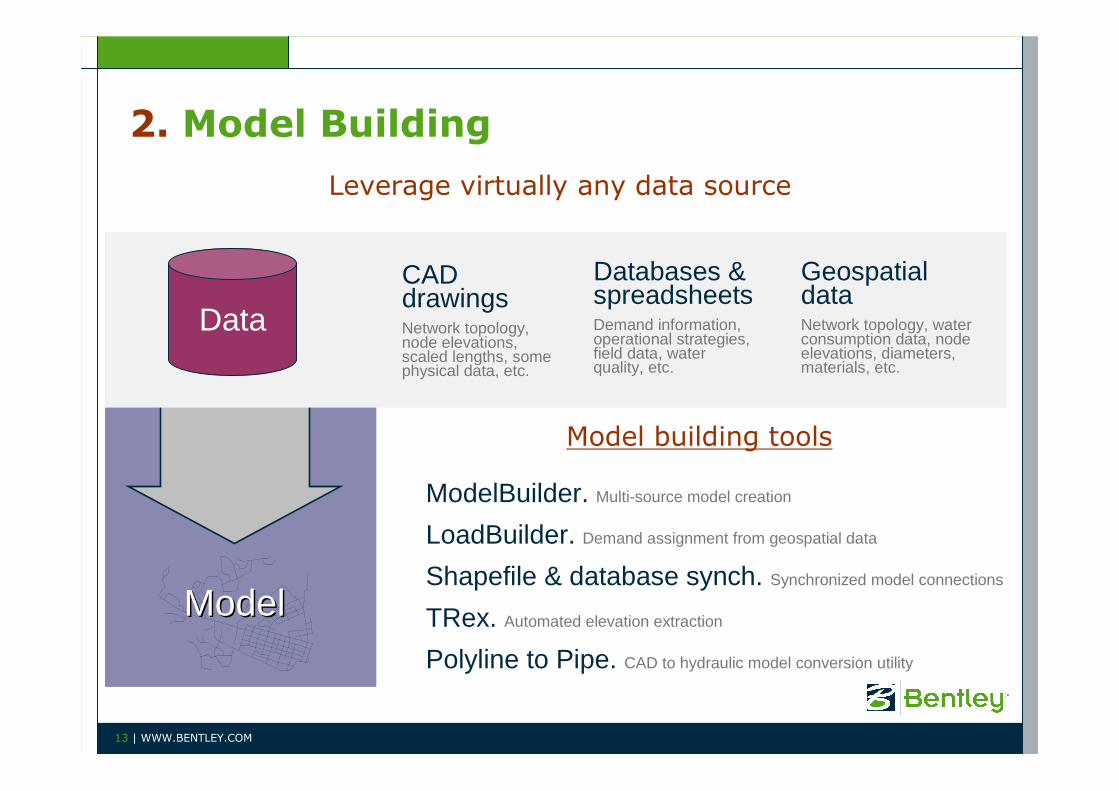
2. Model Building
Leverage virtually any data source
Data
Databases & spreadsheetsDemand information, operational strategies, field data, water quality, etc.
CAD drawingsNetwork topology, node elevations, scaled lengths, some physical data, etc.
Geospatial dataNetwork topology, water consumption data, node elevations, diameters, materials, etc.
ModelModel
ModelBuilder. Multi-source model creation
LoadBuilder. Demand assignment from geospatial data
Shapefile & database synch. Synchronized model connections
TRex. Automated elevation extraction
Polyline to Pipe. CAD to hydraulic model conversion utility
Model building tools
13 | WWW.BENTLEY.COM
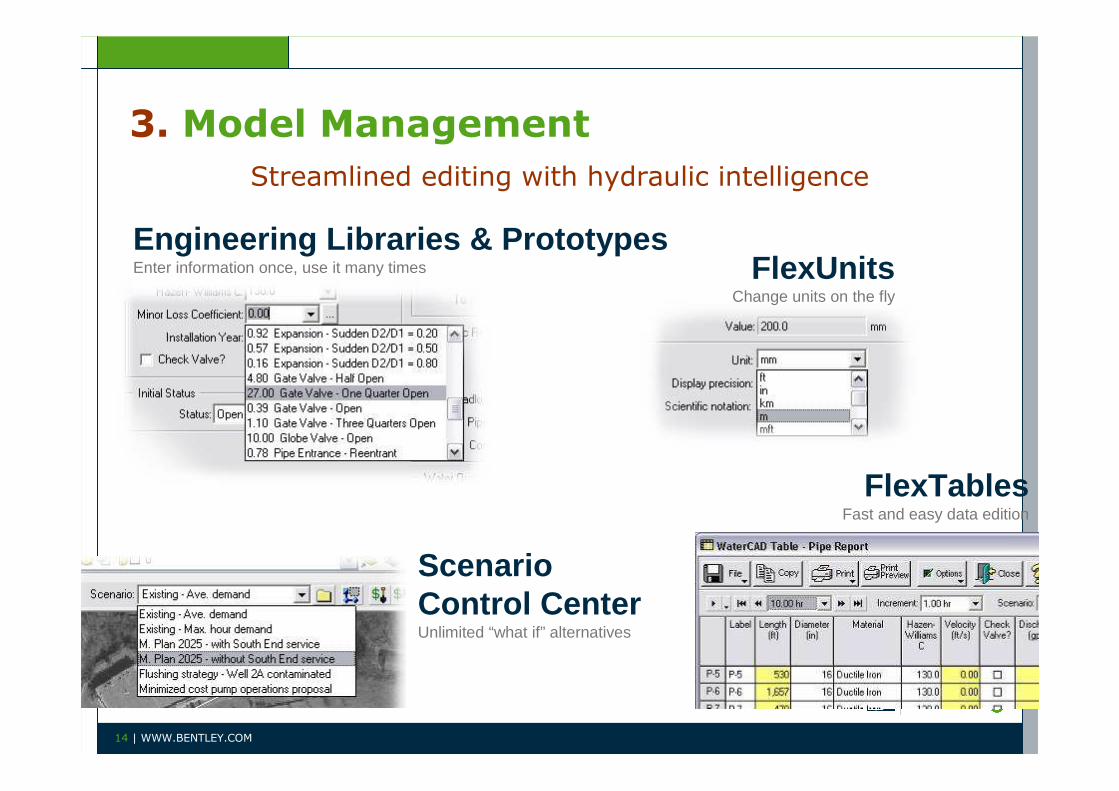
3. Model Management
Streamlined editing with hydraulic intelligence
FlexTablesFast and easy data edition
Scenario Control CenterUnlimited “what if” alternatives
FlexUnitsChange units on the fly
Engineering Libraries & PrototypesEnter information once, use it many times
14 | WWW.BENTLEY.COM
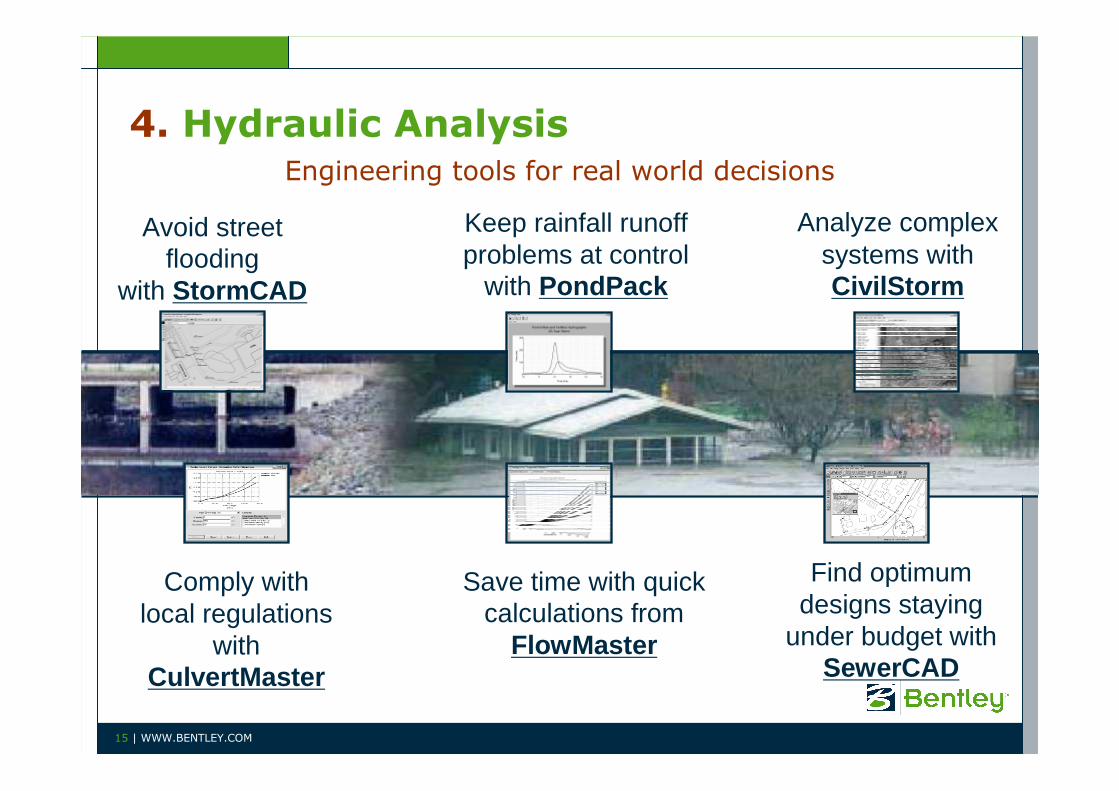
4. Hydraulic AnalysisEngineering tools for real world decisions
Comply with local regulations
with CulvertMaster
Save time with quick calculations from
FlowMaster
Keep rainfall runoff problems at control
with PondPack
Analyze complexsystems with CivilStorm
Avoid street flooding
with StormCAD
Find optimum designs staying
under budget with SewerCAD
15 | WWW.BENTLEY.COM

5. Results InterpretationFrom model results to engineering knowledge
Animated plan views withannotation and color coding
Multi scenario, time variable graphsCustomizable
reporting
Advanced engineering profilingwith animation
Geospatial visualization
16 | WWW.BENTLEY.COM

Products
17 | WWW.BENTLEY.COM

• Based on Bentley Map / MicroStation
• A solution for: electricity, gas, water, sewerage, district heating & cooling telecommunication
• Open, configurable, data model
• Powerful data creation tools in 2D and 3D
• Additional modules for specific applications
• Integrated maintenance management
• Integration options into 3rd
party applications (e.g. SAP)
18#
sisNET Multi-Utility AM Solution
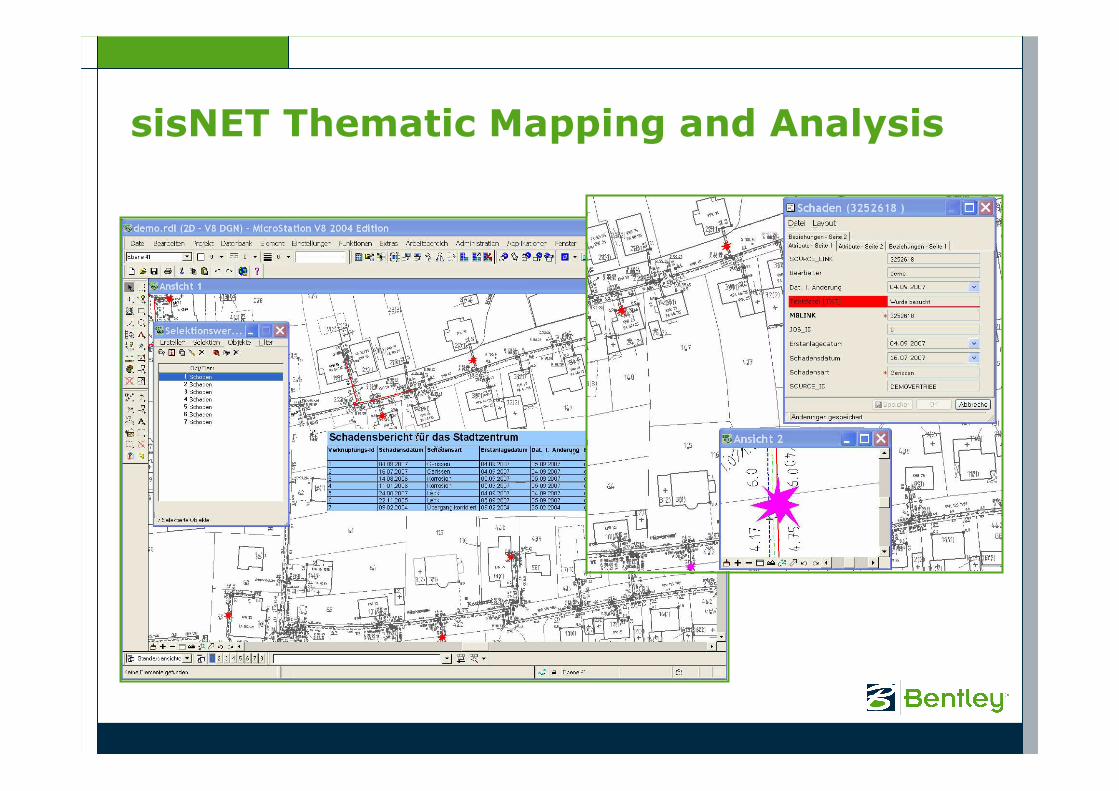
sisNET Thematic Mapping and Analysis

Bentley Water GIS AM solution

WaterGEMS Hydraulic Modelling Solution

WaterGEMS
Water distribution design, modeling and optimization with GIS integration
• Darwin Designer: network rehabilitation
• Darwin Calibrator: leakage detection
• Darwin Scheduler: energy efficiency
GIS Integration
Model Builder & LoadBuilder TRex
Automated elevation extraction
Bi-directional GIS-model
synchronization; Water demand
assignment
Hydraulic modeling
+Bentley GIS Solution
or
ESRI GIS Solution
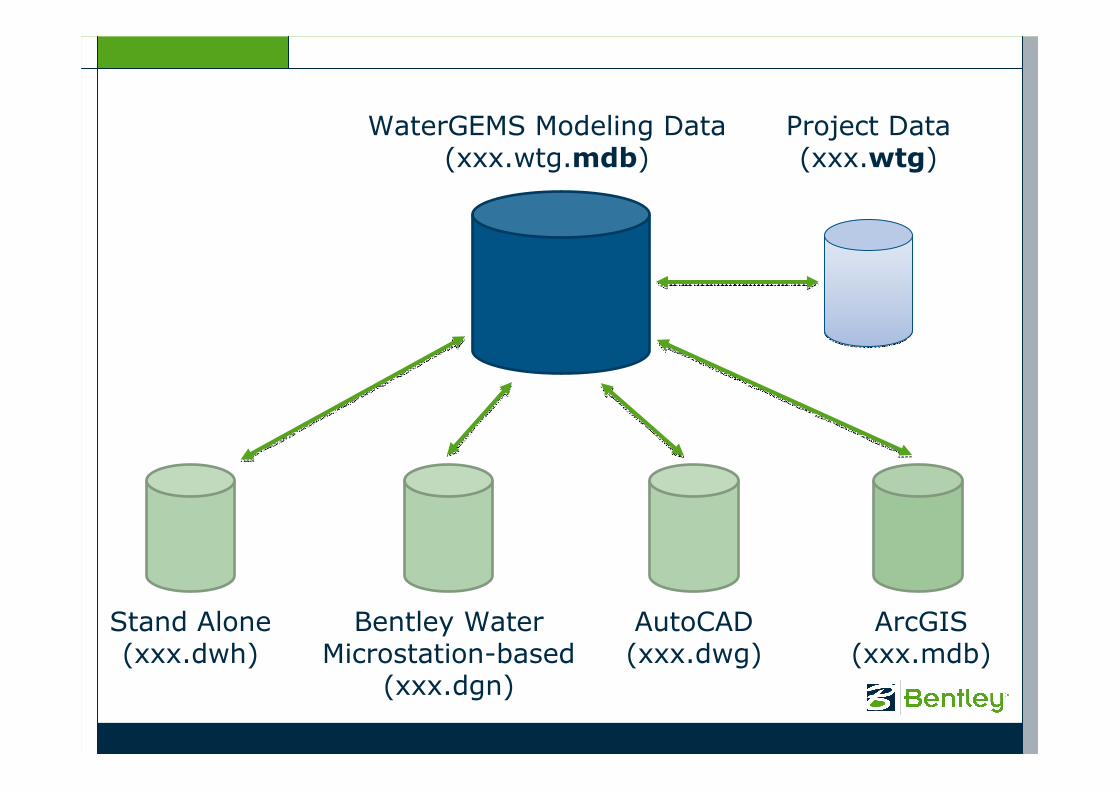
WaterGEMS Modeling Data(xxx.wtg.mdb)
Stand Alone(xxx.dwh)
Bentley WaterMicrostation-based
(xxx.dgn)
AutoCAD(xxx.dwg)
ArcGIS(xxx.mdb)
Project Data(xxx.wtg)

Bi-directional Synchronization between GIS data and Hydraulic Model
GIS/CAD Model
Build model from GIS/CAD
Correct GIS/CAD when modeler needs to update
data
Model sources Hydraulic model

SCADA Connect
25 | WWW.BENTLEY.COM
1) Configure the data source for the Real-time and Historical Scada data.
2) Map the Scada signals to the Hydraulic elements in the model and how the data is used: Initial and boundary conditions and / or real-time optimisation (calibration).

HAMMERTransient analysis and water hammer modeling
Prevent system damage
Develop cost-effective surge control strategies
Trim construction and O&M budgets
Model any surge protection device
Minimize wear and tear on pipes
Simulate any transient condition
Design and operate with greater reliability
Eliminate costly over design
Ensure the longevity of your water system
Prepare for power failures
Protect your operators
Improve water quality
Minimize service interruptions
• Avoid catastrophic failure of pipes & equipment
• Use the rigorous Method of Characteristics
• Model any transient event
• Simulate any surge protection device
• Complete integration with WaterGEMS/CAD
26 | WWW.BENTLEY.COM

Expert Designer Water V8iStreamlined, Intelligent Distribution Design for Water Utilities
Bentley Expert Designer Water improves
efficiency and throughput of distribution
design by merging network design and
work management in a single
environment. It includes sophisticated
functionality for design layout, work order
management, estimating, optimization,
job closeout, and process measurement
and tracking.
• Comprehensive Water Utility Network Design
• Open Architecture with Intuitive Interface
• Workload Management
• Multiple Design Formats
• Dynamic Cost Estimates
• Built-In Data Model and Templates
• Integrated Work Management
• Editing Tools and Data Validation
• Automated Layout
• Standard and Custom Reporting
• Context-Sensitive Help
27 | WWW.BENTLEY.COM
Example Applications
28 | WWW.BENTLEY.COM
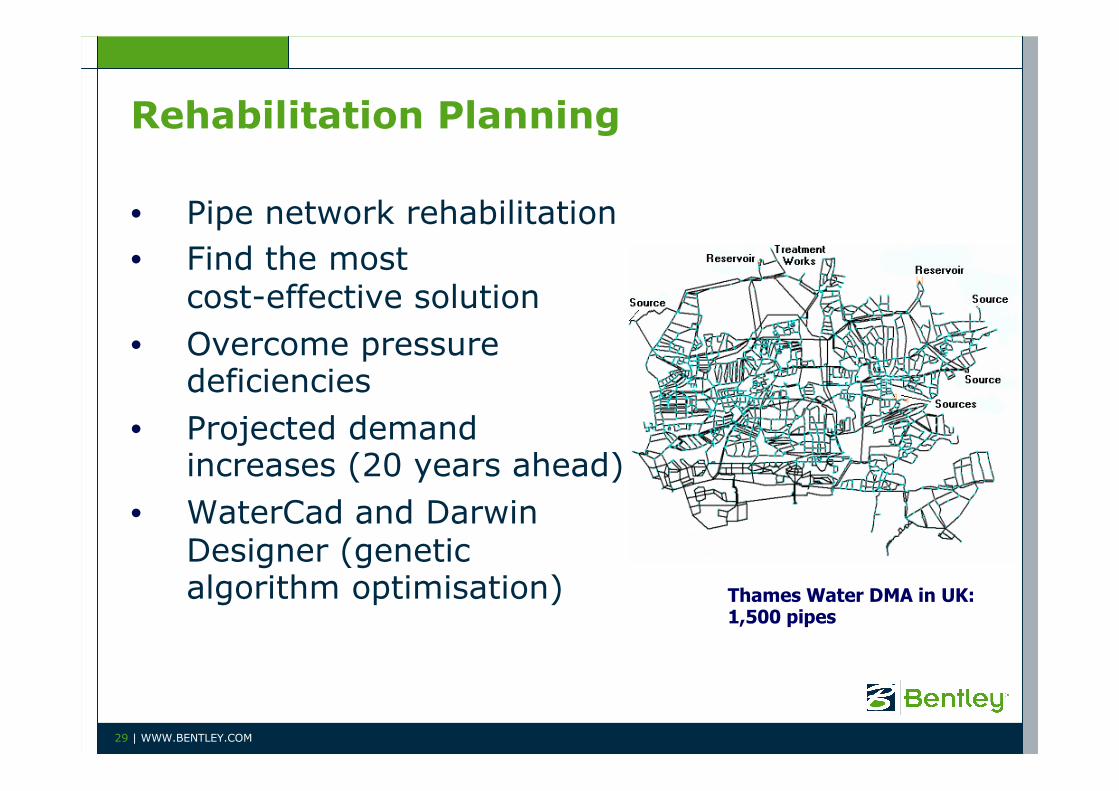
Rehabilitation Planning
• Pipe network rehabilitation
• Find the mostcost-effective solution
• Overcome pressure deficiencies
• Projected demand increases (20 years ahead)
• WaterCad and Darwin Designer (genetic algorithm optimisation) Thames Water DMA in UK:
1,500 pipes
29 | WWW.BENTLEY.COM
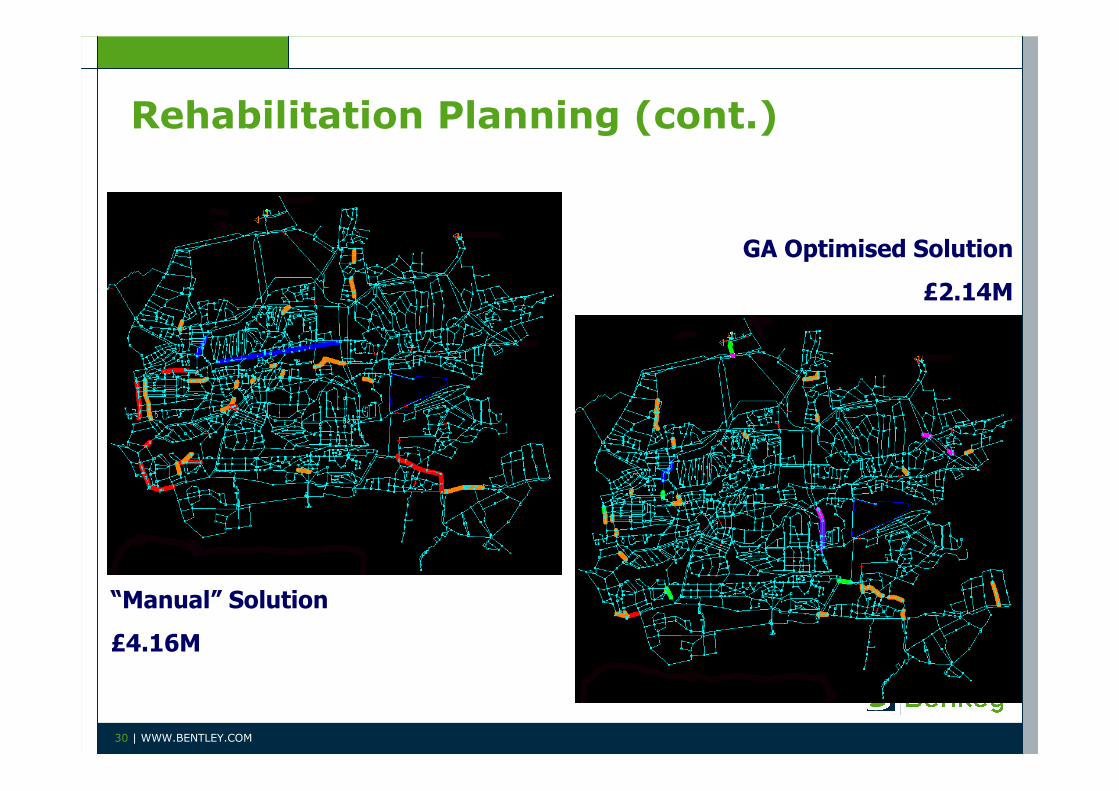
Rehabilitation Planning (cont.)
“Manual” Solution
£4.16M
GA Optimised Solution
£2.14M
30 | WWW.BENTLEY.COM

Capital Investment Planning (CIP)
• Growing demand
• Service level improvements
• Optimise design
• Meet criteria• Flow
• Pressure
• Tank storage
• Minimum cost
• Master planCity in USA:
- 300 000 inhabitants
- Contain 31 reservoirs, 14 wells, 116 pumps and more than 1600 km of pipelines
31 | WWW.BENTLEY.COM
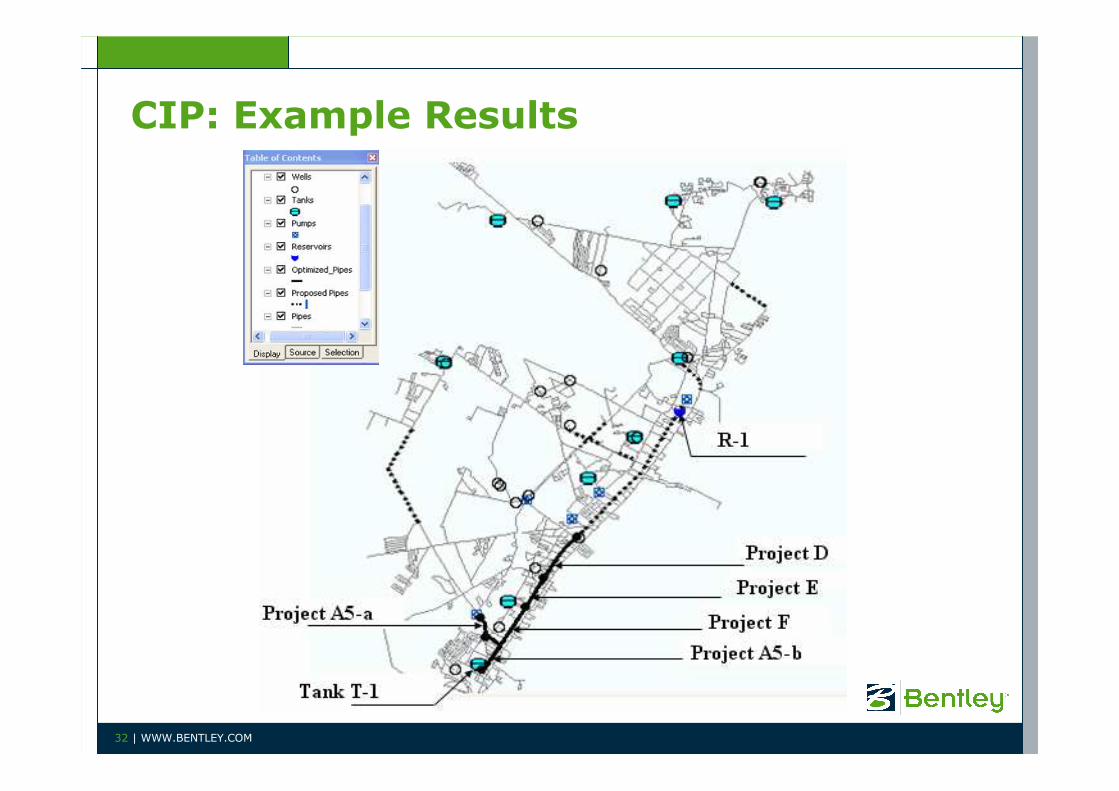
CIP: Example Results
32 | WWW.BENTLEY.COM

CIP: Pipe Installation Priority
Pipeline Project
8% Growth (20.06 mgd)
13% Growth (21.00 mgd)
18% Growth (21.92 mgd)
24% Growth (23.03 mgd)
30.4% Growth
(24.22 mgd)
Dia
Cost
Dia
Cost
Dia
Cost
Dia
Cost
Dia
Cost
(103) (103) (103) (103) (103)
PROJECT A5-a 12 169.8 16 212.3 16 212.3 16 212.3 24 283.0
PROJECT A5-b 20 511.3 20 511.3 24 568.1 16 426.0 24 568.1
PROJECT E 0 0 0 0 0 0 16 340.0 24 453.3
PROJECT F 0 0 0 0 0 0 20 874.8 24 972.0
PROJECT D 0 0 0 0 0 0 0 0 24 681.9
Total Cost ($) 681,090 723,540 780,350 1,853,100 2,958,3 00
33 | WWW.BENTLEY.COM

Sewer Deterioration Modelling
Equipment failure
5%Collapses
5%
Blockages45%
Hydraulic overload
45%
Causes of Sewer Flooding
34 | WWW.BENTLEY.COM
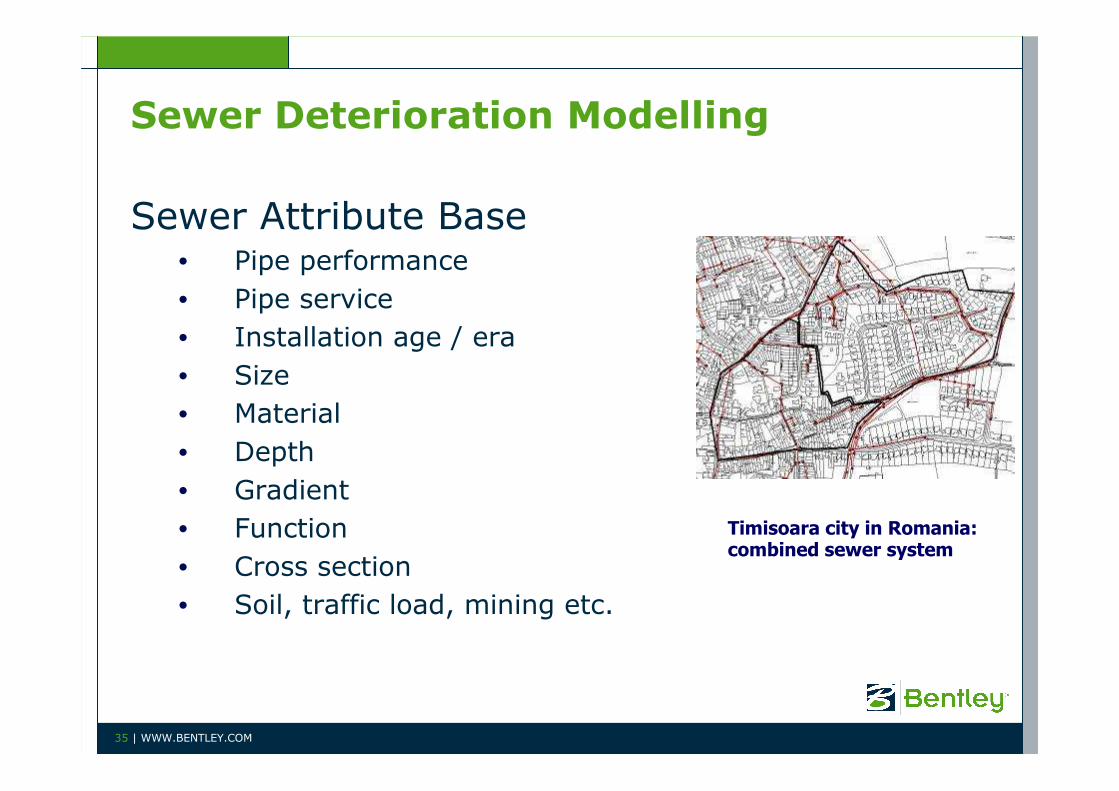
Sewer Deterioration Modelling
Sewer Attribute Base• Pipe performance
• Pipe service
• Installation age / era
• Size
• Material
• Depth
• Gradient
• Function
• Cross section
• Soil, traffic load, mining etc.
Timisoara city in Romania: combined sewer system
35 | WWW.BENTLEY.COM

Solution Techniques
• Bentley Sewer as AM & SewerGEMS for hydraulic performance assessment
• Genetic Programming for deterioration modeling
• Bayesian Probabilistic Network for Failure Risk Assessment and Uncertainty
Bentley Sewer & Bentley Sewer & SewerGEMSSewerGEMS
Bentley GP kernelBentley GP kernel
Bayesian NetworkBayesian Network
36 | WWW.BENTLEY.COM

Deterioration Model Example
• CoD = 90%
• op – operational condition grade
• Age – age of sewer
• s24 – ‘section 24 sewers’ (old, small bore)
Derby blockages using Derby Eqn 5_4
R2 = 0.9036
0
20
40
60
80
100
120
140
160
0 20 40 60 80 100 120 140 160
Actual blockages
Pre
dict
ed b
lock
ages
0.091978 op +0.10927 Age s24BL = ⋅ ⋅ ⋅
37 | WWW.BENTLEY.COM

Failure Risk Model Example
40
50
60
70
80
90
100
0 5 10 15 20 25 30 35 40
Cases
Pro
babl
ity o
f Fa
ilure
(%
)
Average failure of 40 cases
50
60
70
80
90
100
Plas tic
ConcreteEarth
enware Iron
Mat_Other
Material
Pro
babi
lity
of F
ailu
re (
%)
80
82
84
86
88
90
92
Clay Made Sand OtherGround
Pro
babi
lity
of F
ailu
re (
%)
90
90.1
90.2
90.3
90.4
90.5
Size_Small Size_Mod Size_BigSize
Pro
babi
lity
of F
ailu
re (
%)
80
82
84
86
88
90
92
Age_Young Age_Mod Age_OldAge
Pro
babi
lity
of F
ailu
re (
%)
38 | WWW.BENTLEY.COM

Pipes Renewal Planning
Part of integrated AM practice• Condition assessment tool
• Tool to rank each pipe based on several “aspects”
• Calculate a score for each aspect
• Combine scores for overall ranking
• Part of WaterGEMS
• WaterGEMS and GIS results display tools
39 | WWW.BENTLEY.COM
Bentley Water & Bentley Water & WaterGEMSWaterGEMS
Pipe Renewal Pipe Renewal Planner modulePlanner module
PipePipe--level resultslevel results

Leakage Detection
• Cause water companies / utilities lose revenues (NRW)
• Use hydraulic model as a base
• Integrate with optimization technology
• Predict leakage hotspots (unreported leakages)
DMA in UK: Oldham area
Real consumption
Metered consumption
40 | WWW.BENTLEY.COM

Leakage Detection Benchmark
• A DMA water system in UK
• High leakage rate
• Apply the latest leakage detection model in WaterGEMS
• Enable informed field survey
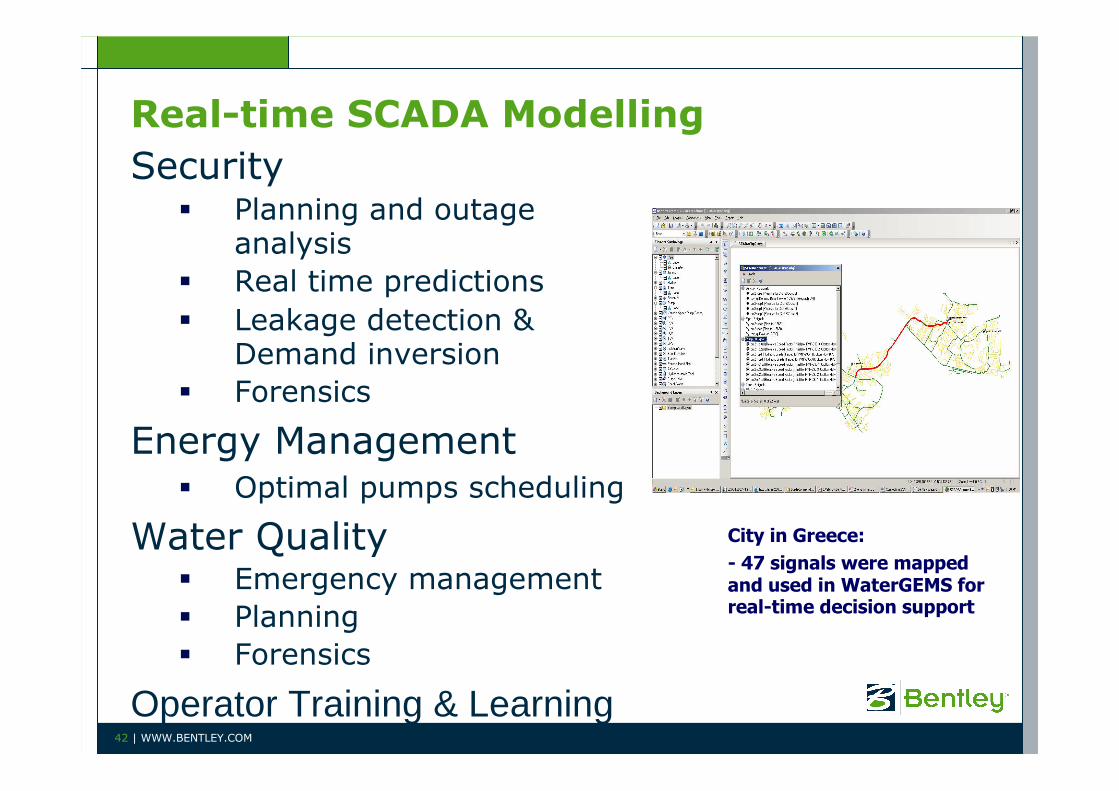
Real-time SCADA Modelling
Security� Planning and outage
analysis
� Real time predictions
� Leakage detection & Demand inversion
� Forensics
Energy Management� Optimal pumps scheduling
Water Quality� Emergency management
� Planning
� Forensics
Operator Training & Learning
City in Greece:
- 47 signals were mapped and used in WaterGEMS for real-time decision support
42 | WWW.BENTLEY.COM

Pumping Scheduling Optimization using Darwin Scheduler
43 | WWW.BENTLEY.COM
• DMZ system (United Utilities)
• 57 Ml/day
• 11 pump stations and 9 tanks
• Energy cost: £330K/year
• Recorded daily energy cost: £912
• Modeled daily energy cost: £983

Energy Cost comparison
Pump Existing controls Optimized controls
IDPump utilization (%) Daily cost (£) Pump utilization (%) Daily cost (£)
X2420052_ 100 181.99 100 181.73X2420014_ 40 142.11 41 120.51X2420075_ 42 201.95 37 141.19X2410361_ 50 31.99 42 22.65X2419963_ 50 31.99 42 22.65X241998C_ 26 7.92 31 5.18X2450024_ 40 37.35 21 13.87PILWTH 82 236.19 40 98.33NEWMRKT 23 111.63 22 88.98Total cost(£) 983.12 695.10
• Overall saving is 29% of original energy cost
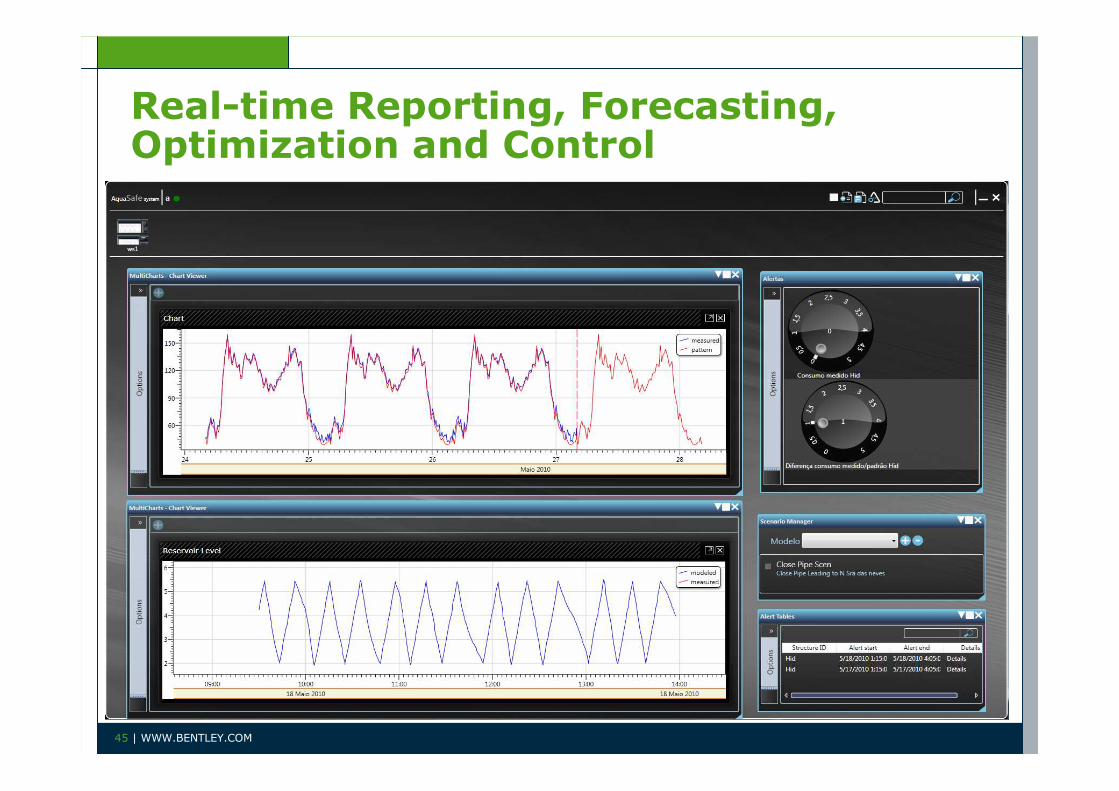
Real-time Reporting, Forecasting, Optimization and Control
45 | WWW.BENTLEY.COM

Bentley Institute Learning Offerings

Bentley Institute Press
Contact Information and Resources
Bentley Systems SA
Johannesburg
Mike, ISD
Ambrose, Geospatial AM
Sonia, AE
www.bentley.com/water
communities.bentley.comwww.bentley.com/waterloss
48 | WWW.BENTLEY.COM