Integrating Cognitive Views Into ... - files.eric.ed.gov · Integrating Cognitive Views Into...
18
Integrating Cognitive Views Into Psychometric Models for Reading Comprehension Assessment December 2017 Research Report ETS RR–17-35 Taslima Rahman Robert J. Mislevy
Transcript of Integrating Cognitive Views Into ... - files.eric.ed.gov · Integrating Cognitive Views Into...
Integrating Cognitive Views IntoPsychometric Models for ReadingComprehension Assessment
December 2017
Research ReportETS RR–17-35
Taslima Rahman
Robert J. Mislevy
ETS Research Report Series
EIGNOR EXECUTIVE EDITOR
James CarlsonPrincipal Psychometrician
ASSOCIATE EDITORS
Beata Beigman KlebanovSenior Research Scientist
Heather BuzickResearch Scientist
Brent BridgemanDistinguished Presidential Appointee
Keelan EvaniniResearch Director
Marna Golub-SmithPrincipal Psychometrician
Shelby HabermanDistinguished Presidential Appointee
Anastassia LoukinaResearch Scientist
John MazzeoDistinguished Presidential Appointee
Donald PowersPrincipal Research Scientist
Gautam PuhanPrincipal Psychometrician
John SabatiniManaging Principal Research Scientist
Elizabeth StoneResearch Scientist
Rebecca ZwickDistinguished Presidential Appointee
PRODUCTION EDITORS
Kim FryerManager, Editing Services
Ayleen GontzSenior Editor
Since its 1947 founding, ETS has conducted and disseminated scientific research to support its products and services, andto advance the measurement and education fields. In keeping with these goals, ETS is committed to making its researchfreely available to the professional community and to the general public. Published accounts of ETS research, includingpapers in the ETS Research Report series, undergo a formal peer-review process by ETS staff to ensure that they meetestablished scientific and professional standards. All such ETS-conducted peer reviews are in addition to any reviews thatoutside organizations may provide as part of their own publication processes. Peer review notwithstanding, the positionsexpressed in the ETS Research Report series and other published accounts of ETS research are those of the authors andnot necessarily those of the Officers and Trustees of Educational Testing Service.
The Daniel Eignor Editorship is named in honor of Dr. Daniel R. Eignor, who from 2001 until 2011 served the Research andDevelopment division as Editor for the ETS Research Report series. The Eignor Editorship has been created to recognizethe pivotal leadership role that Dr. Eignor played in the research publication process at ETS.

ETS Research Report Series ISSN 2330-8516
R E S E A R C H R E P O R T
Integrating Cognitive Views Into Psychometric Models forReading Comprehension Assessment
Taslima Rahman1 & Robert J. Mislevy2
1 University of Maryland, College Park, MD2 Educational Testing Service, Princeton, NJ
To demonstrate how methodologies for assessing reading comprehension can grow out of views of the construct suggested in the read-ing research literature, we constructed tasks and carried out psychometric analyses that were framed in accordance with 2 leadingreading models. In estimating item difficulty and subsequently, examinee proficiency, an item response theory (IRT) model called thelinear logistic test model was extended to incorporate reader as well as task attributes as covariates. A novel aspect of this modeling wasreader effects—interest and prior knowledge—specific to text passages that the examinees read in the assessment. In the demonstra-tion, the theory-motivated task and reader attributes were found to be significantly related to item difficulty. In particular, examinees’comprehension proficiency estimates positively affected within-person effects concerning the reader’s familiarity and interest in a pas-sage. This study suggests that it is both feasible and informative to incorporate variables for various comprehension components intothe psychometric analysis.
Keywords Comprehension; construction–integration theory; linear logistic test model; model of domain learning; prior knowledge;interest
doi:10.1002/ets2.12163
Reading comprehension, a precondition to learning from text, has been a subject of educational assessment in the UnitedStates since the early 20th century (e.g., Brown, 1916; Kelly, 1916; Starch, 1915). Reading comprehension assessment,nonetheless, has been a source of dissatisfaction throughout its history (e.g., Gates, 1921; RAND Reading Study Group[RRSG], 2002). Reading researchers believe the tests administered to assess the comprehension ability of U.S. studentsinadequately represent the complexity of the construct emerging from research in the learning sciences in general and onreading in particular (e.g., Johnston, 1984; Keenan, Betjemann, & Olson, 2008; Magliano, Millis, Ozuru, & McNamara,2007; Sarroub & Pearson, 1998; Valencia & Pearson, 1987). This misalignment is evident in the reporting of results, whichseldom delineate what students read, what they were asked to do with what they read, or student attributes specific tothe task that might have influenced comprehension of what was read. W. Kintsch and Kintsch (2005) contended that anassessment conceptualized within a theory of comprehension can also enhance our understanding of that theory.1 Oneway forward is to design a reading comprehension assessment and a coordinated measurement model that incorporatesuggestions derived from research on comprehension.
Embretson (1994, 1998) repeatedly urged that cognitive theory play an integral part in designing educational tests.Integrating cognitive theory in a test design can make the test black box involving psychometric parameters (e.g., itemdifficulty, examinee proficiency) more transparent and provide test users with more detail on the strengths and needs ofthose who take the test (Mislevy, 2006). The present study was conducted to show how reading research could be leveragedin designing tasks that are explicitly aligned to aspects of two complementary theories of reading comprehension and howpsychometric models could be employed to explicitly incorporate this theoretical stance into the analysis. To this end,illustrative psychometric models incorporating both task effects and reader*task interaction effects were fit to a small dataset of students’ responses to a test designed on cognitive principles.
A Cognitive View of Comprehension
According to reading research, each critical reading comprehension component—reader, text, activity, and situation—plays a role in the comprehension of what is being read, and each comprises many attributes (RRSG, 2002). For example,
Corresponding author: T. Rahman, E-mail: [email protected]
ETS Research Report No. RR-17-35. © 2017 Educational Testing Service 1
T. Rahman & R. J. Mislevy Integrating Cognitive Views Into Psychometric Models
a reader brings her experiences and knowledge to bear when asked to read a text. A text passage that a reader readsis characterized by its content, structure, language, and level of coherence. A task that a reader is asked to perform todemonstrate comprehension could be simple recognition of what is explicitly stated in a text; it might require reasoningthrough the given information, or it may further require the reader to integrate information in the text with world knowl-edge that the reader brings to the encounter. Reading research confirms that attributes of comprehension components,individually and collectively, affect a reader’s comprehension of a text (Alexander & Fox, 2004; Duke, 2005; van denBroek, Young, & Tzeng, 1999).
W. Kintsch’s (1998) construction and integration (CI) model explains that a text usually describes a real or imaginarysituation in the world, and the description is seldom fully coherent. Readers fill the gaps with their knowledge—aboutlanguage, the world, and the specific communicative situation. Both what is read and who reads it influence the under-standing of a text. However, in CI theory, their roles vary for the different levels of comprehension. A higher level ofcomprehension—what Kintsch referred to as the situation model—is a blend of text-driven and knowledge-driven rep-resentation of the text. A lower level, or textbase, comprehension results when a reader’s representation of a text passageaddresses just what is explicitly stated in the text. Kintsch further suggested that the product of comprehension dependson the nature of texts because each type of text—for example, literary or nonliterary and genre within each—must satisfycertain constraints and can demand specific encoding strategies and specific knowledge.
In the model of domain learning (MDL) of Alexander (1997, 2005), two reader attributes were identified as criticalfor comprehension of a given text. First, reading researchers consider prior knowledge or “readers’ familiarity with thecontent” of a text being read (Alexander & Jetton, 1996, p. 99) to be pivotal to comprehension (Alexander, 2005; Millis &Cohen, 1994; Pearson & Johnson, 1978; RRSG, 2002; van den Broek et al., 1999). Alexander and Jetton (2000) stated thata reader needs prior knowledge because it helps the reader allocate attention, direct interest, and judge the importance ofinformation, all of which are necessary to deriving meaning. Johnston (1984) even said that “if test constructors managedto produce a test in which performance was indeed unaffected by prior knowledge, whatever is measured, it would not bemeasuring reading comprehension” (p. 221).
A second reader attribute, interest (a facet of motivation), is considered in MDL to be a driving force for comprehension.Text-related interest, or interest in the topic of the text being read, can be triggered by a title, a word, a paragraph, or atheme presented in a text (Ainley, Hidi, & Berndorff, 2002; Ainley, Hillman, & Hidi, 2002; Alexander & Jetton, 1996; Hidi,2000). Interest results in focused attention to content and tends to produce a relatively enduring predisposition to engagein certain ideas or descriptions of a text (Ainley, Hidi, & Berndorff, 2002; Alexander, 1997; Hidi, 2000).
Studies conducted in the context of testing have also indicated that both prior knowledge and interest influence thecomprehension of a text (Artelt, Schiefele, & Schneider, 2001; Bray & Barron, 2004). In spite of these findings and sugges-tions, research incorporating reader attributes into the formal assessment of comprehension is at only early stages (e.g.,O’Reilly & Sabatini, 2013; Sabatini, Albro, & O’Reilly, 2012). The model described next is an initial step for incorporatingthese effects into a psychometric model so that the presence and magnitudes of these effects can be made manifest at thelevel of individual examinees.
Psychometric Model
Most reading comprehension assessments are analyzed using classical test theory methodology, where examinees’ scoresare total number of correct answers or some scaling thereof. More advanced methods are based on item response theory(IRT; Yen & Fitzpatrick, 2006), which incorporates parameters for both examinee proficiencies and individual test items.As currently practiced, the attributes of a task that make the items difficult or the attributes of an examinee that may leadto a higher probability of making a correct response are not taken into consideration in a basic IRT model, such as theRasch (1960) model described next or the three-parameter logistic model. Extensions enable these possibilities, some ofwhich have begun to appear in the research literature (e.g., De Boeck & Wilson, 2004).
The particular extension employed here was built from the Rasch model for dichotomous items. The probability ofa correct response by Examinee i to Item j is
Pij = P(
xij = 1|θi, βj
)=
exp(θi − βj
)1 + exp
(θi − βj
) ,
2 ETS Research Report No. RR-17-35. © 2017 Educational Testing Service
T. Rahman & R. J. Mislevy Integrating Cognitive Views Into Psychometric Models
where xij denotes the response of Examinee i to Item j, 1 if correct and 0 if incorrect, βj represents the difficulty of Item j,and θi represents the ability of an Examinee i, in this study, a reader.
The linear logistic test model (LLTM; Fischer, 1973, Scheiblechner, 1972) modifies the Rasch model to allow researchersto model item difficulty parameters in terms of features of tasks, thereby offering insight into the question, “What aspectsof a task make an item difficult?”
The probability of a correct response under the LLTM is.
Pij = P(
xij = 1|θi, βj, qjk, ηk
)=
exp(θi −
∑k
qjkηk
)
1 + exp(θi −
∑k
qjkηk
) ,
where the difficulty parameter of the Rasch model, βj, is a linear function of the item characteristics.
βj =K∑
k=1qjkηk = q′j𝛈,
where qjk is a known value that represents the extent to which Feature k is reflected in Item j (often 1 or 0, as in thisstudy, but not necessarily), and 𝛈= (ηi, … , ηk),where ηk is the relative contribution of Feature k to an item’s difficulty. Inmatrix notation, 𝛃=Q’𝛈. These features can be used to reflect differences in tasks’ induced cognitive processing demandson examinees. (The innovation in this study is using the LLTM structure to introduce reader-by-text interaction effects,as explained in the “Data Analysis” subsection in the “Method” section.)
Although the possibility of multiple processing variables within persons is acknowledged, the LLTM is a unidimen-sional model of individual differences among examinees: Examinee ability, θi, and item difficulty, βj, are located on acommon measurement scale: namely, positions on the latent trait. Note that LLTM models estimate fewer parametersthan the unconstrained Rasch model, and items with identical features are constrained to have identical difficulty esti-mates. LLTM item parameter estimates from the fitted regression model are not generally expected to account for all thevariations in unconstrained item difficulties.2 The LLTM has been applied retroactively to understand the difficulty ofvarious sorts of items (e.g., calculus, verbal ability, and literacy) and the influences of different testing conditions on itemdifficulty. For example, Sheehan and Mislevy’s (1990) LLTM for document literacy item difficulties used features fromKirsch and Mosenthal’s (1988) four-step cognitive processing model.
The present study applied the LLTM with a set of tasks specifically developed through a conceptualization of com-prehension driven by cognitive theory, using item features to model difficulties in the manner described earlier. Further,this study extended the use of the LLTM beyond task features alone to address text-specific reader-attribute effects oncomprehension in assessment settings in a manner detailed next.
To achieve the study’s goal, several tasks were undertaken. One major task was constructing two measures. An assess-ment measure was constructed to probe comprehension, specifically of Grade 8 students. The tasks on the comprehensionmeasure targeted two levels of text representation, textbase and situation model (W. Kintsch, 1998, 2004), that focusedon various relations among events described in each text passage. Another measure was constructed to assess two readerattributes, familiarity and interest (Alexander, 1997, 2005), as they pertained to each student for the passages included inthe comprehension measure.
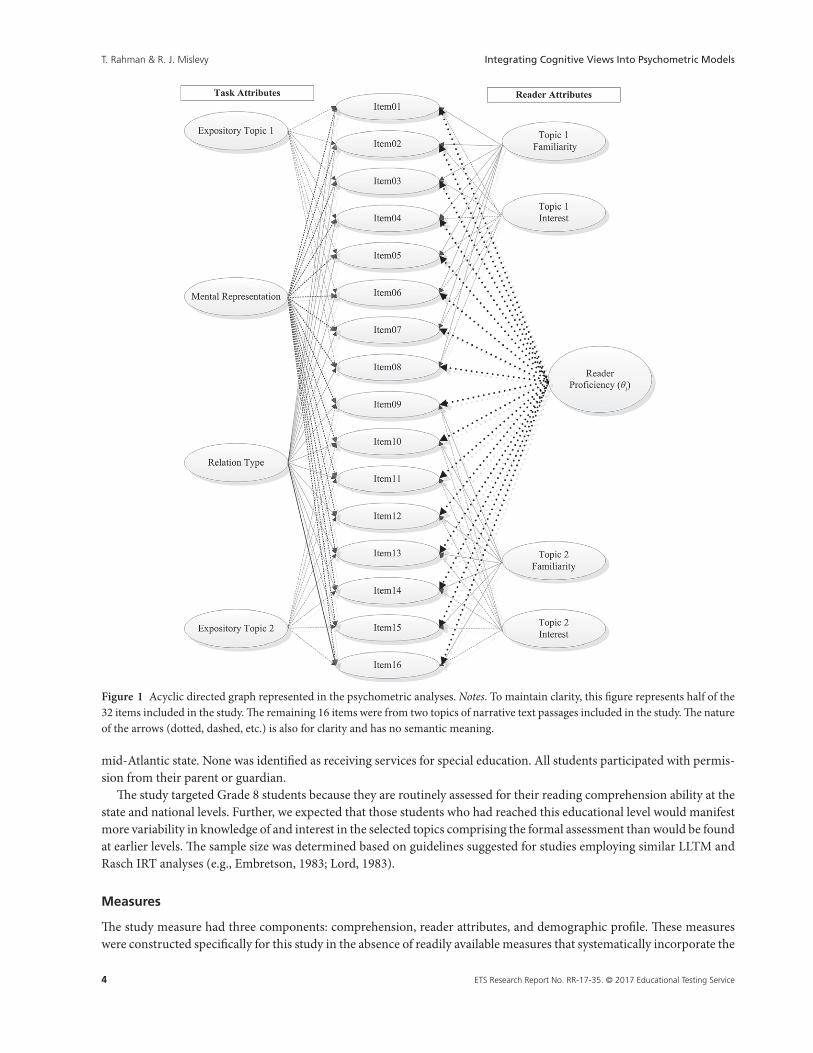
A second major task entailed defining a psychometric approach to model students’ comprehension performance. Inorder to estimate student proficiencies and task difficulties and to characterize the effects of task features and examinee-by-task interest and background, the LLTM was adapted to take into account the attributes as related to the cognitive items(Figure 1). Analyses of the data addressed the question, “Do these task and reader attributes contribute to the item diffi-culties and reader comprehension proficiencies?” As the studied group is a relatively small convenient sample of students,the contribution of the paper is not so much the answer (although it is interesting) but the model for addressing it.
Method
Participants
The participants were 160 Grade 8 students. Among them, 66 were male and 94 were female; 53% self-identified asWhite, 22% as Black, and 25% as other races; 79% attended public and 21% attended nonpublic schools located in a U.S.
ETS Research Report No. RR-17-35. © 2017 Educational Testing Service 3
T. Rahman & R. J. Mislevy Integrating Cognitive Views Into Psychometric Models
Figure 1 Acyclic directed graph represented in the psychometric analyses. Notes. To maintain clarity, this figure represents half of the32 items included in the study. The remaining 16 items were from two topics of narrative text passages included in the study. The natureof the arrows (dotted, dashed, etc.) is also for clarity and has no semantic meaning.
mid-Atlantic state. None was identified as receiving services for special education. All students participated with permis-sion from their parent or guardian.
The study targeted Grade 8 students because they are routinely assessed for their reading comprehension ability at thestate and national levels. Further, we expected that those students who had reached this educational level would manifestmore variability in knowledge of and interest in the selected topics comprising the formal assessment than would be foundat earlier levels. The sample size was determined based on guidelines suggested for studies employing similar LLTM andRasch IRT analyses (e.g., Embretson, 1983; Lord, 1983).
Measures
The study measure had three components: comprehension, reader attributes, and demographic profile. These measureswere constructed specifically for this study in the absence of readily available measures that systematically incorporate the
4 ETS Research Report No. RR-17-35. © 2017 Educational Testing Service
T. Rahman & R. J. Mislevy Integrating Cognitive Views Into Psychometric Models
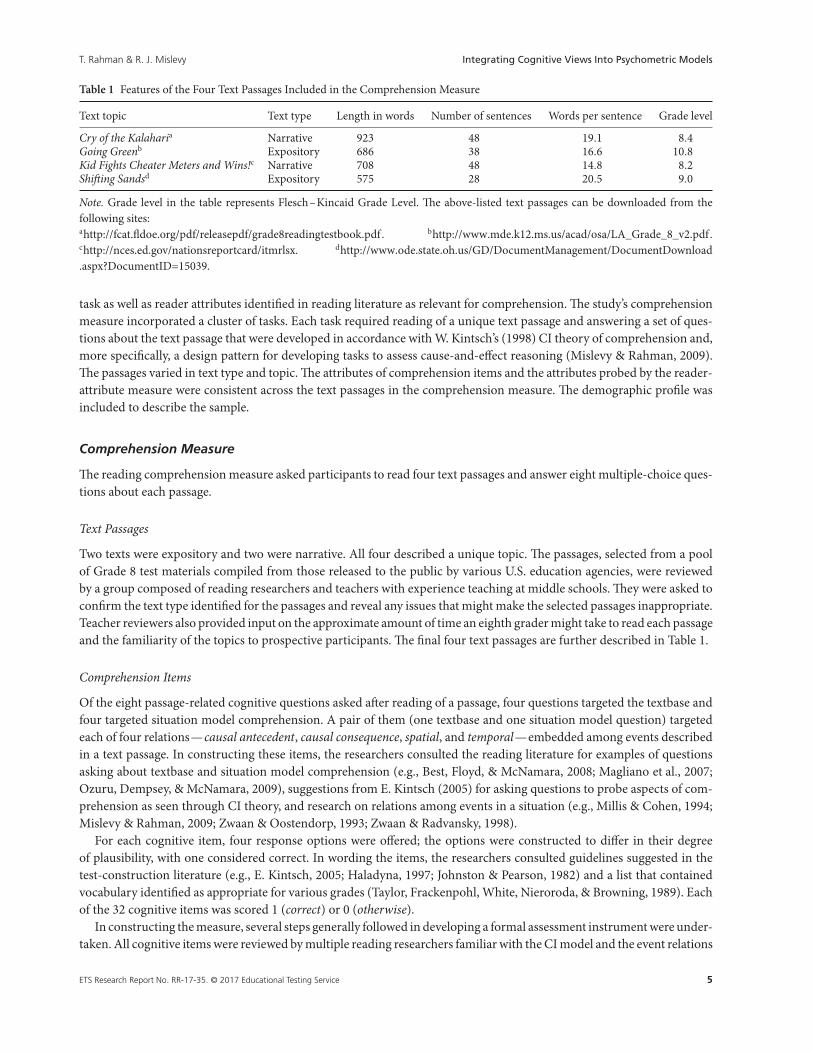
Table 1 Features of the Four Text Passages Included in the Comprehension Measure
Text topic Text type Length in words Number of sentences Words per sentence Grade level
Cry of the Kalaharia Narrative 923 48 19.1 8.4Going Greenb Expository 686 38 16.6 10.8Kid Fights Cheater Meters and Wins!c Narrative 708 48 14.8 8.2Shifting Sandsd Expository 575 28 20.5 9.0
Note. Grade level in the table represents Flesch–Kincaid Grade Level. The above-listed text passages can be downloaded from thefollowing sites:ahttp://fcat.fldoe.org/pdf/releasepdf/grade8readingtestbook.pdf. bhttp://www.mde.k12.ms.us/acad/osa/LA_Grade_8_v2.pdf.chttp://nces.ed.gov/nationsreportcard/itmrlsx. dhttp://www.ode.state.oh.us/GD/DocumentManagement/DocumentDownload.aspx?DocumentID=15039.
task as well as reader attributes identified in reading literature as relevant for comprehension. The study’s comprehensionmeasure incorporated a cluster of tasks. Each task required reading of a unique text passage and answering a set of ques-tions about the text passage that were developed in accordance with W. Kintsch’s (1998) CI theory of comprehension and,more specifically, a design pattern for developing tasks to assess cause-and-effect reasoning (Mislevy & Rahman, 2009).The passages varied in text type and topic. The attributes of comprehension items and the attributes probed by the reader-attribute measure were consistent across the text passages in the comprehension measure. The demographic profile wasincluded to describe the sample.
Comprehension Measure
The reading comprehension measure asked participants to read four text passages and answer eight multiple-choice ques-tions about each passage.
Text Passages
Two texts were expository and two were narrative. All four described a unique topic. The passages, selected from a poolof Grade 8 test materials compiled from those released to the public by various U.S. education agencies, were reviewedby a group composed of reading researchers and teachers with experience teaching at middle schools. They were asked toconfirm the text type identified for the passages and reveal any issues that might make the selected passages inappropriate.Teacher reviewers also provided input on the approximate amount of time an eighth grader might take to read each passageand the familiarity of the topics to prospective participants. The final four text passages are further described in Table 1.
Comprehension Items
Of the eight passage-related cognitive questions asked after reading of a passage, four questions targeted the textbase andfour targeted situation model comprehension. A pair of them (one textbase and one situation model question) targetedeach of four relations—causal antecedent, causal consequence, spatial, and temporal—embedded among events describedin a text passage. In constructing these items, the researchers consulted the reading literature for examples of questionsasking about textbase and situation model comprehension (e.g., Best, Floyd, & McNamara, 2008; Magliano et al., 2007;Ozuru, Dempsey, & McNamara, 2009), suggestions from E. Kintsch (2005) for asking questions to probe aspects of com-prehension as seen through CI theory, and research on relations among events in a situation (e.g., Millis & Cohen, 1994;Mislevy & Rahman, 2009; Zwaan & Oostendorp, 1993; Zwaan & Radvansky, 1998).
For each cognitive item, four response options were offered; the options were constructed to differ in their degreeof plausibility, with one considered correct. In wording the items, the researchers consulted guidelines suggested in thetest-construction literature (e.g., E. Kintsch, 2005; Haladyna, 1997; Johnston & Pearson, 1982) and a list that containedvocabulary identified as appropriate for various grades (Taylor, Frackenpohl, White, Nieroroda, & Browning, 1989). Eachof the 32 cognitive items was scored 1 (correct) or 0 (otherwise).
In constructing the measure, several steps generally followed in developing a formal assessment instrument were under-taken. All cognitive items were reviewed by multiple reading researchers familiar with the CI model and the event relations
ETS Research Report No. RR-17-35. © 2017 Educational Testing Service 5

T. Rahman & R. J. Mislevy Integrating Cognitive Views Into Psychometric Models
to ensure that the items fit the classification scheme of mental representation crossed with event dimensions. In addition,multiple professional item developers and teachers reviewed the items to detect any ambiguities in the stem or responsechoices and to identify features such as response position, length, or language that might distinguish the correct optionfrom the distracters. Items were also tested in cognitive labs and in a pilot study before they were incorporated into thefinal measure.
Four sets of booklets with different passage orders were prepared in order to mitigate possible order effects of thepassages. The order of items, which targeted different mental representations and event relations, was also varied acrossthe four text passages so a pattern was not apparent. The proportion of correct responses based on the final administrationranged from 0.09 to 0.89 (m= 0.57, SD= 0.20).
Reader-Attribute Measure
The study participants were asked to self-report their familiarity with and interest in the topics of each of the four text pas-sages. For each text topic, the familiarity questions asked readers (a) how much they knew about two concepts consideredrelevant to the respective passage, (b) whether they knew what the text might cover given the text title, (c) whether theyhad previously read a passage similar to what they just read, (d) whether they knew about the topic, and (e) how muchtheir prior knowledge helped them understand what they read. The interest questions asked readers (a) how interestedthey were in knowing about two relevant concepts for the respective passage, (b) how interested they were in a topic giventhe title of the text, (c) how much they enjoyed reading the text, (d) whether they would read the text again, (e) how muchthey would share with others what they read, and (f) how interesting they found the passage. These questions were posedat different time points in the passage reading process (e.g., prior to reading any passage, immediately after reading a pas-sage, and after reading the last cognitive item of the last text passage). These self-report reader-attribute questions wereconstructed following examples in the literature (e.g., Ainley, Hidi, & Berndorff, 2002; Bray & Barron, 2004; Graesser &Bertus, 1998; Schraw, 1997). All reader-attribute questions were reviewed by a group that included reading researchersand teachers, and all were tested in a pilot study.
Each reader-attribute question had four Likert-type options, from very positive to very negative. The information ontopic familiarity and interest was summarized to identify each student as being more familiar or less familiar with eachtopic and more interested or less interested in each topic, based on the following procedure: Responses to the questionswere summarized in three steps. First, the four response options, the most negative to most positive, were coded as .1,.3, .7, and .9, respectively. Second, for each text passage, an average was calculated across responses to all questions thatcontributed to the particular reader attribute. Third, the obtained average for each study participant was compared tothe mean value of the distribution based on the study sample. If a participant’s average score was higher than the distri-bution mean, the respective student was identified as familiar and was coded as 1, otherwise as 0.3 This coding schemewas also applied in determining whether a student was more interested or less interested in a topic. For the four passage-related reader attributes, the Cronbach’s alpha ranged from .59 to .65 for the topic familiarity measure and .78 to .85for the topic interest measure. These values indicate sufficient reliability to proceed with the illustration of the method-ology, although the estimated LLTM effects will be more attenuated for the familiarity measure than for the interestmeasure.
Procedure
A pilot study was conducted with 25 students to determine the amount of time the participants should be allowed toevaluate the materials and to see if any revisions were needed in the measures or data-gathering procedures. Some of thosepilot study participants (three boys and three girls) were interviewed to better understand their grasp of the directions andtheir thinking processes while performing the task. With four additional students who were not included in the pilot study,a passage-independence check was conducted to verify that the comprehension questions could not be easily answeredcorrectly without reading the relevant passage.
In the final administration with an additional 160 students, each study participant completed a booklet in a singlesession. The majority of the students participated in a group; nearly all participants completed the task within an hour.The four omitted item responses were treated as missing at random.
6 ETS Research Report No. RR-17-35. © 2017 Educational Testing Service

T. Rahman & R. J. Mislevy Integrating Cognitive Views Into Psychometric Models
Table 2 Examples of Coding of Items in Linear Logistic Test Models
Codes
An item belongs to … #1 #2 #3 #4 #5 #6 #7
An expository text, with topic A, targets textbase and causal consequence 1 1 0 0 1 0 0An expository text, with topic B, targets textbase and causal antecedent 1 0 0 0 0 1 0A narrative text, with topic A, targets situation model and spatial relation 0 0 1 1 0 0 1A narrative text, with topic B, targets situation model and temporal relation 0 0 0 1 0 0 0
Note. Code #1 represents text type, Code #2 represents expository topic, Code #3 represents narrative topic, Code #4 represents mentalrepresentation (textbase vs. situation model), Code #5 represents causal consequence relation, Code #6 represents causal antecedentrelation, and Code #7 represents spatial relation.
Data Analysis
Prior to the LLTM analyses, data were analyzed to check the quality of cognitive item scores that ranged from 0 to 32across passages and from 0 to 8 within passages (e.g., mean, median, standard deviation, skewness) and reader-attributequestions (e.g., Cronbach’s alpha). The study participants were then classified into four groups with respect to each passageseparately, following the final coding assigned to the reader attributes. For each passage, Group 1 included those readerswho were identified as having both familiarity with and interest in the topic. Group 2 included readers having familiaritybut less interest in the topic. Group 3 included readers having interest but less familiarity. Group 4 included readers havingboth less familiarity and less interest in the topic.4
The application of LLTM required coding for each item on attributes that represent the theoretical complexity factorsof the item. As depicted in Figure 1, each of the 32 cognitive items had seven binary codes to represent the item attributes:text type, text topic, and the nature of the items (i.e., if an item targeted the textbase or situation model and if the itemtargeted a particular one of the four relations). In each case, a positive feature was coded as 1, otherwise 0. See Table 2 forcoding of items in LLTM models that incorporated task-structure effects.
In addition, reader attributes were incorporated into the LLTM analysis using a device called technical items—virtualitems that represent the same actual item under different conditions (Fischer & Formann, 1982). In this study, each realitem could be represented as four technical items based on the four familiarity*interest groups of readers defined previ-ously. Note that for a given student, familiarity*interest group coding was the same for all eight items in a passage but coulddiffer from one passage to another. The LLTM effect parameters for familiarity and interest indicate change in difficultyinduced by these conditions, that is, effects on item difficulty associated with reader familiarity and interest. Therefore,there were 128 technical items to represent 32 cognitive items, as an item might be encountered by a reader with any of thefour familiarity*interest conditions. For a given actual item, a given examinee’s response to that item was coded as corrector incorrect for only the technical item that corresponded to the familiarity and interest categories of that examinee. Theexaminee’s responses to the other three technical items corresponding to this actual item were coded as “missing” andtreated as missing at random in the analysis (coded as NA in the BUGS data file).
Consider, for example, a particular item in a given text passage. A student would answer correctly or incorrectly, 1 or0. But the student’s categorization as to familiarity and interest could be 11, 10, 01, or 00. The four technical items for thisone actual item correspond to a response to this item if the student is in the 11 category, the 10 category, the 01 category, orthe 00 category. Thus, a student whose background responses put her in the 11 category and happened to answer correctlywould have a response string to the four technical items corresponding to this actual item of (1, NA, NA, NA). A studentin the 01 category who answered incorrectly would have a response string to the technical items of (NA, NA, 0, NA).
Calibration analyses were carried out using the Rasch model and the following three forms of the LLTM model:
1. LLTM Model I (i.e., task-only model): Item parameters were modeled as depending only on task attributes. There-fore, the items were represented by a 32× 7 matrix (items by item features) and the examinees were represented bya 160× 32 matrix (examinees by item responses).
2. LLTM Model II (i.e., reader-only model): Item parameters were modeled with only effects for the reader*topic famil-iarity and reader*topic interest, as well as a difficulty parameter for each item. Therefore, the item matrix includedthe number of technical items (128) by the number of reader*topic familiarity and reader*topic interest variables(two, for familiarity and interest main effects), concatenated with an identity matrix for the items. More simply
ETS Research Report No. RR-17-35. © 2017 Educational Testing Service 7

T. Rahman & R. J. Mislevy Integrating Cognitive Views Into Psychometric Models
stated, an item difficulty for a given technical item (a given combination of actual item and familiarity*interest cat-egory) was the sum of a common estimate of a difficulty associated with the actual item, plus an effect for interest,plus an effect for familiarity. This means there are four technical item difficulties corresponding to each actual item.This one that is combined with a student’s ability in the IRT model is the one that corresponds to that student’sinterest and familiarity with the passage that item addresses. Thus, the item matrix was 128× 34 and the examineematrix was 160× 128 (examinees by technical items).
3. LLTM Model III (i.e., task and reader combination model): Item parameters were modeled as depending on taskattributes and effects for reader*topic familiarity and reader*topic interest variables. The item matrix was 128× 9,and the examinee matrix, as with Model II, was 160× 128.
All analyses involving the Rasch and LLTM models were conducted using WinBUGS for Bayesian statistical analysisusing Markov chain Monte Carlo estimation (MCMC; Lunn, Thomas, Best, & Spiegelhalter, 2000). The coding for theBayesian estimates had four parts. Part I specified the prior distribution of the difficulty contribution of the features. Stan-dard normal priors were specified for difficulty parameters and for difficulty-effect parameters, as required in each model.These are quite mild in the context of estimating difficulty effects on the logit scale. Part II modeled the item difficulty as alinear combination of features without the item-specific error. Part III specified the measurement model with the responseprobability of getting the item correct as a function of examinee parameters and item difficulties as determined by the par-ticular model being used in that run. Part IV specified the examinee parameters as normally distributed, with mean set tozero to fix the scale and unknown precision (τ= inverse of variance) modeled with a Gamma prior distribution (Gelman,Carlin, Stern, & Rubin, 2004); see the appendix for BUGS code for the LLTM Model III.
The prior used for the parameters of the distribution of student comprehension proficiency θ was normal prior with afixed mean of zero and a standard deviation (=τ1/2) to be estimated from the data. For item parameters, a mild normalprior centered at zero was used for effects for task attributes and also examinee-by-task attributes as required in a givenmodel. All models were run with 25,000 MCMC cycles after 5,000 burn-in cycles. Convergence was checked by comparingresults of multiple independent chains. All WinBUGS estimates were additionally reported as z-scores (posterior meandivided by standard deviation). Further, the relation between the two sets of estimates obtained by the Rasch model andLLTM Model I (i.e., task-only model) was also examined for the proportion of variance in Rasch difficulty estimates thatcould be accounted for by the estimates of LLTM Model I. The proportion-of-variance-accounted-for and estimates of theeffects of each item and reader attributes were also tested for their statistical significance.
Results
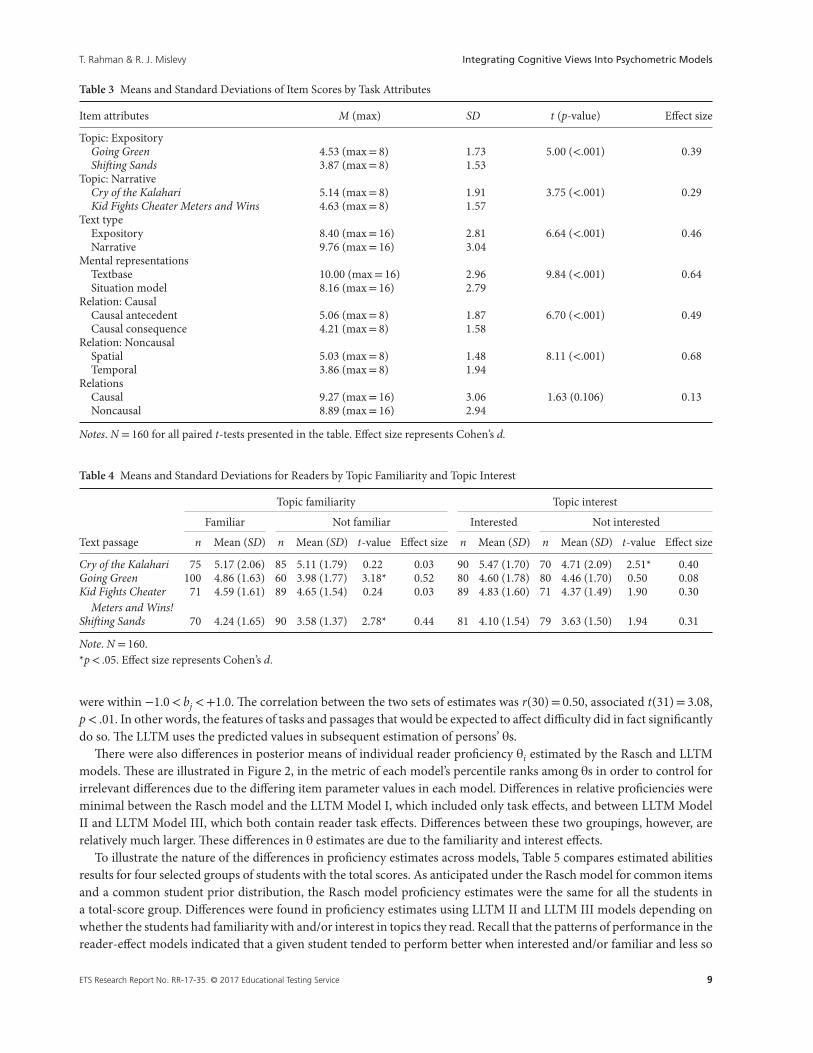
The analyses conducted prior to estimating item difficulty and student proficiency provided an initial look at patterns in thedata related to overall effects of the factors that would be included in the IRT models. With respect to the four text topics, aone-way repeated measure ANOVA suggested that the number of items correctly answered, on average, varied among thetext passages, F(3,477)= 28.40, p< .01. As shown in Table 3, additional analyses conducted using paired t-tests indicatedthat the number of items answered correctly, on average, was higher for the narrative texts than for the expository texts,and the difference between the two topics within each text type was statistically significant. For item-attribute relation,a one-way repeated measure ANOVA showed that the number of items answered correctly varied among the relations,F (3,477)= 34.09, p< .01. Analyses also indicated that the study participants, on average, correctly answered more itemsthat were identified as targeting the textbase (M = 10.00, SD= 2.96) than those items that were identified as targeting thesituation-model representations, (M = 8.16, SD= 2.79), t(159)= 9.84, p< .001.
As shown in Table 4, the analyses conducted with respect to the reader attribute of topic familiarity showed in thecase of both expository-type text topics that the study participants who were identified as familiar with a topic answered,on average, more items correctly than those who were identified as not familiar with the topic. With respect to topicinterest, in the case of one narrative-type text topic, analyses indicated that those who were identified as being interestedanswered, on average, more items correctly than those who were identified as not interested in the topic.5 These effectswere consistent with expectations from the reading research literature cited previously.
Comparisons of IRT item difficulty (βj) and student proficiency (θi) estimated under the Rasch model and the LLTMModel I showed the following patterns. The posterior means of item difficulty (βj) of the 32 cognitive items estimated by theRasch model were within −3.0< bj <+3.0, whereas the difficulties estimated by the LLTM model I (i.e., task-only model)
8 ETS Research Report No. RR-17-35. © 2017 Educational Testing Service
T. Rahman & R. J. Mislevy Integrating Cognitive Views Into Psychometric Models
Table 3 Means and Standard Deviations of Item Scores by Task Attributes
Item attributes M (max) SD t (p-value) Effect size
Topic: ExpositoryGoing Green 4.53 (max= 8) 1.73 5.00 (<.001) 0.39Shifting Sands 3.87 (max= 8) 1.53
Topic: NarrativeCry of the Kalahari 5.14 (max= 8) 1.91 3.75 (<.001) 0.29Kid Fights Cheater Meters and Wins 4.63 (max= 8) 1.57
Text typeExpository 8.40 (max= 16) 2.81 6.64 (<.001) 0.46Narrative 9.76 (max= 16) 3.04
Mental representationsTextbase 10.00 (max= 16) 2.96 9.84 (<.001) 0.64Situation model 8.16 (max= 16) 2.79
Relation: CausalCausal antecedent 5.06 (max= 8) 1.87 6.70 (<.001) 0.49Causal consequence 4.21 (max= 8) 1.58
Relation: NoncausalSpatial 5.03 (max= 8) 1.48 8.11 (<.001) 0.68Temporal 3.86 (max= 8) 1.94
RelationsCausal 9.27 (max= 16) 3.06 1.63 (0.106) 0.13Noncausal 8.89 (max= 16) 2.94
Notes. N = 160 for all paired t-tests presented in the table. Effect size represents Cohen’s d.
Table 4 Means and Standard Deviations for Readers by Topic Familiarity and Topic Interest
Topic familiarity Topic interest
Familiar Not familiar Interested Not interested
Text passage n Mean (SD) n Mean (SD) t-value Effect size n Mean (SD) n Mean (SD) t-value Effect size
Cry of the Kalahari 75 5.17 (2.06) 85 5.11 (1.79) 0.22 0.03 90 5.47 (1.70) 70 4.71 (2.09) 2.51* 0.40Going Green 100 4.86 (1.63) 60 3.98 (1.77) 3.18* 0.52 80 4.60 (1.78) 80 4.46 (1.70) 0.50 0.08Kid Fights Cheater
Meters and Wins!71 4.59 (1.61) 89 4.65 (1.54) 0.24 0.03 89 4.83 (1.60) 71 4.37 (1.49) 1.90 0.30
Shifting Sands 70 4.24 (1.65) 90 3.58 (1.37) 2.78* 0.44 81 4.10 (1.54) 79 3.63 (1.50) 1.94 0.31
Note. N = 160.*p< .05. Effect size represents Cohen’s d.
were within −1.0< bj <+1.0. The correlation between the two sets of estimates was r(30)= 0.50, associated t(31)= 3.08,p< .01. In other words, the features of tasks and passages that would be expected to affect difficulty did in fact significantlydo so. The LLTM uses the predicted values in subsequent estimation of persons’ θs.
There were also differences in posterior means of individual reader proficiency θi estimated by the Rasch and LLTMmodels. These are illustrated in Figure 2, in the metric of each model’s percentile ranks among θs in order to control forirrelevant differences due to the differing item parameter values in each model. Differences in relative proficiencies wereminimal between the Rasch model and the LLTM Model I, which included only task effects, and between LLTM ModelII and LLTM Model III, which both contain reader task effects. Differences between these two groupings, however, arerelatively much larger. These differences in θ estimates are due to the familiarity and interest effects.
To illustrate the nature of the differences in proficiency estimates across models, Table 5 compares estimated abilitiesresults for four selected groups of students with the total scores. As anticipated under the Rasch model for common itemsand a common student prior distribution, the Rasch model proficiency estimates were the same for all the students ina total-score group. Differences were found in proficiency estimates using LLTM II and LLTM III models depending onwhether the students had familiarity with and/or interest in topics they read. Recall that the patterns of performance in thereader-effect models indicated that a given student tended to perform better when interested and/or familiar and less so
ETS Research Report No. RR-17-35. © 2017 Educational Testing Service 9

T. Rahman & R. J. Mislevy Integrating Cognitive Views Into Psychometric Models
-15%
-10%
-5%
0%
5%
10%
15%
Dif
fere
nce
in
Per
cen
tile
Student Proficiency
Difference (Rasch-LLTM III)
Difference (Rasch-LLTM II)
Difference (Rasch-LLTM I)
Figure 2 Differences in proficiencies estimated by Rasch and linear logistic test models.
Table 5 Proficiencies (θi) Estimated by Three Psychometric Models
Student IDTotal items
correctCry of theKalahari Going Green
Kid Fights CheaterMeters and Wins
ShiftingSands Rasch θi LLTM II θi LLTM III θi
XXAA 10 00 00 00 00 −1.49 −1.35 −1.29XXBB 10 11 01 00 00 −1.49 −1.52 −1.54XXCC 10 11 11 11 10 −1.50 −1.57 −1.61XXDD 15 00 00 00 00 −0.60 −0.44 −0.35XXEE 15 01 10 00 11 −0.60 −0.62 −0.64XXFF 15 11 11 11 11 −0.60 −0.68 −0.72XXGG 19 00 00 00 00 0.11 0.30 0.40XXHH 19 10 00 00 11 0.11 0.21 0.26XXII 19 11 11 11 11 0.11 0.07 0.03XXJJ 24 00 00 00 00 1.09 1.28 1.37XXKK 24 11 10 10 11 1.09 1.13 1.15XXLL 24 11 11 11 11 1.09 1.06 1.01
Note. LLTM= linear logistic test model. To maintain confidentiality, actual student IDs are not shown here. 11= the student identifiedas having familiarity with and interested in the topic, 10= the student identified as having familiarity with but not interested in thetopic, 01= the student identified as not familiar with but interested in the topic, 00= the student identified as neither familiar with norinterested in the topic. Proficiency estimates (θi) in the above table represent standardized scores.
when not interested and/or familiar. Among a group of students with the same total score, then, the baseline proficienciesreflected in their θs of students were lower when the passages were ones they indicated interest and/or familiarity with,and higher when they did not. Implicit in this model, it will be noted, is that reading proficiency is not a single fixed valuefor all tasks and situations, but rather a distribution of effective proficiencies. Effective proficiency is seen here to dependon interest and familiarity, and, as the reading research suggests, almost certainly with other factors not addressed in thisstudy, such as purpose and context.
Table 6 shows posterior means, standard deviations, and z-scores of the effects ηk of the respective item attributesrepresented by seven variables modeled by LLTM I; reader attributes were represented by two variables modeled by LLTM
10 ETS Research Report No. RR-17-35. © 2017 Educational Testing Service
T. Rahman & R. J. Mislevy Integrating Cognitive Views Into Psychometric Models
Table 6 Effects (ηk) of Task and Reader Attributes Estimated by the Linear Logistic Test Model (LLTM) Model I, Model II, andModel III
LLTM Model I and Model II LLTM Model III
Attributes Posterior mean SD z-score Posterior mean SD z-score
eta[1]: Text type 0.536 0.078 6.89* 0.584 0.078 7.48*eta[2]: Expository topic −0.376 0.084 −4.47* −0.366 0.085 −4.32*eta[3]: Narrative topic 0.103 0.078 1.32 0.177 0.079 2.22*eta[4]: Mental representation 0.434 0.059 7.39* 0.469 0.058 8.05*eta[5]: Causal consequence compared to temporal −0.371 0.077 −4.83* −0.307 0.078 −3.94*eta[6]: Causal antecedent compared to temporal −0.863 0.078 −11.07* −0.801 0.079 −10.16*eta[7]: Spatial compared to temporal −0.845 0.078 −10.86* −0.782 0.079 −9.86*eta[8]: Familiarity with topic −0.204 0.082 −2.49* −0.270 0.071 −3.80*eta[9]: Interest in topic −0.122 0.079 −1.54 −0.147 0.072 −2.03*
Note. LLTM= linear logistic test model. Estimates shaded in the table are those obtained by the LLTM Model II. Posterior means andstandard deviations of Bayesian posterior distributions correspond roughly to point estimates and standard errors in randomization-based inference.*p< .05.
II, and all of these attributes were represented by the nine variables modeled by LLTM III. In LLTM Model I, a higherdifficulty was estimated for items of the expository-type texts compared to items of the narrative-type texts. Further,within expository-type texts, the items related to two topics had different difficulties. A higher difficulty was estimatedfor items that targeted the situation model mental representation compared to items that targeted the textbase mentalrepresentation. Additionally, different difficulties were estimated for items representing different relations among eventsof a situation. These task attributes accounted for about 25% of the variance in the item difficulties.
In LLTM Model II, a higher item difficulty was estimated for a reader who was not familiar with the topic described inthe text. However, the amount by which this model estimated a higher difficulty of items when a reader was not interestedin the topic was not statistically significant in this model. These two reader attribute-related variables accounted for about12% of the variance in the item difficulties when sets of item parameters that differed by interest-and-familiarity effectswere included, nearly half as much as the theoretically motivated effects in the task construction seen in LLTM Model I.
In LLTM Model III, effects of all attributes were statistically significant. The task and reader attributes altogetheraccounted for about 38% of the variance in the item difficulties (this percentage represents a ratio of between-conditionvariance and the between- plus within-condition variances in LLTM-modeled item difficulties). It should be noted thatfamiliarity and interest effects (ηk) were assumed in this model to be the same over all the examinees, items, and textpassages. This is the average amount by which items become easier or harder for an examinee depending on whether theexaminee is familiar with or interested in a text topic. As noted later, one way the model could be extended and fit in largersamples would be to look at more individuated effects.
The results presented here suggest that the task and reader attributes considered in the current study contribute to theitems’ difficulties and the examinees’ estimated comprehension proficiencies. More importantly, the results suggest thatit is possible to model in a psychometric tool the effects of attributes of the major components of reading comprehension.
Discussion and Conclusion
What we learned from this methodological study is as follows: This successful application of the LLTM indicates that itis viable to integrate theoretically and empirically grounded views of reading comprehension into psychometric models.Task attributes have previously been employed in analyses in reading comprehension tests. By extending the LLTM modelto incorporate reader-by-task attributes, this approach shows how we can build a network among the attributes of variouscomprehension components into the psychometric analysis. Such a network gives us a means to explain variance in thedifficulty of comprehension items as well as the comprehension proficiency of readers. Additional information (such asunexpectedly large differences in students’ performance on narrative compared to expository texts or scores on textbasecompared to situation model items) can benefit those who are interested in a fuller understanding of what students knowand can do given text passages to read. By further extending the model for student-level effects of interest and familiarity, itwill, for example, be possible to report on the effect of these reader-by-task variables for individual students. This study thus
ETS Research Report No. RR-17-35. © 2017 Educational Testing Service 11
T. Rahman & R. J. Mislevy Integrating Cognitive Views Into Psychometric Models
puts forward empirical evidence in support of the argument for being able to frame psychometric analyses aligned withconceptualizations of comprehension suggested in reading research when assessing students’ comprehension proficiency.(It is worth stating that the same modeling structure is by no means limited to reading comprehension and could beapplied in other domains as well.)
This single illustrative study cannot address all issues necessary to be resolved prior to integrating cognitive viewsinto psychometric models in an operational assessment of comprehension. The line of research suggested in this studycan be enhanced by psychometric research as well as reading research. We would want to study the number of tasksand reader-attribute questions related to each task that an assessment instrument should include without introducingexaminee fatigue effect. It is also necessary that we have reader attribute measures that were designed specifically forformal comprehension assessment and that the measures have sufficient reliability for the self-reported information. Inother words, apportioning a total amount of testing time among comprehension tasks and background questions posesa design tradeoff to be resolved, addressing the relative value of the two kinds of information for the inferences that aremost important. The balance might differ between formative and summative uses. This issue would need to be explored.Alternatively, studies could be carried out where students’ interest and familiarity were determined a priori and passageswere assigned to students in an experimental design with interest and familiarity as independent variables.
Further, we need to know the optimal sample size for applying psychometric models similar to LLTM when multipleattributes of readers are incorporated. We would want to explore forms of the psychometric models that can treat task andreader attributes as continuous variables. The assumption of common reader-by-task effects for interest and backgroundknowledge could be relaxed to compare, for example, the effects for different passage types or item types and for differentstudents (i.e., a random-effects model).
In addition, we need to know how other IRT models can be framed so cognitive models of comprehension could beintegrated to explain variances in other item characteristics. More research similar in nature to the current study wheretheory-motivated covariates are systematically incorporated in measures and analyses will allow reading researchers tomake generalizations about contributions of comprehension components in assessment situations. Additional researchwill enable test developers to more accurately interpret contributions of comprehension components when estimatingstudents’ ability to comprehend.
We emphasize that, in this study, no claim has been made about the “best way” to design a comprehension assess-ment that is aligned with the reading literature. Although choices as to cognitive theories and emphases must be made toreflect the intended use of an assessment, the same task design and modeling strategies can be applied with theories ofcomprehension other than the CI and MDL. What is required is indications of task and reader-by-task variables that areimportant under whatever theory is proposed for comprehension.
Comprehension assessments based on conceptualizations shared by reading researchers and test developers have impli-cations for what we measure and how we measure this critical ability. In particular, there is a beginning of a methodologyto address the issue that “reading comprehension ability” is not a single, well-defined, universally applicable construct,but the result of resources a reader deploys, with comprehension depending on personal factors such as the interest andfamiliarity effects addressed here and others that might be conceived of, such as context and purpose. The point is thatmachinery originally developed to measure a well-defined “latent ability” can be extended to address questions framed inmore advanced theories of cognition. This new way of measuring comprehension could more efficiently serve the purposeof an assessment: namely, to provide educators with feedback on student learning.
Notes
1 For a review of developments in comprehension tests, see W. Kintsch and Kintsch (2005) and Pearson and Hamm (2005).2 See Adams, Wilson, and Wang (1997) for a multivariate extension of the LLTM, and Rijmen and De Boeck (2002) and Sheehan
and Mislevy (1990) for an extension to random effects.3 Although the LLTM analysis could have proceeded using the measured values rather than the dichotomized groupings, the
discretized version was chosen in order to simplify the modeling for the demonstration. Note also that categorizing studentsbased on passage familiarity and interest mean scores led to similar but nonidentical counts of students being more or lessinterested in, and more or less familiar with, each passage.
4 For the reader group classification, both differential weighting based on a factor analysis and equal weighting were applied to thereader attribute questions. The analyses proceeded with the simpler equal weighting because the two weighting approachesyielded essentially the same classifications for all passages.
12 ETS Research Report No. RR-17-35. © 2017 Educational Testing Service
T. Rahman & R. J. Mislevy Integrating Cognitive Views Into Psychometric Models
5 Note that reader attribute groupings were made based on the students’ self-reported familiarity and interest rather than assignedby the researchers, so even though these results are suggestive, they should not be considered as causative. As indicated earlier,the purpose of these preliminary between-subjects analyses was not to make generalizations or provide explanations about theunderlying contributions of these attributes but rather to better understand patterns in the data to see if they were generally inaccord with reading literature and to help understand how to model and interpret the within-subjects LLTM effects.
References
Adams, R., Wilson, M. R., & Wang, W. C. (1997). The multidimensional random coefficients multinomial logit model. Applied Psycho-logical Measurement, 21, 1–23.
Ainley, M., Hidi, S., & Berndorff, D. (2002). Interest, learning, and the psychological processes that mediate their relationship. Journalof Educational Psychology, 94(3), 545–561.
Ainley, M., Hillman, K., & Hidi, S. (2002). Gender and interest processes in response to literacy texts: Situational and individual interest.Learning and Instruction, 12, 411–428.
Alexander, P. A. (1997). Mapping the multidimensional nature of domain learning: The interplay of cognitive, motivational, and strate-gic forces. In M. L. Maehr & P. R. Pintrich (Eds.), Advances in motivation and achievement (Vol. 10, pp. 213–250). Greenwich, CT:JAI Press.
Alexander, P. A. (2005). The path to competence: A lifespan developmental perspective on reading. Journal of Literacy Research, 37(4),413–436.
Alexander, P. A., & Fox, E. (2004). A historical perspective on reading research and practice. In R. B. Ruddell & N. J. Unrau (Eds.),Theoretical models and practices of reading (5th ed., pp. 33–68). Newark, DE: International Reading Association.
Alexander, P. A., & Jetton, T. L. (1996). The role of importance and interest in the processing of text. Educational Psychology Review,8(1), 89–121.
Alexander, P. A., & Jetton, T. L. (2000). Learning from text: A multidimensional and developmental perspective. In M. L. Kamil, P. B.Mosenthal, P. D. Pearson, & R. Barr (Eds.), Handbook of reading research (Vol. 3, pp. 285–310). Mahwah, NJ: Erlbaum.
Artelt, C., Schiefele, U., & Schneider, W. (2001). Predictor of reading literacy. European Journal of Psychology of Education, 16(3),363–383.
Best, R. M., Floyd, R. G., & McNamara, D. S. (2008). Differential competencies contribution to children’s comprehension of narrativeand expository texts. Reading Psychology, 29, 137–164.
Bray, G. B., & Barron, S. (2004). Assessing reading comprehension: The effects of text-based interest, gender, and ability. EducationalAssessment, 9(3, 4), 107–128.
Brown, H. A. (1916). The measurement of ability to read (Bulletin No. 1). Concord, NH: Department of Public Instruction, Bureau ofResearch.
De Boeck, P., & Wilson, M. R. (2004). Explanatory item response models. New York, NY: Springer.Duke, N. K. (2005). Comprehension of what for what: Comprehension as a nonunitary construct. In S. G. Paris & S. A. Stahl (Eds.),
Children’s reading comprehension and assessment (pp. 93–104). Mahwah, NJ: Erlbaum.Embretson, S. E (1983). Construct validity: Construct representation versus nomothetic span. Psychological Bulletin, 93, 179–197.Embretson, S. (1994). Applications of cognitive design systems to test development. In C. R. Reynolds (Ed.), Cognitive assessment: A
multidisciplinary perspective (pp. 107–135). New York, NY: Academic Press.Embretson, S. (1998). A cognitive design systems approach to generating valid tests: Application to abstract reasoning. Psychological
Methods, 3(3), 380–396.Fischer, G. H. (1973). The linear logistic test model as an instrument in educational research. Acta Psychologica, 37, 359–374.Fischer, G. H., & Formann, A. K. (1982). Some applications of logistic latent trait models with linear constraints on the parameters.
Applied Psychological Measurement, 6(4), 397–416.Gates, A. I. (1921). An experimental and statistical study of reading and reading tests. Journal of Educational Psychology, XII(6),
303–314, 378–391, 445–464.Gelman, A., Carlin, J. B., Stern, H. S., & Rubin, D. B. (2004). Bayesian data analysis (2nd ed.). New York, NY: Chapman & Hall/CRC.Graesser, A. C., & Bertus, E. L. (1998). The construction of causal inferences while reading expository texts on science and technology.
Scientific Studies of Reading, 2(3), 247–269.Haladyna, T. M. (1997). Writing test items to evaluate higher order thinking. Boston, MA: Allyn and Bacon.Hidi, S. (2000). An interest researcher’s perspective: The effects of extrinsic and intrinsic factors on motivation. In C. Sansone & J. M.
Harackiewicz (Eds.), Intrinsic and extrinsic motivation (pp. 309–339). New York, NY: Academic Press.Johnston, P. H. (1984). Prior knowledge and reading comprehension test bias. Reading Research Quarterly, 19(2), 219–239.Johnston, P. H., & Pearson, D. P. (1982). Prior knowledge, connectivity, and the assessment of reading comprehension (Technical Report
No. 245). Urbana: Center for the Study of Reading, University of Illinois at Urbana-Champaign.
ETS Research Report No. RR-17-35. © 2017 Educational Testing Service 13

T. Rahman & R. J. Mislevy Integrating Cognitive Views Into Psychometric Models
Keenan, J. M., Betjemann, R. S., & Olson, R. K. (2008). Reading comprehension tests vary in the skills they access: Differential depen-dence on decoding and oral comprehension. Scientific Studies of Reading, 12(3), 281–300.
Kelly, F. J. (1916). The Kansas silent reading tests. The Journal of Educational Psychology, VII(2), 63–80.Kintsch, E. (2005). Comprehension theory as a guide for the design of thoughtful questions. Topics in Language Disorders, 25(1), 51–64.Kintsch, W. (1998). Comprehension: A paradigm for cognition. Cambridge, England: Cambridge University Press.Kintsch, W. (2004). The Construction-Integration model of text comprehension and its implications for instruction. In R. B. Ruddell
and N. J. Unrau (Eds.), Theoretical models and processes of reading (5th ed., pp.1270–1328). Newark, DE: International ReadingAssociation.
Kintsch, W., & Kintsch, E. (2005). Comprehension. In S. G. Paris & S. A. Stahl (Eds.), Children’s reading comprehension and assessment(pp. 71–92). Mahwah, NJ: Erlbaum.
Kirsch, I. S., & Mosenthal, P. B. (1988). Understanding document literacy: Variables underlying the performance of young adults (ResearchReport No. RR-88-62). Princeton, NJ: Educational Testing Service. https://doi.org/10.1002/j.2330-8516.1988.tb00318.x
Lord, F. M. (1983). Small N justifies Rasch model. In D. J. Weiss (Ed.), New horizons in testing: Latent Trait Test Theory and ComputerizedAdaptive Testing (pp. 51–61). New York, NY: Academic Press.
Lunn, D. J., Thomas, A., Best, N., & Spiegelhalter, D. (2000). WinBUGS–A Bayesian modeling framework: Concepts, structure, andextensibility. Statistics and Computing, 10, 325–337.
Magliano, J. P., Millis, K., Ozuru, Y., & McNamara, D. S. (2007). A multidimensional framework to evaluate reading assessment tools.In D. S. McNamara (Ed.), Reading comprehension strategies (pp. 107–136). New York, NY: Erlbaum.
Millis, K. K., & Cohen, R. (1994). Spatial representations and updating situation models. Reading Research Quarterly, 29(4), 369–380.Mislevy, R. J. (2006). Cognitive psychology and educational assessment. In R. L. Brennan (Ed.), Educational measurement (4th ed., pp.
257–306). Westport, CT: American Council on Education/Praeger.Mislevy, R. J., & Rahman, T. (2009). Design pattern for assessing cause and effect reasoning in reading comprehension (PADI Technical
Report No. 20). Menlo Park, CA: SRI International.O’Reilly, T. & Sabatini, J. (2013). Reading for understanding: How performance moderators and scenarios impact assessment design
(Research Report No. RR-13-31). Princeton, NJ: Educational Testing Service. https://doi.org/10.1002/j.2333-8504.2013.tb02338.xOzuru, Y., Dempsey, K., & McNamara, D. S. (2009). Prior knowledge, reading skill, and text cohesion in the comprehension of science
texts. Learning and Instruction, 19, 228–242.Pearson, P. D., & Hamm, D. N. (2005). The assessment of reading comprehension: A review of practices—Past, present, and future. In
S. G. Paris & S. A. Stahl (Eds.), Children’s reading comprehension and assessment (pp. 13–70). Mahwah, NJ: Erlbaum.Pearson, P. D., & Johnson, D. D. (1978). Teaching reading comprehension. New York, NY: Holt, Rinehart and Winston.RAND Reading Study Group. (2002). Reading for understanding: Toward an R&D program in reading comprehension. Santa Monica,
CA: Author.Rasch, G. (1960). Probabilistic model for some intelligence and achievement tests. Copenhagen, Denmark: Danish Institute for Educa-
tional Research.Rijmen, F., & De Boeck, P. (2002). The random weights linear logistic test model. Applied Psychological Measurement, 26(3), 271–285.Sabatini, J., Albro, E., & O’Reilly, T. (2012). Measuring up: Advances in how we assess reading ability. Lanham, MD: Rowman & Littlefield
Education.Sarroub, L. K., & Pearson, P. D. (1998). Two steps forward, three steps back: The stormy history of reading comprehension assessment.
Clearing House, 72, 97–105.Scheiblechner, H. (1972). Das lernen und lösen komplexer denkaufgaben (The learning and solution of complex cognitive tasks)
Zeitschrift für experimentalle und Angewandte Psychologie, 19, 476–506.Schraw, G. (1997). Situational interest in literary text. Contemporary Educational Psychology, 22, 436–456.Sheehan, K., & Mislevy, R. J. (1990). Integrating cognitive and psychometric models to document literacy. Journal of Educational Mea-
surement, 27(3), 255–272.Starch, D. (1915). The measurement of efficiency in reading. The Journal of Educational Psychology, VI(1), 1–24.Taylor, S. E., Frackenpohl, H., White, C. E., Nieroroda, B. W., & Browning, C. L. (1989). EDL core vocabularies in reading, mathematics,
science, and social studies. Orlando, FL: Steck-Vaughn Company.Valencia, S. W., & Pearson, P. D. (1987, April). Reading assessment: Time for a change. The Reading Teacher, 726–733.van den Broek, P., Young, M., & Tzeng, Y. (1999). The landscape model of reading: Inferences and the online construction of a memory
representation. In H. van Oostendorp & S. R. Goldman (Eds.), The construction of mental representation during reading (pp. 71–98).Mahwah, NJ: Erlbaum.
Yen, W. M., & Fitzpatrick, A. R. (2006). Item response theory. In R. L. Brennan (Ed.), Educational measurement (4th ed., pp. 111–153).Westport, CT: Praeger.
Zwaan, R. A., & Oostendorp, H. V. (1993). Do readers construct spatial representations in naturalistic story comprehension? DiscourseProcesses, 16, 125–143.
14 ETS Research Report No. RR-17-35. © 2017 Educational Testing Service

T. Rahman & R. J. Mislevy Integrating Cognitive Views Into Psychometric Models
Zwaan, R. A., & Radvansky, G. A. (1998). Situation models in language comprehension and memory. Psychological Bulletin, 123(2),162–185.
Appendix
WinBUGS Code for the Linear Logistic Test Model (LLTM) Model III
model LLTM; # With item and examinee attribute LLTM III
{
for (m in 1:F) {
eta[m] ~ dnorm(0,1); # Feature parameters
}
for (k in 1:I) {
b[k] <- inprod(q[k,],eta[]); #Item difficulty as linear
# combination of features
}
for (j in 1:N) {
for (k in 1:I) {
pi[j,k] <- (exp(theta[j] – b[k])/(1 + exp(theta[j] – b[k]))); #Measurement Model
r[j,k] ~ dbern(pi[j,k]);
}
theta[j] ~ dnorm(0,tautheta); # Person parameters
}
tautheta ~ dgamma(1,1);
vartheta <- 1/tautheta;
}
#init
#data
list(N=160, I=128, F=9,
q=structure(.Data=c(
1,0,0,0,0,0,1,1,0,
….
0,0,0,1,0,0,0,0,0
), .Dim=c(128,9)),
r = structure(.Data = c( NA,NA,NA,1,NA,NA,NA,1,NA,NA,NA,0,NA,NA,NA,0,NA,NA,NA,1,NA,NA,NA,1,NA,NA,NA,1,NA,
NA,NA,0,NA,NA,1,NA,NA,NA,1,NA,NA,NA,1,NA,NA,NA,0,NA,NA,NA,1,NA,NA,NA,1,NA,NA,NA,
0,NA,NA,NA,0,NA,1,NA,NA,NA,1,NA,NA,NA,0,NA,NA,NA,0,NA,NA,NA,1,NA,NA,NA,1,NA,NA,N
A,1,NA,NA,NA,1,NA,NA,NA,NA,NA,0,NA,NA,NA,0,NA,NA,NA,1,NA,NA,NA,1,NA,NA,NA,1,NA,N
A,NA,1,NA,NA,NA,1,NA,NA,NA,1,NA,
….
NA,NA,NA,1,NA,NA,NA,1,NA,NA,NA,0,NA,NA,NA,0,NA,NA,NA,0,NA,NA,NA,0,NA,NA,NA,0,NA,
NA,NA,0,NA,NA,NA,1,NA,NA,NA,1,NA,NA,NA,1,NA,NA,NA,1,NA,NA,NA,1,NA,NA,NA,1,NA,NA,
NA,0,NA,NA,NA,1,NA,NA,NA,1,NA,NA,NA,0,NA,NA,NA,0,NA,NA,NA,1,NA,NA,NA,0,NA,NA,NA,
1,NA,NA,NA,1,NA,NA,NA,1,NA,NA,NA,0,NA,NA,NA,1,NA,NA,NA,1,NA,NA,NA,1,NA,NA,NA,1,N
A,NA,NA,1,NA,NA,NA,1,NA,NA,NA,0
), .Dim=c(160,128)))
Note. NA indicates a missing value.
ETS Research Report No. RR-17-35. © 2017 Educational Testing Service 15

T. Rahman & R. J. Mislevy Integrating Cognitive Views Into Psychometric Models
Rahman, T., & Mislevy, R. J. (2017). Integrating cognitive views into psychometric models for reading comprehension assessment(Research Report No. RR-17-35). Princeton, NJ: Educational Testing Service. https://doi.org/10.1002/ets2.12163
Action Editor: Shelby Haberman
Reviewers: John Donoghue and Jesse Sparks
ETS, the ETS logo, and MEASURING THE POWER OF LEARNING. are registered trademarks of Educational Testing Service (ETS).All other trademarks are property of their respective owners.
Find other ETS-published reports by searching the ETS ReSEARCHER database at http://search.ets.org/researcher/
16 ETS Research Report No. RR-17-35. © 2017 Educational Testing Service

![Integrating Perceptual and Cognitive Modeling for Adaptive and ...fli/papers/Integrating perceptual and cognitive... · [78]: direct manipulation and intelligent agents (also known](https://static.fdocuments.us/doc/165x107/5f07a9377e708231d41e19c6/integrating-perceptual-and-cognitive-modeling-for-adaptive-and-flipapersintegrating.jpg)