Integrating Africa through an FTA between … · Integrating Africa through an FTA between...
49
1 Integrating Africa through an FTA between SACU/SADC- minus and COMESA – Speeding up the Regional Integration Process Think piece by Helena McLeod - DFID SA Regional Integration Advisor 12 Executive Summary Africa’s share of world trade has fallen from 6% in 1990 to 2% in 2002. Africa also hardly trades with itself; 5% compared to 46% in NAFTA, 55% in East Asia and 62% in the EU15. Regional integration in Africa is essential both due to its small markets and high transport costs; transport costs in Southern Africa are on average 73% higher than in the USA or Europe. Also to ensure Africa is not left a distant fourth as Asia, the Americas and Europe step up their regional integration efforts and coalesce into three global power blocks. How can Africa speed up its regional integration efforts? SADC and COMESA are both committed to become customs unions but a SADC customs union with all 14 current members will be difficult; because SACU has a common external tariff and trade agreements signed with other regions; and half the SADC members are negotiating Economic Partnership Agreements with the COMESA group of countries leaving a SADC-minus EPA group. This paper explores the possibility of SACU becoming the focus of customs union efforts in SADC comprising the SADC-minus group of countries and COMESA forming a second customs union. As South Africa and SACU are increasing the number of free trade agreements (FTAs) they negotiate we look at the benefits of an FTA with COMESA compared to FTAs with China and India, emerging trading partners. By analysing trade flows the paper looks at the current trade relations between South Africa (as a proxy for SACU) and COMESA. In summary; In terms of South Africa’s exports COMESA was a more important partner by far than India or China. In 2003 exports to COMESA were three times more than exports to China and six times more than exports to India. In 2005 exports to COMESA comprised 8.1% of total South Africa exports. In terms of imports from COMESA they were greater than imports from India but less than imports from China. South Africa has a large net trade surplus with COMESA. Both exports and imports from India and China are growing significantly faster than between South Africa and COMESA. Some of the countries in COMESA are also members of the SADC Trade Protocol. If we exclude these SADC countries then the value of trade with COMESA is much smaller. Imports from all COMESA 1 I would particularly like to thank Owen Willcox from TIPS for peer input and data provision, the methodological framework has been taken from a series of papers by Owen Willcox and Dirk Van Seventer, TIPS. I would also like to thank Themba Munalula from COMESA for data provision. 2 The views expressed in this piece do not reflect those of DFID. The author writes in her personal and not official capacity with the purpose of contributing to regional discussion.
Transcript of Integrating Africa through an FTA between … · Integrating Africa through an FTA between...

1
Integrating Africa through an FTA between SACU/SADC-minus and COMESA – Speeding up the Regional Integration Process Think piece by Helena McLeod - DFID SA Regional Integration Advisor12 Executive Summary Africa’s share of world trade has fallen from 6% in 1990 to 2% in 2002. Africa also hardly trades with itself; 5% compared to 46% in NAFTA, 55% in East Asia and 62% in the EU15. Regional integration in Africa is essential both due to its small markets and high transport costs; transport costs in Southern Africa are on average 73% higher than in the USA or Europe. Also to ensure Africa is not left a distant fourth as Asia, the Americas and Europe step up their regional integration efforts and coalesce into three global power blocks. How can Africa speed up its regional integration efforts? SADC and COMESA are both committed to become customs unions but a SADC customs union with all 14 current members will be difficult; because SACU has a common external tariff and trade agreements signed with other regions; and half the SADC members are negotiating Economic Partnership Agreements with the COMESA group of countries leaving a SADC-minus EPA group. This paper explores the possibility of SACU becoming the focus of customs union efforts in SADC comprising the SADC-minus group of countries and COMESA forming a second customs union. As South Africa and SACU are increasing the number of free trade agreements (FTAs) they negotiate we look at the benefits of an FTA with COMESA compared to FTAs with China and India, emerging trading partners. By analysing trade flows the paper looks at the current trade relations between South Africa (as a proxy for SACU) and COMESA. In summary;
In terms of South Africa’s exports COMESA was a more important partner by far than India or China. In 2003 exports to COMESA were three times more than exports to China and six times more than exports to India. In 2005 exports to COMESA comprised 8.1% of total South Africa exports.
In terms of imports from COMESA they were greater than imports from India but less than imports from China. South Africa has a large net trade surplus with COMESA.
Both exports and imports from India and China are growing significantly faster than between South Africa and COMESA.
Some of the countries in COMESA are also members of the SADC Trade Protocol. If we exclude these SADC countries then the value of trade with COMESA is much smaller. Imports from all COMESA
1 I would particularly like to thank Owen Willcox from TIPS for peer input and data provision, the methodological framework has been taken from a series of papers by Owen Willcox and Dirk Van Seventer, TIPS. I would also like to thank Themba Munalula from COMESA for data provision. 2 The views expressed in this piece do not reflect those of DFID. The author writes in her personal and not official capacity with the purpose of contributing to regional discussion.

2
(2005) are Rand 7444 million but for only non-SADC COMESA were Rands 456.5 million. Exports to all COMESA (2005) were R 25,835.7 m but only R 4,735.6 m to non-SADC COMESA. This reflects the competitive advantage of trading with countries who are geographically closer. It could also reflect some trade diversion taking place as the proportion of South Africa’s trade with non-SADC COMESA over the past 10 years has slumped.
Trade between South Africa and COMESA is characterised by low levels of intra-industry trade suggesting a free trade agreement would result in some structural adjustment although less than between South Africa and India or China.
COMESA exports reveal a strong comparative advantage in primary commodities such as coffee, tobacco, and mineral oils. South Africa exports reveal a comparative advantage in categories of precious stones, precious base metals, fruit and vegetables.
In terms of South Africa’s external trade policy as SACU reduces its trade barriers to countries outside of Africa this disadvantages African countries relative to other regions and is inconsistent with the Nepad agenda of prioritising African growth. A practical way forward in terms of speeding up regional integration and prioritising African trade partners would be for the SADC customs union to adopt a slightly modified SACU common external tariff with the SACU/SADC-minus group of countries forming the rump of the customs union. Then a free trade agreement could be negotiated between SACU/SADC-minus and COMESA. This would allow the emergence of two customs union; SACU/SADC-minus and COMESA. Efforts to reduce non-tariff barriers would also need to be strengthened along side complementary policies such as functioning regional competition policy. A natural result of this process would be for the trade capacity in SACU and SADC to merge. This would leave strengthened capacity in SADC to continue its lead on key regional integration initiatives in energy, water and peace and security. In terms of benefits of a free trade agreement between SACU/SADC-minus and COMESA, market access gains for SACU into COMESA would be in the region of US$874,984,000 per year at current trade volumes. However given SADC currently has a free trade agreement, gains from a trade relationship with additional countries currently members of COMESA but not members of SADC would be much lower and in the region of up to US$68,458,476. Market access gains for COMESA into SACU would be around US$121,076,000. This is only one possible way forward in terms of speeding up regional integration in Africa. Whichever process member states decide is best, if Africa is not to be marginalised further fast and real regional integration must be undertaken.

3
SECTION 1: Introduction Southern Africa and Africa has committed itself to economic integration as part of a growth and prosperity strategy for the Continent. The Southern Africa Development Community (SADC) and the Common Market of East and Southern Africa (COMESA) members have committed to implementing customs unions. The Southern African Customs Union (SACU) is already a customs union. SACU, SADC and COMESA all overlap in membership and mandate. This paper looks at the complicated overlapping trade arrangements in Southern Africa and explores how to simplify these arrangements, unlock scarce capacity and speed up regional integration in Africa. The paper responds to questions including; is regional integration beneficial for Africa, will Africa be further marginalised from the world economy without it; are overlapping membership of regional economic communities (RECs) hampering or helping integration; what is the practical reality of a customs union in SADC; and in looking for the quickest way to integrate markets in Africa would a union between the largest REC in Africa (COMESA) and the oldest customs union in the world (SACU) be a viable option? The paper also emphasises that regional integration is multi-faceted and highlights the important role SADC has to play in this respect. In the context of South Africa’s external trade policy and commitment to Africa the paper also explores economic and political reasons why such a union might be worth pursuing. SECTION 2: Africa’s Vision for an Integrated Continent The Africa Union vision is for an integrated Africa. Immediate desired outcomes of Nepad include3 “Regional integration is further accelerated and higher levels of sustainable economic growth in Africa is achieved”. Yet what currently prevails is a complex web of overlapping membership of Regional Economic Communities, the so-called building blocks of Nepad. Other regions of the world clearly believe economic advancement will be achieved through market integration. The European Union is considerably advanced in terms of the integration of goods markets, labour markets and monetary integration. Whilst nation states in Europe retain a high level of national autonomy significant powers have been divested to the European Parliament. Trade policy amongst other areas is a European Commission lead. And the European Court of Justice is the highest legal entity in the EU. The North American Free Trade Agreement (NAFTA) has combined the economic strengths of the USA, Canada and Mexico into a free trade area with the removal of substantially all tariff restrictions and ongoing removal of non-tariff barriers. And in Asia the ASEAN group have agreed that by 2015 they will have formed a trading bloc with China, India and Japan to form a mammoth economy which will comprise 25% of the world GDP and on the current
3 Nepad official website, front page, April 11th 2006-04-11

4
growth paths of China will be set to overtake the GDP of both the EU and the USA. By 2025 there are likely to be three economic power blocks in the world; Asia, the Americas and Europe. At the current pace of economic development and regional integration Africa will be left a distant fourth. Section 2.1: What are the costs and benefits from regional integration? The first question to ask is why would we want to integrate Africa’s markets anyway? The answer lies in orthodox trade theory which encourages countries to reduce their trade barriers so they can specialise and export goods that use the factor they are endowed with most abundantly, whether that be land, labour or capital. Production is more efficient and the freed up resources can be used to import other goods more cheaply than before trade liberalisation. Longer term benefits can also be realised such as lower prices through increased competition, technology transfer and lower production costs as scale economies are pursued. Regional integration has these economic benefits and also non-economic benefits including locking in policy reform, increasing the bargaining power of small countries and improved peace and stability. Whether these benefits are attained also relates to the level of integration. In economic theory the higher the level of integration the greater the gains will be. A free trade area (FTA) where countries reduce their tariff barriers but maintain their own trade policy is the lowest level of integration. The SADC Trade Protocol when it is fully implemented will form a free trade area. Customs unions (CUs) are the next level of integration; countries must agree a common external tariff. To be an improvement on an FTA CUs should also allow the free movement of goods within the CU. Some groups such as the East Africa Community (EAC) or the Southern Africa Customs Union (SACU) have common external tariffs but do not allow the full free movement of goods and so limit the benefits of a customs union. If countries continue to integrate their markets by agreeing a common market where factors of production including workers can move freely amongst the members then a fairly deep level of economic union has been attained. The European Union (EU) is an example of a Common Market and is also a political union ceding some of its members’ national powers to the European level. Some members of the EU have also agreed a common currency, the Euro. Although both SADC and COMESA members have agreed in principle to aim for economic and monetary union given the current pace of integration this seems a long way off and a very political journey. Regional integration is not a substitute for multilateral trade liberalisation or unilateral trade liberalisation. A successful completion to the current Doha Trade Round in the WTO negotiations will bring the greatest benefits to most developing and African countries as it would include liberalisation of important agricultural and industrial markets. Trade diversion is a potential negative consequence of regional integration. This is where members of a free trade bloc switch trading from a low cost

5
producer outside the bloc to a higher cost producer inside the bloc. There can be an overall loss in welfare in the importing country as the saving in price does not compensate the loss in tariff. Lowering external tariffs multilaterally or unilaterally can help avoid this problem. Although as MFN4 tariffs get closer to zero the benefits of an FTA fall as there are compliance costs such a rules of origin. Complementary policies are also necessary to ensure all members benefit from regional integration. Policies include improving the domestic enabling environment, diversifying the revenue base to make up for lost tariff revenue, considering the free movement of labour, reducing transport costs, ensuring an effective competition policy and adopting a revenue sharing formula that helps redistribute the benefits of being in a customs union which may not be distributed evenly. Section 2.2: Africa’s Current Economic Marginalisation Africa’s share in international trade has fallen from 6% in 1990 to 2% in 2002. Sub-Saharan Africa is currently the poorest region in the world and off track to meet all of the Millennium Development Goals. Economies in Africa are small and population density is low. Even South Africa which comprises 40% of the GDP of SSA is relatively small in European terms. According to the IMF South Africa is the 28th largest economy in the world in terms of GDP (2005) and between Denmark and Greece in size. Transport costs in Southern Africa are on average 73% higher than in the USA or Europe. And 30% of the population of Africa is living in landlocked countries compared to the world average of 1%. Africa hardly trades with itself 5% compared to 46% in NAFTA, 55% in East Asia and 62% in the EU15. One reason for the lack of intra-African trade is the internal barriers to trade both tariff and non-tariff. This is particularly important for land-locked countries where vital ports and markets in countries in the region are an economic umbilical cord for both imports and exports. If Africa wants to flourish integrating its small markets, removing barriers to its internal trade and reducing transport costs is essential. That is why Nepad’s vision prioritises regional integration. The irony is that whilst Africa is most in need of economic integration due to the small size of its markets, the number of countries that therefore need to participate in negotiations are high making negotiations slow and laborious. Section 2.3: Overlapping Membership of Regional Economic Groupings If regional integration and moreover an integrated Africa is what we want to see then how is the fastest way we can achieve this? SADC and COMESA members have agreed to become customs unions within the next six years, COMESA by 2008 and SADC by 2010. Customs
4 MFN is the Most Favoured Nation status and is the tariff structure faced by countries in the WTO from which additional preferences are conferred.

6
unions have a common external tariff and therefore for legal reasons two customs unions cannot overlap unless they have the same common external tariff. A full customs union (with free movement of goods) and a free trade area cannot overlap unless all members of the customs union are members of the free trade area as well. Currently membership of SACU is South Africa, Botswana, Lesotho, Namibia and Swaziland. SADC membership includes these countries and in addition includes Mozambique, Tanzania, Angola, Madagascar, Mauritius, Zimbabwe, Zambia, DRC and Malawi. Membership of COMESA includes eight countries that are members of SADC. These are Malawi, Zambia, Zimbabwe, Swaziland, Angola5, DRC, Mauritius and Madagascar. In addition Kenya, Uganda, Ethiopia, Djibouti, Eritrea, Sudan, Egypt, Libya, Seychelles, Comoros, Burundi and Rwanda are also members. If this wasn’t complicated enough Uganda, Tanzania and Kenya have formed a customs union called the East Africa Community, but whilst Uganda and Tanzania are members of COMESA, Tanzania is a member of SADC. The membership of Regional Economic Communities (RECs) in Southern and Eastern Africa like SACU, SADC and COMESA overlap so extensively that these overlaps have come to be known as a “Spaghetti bowl” as Figure 1 illustrates.
5 Angola is in the process of withdrawing from COMESA

7
So why is overlapping membership a problem? Firstly the membership of RECs needs to be distinguished from the membership of REC’s trade mandates. SADC covers a wide range of regional agreements including those on energy, water, HIV/AIDS, gender, the environment and peace and security. These are not duplicated by either SACU nor COMESA that have a much narrower focus on trade and regional economic integration mandates. Joint membership of RECs in this way is not a problem. Where it becomes a problem is when RECs have overlapping membership and overlapping mandates. This is a problem because;
It wastes scarce human and financial resources. Membership of a REC
is not free. Annual membership fees must be paid but more importantly it takes time and effort to implement the policies and legal requirements of a REC. Dual membership can require double the number of meetings, double the number of policies and procedures that need implementing and can lead to duplication of policies and plans.
As the time and energy of member states’ officials and politicians are
stretched by dual membership the effort and ability to implement the REC agreements are slowed down. Thus multiple memberships hampers the speed of integration.
A further problem arises with overlapping membership of RECs who are committed to become customs unions or are already operating customs
Figure 1 Overlapping Groupings in Southern Africa 2006 CBI Cross Border Initiative COMESA Common Market for East and Southern Africa EAC East African Community IOC Indian Ocean Commission SADC Southern African Development Community SACU Southern African Customs Union Reference: Authors own compilation
Djibouti Egypt Eritrea Ethiopia Sudan Libya
Comoros Seychelles
Burundi Rwanda
COMESA
Mauritius Madagascar
Swaziland
Tanzania Kenya
Uganda
Botswana Lesotho Namibia
Mozambique
Angola Congo DR
Malawi Zambia Zimbabwe
SADC
SACU
EAC
IOC
CBI
South Africa

8
unions. This is illustrated by figure 2 where we assume COMESA is a full customs union and SADC is a free trade area. When countries implement a customs union or a free trade area they remove trade barriers to members within the group. Goods can therefore flow within the customs union members at zero duty. Although this is currently not the case in SACU or planned in COMESA it is the ideal. Because SADC and COMESA membership overlap, goods (represented by the arrows) will be able to be exported from South Africa to Zambia at zero duty as they are members of the SADC FTA but because Zambia is also a member of the COMESA customs union the goods will then be able to flow onwards to all other countries in COMESA. So although South Africa will not have removed tariff barriers with non-SADC COMESA members, goods will be able to flow to them illegally by entering through a SADC COMESA member. This problem can be overcome by all COMESA members becoming members of the SADC Trade Protocol. If SADC becomes a customs union then the members belonging to both SADC and COMESA will have to decide which REC’s customs union they wish to belong to. This is because they will have to choose which common external tariff to enforce.
It is for all these reasons that the Africa Union is leading a process of harmonisation and rationalisation of RECs in Africa and why policy approaches such as an FTA between SACU and COMESA should be explored. Section 2.4: Economic Partnership Agreements: Influencing the Debate. The SADC minus EPA negotiating group until February 2007 consisted of Botswana, Lesotho, Namibia and Swaziland (BLNS) and Mozambique,
Figure 2 Overlapping Customs Unions
Mozambique Tanzania Botswana Namibia Lesotho South Africa
Malawi Zimbabwe Zambia Swaziland Mauritius Madagascar Angola DRC
SADC common external tariff
COMESAcommon external tariff
Djibouti Eritrea Sudan Egypt Ethiopia Libya Burundi Rwanda Comoros Seychelles Kenya Uganda

9
Angola and Tanzania. Trevor Manuel, Minister of Finance to South Africa, expressed his concern that Economic Partnership Agreements6 (EPAs) being negotiated with the EU would undermine regional integration in Southern Africa at the Economic Society of South Africa conference in 2005. The concern was that because the Africa, Caribbean and Pacific (ACP) grouping, and therefore the SADC minus group of EPA countries, excluded South Africa an agreement would be signed that would be different to the trade agreement that already exists between SACU and the EU called the Trade Development and Cooperation Agreement (TDCA). This would inevitably break up the customs union, unless an identical Common External Tariff was agreed, as members of the same customs union cannot have different external tariff regimes. A simple solution was to include South Africa in the SADC EPA process. Olympio and Robinson (2006) find that giving South Africa duty free access above their current TDCA preferences into the EU is unlikely to lead to a supply response great enough to threaten either EU producers or other SADC country exports except in a handful of products. They find that the inclusion of South Africa in the EPA is essential to strengthen regional integration as the EPA promises to do. Breaking up the SACU would be contrary to this. The SADC Strategic EPA position identifies the ideal SADC EPA arrangement as two fold. First South Africa would be included and the SACU countries would negotiate an enhanced TDCA. Second Mozambique, Angola and Tanzania would sign the SADC EPA based on contractually binding duty free and quota free access, as they already receive on a gifted basis by the EU. This implies that there can be no SADC common external tariff unless the EPAs are re-negotiated at a later date to agree a CET which is identical for Mozambique, Angola and Tanzania and the SACU countries. In February 2007 the EU formally agreed to include South Africa in the SADC EPA. Another concern voiced by some is that the EPAs have the potential to fragment SADC. This is because five of the countries belonging to both SADC and COMESA are negotiating with the COMESA grouping. These countries are Malawi, Zambia, Madagascar, Mauritius and Zimbabwe. This is the choice of the countries. Inevitably if they are members of two RECs they would have to choose to sign an EPA with either SADC or COMESA unless SADC and COMESA negotiate an EPA together which is currently not the case. Although it is possible that at the last minute they could choose to sign an EPA with the SADC grouping it seems more likely they shall remain with the COMESA grouping. COMESA is currently progressing fairly quickly towards a customs union; a common tariff nomenclature has been signed. If dual members sign an EPA with COMESA it is likely that they will adopt the COMESA customs union and they will legally have to leave any SADC customs union arrangement.
6 EPAs are free trade agreements currently being negotiated between the European Union and the Africa, Caribbean and Pacific group of countries under the Cotonou Agreement. Negotiations for reduction of trade barriers must be completed by the end of 2007.
10
However, these countries could choose to remain with the SADC Trade Protocol and free trade arrangement (aswell as all the other regional integration arrangements such as water, energy, peace and security etc) if internal barriers were maintained within the COMESA customs union. However this would mean losing many of the benefits of a full customs union. Alternatively these countries could remain with the SADC if all members of the COMESA customs union became members of the SADC Trade Protocol. Section 2.5: So what are the options for Regional Integration in Southern African countries? Four options for regional integration in Southern Africa are generally discussed; 1. All SADC members negotiate a new common external tariff. All existing
bilateral arrangements that members have, including SACU, are renegotiated and aligned to the new SADC common external tariff. Countries must choose between SADC or COMESA customs union membership.
2. All SADC members sign up to the current SACU common external tariff so the SADC customs union is essentially an expanded SACU. Countries must choose between SADC or COMESA customs union membership.
3. SADC and COMESA become a single customs union and have a single external tariff. Members do not have to choose as all groups have integrated.
4. SACU expands to include some but not all SADC members. Members of SADC and COMESA choose between either the SACU or COMESA customs union.
One major obstacle exists in terms of Option 1 and 2; namely, SACU led by South Africa has already negotiated a number of bilateral trade agreements including the TDCA with the European Union, and with the European Free Trade Association (EFTA), is about to sign with Mercosur and is exploring agreements with China and India. Why is this problem? SACU has already negotiated a common external tariff and tariff phase down arrangement with these groups of countries. Either all other SADC countries have to sign up to these trading arrangements already negotiated by SACU or SACU will have to re-negotiate all their existing trade agreements. It is unlikely (although not impossible) either SACU will wish to renegotiate these hard won arrangements or non-SACU countries will be content to sign up to a customs union whose negotiations they have not been party to. Whether these options can be realised depends on how far the SACU trade arrangements would need changing to accommodate new members, and whether joining a “SACU+” arrangement brings other benefits such as revenue sharing. Before SADC can start negotiating a customs union members will have to decide whether the SACU common external tariff will be adopted or SACU will have to decide to give up its common external tariff and

11
start negotiating a SADC common external tariff from square one. It is therefore extremely unlikely if not impossible that SADC will implement a customs union by 2010. Option 3 is perhaps the ideal but it would face similar problems to options 1 and 2 in terms of negotiating a new common external tariff as both SACU and COMESA have common external tariffs which would require integrating. A commonly suggested trading arrangement is option 4. SACU already includes five countries South Africa, Botswana, Lesotho, Swaziland and Namibia. Mozambique has been rumoured to be investigating the possibility of joining. This would only leave Tanzania that is not already a member of COMESA. Given Tanzania is already a member of the East Africa Community (EAC) a customs union with Uganda and Kenya who are members of COMESA but not of SADC, it would make sense for Tanzania to join COMESA. You would then have two trading blocs SACU and COMESA. SADC’s trade capacity could be merged with that of SACU and COMESA and would continue to lead on crucial areas if regional integration such as energy, peace and security and water. Alternatively the agendas of SACU, SADC and COMESA could be integrated with much closer working together and based around two common external tariffs, that of the current SACU and that of COMESA. This perhaps begs the question of why all the fuss on agreeing customs unions. The paper asserts that the real benefits of a customs union come when internal trade barriers including rules of origin are fully removed. This would require a revenue sharing mechanism to be put in place. It is sensitive given the dependency of countries on trade taxes and it would also require divesting revenue collection to the customs union members who form the border with the rest of the world. Important progress towards integrating markets can be made without the adoption of a customs union but through a free trade area by focusing on the removal of tariff and non-tariff barriers. However given a customs union with free movement of goods is the ideal and SACU and COMESA are the closest to being fully functioning CUs the next section explores the possibility of a free trade agreement between them with the aim of increasing the pace of integration in Africa. SECTION 3: TRADE BETWEEN COMESA AND SACU: CURRENT AND POTENTIAL This section provides a detailed analysis of current and potential trade between SACU and COMESA using South Africa data as a proxy for SACU. The analysis is useful to inform policymakers and trade negotiators what the gains and risks would be to negotiating a COMESA SACU FTA. South Africa’s trade flows have been used to proxy for that of SACU. SACU’s trade is dominated by South Africa’s trade by a ratio of approximately 10:1. Therefore in focusing on South Africa’s trade we are capturing most of SACU trade. Where relevant we have also compared COMESA SACU trade with

12
China and India SACU trade, two countries where SACU is currently negotiating preferential trade arrangements. Two data sources have been used one presented in Rand and the other in US$. We have kept the currency denomination of the original data used, at the time of writing 1USS$ = 6Rand, April 2006. South Africa’s GDP, population and trade dwarfs that of its SACU neighbours. Its GDP is 182.28 Billion US$ compared with the next highest Botswana at 7.02 Billion US$, 2002. Table 1 Basic SACU indicators.
Population GDP Per Capita
GNI 2002 (mn) 2002 ($ bn) 2002 ($) Botswana 1.71 7.02 3,010 Lesotho 1.78 1.15 470 Namibia 1.99 4.37 1,960 Swaziland 1.09 1.69 1,240 South Africa 45.35 182.28 2,600
The COMESA members are also economically heterogeneous although less so than SACU. South Africa dominates not just SACU but SADC as a whole. South Africa is both the largest economy in Africa and constitutes approximately 60% of the total GDP of the SADC region. Section 3.1: Aggregate Bilateral Trade Table 2 shows that South Africa’s imports from COMESA have increased by 11.55% over the past ten years, 1995-2005 using a semiLog regression to estimate the underlying trend. During 2002-2005 imports from COMESA doubled to R 7,445m this seems to have been driven by Egypt, Angola and Zimbabwe and commodity price increases. The 1995-2005 trend growth rate of 11.55% is less than the growth rate of South Africa’s imports from the rest of the world which have increased by 13.38%. This accounts for the marginal fall by 1.61% in COMESA’s share of South Africa’s imports. South Africa’s exports to COMESA tell a similar story. Although exports have grown over the same period by 9.98%, they have grown fractionally faster to the rest of the world by 12.57% leading to a 2.30% fall in COMESA’s share of South Africa’s exports. In comparison South Africa’s trade between the two largest Asian economies China and India both show a significantly faster increase in trade. Imports from China grew on average 32.4% between 1993 and 2003 and from India at 18.5% between 1995-2004. Exports to China also showed a high growth rate,

13
increasing by 29.7% 1993-2003 and to India by 19.4% during 1995-20047. What is interesting to look at is the actual level of trade between South Africa and these different trade partners. Whilst South Africa’s imports from China were quadruple those from COMESA in 2003 at R 16,582m (million Rands) compared with R 4,354m from COMESA. South Africa imports from COMESA in 2004 at R 6,601m were significantly greater than imports from India at R 4,547m. In terms of South Africa exports, COMESA was a more important partner by far than either China or India, in 2003 exports to COMESA were R 22,545m, to China R 6,570m and to India, R 3,662m. So even though trade with China in particular but also with India is growing at a very high rate, the COMESA countries will continue to be the most significant export market for South African goods. Reduced trade barriers between South Africa and COMESA could lead to even higher levels of trade.
7Owen Willcox and Dirk Van Seventer – TIPS, October 2004 (China) and March 2005 (India)

14
Table 2: SA Aggregate Trade with COMESA and the World 1995- 2005 in millions of Rand Growth Year 1995 1996 1997 1998 1999 2000 2001 2002 2003 2004 2005 1995-20058 (%) SA Imports from COMESA 2,203 2,818 2,823 2,296 2,363 2,188 2,693 3,970 4,354 6,601 7,445 11.55% % growth per year 27.9 0.2 -18.7 2.9 -7.4 23.1 47.4 9.7 51.6 12.8 SA Imports from World 101,054 116,903 129,834 143,976 147,383 188,064 215,441 274,458 258,431 306,368 350,661 13.38% % growth per year 15.7 11.1 10.9 2.4 27.6 14.6 27.4 -5.8 18.5 14.5 COMESA share of SA imports 2.2 2.4 2.2 1.6 1.6 1.2 1.3 1.4 1.7 2.2 2.1 -1.61% SA Exports to COMESA 9,090 12,483 14,566 14,252 13,793 17,030 19,839 25,769 22,545 22,651 25,836 9.98% % growth per year 37.3 16.7 -2.2 -3.2 23.5 16.5 29.9 -12.5 0.5 14.1 SA exports to World 100,447 114,133 137,339 142,740 161,508 208,285 215,248 277,993 255,560 291,129 320,005 12.57% % growth per year 13.6 20.3 3.9 13.1 29.0 3.3 29.2 -8.1 13.9 9.9 COMESA share of SA X 9.0 10.9 10.6 10.0 8.5 8.2 9.2 9.3 8.8 7.8 8.1 -2.30%
Source: TIPS Database and own calculations Table 3 shows that total trade between South Africa and COMESA has grown by 10.33% over the past ten years although this has not kept pace with growth in South Africa’s trade with the world resulting in a 2.34% fall overall. What is interesting to note is that
8 Throughout the analysis growth is estimated by a semiLog regression which attempts to trace the underlying growth curve despite year by year fluctuations.

15
South Africa’s trade balance, that is the amount it exports minus the number of imports, is negative with the world (it has a trade deficit). However it is positive with COMESA (it has a trade surplus) at 18,391 million Rand in 2005. This compares with a trade deficit with China of -10,012 million Rands in 2003 and with India of -886 million Rands in 2004. Table 3: Total Trade between SA and COMESA in millions
Growth
1995-2005
Year 1995 1996 1997 1998 1999 2000 2001 2002 2003 2004 2005 (%) SA's Trade Balance with COMESA (X-M) 6,887 9,665 11,743 11,956 11,430 14,842 17,146 21,799 18,191 16,050 18,391 SA's Trade Balance with World (X – M) -607 -2,770 7,505 -1,236 14,126 20,220 -193 3,535 -2,871 -15,239 -30,656 SA Total Trade with COMESA (X and M) 11,293 15,301 17,390 16,548 16,157 19,218 22,532 29,740 26,899 29,252 33,280 10.33% Annual growth (%) 35.5 13.7 -4.8 -2.4 18.9 17.2 32.0 -9.6 8.7 13.8 SA Total Trade with world (X and M) 201,501 231,036 267,173 286,715 308,891 396,349 430,689 552,451 513,991 597,497 670,666 12.98% COMESA's share of SA’s total trade (% overall X and M) 5.6 6.6 6.5 5.8 5.2 4.8 5.2 5.4 5.2 4.9 5.0 -2.34%
Source: TIPS Database and own calculations Section 3.2: Trade with COMESA disaggregated by country Before we go any further it is important to analyse both which countries in COMESA are most important in terms of trade with South Africa and also the impact of the SADC Trade Protocol and overlapping membership of SACU, SADC and COMESA on the results of this paper. Of the 20 countries that are members of COMESA 8 are also members of SADC. These are DRC, Zimbabwe, Swaziland, Zambia, Malawi, Mauritius, Madagascar and Angola.

16
This complicates our calculations and analysis because an FTA has already been agreed between the SADC member countries through the SADC Trade Protocol. However the 2005 mid-term review of this Protocol revealed that most of the agreed tariff reductions have not been implemented. This is largely due to back-loading by non-SACU SADC countries, where they have postponed the time when they have to reduce their tariffs as agreed in the FTA. This means that the impacts of the SADC FTA are yet to be felt.

17
In terms of our analysis of potential trade from a SACU COMESA FTA this means our results will still be relevant. However what we must bear in mind is that without a SACU COMESA FTA if SADC members fulfil their commitments to implement the SADC FTA a significant percentage of COMESA member country trade (those countries that belong to SADC) would be liberalised anyway. Table 4 below shows the South African imports from COMESA per COMESA member country. We can see that a handful of countries are in fact significant in trade terms. Imports in 2005 were greatest from Zimbabwe at R 3,131.5m, followed by Angola at R 1891 m, Zambia at R 1303 m and Malawi R 455 m. All of these countries also belong to SADC. The surge in imports from Angola between 2003 and 2004 resulting in a 37.9% growth rate in the period 1995-2005 is due to the increase in the oil price and is not related to the SADC Trade Protocol. The significant increase in imports from Zimbabwe from 2002 is caused by a billion Rand increase in imports of nickel ore. In terms of non-SADC COMESA countries (marked with an asterisk, ‘ * ‘), Kenya and Egypt are by far the most important although with imports at R 204 m and R 176 m respectively their importance to South Africa are seemingly far weaker. If we turn our attention to the bottom half of the table we see that non-SADC COMESA trade as a proportion of all COMESA trade has fallen from 22% in 1995 to 6% in 2005. In terms of non-SADC COMESA imports, as a proportion of South Africa’s world imports it is insignificant falling from 0.5% to 0.1% over that period. All-COMESA imports are similarly insignificant falling over the period to just 2% of South Africa’s total imports. To some extent what we are seeing here is a competitive advantage gained by countries geographically close to South Africa. However the figures could also disguise trade diversion, where imports are diverted away from the most efficient producer towards less efficient producers within the trading bloc. This has been demonstrated to occur in FTAs and customs unions that maintain high trade barriers against non-member countries. Both SACU and COMESA would probably fall into this category. For instance the majority of SACU’s trade is with the European Union where a far reaching free trade agreement exists. Tariffs between SACU and the EU have been reduced but maintained with other countries not party to an FTA. The question can be asked if South Africa is serious about supporting Africa as a continent, to develop free trade with Africa should be a priority and perhaps a greater priority than disadvantaging African countries in favour of those in Latin America, Asia, Europe or the USA where FTAs have either been signed or are being explored.

18
Table 4: South Africa Imports from COMESA in millions of Rand
Growth
Year 1995 1996 1997 1998 1999 2000 2001 2002 2003 2004 2005 1995-2005
World 101,054 116,903 129,834 143,976 147,383 188,064 215,441 274,458 258,431 306,368 350,661 13.4%
Angola 3.6 261.7 210.0 9.2 196.8 67.9 12.5 128.5 28.8 1684.3 1891.1 37.9%
Burundi* 0.0 0.2 2.2 0.7 5.4 0.4 0.7 1.5 4.3 0.5 3.1 36.9%
Democratic Republic of the Congo 365.5 480.2 453.1 25.0 17.9 9.5 20.7 17.9 28.6 44.3 26.8 -24.8%
Djibouti* 0.0 0.1 0.0 0.2 0.1 0.0 0.0 0.4 0.6 0.3 1.0 0.0%
Egypt* 369.0 228.1 189.5 298.8 82.3 52.2 72.8 109.9 358.0 108.6 175.8 -6.1%
Eritrea* 0.0 0.0 0.0 0.0 0.0 0.0 0.0 0.5 0.2 0.8 0.5 0.0%
Ethiopia* 2.7 1.3 4.5 4.1 3.8 3.3 3.1 10.7 11.7 23.4 9.3 22.7%
Kenya* 112.7 126.7 89.6 62.5 38.5 44.1 89.6 110.1 106.6 329.2 203.5 8.8%
Comoros* 0.3 0.4 0.4 0.1 0.2 0.1 0.2 1.4 0.3 0.4 1.8 13.4%
Libyan Arab Jamahiriya* 0.0 0.0 0.0 0.1 16.8 0.1 0.0 0.0 0.1 0.5 0.1 0.0%
Madagascar* 10.0 6.3 17.7 39.6 16.1 21.2 17.4 35.3 14.9 10.5 11.2 1.8%
Mauritius 37.9 17.3 25.6 29.4 52.1 46.5 153.3 93.0 124.7 103.8 167.8 23.0%
Malawi 206.7 317.2 400.0 459.4 467.2 285.8 328.2 483.6 381.9 435.6 455.8 4.5%
Rwanda* 1.2 0.3 2.4 2.2 0.1 26.1 75.9 4.2 1.5 0.9 6.4 18.6%
Seychelles* 2.6 4.7 6.3 8.7 9.4 21.7 33.9 11.9 26.0 27.7 17.9 23.2%
Sudan* 1.0 4.0 2.3 1.1 1.7 2.0 1.4 3.5 2.6 5.6 0.6 1.5%
Swaziland 2.9 1.6 0.3 0.7 0.6 2.1 0.5 1.1 0.3 0.0 0.3 -21.5%

19
Uganda* 3.4 1.9 3.2 10.8 21.6 4.7 18.1 20.7 36.1 36.9 36.4 33.9%
Zambia 95.4 179.0 181.3 230.5 221.8 301.7 421.2 776.6 571.3 992.3 1303.6 27.2%
Zimbabwe 988.0 1187.1 1235.1 1113.4 1210.9 1298.3 1443.6 2159.5 2655.8 2795.7 3131.5 12.5% Total SA Imports from non-SADC COMESA 492.8825 367.564 300.338 389.2077 179.9096 154.652 295.6934 274.832 547.7514 534.842 456.511 2.5%
Total SA Import from all COMESA 2202.858 2817.96 2823.42 2296.394 2363.256 2187.6 2693.214 3970.33 4354.204 6601.44 7444.62 11.5% Proportion of SA M from non-SADC COMESA 22.37468 13.0436 10.6374 16.94864 7.612786 7.06947 10.9792 6.92214 12.57983 8.10189 6.13209 -8.1%
M from COMESA as % M from world 2.179886 2.41051 2.17464 1.594987 1.603484 1.16322 1.250092 1.44661 1.684863 2.15474 2.12303 -1.6% M from non-SADC COMESA as % M from world 0.487742 0.31442 0.23132 0.270329 0.12207 0.08223 0.13725 0.10014 0.211953 0.17457 0.13019 -9.6%
Key: ' * ' = non-SADC COMESA countries Source TIPS and COMESA database and own calculations In terms of South Africa’s exports to COMESA countries in 2005, Table 5, Zimbabwe is the largest market at 7165 MR, followed by Zambia at 5054 MR and Angola at 2978 MR. Kenya a non-SADC COMESA country is next at 2854 MR. The proportion of South Africa exports to non-SADC COMESA as a proportion of total South Africa exports to COMESA has grown over the period 1995-2005 from 14.2% to 18.3%. As a proportion of South Africa’s world exports non-COMESA exports form a minor 1.5% and that of all COMESA 8.1%. Once again whilst the proximity of a country to South Africa heavily influences the direction of South Africa’s exports, and the small size of African markets in general limits demand, there is the possibility that trade diversion is taking place.

20
Table 5: South Africa Exports to COMESA in millions of Rand
SA Exports to COMESA Growth
Year 1995 1996 1997 1998 1999 2000 2001 2002 2003 2004 2005 1995-2005
World 100,447 114,133 137,339 142,740 161,508 208,285 215,248 277,993 255,560 291,129 320,005 12.6% Angola 391.7 663.4 876.9 1,079.6 1,223.5 1,289.7 2,472.1 3,189.6 3,130.5 2,932.1 2,978.6 23.0% Burundi 13.7 10.1 39.2 23.0 19.0 34.0 20.5 43.2 29.8 28.0 34.4 8.7% Democratic Republic of the Congo 632.8 946.6 906.3 1,045.7 774.9 857.6 864.4 1,424.5 1,230.2 1,329.1 1,747.5 7.6% Djibouti 2.8 1.4 2.4 2.1 18.0 22.6 44.6 43.7 26.9 37.7 35.5 44.0% Egypt 89.6 185.4 145.0 132.8 139.0 119.6 259.7 183.3 247.0 159.2 243.6 6.8% Eritrea 0.0 0.0 0.0 1.4 1.0 0.5 11.5 14.0 21.8 15.2 24.5 0.0% Ethiopia 14.1 62.5 56.4 66.8 71.8 68.6 92.1 130.8 113.7 230.5 125.3 19.8% Kenya 835.4 906.5 1,584.3 1,252.7 1,180.0 1,429.0 1,700.4 2,192.4 2,129.9 2,855.7 2,853.7 12.7% Comoros 73.6 83.9 110.5 93.8 75.5 59.8 76.1 132.7 122.5 75.1 47.0 -1.5% Libyan Arab Jamahiriya 1.2 0.8 18.9 14.7 14.3 48.3 31.1 69.3 40.9 44.6 38.9 43.4% Madagascar 161.4 214.6 302.7 254.5 245.5 282.0 410.7 419.1 722.2 557.4 523.4 13.4% Mauritius 655.0 927.1 1,181.1 1,026.9 1,185.0 1,931.6 2,005.2 2,590.7 2,006.1 1,713.3 2,076.0 11.7% Malawi 627.3 1,034.0 1,127.1 1,213.2 1,342.9 1,555.6 1,679.0 2,187.0 1,610.7 1,481.4 1,555.0 8.0% Rwanda 15.0 12.3 36.6 84.8 45.9 35.0 60.9 73.0 83.4 67.5 59.0 15.8% Seychelles 120.7 162.8 188.9 179.0 198.2 208.4 214.0 349.1 290.9 218.6 327.5 8.4% Sudan 18.2 78.2 23.3 60.8 29.2 47.8 124.1 294.9 275.2 283.9 426.0 34.9% Swaziland 0.1 0.9 0.0 0.0 0.0 0.9 0.0 0.0 0.0 0.0 0.0 0.0% Uganda 103.7 109.0 182.0 302.7 238.6 327.4 444.4 528.2 450.0 497.4 520.2 18.4% Zambia 1,235.1 1,757.2 2,208.9 2,126.3 2,218.3 4,168.1 4,362.9 5,002.5 3,799.8 4,274.7 5,054.4 14.2%
Zimbabwe 4,098.4 5,326.0 5,575.7 5,291.3 4,772.9 4,543.7 4,965.6 6,901.5 6,213.5 5,849.6 7,165.3 3.8% Total SA X to non-SADC COMESA 1,288.0 1,612.9 2,387.5 2,214.4 2,030.5 2,400.9 3,079.4 4,054.5 3,832.2 4,513.4 4,735.6 13.2%

21
Total SA X to all COMESA 9,089.9 12,482.6 14,566.2 14,252.0 13,793.5 17,030.0 19,839.2 25,769.4 22,545.0 22,651.1 25,835.7 10.0% proportion of SA X to non-SADC COMESA 14.2 12.9 16.4 15.5 14.7 14.1 15.5 15.7 17.0 19.9 18.3 3.0% X to COMESA as % X to world 9.0 10.9 10.6 10.0 8.5 8.2 9.2 9.3 8.8 7.8 8.1 -2.3% X to non-SADC COMESA as % X to world 1.3 1.4 1.7 1.6 1.3 1.2 1.4 1.5 1.5 1.6 1.5 0.6%
Source TIPS Database and own calculations

22
Section 3.3: Trade with COMESA according to Broad Classifications To understand what drives trade between South Africa and COMESA it is important to look at a more disaggregated level at what types of goods are being traded. This may reveal natural comparative advantage of South Africa and COMESA countries and also disclose any trends in changes of goods traded. Figure 3 looks at changes in the composition of South Africa’s trade with COMESA between 1997 and 2004. The top two pie charts below show that in 1997 basic processed goods were the largest sector of imports from COMESA at 42% of total imports, closely followed by mineral products including oil comprising 34% of the total. Both agriculture and advanced manufactured goods formed smaller shares, 8% and 16% respectively. By 2004 imports have become dominated by minerals and oil at 47% of the total, followed by basic processed goods at 37%. The share of agriculture in imports has fallen to 8% equalling advanced manufactured imports, the share of which remains unchanged.
Source: TIPS and COMESA database and own calculations In terms of exports to COMESA the shares have remained fairly similar from 1997 to 2004 with basic goods dominating exports, increasing from 48% in 1997 to 54% in 2004. Advanced manufacturing is the second largest export sector although the share has fallen slightly from 32% in 1997 to 26% in 2004. Finally both agriculture and mining make up smaller shares, both totalling 10% in 1997 and then 7% agriculture and 13% mining in 2004. The results are not
SA Exports to COMESA 2004
7%13%
54%
26%
(1) Agriculture
(2) Mining
(3) Basic ProcessedGoods
(4) AdvancedManufactured Goods
SA Imports from COMESA 2004
8%
47%37%
8%(1) Agriculture
(2) Mining
(3) Basic ProcessedGoods
(4) AdvancedManufactured Goods
SA Imports from COMESA 1997
16%
34%42%
8%(1) Agriculture
(2) Mining
(3) Basic ProcessedGoods
(4) AdvancedManufactured Goods
Figure 3: Changes in Composition of South Africa and COMESA’s trade, 1997-2004
SA Exports to COMESA 1997
10%
10%
48%
32%
(1) Agriculture
(2) Mining
(3) Basic ProcessedGoods
(4) AdvancedManufactured Goods

23
surprising. South Africa’s economy has a more developed manufacturing base than the rest of Africa accounting for the exports of advance manufactures. Due to the size of its market it has probably been more able to take advantage of economies of scale which could explain the net export of basic processed goods. During this period South Africa has liberalised its tariff structure somewhat including towards certain COMESA countries who participate in the SADC Trade Protocol this may explain some of the shifts and the movement towards the comparative advantage of the two groups. Appendix 2 illustrates the full table of Trade between South Africa and COMESA at the 23 Chapter Level9. We have captured the information in Tables 6 and 7 by grouping chapters by the size of their share in all imports or exports and by their growth rate, this allows us to see chapters with particularly promising trade potential. Chapters are defined as high growth if their growth rate is higher than 20% per annum. Low growth chapters grow by less than 10% per annum with medium growth in between. A chapter is considered high share if it forms more than 10% of total imports or exports, low share if below 5% and medium share if it is between 5-10% of imports or exports. Table 6 reflects the slow growth of South Africa’s exports to COMESA. Most chapters fall into the low growth category with most also low share. Only vehicle parts, optical equipment and base metal exhibit growth above 10% per annum. Table 6
Growth Share Matrix for SA Exports to COMESA Low Share Medium Share High Share High Vehicle parts (23) Growth
Medium Optical equipment (18) Base metals (15) Growth
Low Live animals (1) Vegetable products (2) Mineral Products (5) Growth Animal or vegetable fats (3) Prepared foodstuffs (4) Chemicals (6) Leather products (8) Plastics (7) Machinery (16) Wood products (9) Vehicles (17) Wood pulp and paper (10) Textile and textile articles (11) Foot wear (12) Stone and glass (13) Precious metals (14) Arms (19) Misch manufactures (20) Art and antiques (21)
9 Chapter 23 is the level of product groupings we use to measure the trade. Globally chapter headings are more usually measured as 21 different chapters.

24
Unclassified goods (22)
Source TIPS and COMESA data base and own calculations Table 7 is a more upbeat story with a number of chapters exhibiting high growth rates of COMESA exports to South Africa. High share and high growth chapters are base metals and prepared foodstuffs. Textiles exports, where we might expect COMESA countries to have a comparative advantage compared with South Africa, exhibit a low growth rate even though they represent a high share. Table 7 Growth Share Matrix for SA Imports from COMESA Low Share Medium Share High Share High Machinery (16) Prepared foodstuffs (4) Growth Chemicals (6) Base metals (15) Live animals (1) Leather products (8) Optical equipment (18)
Wood pulp and paper (10) Medium Foot wear (12) Growth Vehicle parts (23)
Low Animal or vegetable fats (3) Vegetable products (2) Mineral Products (5) Growth Plastics (7) Textile and textile articles (11) Wood products (9) Stone and glass (13) Precious metals (14) Vehicles (17) Arms (19) Misch manufactures (20) Art and antiques (21) Unclassified goods (22)
Source TIPS and COMESA data base and own calculations Section 3.4 Intra-Industry Trade (IIT) Conventional trade theory arising from the Heckscher-Ohlin Model assumes constant returns to scale where the cost of production remains the same at any level of industry size or output level. Reducing trade barriers will lead to countries taking advantage of their comparative advantage, in other words specialising in particular industries that use their factors they have in large quantities such as land or labour. However where branding is important and where the cost of production falls as the industry size or level of production increases, namely if scale economies exist, then intra-industry predominates. European trade is characterised by this type of trade where a country may import and export fizzy drinks but it is the brand name, such as Coke or Pepsi that influences the demand.

25
The Grubel-Lloyd Indices (GLI) estimates the level of intra-industry trade between two groups of countries. It is simply total trade, less net trade, divided by total trade. We identified the 100 most traded HS 6 commodity groups and then ranked them by the GLI. Only 54 commodity groups in the 100 largest groups by total trade show evidence of positive intra-industry trade and these are captured in Table 6. We have then calculated the overall level of intra-industry trade by the weighted GLI as displayed in Table 8. Intra-industry trade is low especially when compared to South African trade with Europe where the weighted GLI is 0.13. The weighted GLI for South Africa and the world is 0.18. However IIT with India and China is even lower, where the weighted GLI is 0.01 for both countries. The low IIT between South Africa and COMESA suggests that a reduction in trade barriers will lead to structural adjustment and whilst it might be less severe than adjustment if barriers were removed with India and China, it could still be significant for both South Africa and COMESA countries. Table 8: The Grubel Lloyd Index of Intra-Industry Trade SA Imports HS 6 Code and SA Exports from
Description to COMESA COMESA GLI
1 H854459: Electric conductors, 80-1,000 volts, no connectors 40118843 57800880 0.82 2 H170111: Raw sugar, cane 29815840 46490789 0.78 3 H520512: Cotton yarn >85% single uncombed 714-232 dtex,not
ret. 23770622 41274378 0.73 4 H270400: Coke, semi-coke of coal, lignite, peat & retort carbon 17542528 62804679 0.44 5 H271290: Mineral waxes nes 37586157 8432892 0.37 6 H880230: Fixed wing aircraft, unladen weight 2,000-15,000 kg 33345000 190090594 0.30 7 H240120: Tobacco, unmanufactured, stemmed or stripped 23201520 135059516 0.29 8 H721049: Flat rolled i/nas, coated with zinc, width >600mm, nes 62119139 9393142 0.26 9 H440710: Lumber, coniferous (softwood) thickness < 6 mm 12091554 83090631 0.25 10 H721420: Bar/rod, i/nas, indented or twisted, nes 45183859 5558622 0.22 11 H870323: Automobiles, spark ignition engine of 1500-3000 cc 70598636 7188372 0.18 12 H170199: Refined sugar, in solid form, nes, pure sucrose 288270562 29292789 0.18 13 H240220: Cigarettes containing tobacco 75078169 7055791 0.17 14 H090240: Tea, black (fermented or partly) in packages > 3 kg 4321679 102476594 0.08 15 H847490: Parts for mineral sort, screen, mix, etc machines 139826122 5454062 0.08 16 H210690: Food preparations nes 98602621 3657956 0.07 17 H390120: Polyethylene - specific gravity >0.94 in primary forms 72529568 2540483 0.07 18 H870333: Automobiles, diesel engine of >2500 cc 48925353 1698764 0.07 19 H852812: Color television receive 45763355 1492575 0.06 20 H401120: Pneumatic tyres new of rubber for buses or lorries 181824150 5539038 0.06 21 H721310: Hot rolled bar/rod grooved i/nas in irregular coils 105774901 2862704 0.05 22 H340111: Soaps, for toilet use, solid 79368444 2045357 0.05 23 H100590: Maize except seed corn 418180495 10480873 0.05 24 H490199: Printed reading books, except dictionaries etc 54126429 1231835 0.04 25 H300490: Medicaments nes, in dosage 155099354 3458655 0.04 26 H841391: Parts of pumps for liquids 76847192 1565294 0.04 27 H847330: Parts and accessories of data processing equipment
nes 119332597 2240185 0.04 28 H100190: Wheat except durum wheat, and meslin 65375623 992275 0.03 29 H732690: Articles of iron or steel, nes 57899759 863140 0.03

26
30 H852520: Transmit-receive apparatus for radio, TV, etc. 44847952 608790 0.03 31 H100510: Maize (corn) seed 161964238 2151323 0.03 32 H870190: Wheeled tractors nes 62704328 759000 0.02 33 H392690: Plastic articles nes 48159286 542138 0.02 34 H330499: Beauty, makeup and suntan preparations nes 46331740 502525 0.02 35 H848180: Taps, cocks, valves and similar appliances, nes 54525431 535943 0.02 36 H380810: Insecticides, packaged for retail sale 138422679 1338642 0.02 37 H740811: Wire of refined copper > 6mm wide 1608782 192894413 0.02 38 H730890: Structures and parts of structures, iron or steel, nes 235103081 1487688 0.01 39 H843149: Parts of cranes, work-trucks, shovels, constr machine 78241555 464421 0.01 40 H480100: Newsprint 87553255 467080 0.01 41 H841381: Pumps nes 63626067 283740 0.01 42 H380830: Herbicides, sprouting and growth regulators 136227862 549842 0.01 43 H940600: Prefabricated buildings 62194367 232841 0.01 44 H330590: Hair preparations, nes 54463561 197478 0.01 45 H841370: Centrifugal pumps nes 71224839 244064 0.01 46 H630533: Sacks&bags,f/pckg polyet 50856476 166812 0.01 47 H360300: Safety or detonating fuses, detonators, igniters 80635285 260246 0.01 48 H390760: Polyethylene terephthalate, in primary forms 67307113 205064 0.01 49 H360200: Prepared explosives, except propellent powders 83479401 247834 0.01 50 H481910: Cartons, boxes & cases, of corrugated paper or board 75852637 220479 0.01 51 H270900: Petroleum oils, oils from bituminous minerals, crude 4607120 1671750746 0.01 52 H382490: Chemical prep, allied in 70582370 191069 0.01 53 H870899: Motor vehicle parts nes 110326347 297660 0.01 54 H220210: Beverage waters, sweetened or flavoured 242839308 647908 0.01 Weighted average GLI for All HS 6 Groups 0.060331
Source TIPS and COMESA data base and own calculations Section 3.5: Trade Intensities Between South Africa and Comesa The previous sections have looked at the trade flows between the two groups without placing it in a wider context. By examining the proportion of South African trade with COMESA and comparing it with total trade we can determine whether there is a bias, positive or negative towards importing from this source. The import intensity index for South African imports from COMESA is the proportion of COMESA imports in total South African imports divided by the total exports from COMESA divided by world exports excluding South Africa. It is written: Equation 1: (intensity of imports) [ ] ( )[ ]
iw
j
i
ij
XXX
MM
ijm −= where Mij = SA imports from COMESA Mi = total imports of SA Xw = total world exports (trade) Xi , Xj = total SA export and total export of COMESA respectively The index of intensity of COMESA’s import trade with SA is defined as:

27
Equation 2: (intensity of exports) [ ] ( )[ ]jw
j
i
ij
MXM
XX
ijx −= where Xij = SA exports to COMESA Xw = total world imports (trade) Mj = total COMESA imports If the value of the index is greater than 1, this indicates South African consumers are biased towards COMESA imports or COMESA exports are biased towards exporting to South Africa. If the value of the index is equal to one, trade is not geographically biased. And if the value is less than one, South African consumers prefer non-COMESA goods or COMESA exporters prefer exporting elsewhere. Figure 4
Trade Intensities Between South Africa and COMESA 1999-2004
0.010.020.030.040.050.0
1999 2000 2001 2002 2003 2004
Year
Inde
x S
core
Export IntensityImport Intensity
Source TIPS and COMESA data base and own calculations Figure 4 reveals that for both South Africa and COMESA there is a bias towards trading with each other. However, whilst the import intensity of COMESA exports to South Africa is approximately 2 the export intensity is over 30. COMESA countries have a strong preference for South African imports far more than South African consumers do for COMESA imports. This may conceal a number of issues including trade diversion. Section 3.6: Tariff Barriers

28
Tariffs can reduce the amount of trade that takes place and if tariffs are very high stop trade taking place completely. Traditionally tariffs have been used to protect domestic industries. Inadvertently this can lead to uncompetitive industries and restricting downstream industries. South Africa was forced into protection as a development strategy when sanctions were imposed. It is becoming more liberal. The level of protection amongst COMESA members has varied with some very liberal countries such as Uganda ranging to others with much more protective tariff structures. A number of countries in COMESA operate in a free trade area. Recently COMESA countries have agreed a common external tariff structure which is being implemented by members. COMESA is committed to becoming a customs union by 2008. For most members this will mean a simplification and liberalisation of their tariffs. We have looked at the tariff structures of South Africa and COMESA at the HS6 level. Table 9 shows the tariff structure of South Africa towards COMESA countries that aren’t in SADC. This is essentially the MFN (most favoured nation) status given to other WTO members as the basic level of preference available. The tariff structure is complicated. We have split tariffs into the 8 bands in Table 9 but there is actually no organised approach to tariffs in South African trade policy. The tariff structure is fairly liberal with over 50% of all tariffs lines between 0 and 0.9% and less than 30% of tariff lines greater than 15%. There are however a number of tariff peaks above 30%. 67% of COMESA exports into South Africa enter at the 0-0.9% tariff level, this is because they consist of commodities. This is represented visually in Figure 5 and reveals a fairly liberal tariff structure. Table 9 South African Tariffs and the Associated Imports from COMESA and the World
Imports from Imports from % of all HS6 % M from % Total
#HS6 lines COMESA the World lines COMESA M
40%+ 233 199,974,021 3,881,098,658 4.46 3.05 1.27 30-39% 154 182,518,656 4,159,276,077 2.95 2.78 1.36 20-29% 602 248,978,827 54,970,055,765 11.52 3.79 17.97 15-19% 421 374,637,883 6,981,120,368 8.06 5.71 2.28 10-14% 441 865,818,923 21,404,594,010 8.44 13.19 7.00 5-9% 545 259,955,743 28,080,198,451 10.43 3.96 9.18 1-4% 65 21,095,725 10,452,826,140 1.24 0.32 3.42 0-0.9% 2763 4,410,031,818 176,048,771,429 52.89 67.20 57.54 Total 5224 6,563,011,596 305,977,940,898 100 100 100
Source TIPS and COMESA data base and own calculations

29
Figure 5
South Africa's Tariffs and their Associated Imports from the World and
COMESA, 2004
020406080
0-0.9%
1-4% 5-9% 10-14%
15-19%
20-29%
30-39%
40%+
% of all HS6 lines % M from COMESA % Total M
Source TIPS and COMESA data base and own calculations COMESA has agreed a common tariff nomenclature although it is not yet implemented. The tariff structure has been organised into four bands, 0% for raw materials, 0% for capital goods, 10-15% for intermediate goods and 25-40% for finished goods. On the implementation of the customs union an external tariff will be agreed within these bands. In Table 10 we have taken two scenarios a high tariff scenario where members of COMESA choose a common external tariff at the maximum points in the bands of 0, 15 and 40% and a low tariff scenario where members agree a common external tariff at the minimum point of the bands of 0, 10 and 25%. 48% of South African exports to COMESA enter at the 0% tariff but 32% enter at the highest tariff band of 25-40% tariff. COMESA’s exports into South Africa face a lower average tariff then South Africa exports into COMESA. Table 10 COMESA Tariffs and the Associated Imports from South Africa and the World (2004) US $
HIGH LOW Lines M from SA M from W % of all HS6 lines
% Imports from SA
% Total Imports
40 25 1551 901,909,545 4,760,280,068
30
32
35
15 10 2044 878,137,268 2,995,272,994
40
20
34
0 0 1520 798,182,719 7,173,776,906
30
48
31
5115 2,578,229,532 14,929,329,968
100 100
100
Source TIPS and COMESA data base and own calculations Figure 5 and 6 when compared reveal that South African exports face higher tariffs into COMESA, than COMESA exports face into South Africa.

30
Figure 6
COMESA's Tariffs and their Associated Imports from the World and South Africa,
2004
0
20
40
60
0% 10-15% 25-40%
Tariff bands
% o
f Tot
al
% of all HS6 lines% Imports from SA% Total Imports
Source TIPS and COMESA data base and own calculations Section 3.7: Revealed Comparative Advantage and Revealed Trade Barriers So far we have looked at which sectors have been growing and the tariff structures facing trade between COMESA and South Africa. This section begins to explore the idea of comparative advantage and suggests what commodity groups would be traded if no trade barriers existed between the two. We apply the concept of revealed comparative advantage (RCA). Comparative advantage predicts that in a world without trade barriers a country will specialise in the production of goods that use its abundant “factor of production” such as labour or land. This is because it can produce it more efficiently as it uses its abundant factor. It will then export this good, using the surplus created to purchase imports of other goods. A comparative advantage is revealed in a particular commodity group if its share in the country’s export basket is larger than the share of the commodity’s world trade in total world trade; in other words, whether the commodity is more important to South Africa’s exports than to world trade;
Equation 3: ∑∑
∑
∑=
i kik
iik
kik
ikik X
X
XXRCA
in which Xik is equal to exports of country i in product k. The results for this calculation for South Africa are reported in Table 11 below. The value for the RCA index is the average of the RCA index for the years 1999-2004. A value above 1 indicates comparative advantage with a higher value indicating a stronger advantage.

31
Table 11 Revealed comparative advantage of South African Exports 1995-2004, 000 US$
Product Product Name
RCA Index for SA
SA exports to COMESA
SA exports to World
1999-2005 2004 2004
71 Precious metals (Natural/cultured pearls, prec stone) 11.7 7,597 158,849,624
26 Ores, slag and ash. 9.5 404 59,779,688 8 Edible fruit and nuts; peel of citr 8.2 18,860 46,954,104
24 Tobacco and manufactured tobacco su 5.0 23,781 23,438,667 22 Beverages, spirits and vinegar. 4.4 16,629 53,267,832 72 Iron and steel. 4.2 341,091 240,330,384 51 Wool, fine/coarse animal hair, hors 3.3 2,899 12,133,376 81 Other base metals; cermets; article 3.0 55,189 10,157,565 17 Sugars and sugar confectionery. 2.9 53,812 18,638,316 25 Salt; sulphur; earth & ston; plaste 2.9 28,861 26,212,122 20 Prep of vegetable, fruit, nuts or o 2.9 14,905 27,639,463 36 Explosives; pyrotechnic prod; match 2.8 24,345 2,194,346 97 Works of art, collectors' pieces an 2.5 358 11,676,823 14 Vegetable plaiting materials; veget 2.5 37 523,181 47 Pulp of wood/of other fibrous cellu 2.3 4,641 27,447,605 76 Aluminium and articles thereof. 2.2 31,909 87,639,913 75 Nickel and articles thereof. 2.2 224 18,775,810 28 Inorgn chem; compds of prec mtl, r 2.0 57,295 59,496,892
3 Fish & crustacean, mollusc & other 1.7 5,748 55,107,044 93 Arms and ammunition; parts and acc 1.6 492 4,525,901 41 Raw hides and skins (other than fu 1.6 634 23,470,456 31 Fertilisers. 1.4 69,698 25,122,178 38 Miscellaneous chemical products. 1.3 86,127 80,239,486 44 Wood and articles of wood; wood ch 1.1 19,045 97,176,317 29 Organic chemicals. 1.1 39,464 245,161,249
74 Copper and articles thereof. 1.1 49,425 58,029,120
Source TIPS and COMESA data base and own calculations Commodity groups at the HS2 level for which South Africa exports reveal a comparative advantage fall into the categories of precious stones and precious and base metals, fruit and vegetables. Tobacco and beverages also reveal a high comparative advantage. Table 12 Revealed comparative advantage of COMESA Exports 1995-2004, 000 US$
COMESA RCA Index COMESA COMESA
Product Product Name 1999-2004
Exports to SA 2004
Exports to World 2004
9 Coffee, tea, matn and spices. 14.5 23,519 1,314,533
24 Tobacco and manufactured tobacco su 7.4 23,908 795,376
27 Mineral fuels, oils & product of th 6.4 273,054 39,493,847 17 Sugars and sugar confectionery. 5.9 14,614 758,901
6 Live tree & other plant; bulb, root 5.6 1,140 481,711 81 Other base metals; cermets; article 4.4 777 429,318

32
13 Lac; gums, resins & other vegetable 4.0 228 99,245 14 Vegetable plaiting materials; veget 3.7 182 10,248 52 Cotton. 3.5 139,850 803,657 16 Prep of meat, fish or crustaceans, 2.7 4,249 384,168
7 Edible vegetables and certain roots 2.7 3,752 556,842 25 Salt; sulphur; earth & ston; plaste 2.7 4,357 733,117 57 Carpets and other textile floor co 2.4 1,337 170,067 53 Other vegetable textile fibres; pap 2.4 780 49,635 31 Fertilisers. 2.2 86 325,856 61 Art of apparel & clothing access, 2.2 10,750 1,682,622 75 Nickel and articles thereof. 2.1 26,030 178,810 41 Raw hides and skins (other than fu 1.8 3,895 286,955 71 Natural/cultured pearls, prec stone 1.8 1,860 931,085 12 Oil seed, oleagi fruits; miscell gr 1.8 10,941 369,667
1 Live animals 1.7 163 41,386 74 Copper and articles thereof. 1.6 61,851 585,925
3 Fish & crustacean, mollusc & other 1.6 615 578,923 62 Art of apparel & clothing access, n 1.6 14,592 1,331,967
8 Edible fruit and nuts; peel of citr 1.2 2,378 389,346 63 Other made up textile articles; set 1.2 666 194,724 46 Manufactures of straw, esparto/othe 1.1 104 11,116 26 Ores, slag and ash. 1.1 209,891 598,287 21 Miscellaneous edible preparations. 1.1 660 175,767
Source TIPS and COMESA data base and own calculations COMESA countries reveal a strong comparative advantage in primary commodities such as coffee, tobacco and mineral oils reflected in Table 12. Some commodity groups such as tobacco are repeated in both the South Africa and COMESA RCA Index, which could suggest some intra-industry trade is taking place. However, it is more likely to be showing value added taking place in South Africa of COMESA raw imports which are then being exported back out to COMESA in the more processed form. Section 3.8: Revealed Trade Barriers (RTBs) RTBs start to unpick the overall barriers to trade including non-tariff barriers such as transport costs, taste and technical barriers to trade. If the index is below 1 we can conclude South Africa is exporting more to the world than to COMESA and that trade barriers may exist. The same logic applies when we consider COMESA exports to South Africa. We calculate the RTB index by Equation 4:
Equation 4: ∑∑
∑
∑=
i k
jik
i
jik
k
jik
jikj
ikM
M
M
MRTB
in which jikM is country j’s imports from country i of product k. The results of
the computations are shown in full in Appendix 3. The results are interesting. Over 1999-2004, COMESA exports tobacco, cotton, ores, copper, coffee, oil seeds and live plants into South Africa in

33
much greater proportions than to the rest of the world. For these groups the RTB index is greater than 13% and in the case of tobacco, cotton, ore and copper between 23-29%. Tariffs on these imports are relatively low, between 0 and 8% except for tobacco where the unweighted average tariff is high at 27.9%. For 60% of commodity groups the index is below 1 indicating some RTB exists. In terms of South African exports to COMESA the highest RTB index score is 3.3. This indicates in general South Africa exports to COMESA compared to the rest of the world are more evenly balanced. However fruits and nuts , lives animals , base metals and explosives are amongst the groups that are exported in greater proportions to COMESA than to the rest of the world. In term of RTBs, 51% of commodity groups exhibit some from of trade barrier. Section 3.10: Market Access Gains The last part of our trade analysis will assess the likely market access gains to both South Africa and COMESA if respective trade barriers were reduced, essentially if they agreed a free trade agreement. This is important for us to see whether an FTA between the two can be justified on solely economic grounds. We assume that an FTA will result in reductions of all tariffs to 0 on both sides. Although this is not wholly realistic it does allow us to frame potential benefits. The market access gains are calculated assuming that import supply is perfectly elastic and therefore equal to infinity and we assume that import demand elasticity is 2 so that a reduction in a tariff by 1% will lead to an increase in import demand of 2%. This is of course a simplifying assumption as the demand and supply elasticity of goods varies however we have no data on individual elasticities that can be called upon. The Equation for COMESA market access gains (MAG) from South African tariffs falling to zero becomes;
Equation 5 ( )COMESA from
ii Imports1
ssGainsMarketAccei
ii t
t+
= ε
where ti is the tariff for good i. Table 13 summarises the MAG gains for COMESA exports into South Africa for the products that gain most from the introduction of zero tariffs (see Appendix 4 for full tables). Over 80% of the gains come from the commodity groups of live animals, meat, fish, dairy, trees, vegetables and coffee. Live animals make up 35.6% of total MAG from a FTA. Total MAG for COMESA to enter an FTA with South Africa are US$121,076,000 million in 2004 alone. This is equivalent to a present discounted value of US$ 818,355,568 million assuming an interest rate of 10% and no change to the current level of imports or tariff schedule. If the growth in imports continues, this figure in reality is much higher.

34
Table 13 COMESA Market Access Gains into SA US$ 000’s per year 2004 imports
% of Total Product Product Name Market
Market Access Gains 000s US$
Access Gains
52 Live animals 43097 35.6%27 Meat 18756 15.5%24 Fish 10418 8.6%62 Dairy prods; birds eggs; honey; 7777 6.4%74 Products of animal origin 6021 5.0%61 Live trees, plants, cut flowers 5810 4.8%44 Edible vegetables 3865 3.2%17 Edible fruit & nuts 2782 2.3%94 Coffee, tea, mate & spices 2421 2.0%
Total MAG 121076 100.0%
Source TIPS and COMESA data base and own calculations The potential gains for South Africa are more complicated to assess, first we must look at the range depending on whether the countries choose the top or bottom of the tariff bands allowed under the COMESA Common External Tariff (CET). Table 14 illustrates the top 10 products that will gain from COMESA liberalising its tariffs to zero. Mineral fuels and iron and steel stand to gain the most from zero tariffs, at US$ 98, 735,000 and US$ 85,815,000 respectively, if the CET was originally at the uppermost end of the band. Overall South Africa stands to gain between US$ 599,455,000 and US$ 874,984,000 in MAG from entering an FTA with COMESA. This translates into a gain of between US$4,051,731,000 and US$5,914,038,000 over the next ten years if once again we discount future wealth by 10%. These gains are significant and should not be ignored. Table 14 South Africa Market Access Gains into COMESA US$ 000’s per year, 2004 imports Market Access Gains (MAG) for South Africa Exports into COMESA (US$,000s) 2004 MAG MAG %MAG %MAG Product Product Name Low High Low High
27 Mineral fuels, oils & product of th 67,341 98,735 11.2% 11.3%72 Iron and steel. 59,714 85,815 10.0% 9.8%39 Plastics and articles thereof. 45,241 65,727 7.5% 7.5%73 Articles of iron or steel. 28,163 41,081 4.7% 4.7%87 Vehicles o/t railw/tramw roll-stock 27,957 42,729 4.7% 4.9%48 Paper & paperboard; art of paper pu 27,633 40,063 4.6% 4.6%85 Electrical mchy equip parts thereof 24,274 37,168 4.0% 4.2%38 Miscellaneous chemical products. 17,667 25,506 2.9% 2.9%40 Rubber and articles thereof. 15,983 23,476 2.7% 2.7%15 Animal/veg fats & oils & their clea 15,180 22,046 2.5% 2.5%
599,455 874,984 100.0% 100.0%Source TIPS and COMESA data base and own calculations

35
However before we get too excited in the case of South Africa exporting to COMESA we need to take into account the fact that South Africa is already in an FTA with SADC and therefore some of the members of COMESA have already agreed to reduce tariffs to zero. Using COMESA data which is somewhat different to the TIPS database but allows us to disaggregate by country we break market access gains down excluding the COMESA members who are currently members of SADC. Table 15 illustrates that if we exclude the SADC COMESA members the MAG are much lower in the range of US$ 47,768,175 and US$ 68,458,476 and would lead to a gain of between US$ 200-400 million over the next 10 years given a 10% discount rate. Table 15: South Africa Market Access Gains into All COMESA and non-SADC COMESA, US$ Market Access Market Access Market Access Market Access
Gains - All COMESA
Gains - All COMESA
Gains - non-SADC
Gains - non-SADC
Low CET High CET COMESA COMESA Low CET High CET Total US$ 520,425,140 744,456,170 47,768,175 68,458,476
Source TIPS and COMESA data base and own calculations SECTION 4: An FTA with COMESA and SACU – Solving the problem? One path to faster integration is for SACU and COMESA to sign a free trade agreement and for SADC and SACU’s trade capacity to merge. This is because it is questionable whether SADC will be able to find agreement on a customs union with all of its 14 members. It could focus its customs union efforts the SACU common external tariff. This would be a similar or slightly smaller configuration to the current SADC EPA group. Figure 7 indicates the current members of SACU and COMESA with a star and reveals that an FTA between the two RECs would unite at least 1/2 of Africa, in land mass and the number of countries if the customs unions became fully operational.

36
Apart from Swaziland COMESA and SACU have no overlapping members. An FTA between the two groups would be desirable for two main reasons;
1. In a click of the fingers you would have united 1/2 of Africa in an FTA (although there would still have to be a lot of work to reduce barriers on the ground).
2. It would remove the problem of overlapping membership; joint membership of SADC, COMESA and SACU is only undesirable on the trade side or where mandates are being duplicated. The SADC Trade Protocol would inform and be replaced by the SACU/SADC-minus COMESA FTA leaving SADC to continue to take a lead on areas it currently has a comparative advantage on with all of its current members.
3. The AU REC survey found that overlapping membership is driven by political and economic motives. Agreeing an FTA would accommodate all economic interests as countries would have access to both South Africa and COMESA markets.
This of course assumes that all countries belonging to COMESA would join its customs union arrangement. This is currently a major assumption although there is a growing rump of countries that are committed to the COMESA CU.
Figure 7: Africa: Stars indicate countries belonging to SACU or COMESA – they span half of Africa, stars in the sea indicate the island nations of Mauritius, Comores and Seychelles.

37
SECTION 5: Non-tariff barriers (NTBs) According to the study commissioned by the South African Department of Transport, known as Moving South Africa, a load travelling from South Africa to a destination within SADC costs between 46% and 119% more than it does moving within the Republic. A recent World Bank study found that a shipment from Baltimore to Durban costs $2500 whilst a shipment from Baltimore to Maseru via Durban cost $12,000. This is a problem of Non-tariff barriers (NTBs). A plethora of NTBs exist in the region such as non-acceptance of certificates of origin, temporary bans on products, visa requirements, non acceptance of standards, customs blockages and poor infrastructure. As tariff rates fall through WTO negotiations or bilateral agreements the importance of non-tariff barriers becomes increasingly important to facilitate trade. Mold (2005) looks at the prevalence and relevance of NTBs to African countries and finds that African countries have frequently suffered consequences through lost export markets of NTBs imposed by industrialised countries and in particular due to anti-dumping measures and standards compliance. Yet African countries are also guilty of putting up administrative impediments to intra-regional trade. An inventory of SADC countries’ NTBs was carried out by Imani (2004). They found that NTBs in the SADC region were a serious impediment to trade. The biggest barriers faced by traders they found were to agricultural commodities. Commodities worst affected were sugar, maize, meat products, dairy, tea, timber and seasonable vegetables. The worst NTBs in the region are caused by customs administration bottlenecks. Whilst the relative cost to intra-regional trade caused by NTBs as opposed to tariffs is not quantified NTBs are without doubt a major impediment. The moves now being taken by COMESA and SARS to implement one stop border posts and by SADC to agree and implement an NTB Removal Action Plan are a priority. As the level of tariffs fall within the region trade will increase and investment in physical and human capacity to facilitate the trade will be required to ensure the economic benefits are reaped. SECTION 6: CONCLUSION This paper has included a detailed analysis of the current and potential trade between South Africa (proxying for SACU), and COMESA. The purpose of this exercise is to provide practical information on one option for more rapid integration in Africa. Due to the configuration of the SADC EPA this could also be termed a SADC (minus) COMESA FTA. South Africa in particular has played a strong leadership role in the Africa Union’s Nepad which commits to integration in Africa. If it is serious about this end then it should consider the merits of an FTA with COMESA on the potential role it would play in integrating Africa, as it would contribute towards integrating ½ of Africa, and towards faster economic development.

38
At the present time Southern Africa seems to have lost momentum in the trade integration agenda. One reason may be the dominance of South Africa and potential fear countries outside SACU have in terms of moving towards a customs union. But another clear reason is that SACU has agreed a number of bilateral trade agreements that will inevitably make negotiating a SADC Customs Union more difficult unless the SACU CET is adopted or SACU accepts that its own CET can be renegotiated. COMESA is a significantly more important export market for South Africa exporters than either China or India. In 2003 exports to COMESA were three times more than exports to China and six times more than exports to India. Making trade work better in the region is imperative for growth in Africa. The low growth in trade between COMESA and SACU over the past ten years and compared to countries like China and India should also be taken as a reason to speed up regional integration in Africa with whatever complementary policies may be necessary. The suggestion of an FTA between SACU and COMESA will have implications for the SADC Trade Protocol and for membership of SADC in terms of the trade agenda. This paper’s reservations about the realism of a SADC customs union across all 14 members should not be taken as a criticism of the SADC trade agenda so far, it is a significant achievement to reach the stage it currently is at. However implementation of the SADC Trade protocol has been slow and importantly there are a number of difficulties towards implementing a customs union that shouldn’t be ignored and addressing them will help in forging a faster regional integration path. In addition SADC is leading in a number of fundamental areas in the broader regional integration process such as energy, water and peace and security and a division of labour between the three RECs of SACU, SADC and COMESA or merging of capacities and agendas could have many benefits outside the narrow trade integration agenda. What will be vital is an enforcement mechanism which requires the members to implement commitments they have made. Without this progress is likely to be slow. An FTA between SACU/SADC-minus and COMESA should be considered. It could remove the problematic overlap of membership of REC Trade Protocols and it will pave a clear and fast way towards a more integrated Africa which is able to emerge as a fourth economic pillar against those of the Americas, Europe and Asia. It is for member states in the SADC region to decide what the best way forward is. But whatever decisions are taken the bigger picture should be borne in mind; if Africa is not to be further marginalised, fast and real regional integration must be undertaken.

39
Appendix 1: Bibliography
1. Trade Between South Africa and China: Current and Future Potential – Owen Willcox and Dirk van Seventer, TIPS, Oct 2004
2. Trade Between South Africa and India: Current Patterns and Potential – Owen Willcox and Dirk van Seventer, TIPS, March 2005
3. Overlapping Membership in COMESA, EAC SACU and SADC Trade Policy Options for the Region and EPA Negotiations.
4. Overcoming the EPA-TDCA Confusion In Southern Africa – Landell Mills, 2006, DFID funded.
5. The Case for Rationalisation – Experts’ Meeting on the rationalisation of the RECs Ghana, Accra 27-28 October, AU Commission and Economic Commission for Africa – No author cited.
6. Inventory of Non-tariff Barriers in the SADC Region – Volume 1 Synthesis report, February 2005, Imani Development Austral Pty Ltd
7. Non-tariff Barriers – Their Prevalence and Relevance for African Countries – Andrew Mold, Economic, Commission for Africa, ATPC Work in Progress No.25.
8. “A Study to Assess the Likely on Southern Africa and EU producers of further liberalising the Trade, Development and Cooperation Agreement (TDCA) by granting South Africa duty free access to the EU.” By John Olympio, Peter Robinson, Matthew Cocks, Landell Mills, funded by DFID, 2004. [email protected]
9. SADC Non-tariff Barrier Road Map, Imani Development, Pretoria. [email protected]

40
Appendix 2 Trade between South Africa and COMESA at the 23 Chapter Level
Imports from COMESA Exports to COMESA Total Trade Average Average Average Average Average Average Average Average Average Annual Share Share Annual Share Share Annual Share Share
Growth 1997-2000
2000-2004 Growth
1997-2000
2000-2004 Growth
1997-2000
2000-2004
2000-2004 (%) (%)
2000-2004 (%) (%)
2000-2004 (%) (%)
(%) (%) (%) C01: Live animals 32.07% 1.27 0.71 -5.07% 1.65 1.46 -8.50% 1.58 1.33 C02: Vegetables -40.84% 9.53 6.67 8.08% 6.28 6.29 6.18% 6.70 6.29 C03: Animal or vegetable fats 1.48% 0.23 0.09 -0.93% 1.03 0.66 -0.42% 0.92 0.57 C04: Prepared foodstuffs and tobacco 36.79% 12.79 10.12 -5.31% 7.84 8.83 -5.13% 8.54 8.94 C05: Mineral products -4.17% 15.99 27.57 -1.50% 10.45 11.53 22.50% 11.32 14.66 C06: Chemicals 130.63% 2.52 1.81 3.40% 15.03 14.24 3.33% 13.29 12.22 C07: Plastics -0.22% 0.82 0.69 5.30% 6.51 6.85 5.81% 5.71 5.85 C08: Leather 34.03% 1.08 1.23 -12.23% 0.09 0.09 -4.82% 0.22 0.25 C09: Wood Products -1.59% 4.09 3.67 -0.26% 0.62 0.66 5.79% 1.10 1.11 C10: Wood Pulp and Paper 11.75% 0.90 0.89 1.54% 4.13 4.43 1.56% 3.69 3.85 C11: Textiles 2.01% 23.94 21.80 -9.59% 2.71 2.73 3.08% 5.70 5.64 C12: Footwear 12.37% 0.68 0.63 -2.99% 0.30 0.26 -7.32% 0.35 0.31 C13: Stone and glass -15.94% 1.31 1.46 0.88% 1.28 1.16 -1.62% 1.28 1.18 C14: Precious metals -12.73% 4.09 0.35 9.45% 0.09 0.30 16.09% 0.73 0.31 C15: Base metals 54.06% 11.18 11.69 18.04% 11.91 13.73 20.00% 11.74 13.31 C16: Machinery 32.04% 4.92 4.92 4.57% 17.93 15.79 4.43% 16.06 13.98 C17: Vehicles 1.58% 1.44 2.51 -7.39% 8.75 8.13 -5.17% 7.70 7.28 C18: Scientific Equipment 25.96% 0.60 0.43 11.02% 1.35 1.34 10.78% 1.24 1.19 C19: Arms & ammunition 6.55% 0.00 0.00 0.00% 0.05 0.00 0.00% 0.04 0.00 C20: Miscellaneous manufactures 0.00% 1.96 1.74 2.15% 1.55 1.47 1.81% 1.60 1.50 C21: Art and antiques 0.65% 0.12 0.08 -8.11% 0.02 0.01 -26.45% 0.03 0.02 C22: Unclassified -36.26% 0.55 0.93 -47.98% 0.39 0.08 -18.35% 0.41 0.21 C23: Special class; vehicle parts 14.96% 0.00 0.00 24.32% 0.04 0.01 24.41% 0.04 0.01 Total 100.00 100.00 2.67% 100.00 100.00 7.06% 100.00 100.00
Source TIPS and COMESA data base and own calculations

41
Appendix 3: Full Tables of Revealed Trade Barriers of South Africa’s exports into COMESA and COMESA’s exports into South Africa Table A: Revealed Trade Barriers of South Africa exports to COMESA
South Africa's
South Africa's Unweighted
Product Product Name RTB Index
Exports to
Exports to Average
COMESA the World Tariff 8 Edible fruit and nuts 3.3 114447.5 8664409 7.4% 1 Live animals 3.2 75590.71 139922.9 0.0% 36 Explosives 2.7 87911.65 194491.6 3.1% 81 Base metals 2.5 59691.19 684090.4 1.8% 20 Prep of vegetable, fruit, nuts 2.4 93789.53 1679700 16.3% 78 Lead and articles thereof. 2.4 7974.827 21751.72 5.1% 79 Zinc and articles thereof. 2.3 51644.49 146716.6 0.0% 17 Sugars and sugar confectionery. 2.3 279696.3 1745083 10.5% 47 Wood pulp 2.1 45954.46 2093810 0.0% 22 Beverages, spirits and vinegar. 2.1 149240.5 3092507 17.0% 72 Iron and steel. 1.9 1017739 19321052 7.7% 18 Cocoa and cocoa preparations. 1.9 25583.65 171379.9 9.3% 31 Fertilisers. 1.9 425800.7 797036.9 0.0% 86 Railw/tramw locom, rolling-stock & 1.8 34911.32 225308.6 9.8% 48 Paper & paperboard; art of paper pu 1.7 543312.2 2603679 16.7% 28 Inorganic chemicals 1.7 262829 3303822 0.9% 38 Miscellaneous chemical products. 1.7 423802.6 1877091 2.9% 16 Prep of meat, fish or crustaceans, 1.7 34533.27 188516.5 10.4% 65 Headgear and parts thereof. 1.6 7090.089 28212.9 25.1% 76 Aluminium and articles thereof. 1.6 141559.3 5919476 6.7% 39 Plastics and articles thereof. 1.5 786380.7 2324732 8.2% 33 Essential oils & resinoids; perf, 1.5 166670 718346.6 9.3%
44 Wood and articles of wood; wood ch 1.4 110762.4 3232883 10.7%
32 Tanning/dyeing extract; tannins & 1.4 131993.3 703113.3 2.8% 43 Furskins and artificial fur 1.4 142.393 9535.11 9.4% 21 Miscellaneous edible preparations. 1.4 120562.8 373104.6 12.4% 73 Articles of iron or steel. 1.4 440884.5 2306699 4.4% 68 Art of stone, plaster, cement, asbe 1.4 42148.6 360542.6 25.0% 34 Soap, organic surface-active agents 1.4 103206.5 308409.9 13.5% 57 Carpets and other textile floor co 1.3 15568.04 147375.3 16.9% 80 Tin and articles thereof. 1.3 2137.461 16247.52 5.7%
23 Residues & waste from the food indu 1.3 57441.06 247023.7 4.0%
35 Albuminoidal subs; modified starche 1.3 26698.64 101547.8 2.8% 19 Prep.of cereal, flour, starch/milk; 1.3 79202.88 220265.4 18.1% 26 Ores, slag and ash. 1.3 9009.703 11245678 0.0% 74 Copper and articles thereof. 1.3 74230.75 1637381 3.2% 7 Edible vegetables and certain roots 1.3 94414.25 319976.4 10.6% 94 Furniture; bedding, mattress, matt 1.2 162218.7 3231783 0.4% 40 Rubber and articles thereof. 1.2 301145.7 1396235 9.2% 29 Organic chemicals. 1.2 189172.3 2829316 1.5% 12 Oil seed, oleagi fruits; miscell gr 1.2 49166.19 416678.8 6.8%

42
5 Products of animal origin, nes or 1.1 4440.497 64524.3 0.0% 61 Art of apparel & clothing access, 1.1 50903.27 1011818 11.7%
59 Impregnated, coated, cover/laminate 1.1 34071.23 102272.4 26.7%
82 Tool, implement, cutlery, spoon & f 1.0 67934.97 400753.2 0.0% 13 Lac; gums, resins & other vegetable 1.0 6742.248 26166.86 5.6% 84 Nuclear reactors, boilers, mchy & m 1.0 1648613 13184757 0.0% 4 Dairy prod; birds' eggs; natural ho 0.9 108823 298934.1 20.3% 87 Vehicles o/t railw/tramw roll-stock 0.9 1249615 15159873 12.1% 14 Vegetable plaiting materials; veget 0.9 954.308 10156.8 1.3% 69 Ceramic products. 0.9 77499.05 235396.6 17.5% 49 Printed books, newspapers, pictures 0.9 210342 475518.5 0.0% 83 Miscellaneous articles of base meta 0.9 63880.57 232543.2 0.0% 2 Meat and edible meat offal 0.9 35894.88 474550 17.3% 75 Nickel and articles thereof. 0.9 603.215 873281.9 13.8% 27 Mineral fuels, oils & product of th 0.9 2071307 19939099 3.6% 45 Cork and articles of cork. 0.9 516.051 10535.82 0.0% 64 Footwear, gaiters and the like; par 0.8 62279.35 214504.2 36.3% 67 Prepr feathers & down; arti flower; 0.8 1646.785 14785.46 20.0% 95 Toys, games & sports requisites; pa 0.8 20948.44 108721.8 0.0% 11 Prod.mill.indust; malt; starches; 0.8 107974.9 213150.7 5.8% 62 Art of apparel & clothing access, n 0.8 76474.77 1121149 17.3%
37 Photographic or cinematographic goo 0.8 27023.47 83336.19 5.4%
70 Glass and glassware. 0.8 63609.44 476085.4 5.6% 85 Electrical mchy equip parts thereof 0.8 841007.9 4666057 0.0% 25 Salt; sulphur; earth & ston; plaste 0.7 145555.9 2320052 1.0% 90 Optical, photo, cine, meas, checkin 0.7 160012.1 881797.6 0.4% 92 Musical instruments; parts and acce 0.7 1781.843 6948.057 0.0%
24 Tobacco and manufactured tobacco su 0.6 39436.1 303952.6 27.9%
66 Umbrellas, walking-sticks, seat-sti 0.6 2564.619 48408.82 22.6% 46 Manufactures of straw, esparto/othe 0.6 637.769 11647.47 8.0% 15 Animal/veg fats & oils & their clea 0.6 232296.8 406851.4 7.4% 10 Cereals 0.6 436922.6 798312.7 0.5% 71 Natural/cultured pearls, prec stone 0.6 41387.39 57792184 8.6%
56 Wadding, felt & nonwoven; yarns; tw 0.5 14142.27 114721.9 15.5%
51 Wool, fine/coarse animal hair, hors 0.5 19294.59 1128382 4.3% 30 Pharmaceutical products. 0.5 195746.6 664763.4 0.6% 89 Ships, boats and floating structure 0.5 5505.175 426697.5 6.1%
96 Miscellaneous manufactured articles 0.5 28082.93 99257.82 0.0%
6 Live tree & other plant; bulb, root 0.5 4366.878 309982.6 8.3% 9 Coffee, tea, matn and spices. 0.5 28652.75 358491.4 3.1% 52 Cotton. 0.5 141274.8 517699.2 0.0% 88 Aircraft, spacecraft, and parts the 0.4 98277.52 419055.1 2.6% 42 Articles of leather; saddlery/harne 0.4 9798.384 153665 25.2% 55 Man-made staple fibres. 0.4 61846.65 233291 3.0% 54 Man-made filaments. 0.4 31553.97 518186.9 18.2% 97 Works of art, collectors' pieces an 0.4 941.009 102661.6 11.8% 63 Other made up textile articles; set 0.3 56526.81 227155.3 37.0%

43
41 Raw hides and skins (other than fu 0.3 1526.193 1243633 3.9% 53 Other vegetable textile fibres; pap 0.3 1437.534 20951.25 8.1% 3 Fish & crustacean, mollusc & other 0.3 29518.73 2763161 2.3%
91 Clocks and watches and parts thereo 0.3 5055.138 17985.84 12.0%
58 Special woven fab; tufted tex fab; 0.2 11068.03 111714.9 14.6% 60 Knitted or crocheted fabrics. 0.1 8241.599 54753.06 17.1% 50 Silk. 0.1 558.958 1667.674 7.7%
93 Arms and ammunition; parts and acc 0.1 2432.145 242993.9 2.2%
Source TIPS and COMESA data base and own calculations Table B: Revealed trade barriers for COMESA exports to South Africa (1999-2004) COMESA's COMESA's Unweighted
Product Product Name RTB Index Exports to Exports to Average
South Africa the World Tariff
24 Tobacco and manufactured tobacco su 29.7 201,261 5,631,553 27.9%
52 Cotton. 27.8 425,638 4,253,364 0.0%26 Ores, slag and ash. 25.5 425,427 1,530,742 0.0%74 Copper and articles thereof. 23.7 148,322 2,427,395 3.2%
9 Coffee, tea, matn and spices. 17.5 102,768 7,490,742 3.1%12 Oil seed, oleagi fruits; miscell gr 13.2 54,411 1,575,835 6.8%
6 Live tree & other plant; bulb, root 10.3 5,503 2,119,035 8.3%79 Zinc and articles thereof. 9.5 9,366 15,093 0.0%17 Sugars and sugar confectionery. 8.0 35,864 3,522,583 10.5%62 Art of apparel & clothing access, n 7.8 98,211 6,526,971 17.3%61 Art of apparel & clothing access, 7.6 60,917 7,631,967 11.7%75 Nickel and articles thereof. 6.3 72,903 791,124 13.8%44 Wood and articles of wood; wood ch 6.3 101,531 539,509 10.7%
7 Edible vegetables and certain roots 4.7 16,091 2,521,153 10.6%63 Other made up textile articles; set 4.5 21,759 888,425 37.0%
8 Edible fruit and nuts; peel of citr 4.2 11,059 1,671,664 7.4%25 Salt; sulphur; earth & ston; plaste 4.2 32,832 2,262,840 1.0%14 Vegetable plaiting materials; veget 3.8 1,057 67,067 1.3%68 Art of stone, plaster, cement, asbe 3.0 22,380 174,471 25.0%89 Ships, boats and floating structure 2.9 9,769 95,580 6.1%53 Other vegetable textile fibres; pap 2.8 2,970 248,791 8.1%16 Prep of meat, fish or crustaceans, 2.8 9,868 1,728,429 10.4%80 Tin and articles thereof. 2.8 5,469 7,797 5.7%94 Furniture; bedding, mattress, matt 2.7 47,556 580,006 0.4%23 Residues & waste from the food indu 2.6 33,188 255,850 4.0%
1 Live animals 2.4 1,701 536,727 0.0%81 Other base metals; cermets; article 2.3 6,067 1,197,898 1.8%
2 Meat and edible meat offal 2.2 16,702 297,387 17.3%41 Raw hides and skins (other than fu 2.1 19,825 1,441,066 3.9%42 Articles of leather; saddlery/harne 2.0 12,363 72,081 25.2%72 Iron and steel. 1.9 54,086 4,135,736 7.7%46 Manufactures of straw, esparto/othe 1.8 743 58,386 8.0%86 Railw/tramw locom, rolling-stock & 1.7 3,006 9,473 9.8%97 Works of art, collectors' pieces an 1.7 2,467 192,825 11.8%76 Aluminium and articles thereof. 1.6 15,424 1,313,794 6.7%

44
20 Prep of vegetable, fruit, nuts or o 1.6 4,705 792,949 16.3%19 Prep.of cereal, flour, starch/milk; 1.4 4,979 79,207 18.1%73 Articles of iron or steel. 1.3 49,698 474,236 4.4%57 Carpets and other textile floor co 1.1 2,725 759,168 16.9%51 Wool, fine/coarse animal hair, hors 1.0 1,959 47,689 4.3%31 Fertilisers. 0.9 8,052 1,501,126 0.0%70 Glass and glassware. 0.8 9,245 276,482 5.6%27 Mineral fuels, oils & product of th 0.8 427,078 ######## 3.6%78 Lead and articles thereof. 0.8 872 21,488 5.1%64 Footwear, gaiters and the like; par 0.8 16,590 137,464 36.3%56 Wadding, felt & nonwoven; yarns; tw 0.7 2,481 77,891 15.5%43 Furskins and artificial fur; manuf 0.7 11 2,842 9.4%34 Soap, organic surface-active agents 0.6 5,512 278,016 13.5%
4 Dairy prod; birds' eggs; natural ho 0.6 2,403 152,763 20.3%21 Miscellaneous edible preparations. 0.6 3,914 792,884 12.4%
3 Fish & crustacean, mollusc & other 0.5 1,981 2,955,055 2.3%49 Printed books, newspapers, pictures 0.4 6,235 182,604 0.0%48 Paper & paperboard; art of paper pu 0.4 16,401 464,401 16.7%82 Tool, implement, cutlery, spoon & f 0.4 6,232 95,500 0.0%60 Knitted or crocheted fabrics. 0.4 2,308 50,420 17.1%10 Cereals 0.4 9,884 853,286 0.5%69 Ceramic products. 0.4 7,414 351,487 17.5%13 Lac; gums, resins & other vegetable 0.3 584 396,897 5.6%88 Aircraft, spacecraft, and parts the 0.3 38,753 322,336 2.6%40 Rubber and articles thereof. 0.3 12,359 234,615 9.2%11 Prod.mill.indust; malt; starches; 0.3 816 153,151 5.8%96 Miscellaneous manufactured articles 0.3 2,217 111,847 0.0%28 Inorgn chem; compds of prec mtl, r 0.3 14,344 981,048 0.9%36 Explosives; pyrotechnic prod; match 0.2 373 26,645 3.1%71 Natural/cultured pearls, prec stone 0.2 9,678 7,989,170 8.6%85 Electrical mchy equip parts thereof 0.2 60,121 1,048,200 0.0%84 Nuclear reactors, boilers, mchy & m 0.2 77,720 1,789,093 0.0%29 Organic chemicals. 0.2 9,714 1,472,409 1.5%30 Pharmaceutical products. 0.1 10,223 467,530 0.6%58 Special woven fab; tufted tex fab; 0.1 330 25,274 14.6%22 Beverages, spirits and vinegar. 0.1 1,817 142,810 17.0%55 Man-made staple fibres. 0.1 1,585 170,548 3.0%47 Pulp of wood/of other fibrous cellu 0.1 438 159,928 0.0%15 Animal/veg fats & oils & their clea 0.1 3,153 240,097 7.4%90 Optical, photo, cine, meas, checkin 0.1 13,012 482,908 0.4%
91 Clocks and watches and parts thereo 0.1 476 161,221 12.0%
33 Essential oils & resinoids; perf, 0.1 1,990 521,126 9.3%5 Products of animal origin, nes or 0.1 328 156,963 0.0%
83 Miscellaneous articles of base meta 0.1 917 54,385 0.0%39 Plastics and articles thereof. 0.1 8,929 1,129,308 8.2%87 Vehicles o/t railw/tramw roll-stock 0.1 16,995 354,663 12.1%32 Tanning/dyeing extract; tannins & 0.1 2,374 117,752 2.8%50 Silk. 0.1 38 1,436 7.7%38 Miscellaneous chemical products. 0.1 4,163 204,719 2.9%45 Cork and articles of cork. 0.1 139 910 0.0%65 Headgear and parts thereof. 0.1 84 22,193 25.1%35 Albuminoidal subs; modified starche 0.1 468 22,134 2.8%18 Cocoa and cocoa preparations. 0.1 191 99,448 9.3%
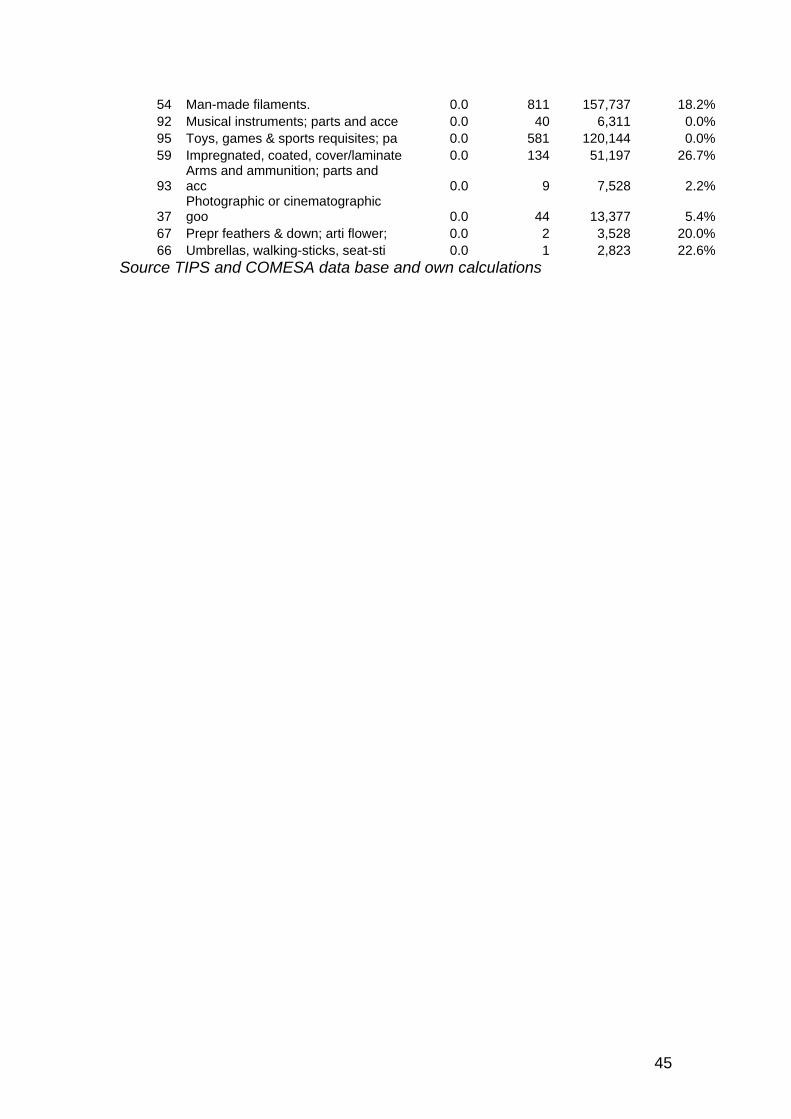
45
54 Man-made filaments. 0.0 811 157,737 18.2%92 Musical instruments; parts and acce 0.0 40 6,311 0.0%95 Toys, games & sports requisites; pa 0.0 581 120,144 0.0%59 Impregnated, coated, cover/laminate 0.0 134 51,197 26.7%
93 Arms and ammunition; parts and acc 0.0 9 7,528 2.2%
37 Photographic or cinematographic goo 0.0 44 13,377 5.4%
67 Prepr feathers & down; arti flower; 0.0 2 3,528 20.0%66 Umbrellas, walking-sticks, seat-sti 0.0 1 2,823 22.6%
Source TIPS and COMESA data base and own calculations

46
Appendix 4 COMESA Market Access Gains into SA US$ 000’s per year 2004 imports
% of Total Product Product Name Market
Market Access Gains 000s US$
Access Gains
52 Live animals 43097 35.6%27 Meat 18756 15.5%24 Fish 10418 8.6%62 Dairy prods; birds eggs; honey; 7777 6.4%74 Products of animal origin 6021 5.0%61 Live trees, plants, cut flowers 5810 4.8%44 Edible vegetables 3865 3.2%17 Edible fruit & nuts 2782 2.3%94 Coffee, tea, mate & spices 2421 2.0%85 Cereals 1676 1.4%73 Milling products; malt; starch; inulin; wht gluten 1468 1.2%
9 Oil seeds etc 1406 1.2%12 Gums & resins 1394 1.2%42 Vegetable plaiting materials 1160 1.0%72 Animal or vegetable fats 985 0.8%64 Edible preps of meat, fish 905 0.7%16 Sugars and sugar confectionary 800 0.7%84 Cocoa and cocoa preparations 742 0.6%
7 Prep cereal, flour 717 0.6%40 Prep vegetables, fruit, nuts 700 0.6%87 Misc. edible preparations 579 0.5%57 Beverages & spirits 564 0.5%
48 Food industry residues & waste; prep animal feed 533 0.4%
39 Tobacco 487 0.4%60 Salt; sulphur; stone; & cement 456 0.4%19 Ores, slag and ash 440 0.4%20 Mineral fuels & oils 417 0.3%23 Inorganic chemicals 381 0.3%68 Organic chemicals 348 0.3%76 Pharmaceutical products 344 0.3%
8 Fertilizers 327 0.3%41 Tanning & dye extracts 293 0.2%
70 Essential oils etc; perfumery, cosmetic etc preps 285 0.2%
34 Soap and waxes 272 0.2%63 Albuminoidal subst; starch; glue; enzymes 267 0.2%
4 Explosives 258 0.2%6 Photographic or cinematographic goods 175 0.1%
69 Misc. chemical products 174 0.1%71 Plastics and articles thereof 157 0.1%21 Rubber and articles thereof 146 0.1%56 Raw hides, skinsand leather 121 0.1%15 Leather art; saddlery 111 0.1%33 Wood and articles of wood 103 0.1%96 Basketware & wickerwrk 99 0.1%25 Wood pulp etc 84 0.1%51 Paper & paperboard 58 0.0%

47
38 Printed books, newspapers 57 0.0%55 Silk 53 0.0%22 Wool & animal hair 47 0.0%53 Cotton 46 0.0%54 Veg text fib 43 0.0%28 Manmade filaments 42 0.0%49 Manmade staple fibres 34 0.0%30 Wadding, felt etc; sp yarn; twine, ropes etc. 33 0.0%32 Carpets 33 0.0%29 Spec wov fabrics 32 0.0%89 Impregnated etc text fabrics 30 0.0%46 Knitted or crocheted fabrics 30 0.0%83 Apparel articles and accessories 29 0.0%
3 Apparel articles and accessories 28 0.0%2 Textile articles NESOI 27 0.0%
13 Footwear 24 0.0%82 Headgear and parts thereof 23 0.0%10 Umbrellas, walking-sticks, riding-crops 22 0.0%90 Prep feathers, down etc 20 0.0%58 Art of stone, plaster, cement, asbestos 12 0.0%18 Ceramic products 7 0.0%36 Glass and glassware 5 0.0%14 Precious Metals 4 0.0%59 Iron and steel 4 0.0%95 Articles of iron or steel 4 0.0%35 Copper and articles thereof 3 0.0%86 Aluminium 2 0.0%11 Lead 1 0.0%65 Zinc 1 0.0%66 Tin 0 0.0%43 Tools & cutlery 0 0.0%
1 Misc. articles of base metal 0 0.0%5 Machinery 0 0.0%
26 Electric machinery 0 0.0%31 Railway or tramway stock 0 0.0%37 Vehicles 0 0.0%47 Aircraft & spacecraft 0 0.0%50 Ships, boats and floating structures 0 0.0%67 Medical and scientific equip. 0 0.0%78 Clocks and watches 0 0.0%79 Musical instruments 0 0.0%80 Arms and ammunition 0 0.0%88 Furniture & bedding 0 0.0%91 Toys, games & sport equipment 0 0.0%92 Misc. manufactured articles 0 0.0%93 Art & antiques 0 0.0%97 Nickel and articles thereof 0 0.0%75 Base metals 0 0.0%81 Furskins and artificial fur 0 0.0%45 Cork and articles of cork 0 0.0%
121076 100.0%Source TIPS and COMESA data base and own calculations

48
Market Access Gains (MAG) for South Africa Exports into COMESA (US$,000s) 2004 MAG MAG %MAG %MAG Product Product Name Low High Low High
27 Mineral fuels, oils & product of th 67,341 98,735 11.2% 11.3%72 Iron and steel. 59,714 85,815 10.0% 9.8%39 Plastics and articles thereof. 45,241 65,727 7.5% 7.5%73 Articles of iron or steel. 28,163 41,081 4.7% 4.7%87 Vehicles o/t railw/tramw roll-stock 27,957 42,729 4.7% 4.9%48 Paper & paperboard; art of paper pu 27,633 40,063 4.6% 4.6%85 Electrical mchy equip parts thereof 24,274 37,168 4.0% 4.2%38 Miscellaneous chemical products. 17,667 25,506 2.9% 2.9%40 Rubber and articles thereof. 15,983 23,476 2.7% 2.7%15 Animal/veg fats & oils & their clea 15,180 22,046 2.5% 2.5%30 Pharmaceutical products. 13,799 19,863 2.3% 2.3%17 Sugars and sugar confectionery. 13,009 18,862 2.2% 2.2%81 Other base metals; cermets; article 12,746 18,926 2.1% 2.2%31 Fertilisers. 12,451 17,979 2.1% 2.1%49 Printed books, newspapers, pictures 12,258 17,512 2.0% 2.0%74 Copper and articles thereof. 10,484 15,175 1.7% 1.7%28 Inorgn chem; compds of prec mtl, r 10,417 14,947 1.7% 1.7%36 Explosives; pyrotechnic prod; match 9,738 13,911 1.6% 1.6%10 Cereals 8,349 13,120 1.4% 1.5%94 Furniture; bedding, mattress, matt 8,057 11,588 1.3% 1.3%76 Aluminium and articles thereof. 7,646 11,184 1.3% 1.3%21 Miscellaneous edible preparations. 7,632 10,902 1.3% 1.2%19 Prep.of cereal, flour, starch/milk; 7,319 10,476 1.2% 1.2%29 Organic chemicals. 7,175 10,295 1.2% 1.2%32 Tanning/dyeing extract; tannins & 6,893 9,997 1.1% 1.1%33 Essential oils & resinoids; perf, 6,630 9,594 1.1% 1.1%22 Beverages, spirits and vinegar. 6,209 8,909 1.0% 1.0%24 Tobacco and manufactured tobacco su 6,204 9,171 1.0% 1.0%20 Prep of vegetable, fruit, nuts or o 5,962 8,517 1.0% 1.0%69 Ceramic products. 5,812 8,304 1.0% 0.9%34 Soap, organic surface-active agents 5,673 8,138 0.9% 0.9%82 Tool, implement, cutlery, spoon & f 5,105 7,328 0.9% 0.8%52 Cotton. 4,786 6,892 0.8% 0.8%83 Miscellaneous articles of base meta 4,738 6,817 0.8% 0.8%84 Nuclear reactors, boilers, mchy & m 4,040 6,443 0.7% 0.7%70 Glass and glassware. 3,998 5,815 0.7% 0.7%44 Wood and articles of wood; wood ch 3,965 5,814 0.7% 0.7%90 Optical, photo, cine, meas, checkin 3,951 6,065 0.7% 0.7%63 Other made up textile articles; set 3,922 5,620 0.7% 0.6%11 Prod.mill.indust; malt; starches; 3,562 5,111 0.6% 0.6%59 Impregnated, coated, cover/laminate 3,547 5,142 0.6% 0.6%88 Aircraft, spacecraft, and parts the 3,427 5,156 0.6% 0.6%62 Art of apparel & clothing access, n 3,278 4,686 0.5% 0.5%68 Art of stone, plaster, cement, asbe 2,892 4,145 0.5% 0.5%
4 Dairy prod; birds' eggs; natural ho 2,615 3,847 0.4% 0.4%64 Footwear, gaiters and the like; par 2,358 3,384 0.4% 0.4%37 Photographic or cinematographic goo 2,256 3,222 0.4% 0.4%79 Zinc and articles thereof. 2,177 3,171 0.4% 0.4%16 Prep of meat, fish or crustaceans, 1,767 2,528 0.3% 0.3%55 Man-made staple fibres. 1,756 2,530 0.3% 0.3%71 Natural/cultured pearls, prec stone 1,595 2,347 0.3% 0.3%

49
96 Miscellaneous manufactured articles 1,586 2,289 0.3% 0.3%9 Coffee, tea, matn and spices. 1,585 2,272 0.3% 0.3%
61 Art of apparel & clothing access, 1,560 2,230 0.3% 0.3%35 Albuminoidal subs; modified starche 1,526 2,214 0.3% 0.3%18 Cocoa and cocoa preparations. 1,399 2,038 0.2% 0.2%95 Toys, games & sports requisites; pa 1,312 1,889 0.2% 0.2%56 Wadding, felt & nonwoven; yarns; tw 1,034 1,495 0.2% 0.2%23 Residues & waste from the food indu 978 1,443 0.2% 0.2%54 Man-made filaments. 967 1,395 0.2% 0.2%
7 Edible vegetables and certain roots 928 1,372 0.2% 0.2%25 Salt; sulphur; earth & ston; plaste 883 1,334 0.1% 0.2%57 Carpets and other textile floor co 864 1,234 0.1% 0.1%78 Lead and articles thereof. 721 1,050 0.1% 0.1%47 Pulp of wood/of other fibrous cellu 688 994 0.1% 0.1%42 Articles of leather; saddlery/harne 544 777 0.1% 0.1%58 Special woven fab; tufted tex fab; 543 785 0.1% 0.1%51 Wool, fine/coarse animal hair, hors 453 663 0.1% 0.1%
3 Fish & crustacean, mollusc & other 396 601 0.1% 0.1%86 Railw/tramw locom, rolling-stock & 379 560 0.1% 0.1%65 Headgear and parts thereof. 313 450 0.1% 0.1%91 Clocks and watches and parts thereo 247 359 0.0% 0.0%93 Arms and ammunition; parts and acc 162 234 0.0% 0.0%60 Knitted or crocheted fabrics. 144 207 0.0% 0.0%
6 Live tree & other plant; bulb, root 117 177 0.0% 0.0%12 Oil seed, oleagi fruits; miscell gr 98 147 0.0% 0.0%66 Umbrellas, walking-sticks, seat-sti 98 141 0.0% 0.0%80 Tin and articles thereof. 91 133 0.0% 0.0%92 Musical instruments; parts and acce 83 120 0.0% 0.0%53 Other vegetable textile fibres; pap 77 113 0.0% 0.0%41 Raw hides and skins (other than fu 74 108 0.0% 0.0%
2 Meat and edible meat offal 58 87 0.0% 0.0%75 Nickel and articles thereof. 54 79 0.0% 0.0%89 Ships, boats and floating structure 51 78 0.0% 0.0%97 Works of art, collectors' pieces an 25 39 0.0% 0.0%46 Manufactures of straw, esparto/othe 24 34 0.0% 0.0%45 Cork and articles of cork. 20 29 0.0% 0.0%67 Prepr feathers & down; arti flower; 17 25 0.0% 0.0%50 Silk. 5 7 0.0% 0.0%43 Furskins and artificial fur; manuf 1 2 0.0% 0.0%
1 Live animals 0 0 0.0% 0.0%5 Products of animal origin, nes or 0 0 0.0% 0.0%8 Edible fruit and nuts; peel of citr 0 0 0.0% 0.0%
13 Lac; gums, resins & other vegetable 0 0 0.0% 0.0%14 Vegetable plaiting materials; veget 0 0 0.0% 0.0%26 Ores, slag and ash. 0 0 0.0% 0.0%
599,455 874,984 100.0% 100.0%Source TIPS and COMESA data base and own calculations