Climate Ready Boston: Municipal Vulnerability to Climate Change

Integrated Vulnerability Assessment
of Climate Change in the Arab Region
Ihab Jnad
The Arab Center for the Studies of Arid Zones and Dry Lands (ACSAD)
Methodology
• Definition of sectors and impacts
• Identification of indicators
• Data acquisition and quality check of the data
• Aggregation of the data and mapping
• Evaluation
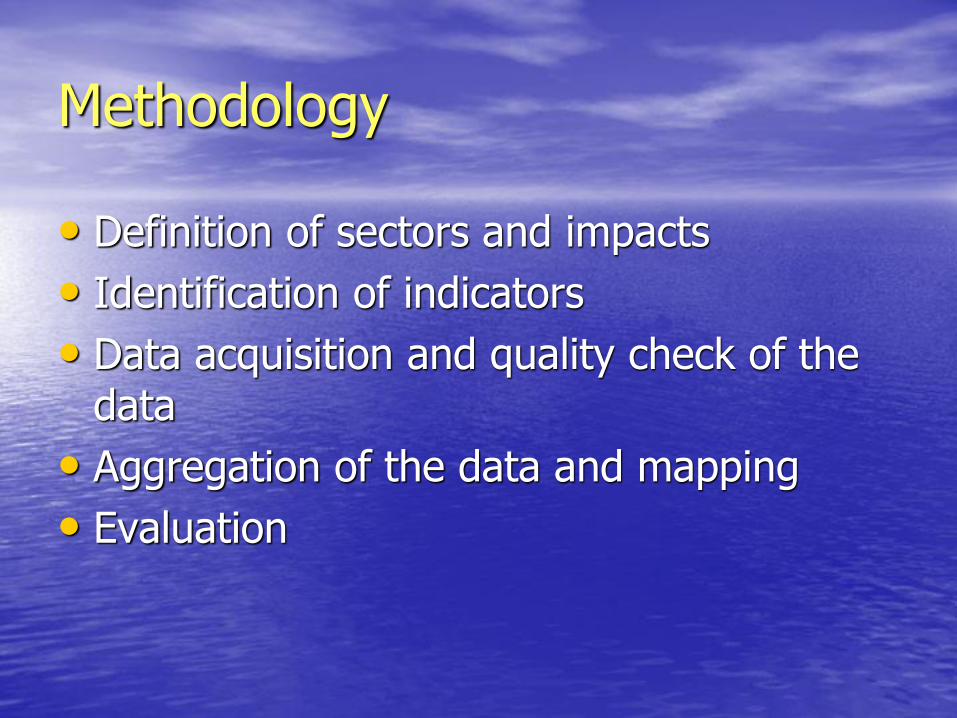
Sectors and potential climate change impacts

Components of the Vulnerability

Identifying and Selecting Indicators
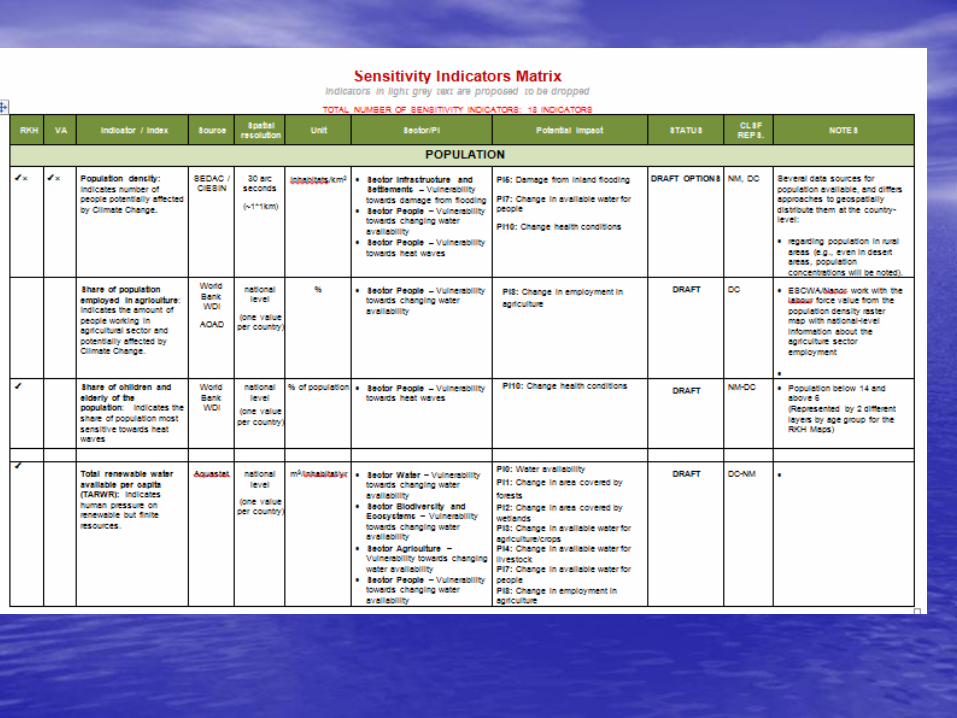


Identifying Data Sets to Quantify Indicators
• Once indicators are identified, sources which can quantify these indicators have to be selected.

• The data for exposure indicators were mainly developed as one output of RICCAR:
• For sensitivity indicators, data was mainly used from international organisations providing regional or global maps covering the Arab Domain as well as statistical data for all of the selected 21 countries in the Arab region.

Data collection and preperation
• Digital Soil Map of the World “ FAO-UNESCO : http://www.fao.org/geonetowrk /srv/en/metadata.show
• World bank : http://data.worldbank.org/indicator/EN.POP.DNST
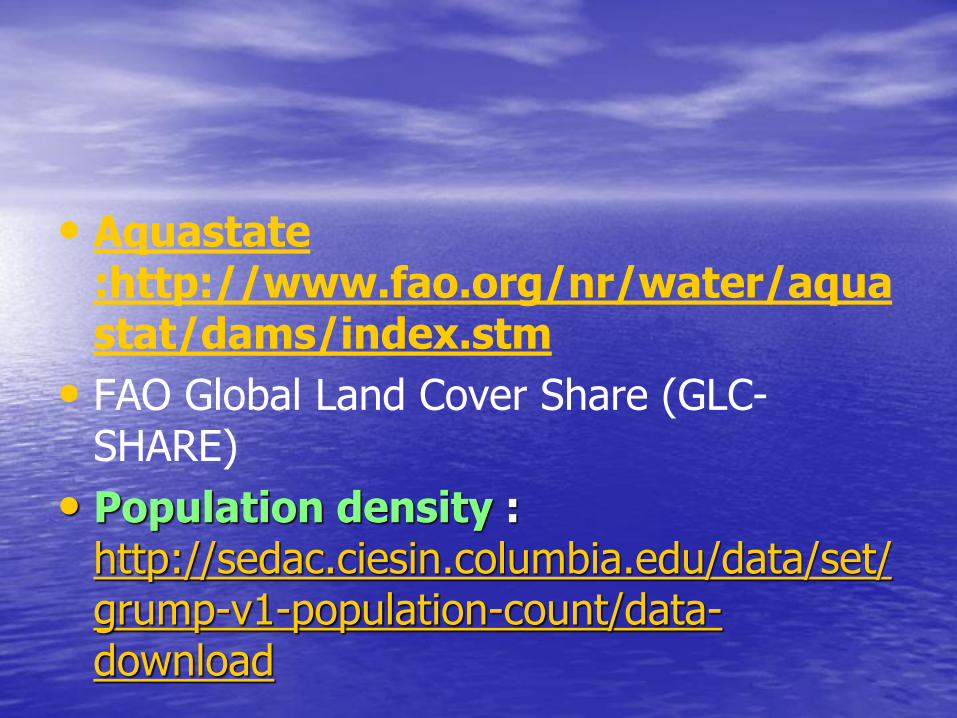
• Aquastate:http://www.fao.org/nr/water/aquastat/dams/index.stm
• FAO Global Land Cover Share (GLC-SHARE)
• Population density : http://sedac.ciesin.columbia.edu/data/set/grump-v1-population-count/data-download

• ACSAD :
– Degradation of vegetation cover
– Groundwater

• For adaptive capacity, statistics, for the most part from the United Nations system were used. The data is only available for the national scale,.
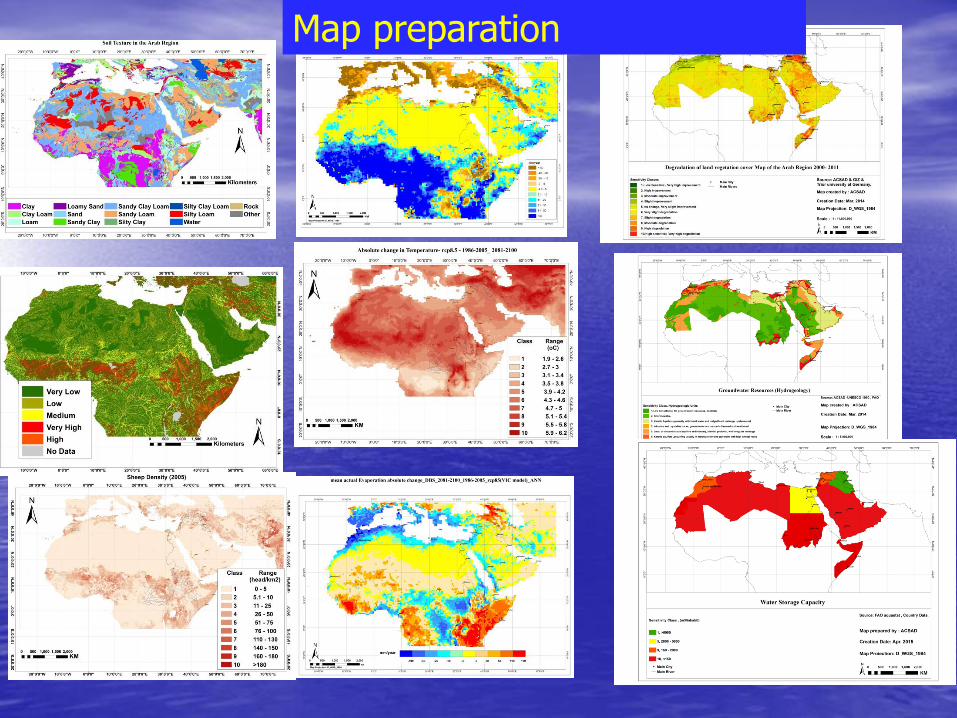
Map preparation

Population density

Normalisation and Evaluation of Data
• In order to aggregate these datasets into the course of the vulnerability assessment, the data first need to be transformed into a unit-less score on a common scale. This process is called normalisation

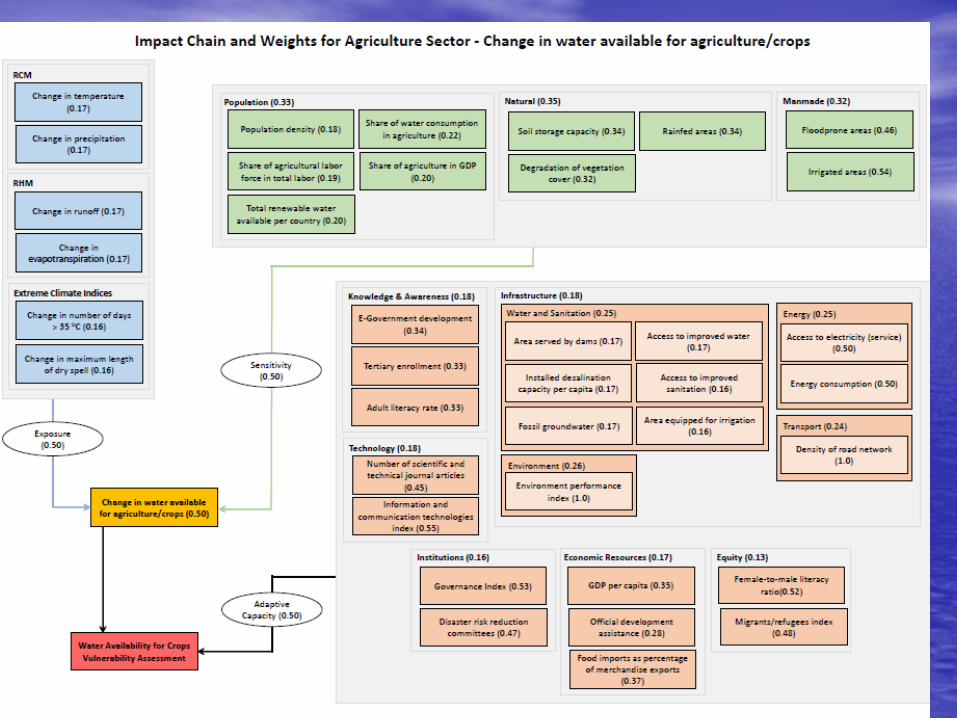
Indicator weighting

Aggregation
• Geometric aggregation approach was selected to aggregate individual indicators to a composite indicator.
CIExposure = (EX1 * EX2 * EX3 * … * EXn) 1/n

results

Water sector

Potential impact

Components of the Vulnerability

Vulnerability
Water Available for Crops

Potential impact
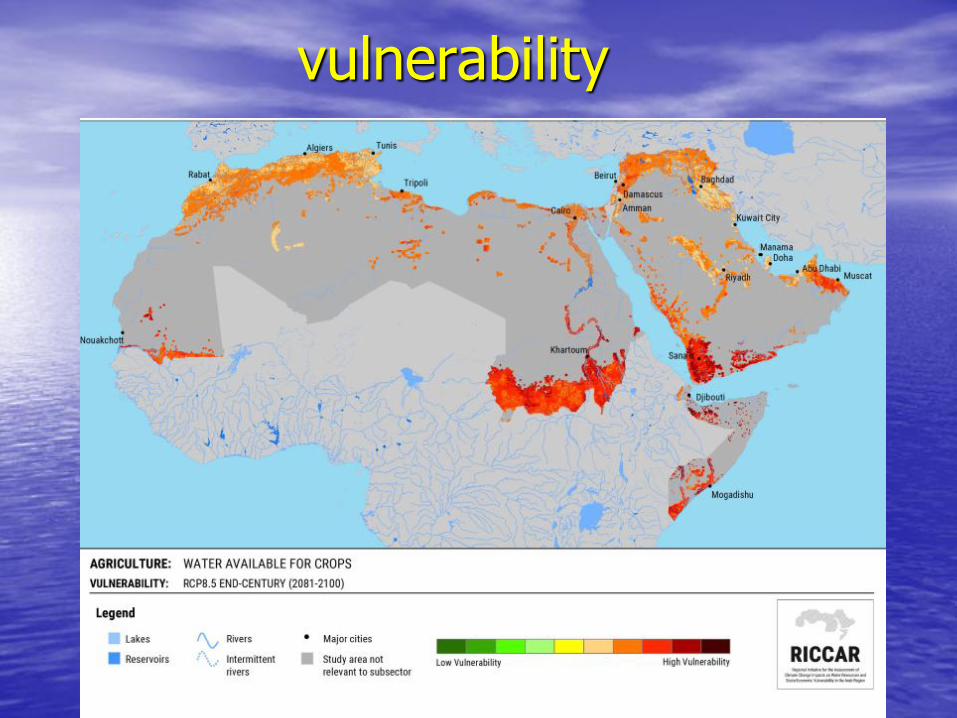
vulnerability

Inland flooding area

Potential impact
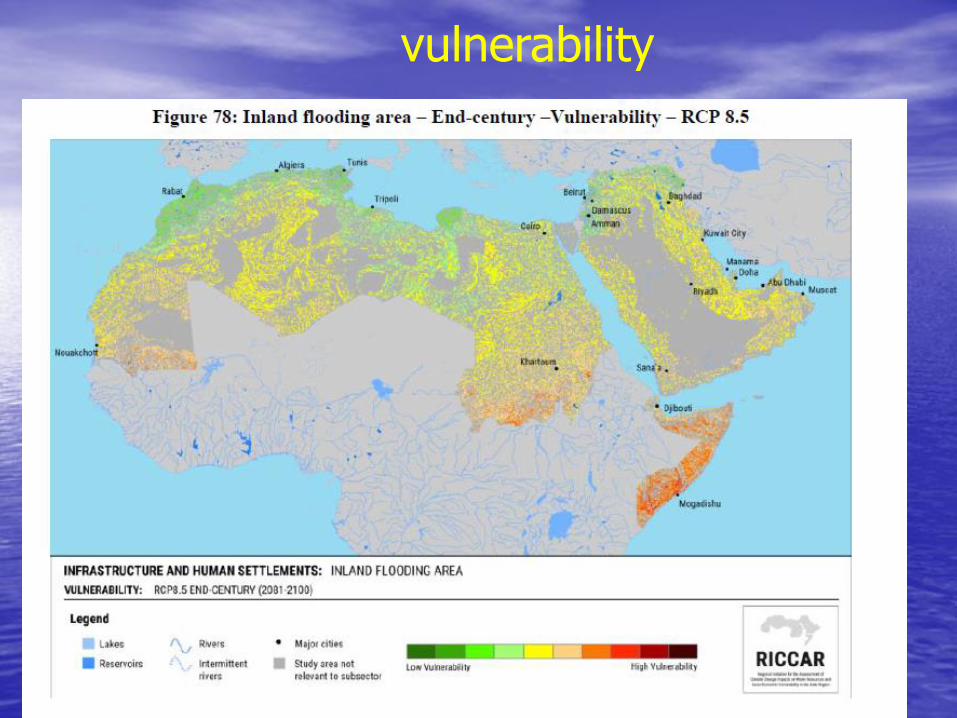
vulnerability

Key results
• Of the three components, adaptive capacity is most likely to influence vulnerability suggesting the ability of mankind is stronger than climate change and environmental stressors.
• Areas with the highest vulnerability, which have been defined as hotspots, generally occur in the Horn of Africa, the Sahel, and the southwestern Arabian Peninsula, irrespective of sector, subsector, or projected climate scenario.

Key results
• Areas with the lowest vulnerability relative to the region include the western Mediterranean, coastal Maghreb, and the coastal Levant due to increased adaptive capacity.
• The Euphrates and Tigris river basins, the lower Nile Basin, the central Mediterranean coast and the Gulf region are area exhibit moderate projected vulnerability due to high adaptive capacity.

Thanks