INTEGRATED REPORT - PBT Group
116
INTEGRATED REPORT
Transcript of INTEGRATED REPORT - PBT Group

INTEGRATEDREPORT

SC
OP
E A
ND
B
OU
ND
AR
Y The 2019 Integrated Report covers relevant aspects of all the operations of PBT Group, which includes the business of the Prescient Capital Proprietary Limited Group (Prescient Capital) for six months to 28 September 2018 and the activities of the PBT Group of companies. There has been no change in the scope and boundary of this report.
PBT Group successfully disposed of the Prescient Capital Group and the equity shares in Prescient Holdings Proprietary Limited on 28 September 2018. The details of these transactions were published by way of a Circular to PBT shareholders dated 23 March 2018 and a Supplementary Circular dated 28 August 2018. This disposal has had an effect on two major shareholders’ percentage shareholding in PBT Group, namely FISC Investment Management Proprietary Limited and Nimeemmi Close Corporation.
Furthermore, Nimeemmi Close Corporation sold 100% of their shareholding in PBT Group and is no longer a shareholder of the Group. Spalding Investments 10 Proprietary Limited (Spalding) and Poppy Ice Trading 23 Proprietary Limited (Poppy Ice) are two new major shareholders for the 2019 financial year. Spalding is a BEE company which is 100% owned by PBT staff. Please refer to note 17 in the annual financial statements for the transaction details. Poppy Ice is indirectly held by two Directors of PBT Group. Please refer to the Shareholder Profile for more details.
The information in this report has been selected to cater for the interests of providers of capital and other stakeholders who require a broad overview of the present and future direction and prospects of PBT Group – shareholders, funders, regulators, prospective employees, suppliers and community members, amongst others. Stakeholders with more in-depth needs are invited to contact PBT Group directly or visit the website at www.pbtgroup.co.za for further information.
Frameworks and assuranceThe reporting principles that have been applied in this report were guided by the International Financial Reporting Standards (IFRS), the King IV Report on Corporate Governance for South Africa, 2016 (King IV) requirements, the Global Reporting Initiative’s sustainability reporting guidelines and the Framework for Integrated Reporting. It also conforms to the statutory and reporting requirements of the South African Companies Act, Act 71 of 2008 (as amended) (Companies Act) and the Listings Requirements of the JSE Limited (Listings Requirements).
The PBT Group Board and its subcommittees have reviewed the report and have satisfied themselves of the materiality, accuracy and balance of disclosures in this report. In addition, external assurance was sought for aspects of our reporting from a variety of sources. This includes:
• Independent auditors BDO Cape Incorporated, for our financial statements.
• The Legal Verification Team Proprietary Limited has verified our Broad-Based Black Economic Empowerment (B-BBEE) scorecard rating.
Our Integrated Report is published annually and presents an overview of the activities, practices and progress of PBT Group Limited (PBT Group) for the 12-month period from 1 April 2018 through to 31 March 2019. The 2019 Integrated Report provides both financial and non-financial information for the period. The most recent previous report was the 2018 Integrated Report, which can be accessed via PBT Group’s website.
APPROVAL OF THE INTEGRATED REPORTThe Board acknowledges its responsibility to ensure the integrity of this report. The Directors confirm that they have collectively assessed the content of the Integrated Report and believe that it addresses the material issues and is a fair representation of the integrated performance of the Group. The Board has therefore approved the 2019 Integrated Report for publication.
On behalf of the Board
Pierre de Wet Tony TaylorChief Executive Officer Chairman
2 About us
3 Global footprint
4 Company profile
5 Business milestones
6 Shareholder profile
8 Letter to stakeholders
12 Directorate
14 Corporate governance
19 Enterprise risk management
20 Remuneration report
22 Sustainability report
24 Application of the King IV Principles
28 Report of the Audit and Risk Committee
30 Directors’ responsibilities and approval
31 Declaration by Company Secretary
32 Directors’ report
35 Independent auditor’s report
38 Statement of financial position
39 Statement of profit or loss and other comprehensive income
40 Statement of changes in equity
44 Statement of cash flows
45 Notes to the consolidated and separate financial statements
98 Segment report
102 Notice of Annual General Meeting and Form of Proxy
111 Glossary
112 General information
CO
NT
EN
TS P
BT
GR
OU
P •
INT
EG
RA
TE
D R
EP
OR
T 2
019
1

PBT Group provides data and analytics solutions and services that capitalise on data-driven insights, to make well-timed, intuitive business decisions that consistently position our clients ahead of the curve.
PBT Group takes ownership of clients’ challenges – transforming their data into tangible assets that greatly assist in streamlining operations as well as predictive and analytical capabilities.
Technological integration is a key enabler in providing clients with custom-made solutions or services in support of their organisational objectives. As a technology agnostic data specialist organisation, PBT Group is best positioned to optimise clients’ operations without allowing product or technology to limit their options.
AB
OU
T U
S
BI-Blue Consulting Pty Ltd100%
PBT Insurance Technologies Pty Ltd100%
CyberPro Consulting Pty Ltd51%
PBT Technology Services Ireland Ltd100%
PBT Technology Services Pty Ltd100%
PBT Group Europe BV100%
PBT Infosight Pty Ltd100%
PBT Technology Services (MEA) Pty Ltd100%
Stricklands Tetra Cape Pty Ltd100%
Technique Business Intelligence Software Pty Ltd70%
Stadia International BVI100%
PBT Group International BV100%
PBT Group (South Africa) Pty Ltd100%
PBT Group Australia Pty Ltd100%
OUR MISSIONTo ensure the long-term success of business clients through the effective organisation, interpretation and publishing of company intelligence.
OUR CLIENTSThe Group’s global client base includes prominent companies of high regard and extends to a variety of industries, including finance, insurance, telecommunications, retail and medical healthcare.
OUR VISIONTo be the preferred data and analytics solutions and services provider to our global client base through strong partnerships, innovation and domain expertise.
OUR VALUESIntegrity, quality, professionalism, accountability, teamwork, respect, ethics and trust.
2

GLO
BA
L
FO
OT
PR
INT
OUR LISTINGPBT Group is listed on the JSE under the Software and Computer Services Sector.
OPERATIONSEnglandIrelandthe Netherlands
OFFICESDublinUtrecht
OUR COMMITMENTPBT Group recognises the importance of transformation and the creation of sustainable BEE in the South African business landscape, consistently striving to meet and improve on guidelines related to social responsibility and empowerment.
OPERATIONSAustralia
OFFICESMelbourne
OUR LOCATIONPBT Group has offices in Cape Town, Johannesburg and Stellenbosch (South Africa), Melbourne (Australia), Dublin (Ireland) and Utrecht (the Netherlands).
OUR PEOPLEMore than 550 skilled consultants continuously deliver quality solutions and services in all of the Group’s operations and have over 4.6 million hours data and analytics experience.
OPERATIONSSouth Africa
OFFICESCape TownJohannesburgStellenbosch
PB
T G
RO
UP
• IN
TE
GR
AT
ED
RE
PO
RT
20
19
3

Established as an information management services company in 1998, PBT Group offers specialised consulting services to large national and international clients in South Africa, as well as Australia, the United Kingdom and Europe.
With extensive experience as data specialists, PBT Group is a recognised leader in this field, which includes data platform, data engineering, data analytics, data visualisation, application development, cloud solutions and strategic consulting.
PBT Group has a staff complement of more than 550 skilled and professional consultants and has established strategic alliances with recognised local and international vendors. Our consultants have a strong entrepreneurial culture and a sincere commitment to providing the highest levels of service and the most appropriate solutions to our clients.
PBT Group maintains a product-independent approach, enabling it to deliver real and sustainable value to clients who represent a variety of industries including banking, insurance, healthcare and telecommunications.
PBT Technology Services, the Group’s main operating unit, holds a strong partner network, enabling the use of the Group’s technology expertise to best support our clients’ specific business needs.
PBT Insurance Technologies (PBTit) is a provider of specialist healthcare management solutions and services, and its clients include numerous reputable medical aid schemes. Aimed at the medical aid and managed care sectors, PBTit incorporates a high level of flexibility, real-time claims processing, query capabilities, electronic data interchange, document management services, membership and contribution management, as well as advanced medical savings account management.
CO
MPA
NY
PR
OF
ILE PBT Group (Australia) provides specialist healthcare
management services, as well as business intelligence and information management services.
BI-Blue Consulting is a SAP business partner, offering a comprehensive set of business intelligence services, including data warehouse architecture, business analytics and information management to help clients harness their data with a view to improving decision-making. BI-Blue Consulting has expertise to deliver challenging reporting, query and analysis solutions using the SAP business user suite of products in SAP and non-SAP environments.
Technique Business Intelligence Software (TBIS) is a premier IBM business partner that provides IBM software solutions and consulting services, specialising in information integration, data warehousing and analytics. TBIS assists clients with integrating and managing key information across heterogeneous systems, to unlock business value by utilising data effectively. Its consultants have attained IBM technical mastery and solution specialist certifications in a range of disciplines, equipping them to provide services based on the IBM suite of business intelligence and data integration tools.
CyberPro Consulting is a leading Microsoft gold certified partner as well as an Oracle Java partner that develops line of business systems, mobile applications as well as web applications. Its expertise extends to system integration, database development and business intelligence solutions, with a service offering that spans the full software development life cycle, from business analysis, software architecture and development through to quality assurance and post-deployment support.
PBT Group Europe in the Netherlands offers an extension of the Group’s services to the European (including Ireland) and United Kingdom markets. In collaboration with specialised local partners, these subsidiaries complement the Group’s core data engineering expertise with Artificial Intelligence competencies, providing comprehensive services and solutions.
4

BU
SIN
ES
S
MIL
ES
TON
ES
1998 2006
2016 2017 2018
2008 2009
20102012
Founded as Prescient Business Technologies, a specialised information management company.
Rapid developments in the Company structure, together with the need to align operations with the Group’s vision of its future potential and acquisitions, lead to Prescient Business Technologies renaming itself to PBT Group.
PBT Group creates individual entities for its operating units due to its growth and in terms of its geographical dispersion. Through this, PBT Technology Services and PBT Technology Services (MEA) were established.
Prescient disposes of its financial services arm, renames to PBT Group and continues its listing on the main board of the JSE as a focused listed information management company.
Following the downscaling of the Africa and Middle East operations, PBT Group shifts its international focus to the United Kingdom and Europe, including Ireland. Through this, PBT Group Europe, with its head office in Utrecht, Netherlands, was established.
PBT Group acquires three specialist technology-focused companies: BI-Blue Consulting, a recognised leader in SAP Business Analytics and Enterprise Information Management, CyberPro Consulting, a leading Microsoft software services company, as well as Technique Business Intelligence Software, an IBM business partner and technical solutions authority.
Prescient listed on the JSE through a reverse listing via PBT Group, continuing to operate through its two main subsidiaries, Prescient Holdings (financial services) and PBT Group (information management services).
PBT Group (Australia) established in Melbourne.
PBT Group listed on the JSE, through a reverse listing via the Wooltru cash shell.
Strategic Medical Systems, a provider of specialist healthcare management solutions and services, renamed to PBT Insurance Technologies, to better reflect the wider application of its services and align itself with the PBT brand.
2019
PBT Group successfully exits the Middle East/Africa market.
5
PB
T G
RO
UP
• IN
TE
GR
AT
ED
RE
PO
RT
20
19

During the 2019 financial year, no new shares were issued. Total issued shares are 107 946 962 (2018: 1 399 062 917). At 28 September 2018 a share consolidation of its authorised and issued share capital of 1-for-10 was approved and was implemented during November 2018. The 2018 total issued share capital will have reduced from 1 399 062 917 to 139 906 292. For comparative purposes, the 2018 interests are amended to show the percentage after the 1-for-10 share consolidation. Please refer to note 15 Share capital for more information.
Distribution of shareholders
Number of shares heldNumber of
shareholders PercentageNumbers of shares Percentage
1 – 10 000 1 265 88.40 1 268 244 1.17
10 001 – 100 000 88 6.15 3 327 759 3.08
100 001 – 1 000 000 61 4.26 19 095 627 17.69
1 000 001 – 10 000 000 13 0.91 35 306 488 32.71
Greater than 10 000 000 4 0.28 48 948 844 45.35
1 431 100.00 107 946 962 100.00
Individuals 1 253 87.56 21 782 094 20.18
Nominees and trusts 77 5.38 5 742 793 5.32
Close corporations 10 0.70 20 234 026 18.74
Other corporate bodies 62 4.33 25 033 284 23.19
Banks 3 0.21 16 700 051 15.47
Insurance companies 3 0.21 55 022 0.05
Pension funds and medical aid schemes 5 0.35 1 843 593 1.71
Collective investment schemes and mutual funds
18 1.26 16 556 099 15.34
Total 1 431 100.00 107 946 962 100.00
Public and non-public shareholders
Number of shareholders
Number of shares
Percentage of total
issued shares
Shareholders holding greater than 10% of issued share capital
1 16 700 000 15.47
Directors 5 22 708 210 21.04
Non-public shareholder 1 10 373 282 9.61
Public shareholders 1 424 58 165 470 53.88
1 431 107 946 962 100.00
SH
AR
EH
OL
DE
R
PR
OF
ILE
6

Major shareholders
Ordinary shares
Percentage of total issued
share capital
The shareholders, other than Directors, who are directly or indirectly beneficially interested in 5% or more of the Group’s issued share capital at 31 March 2019 are as follows:
Clearstream Banking SA Luxembourg 16 700 000 15.47
Spalding Investments 10 Proprietary Limited 10 373 282 9.61
Seena Marina Financial Services Proprietary Limited 9 920 182 9.19
Rocklands Group Holdings Proprietary Limited 5 849 544 5.42
The shareholders, indirectly held by Directors, who are directly or indirectly beneficially interested in 5% or more of the Group’s issued share capital at 31 March 2019 are as follows:
Poppy Ice Trading 23 Proprietary Limited 11 000 000 10.19
FISC Investment Management 10 875 562 10.07
Directors’ holdingsThe Directors’ holdings at 31 March were as follows:
Direct number
of shares Percentage
Indirect number of
shares Percentage
2019
Tony Taylor 96 479 0.09 – –
Pierre de Wet – – 5 390 000 4.99
Murray Louw – – 367 611 0.34
Cheree Dyers 198 426 0.18 5 610 000 5.20
Herman Steyn 170 132 0.16 10 875 562 10.07
2018
Tony Taylor 96 479 0.07 – –
Murray Louw – – 367 611 0.26
Cheree Dyers 478 427 0.34 1 032 568 0.74
Herman Steyn 170 132 0.12 20 570 493 14.70
The Directors’ holdings that was included in the 2018 Integrated Report was based on the full issued share capital of 1 669 250 950 which included treasury shares of 270 188 033 (before the 1-for-10 share consolidation). In the 2019 Integrated Report it is amended to reflect net as a reduction of share capital the treasury shares and after the share consolidation of 1-for-10.
PB
T G
RO
UP
• IN
TE
GR
AT
ED
RE
PO
RT
20
19
7

LE
TT
ER
TO
S
TAK
EH
OL
DE
RS Business activities and Group
resultsDuring the period under review PBT Group disposed of Prescient Capital, which does not form part of the Group’s core operations. A Supplementary Circular was posted to shareholders on 28 August 2018 and the transaction was approved by shareholders at the General Meeting held on 28 September 2018.
The income and expenses associated with Prescient Capital are disclosed as a profit from discontinued operations in the audited consolidated statement of profit or loss and other comprehensive income (loss from discontinued operations for the comparative period).
The earnings per share and headline earnings per share have been reflected as a split between continuing and discontinued operations.
• Total profit after tax from continuing operations for the period was R33.7 million (March 2018: loss of R139.4 million).
• The profit before tax for continuing operations for the period was R50.8 million (March 2018: loss of R117.4 million).
• Headline earnings per share was 19.17 cents per share (March 2018: loss of 15.49 cents per share, post 1-for-10 share consolidation).
• Headline earnings per share for continuing operations was 18.18 cents per share (March 2018: loss of 13.5 cents per share, post 1-for-10 share consolidation).
• Headline earnings per share for discontinued operations was 0.99 cents per share (March 2018: loss of 1.99 cents per share, post 1-for-10 share consolidation).
• Earnings per share was 25.32 cents per share (March 2018: loss of 125.48 cents per share, post 1-for-10 share consolidation).
• Earnings per share for continuing operations was 17.97 cents per share (March 2018: loss of 97.28 cents per share, post 1-for-10 share consolidation).
• Earnings per share for discontinued operations was 7.35 cents per share (March 2018: loss of 28.20 cents per share, post 1-for-10 share consolidation).
On 2 November 2018 a 1-for-10 consolidation of the authorised and issued capital of PBT Group Limited became effective. The weighted average number of shares in issue for the 12 months ended 31 March 2019 was 124 063 076 (March 2018: 149 920 549 post 1-for-10 share consolidation).
PIERRE DE WETCHIEF EXECUTIVE OFFICER
TONY TAYLORINDEPENDENT NON-EXECUTIVE CHAIRMAN
8

South Africa and AustraliaDuring the period under review PBT Group successfully completed the exit of the Middle East/Africa (MEA) operations and no longer reports on it as a separate segment of the business. We are pleased to report that this highly risky exercise has been completed with minimal financial damage. In addition, our reputation as employer of choice remains intact as we succeeded to redeploy most of the affected staff to alternative clients.
Despite this disruption and MEA’s revenue decreasing from R80 958 224 to R41 132 560, consolidated revenue increased from R556 093 567 to R588 414 409. This confirms the underlying growth in demand for our services.
The operations in Australia remain subdued with revenue 10% lower than the 2018 financial year at AUD6 000 743.
We are pleased to report increased momentum in our expansion into the United Kingdom and Europe (including Ireland). A number of strategic partnerships have been formed, with satisfactory client engagements resulting therefrom.
Business modelSince PBT Group’s inception it has focused exclusively on the data management market and, as a result, it finds itself ideally positioned to maximise the current and future potential revenue from this sector.
Our view on this remains relevant and we are optimistic about our positioning within this industry sector. Our future prospect, as per the below, merely reflect some minor adjustments, yet very much aligned with the intended strategic direction.
PBT Group’s early decision to focus on data management was a calculated risk that was taken as a result of experience and the foresight that data management will consistently outperform the growth figures compared to the rest of the Information and Communication Technology (ICT) sector. The focused approach has resulted in PBT Group acquiring and retaining highly specialised skills in the professional services field of data. With more than 550 consultants, PBT Group has the capability to successfully service the end-to-end data management landscape.
The explosion in the volume of data created in organisations on a daily basis necessitates the extraction of information to remain competitive. We have been experiencing sustained and growing demand for our services in this field over a 20-year period and all indications are that
this trend will continue, especially demand in the financial services sector. Our application development services are also in high demand and are growing at a sustainable pace. The worldwide shortage of skills creates opportunities, but is also a constraint as access to these skills is limited. Our client base is of very high quality and is still expanding in a controlled manner.
PBT Group has a solid business strategy that allows for rapid change without compromising on the quality of the service that is delivered to its clients. The strategic objectives that underpin PBT Group’s ongoing success are:
Be technology agnosticIn a market of consolidation and technical overload, the decision to be technology agnostic has proven to be the right one. Not only does it ensure that PBT Group is trusted by its clients as an objective partner, but it also allows for the consultant adjustment of its technology focus based on what it views as the best of breed, without the pressure from technology vendors to stay loyal to a brand that might no longer be delivering on client expectations. At the same time, it also allows for successful exposure to all industries.
Specialise in data Connectivity is the number one reason for an explosion in data. It started off with the internet but has truly gained momentum with the introduction of social media, mobile and Internet of Things (loT) (millions of devices, from cars to fridges, are connected and continuously generate petabytes of data). Data has therefore become central to every single aspect of running a business, from recruitment to procurement, from finance to strategy to planning. Client engagement and retention is no longer possible without near real-time access to data. The ongoing evolvement of technology enables the harnessing of big data and significant progression in more advanced analytical techniques resulting in artificial intelligence (AI). AI, when applied effectively, in turn is transforming and disrupting many industries. However, at the heart of it all is data, and this will not change in the foreseeable future. PBT Group acquired the skills and has the experience to capitalise on this by successfully transforming data into business value for its clients. The latter forms a core component of our business, namely data engineering.
Worldwide expansionThe skills that PBT Group acquired and developed over the last two decades are of world-class standards. This presented an opportunity to compete internationally. PBT Group has been operating successfully and profitably in Australia since 2005 and established a fully-fledged operation in Melbourne in 2008. In the MEA region
PB
T G
RO
UP
• IN
TE
GR
AT
ED
RE
PO
RT
20
19
9

LETTER TO STAKEHOLDERS [CONTINUED]
PBT Group followed the MTN footprint across 22 countries. Although this unit is no longer a focus area for PBT Group, the use case of this venture reflects a unique and significant achievement and the associated experiences and learnings will remain an important intellectual asset. Technological advancement has paved the way for the exporting of our skills. During 2018 a small-scale operation was established in the United Kingdom, from where we will continue to expand our services in this market. Our offices based in Utrecht, Netherlands, also established in 2018, has since been strengthened significantly by the deployment of a strong pre-sales technical component supporting and enabling the opportunities mentioned below. From here we will continue to serve and expand on our European client base.
Big dataThe term big data originated from the accessibility to unstructured data, in an attempt to differentiate it from other/structured data. Big data is, however, becoming the norm rather than the exception and it might soon become “just data” again. A large component of PBT Group’s consulting base has been part of the industry that gave rise to the term big data. The telecommunication companies were the first to generate millions of records of data every second. The social media phenomenon opened the door for petabytes of unstructured data in the form of videos, pictures and text to be uploaded continuously. They were also the first to realise the potential of analysing this data. Connectivity is what defined big data. Being part of this process allowed PBT Group to gain valuable experience and is assisting greatly in all current big data initiatives.
Cloud With the advent of big data the move to cloud was inevitable. More and more data required scalable infrastructure which was not financially viable within a decentralised model. Cloud allows businesses to focus on core differentiators whilst being able to outsource standard components and availing infrastructure in a short period of time. PBT Group
has aligned itself with all the cloud players and is, at the same time, exploring providing analytics as a service in the cloud.
Business analyticsThe ultimate objective of obtaining, cleaning and structuring data is to analyse it in a way that provides actionable insight that can drive an increase in bottom line returns for companies. PBT Group has a solid understanding of this concept and has aligned itself with developing technologies in this space. These include, but are not limited to, advanced analytics, machine learning, cognitive computing, data lakes and geographical information systems.
Train and mentor potential candidatesPBT Group connected two components that are very specific to the South African market, namely skill shortage and empowerment, and devised a programme in 2004 that has seen hundreds of eager youngsters being skilled up and successfully deployed in the industry as business intelligence consultants and analysts. The success of this programme is unprecedented and the talent that has been uncovered has been tremendous. The programme has no equal in the market and the quality of the resulting skills are world-class.
Best-of-breed methodologiesEven though PBT Group has remained technology agnostic, it is constantly aligning itself with best-of-breed methodologies. PBT Group has established competency centres within the company that refine methodologies such as Ralph Kimball, third normal form, hybrid and agile continuously, to ensure that it remains relevant with new developments in the market.
PBT Group provides leadership in the data management space and has positioned itself well to meet, or even exceed, the growth potential that is projected for this sector. It has shown consistent growth through tough economic times, because it proactively adjusted its strategy to cater for challenges and to benefit from an extremely volatile market.
10

GovernancePBT Group remains committed to sound corporate governance principles, including integrity, transparency and accountability, and we subscribe to the Code of Corporate Practices and Conduct as set out in King IV.
DividendBiannually, the Directors consider the payment of a dividend, considering prevailing circumstances and future cash and capital requirements of the Group in order to determine the appropriate dividend in respect of a particular financial reporting period.
No dividend from normal commercial operations has been declared for the year ended 31 March 2019. However, we are optimistic that dividend payouts will resume from the next reporting cycle as a result of improved operating conditions.
AcknowledgementsWe would like to take this opportunity to sincerely thank our clients for their continuing support, our staff, management and our Board of Directors for their hard work and input to bring our business back to normality during the 2019 financial year.
Pierre de Wet Tony TaylorChief Executive Officer Chairman
PB
T G
RO
UP
• IN
TE
GR
AT
ED
RE
PO
RT
20
19
11

DIR
EC
TOR
AT
E PIERRE DE WETCHIEF EXECUTIVE OFFICERAge 57Appointed March 2017
Pierre de Wet started his career at Anglo American Corporation’s head office as a scholarship holder. When an opportunity arose at stockbroking firm Huysamer Stals, Pierre was lured away and spent the next three years at the JSE gaining valuable experience in both the equity and capital markets. In 1992, he joined District Securities Bank in the capital market division, trading and broking capital market instruments, before co-founding PBT Group in 1998.
During the reverse listing of PBT Group via the Wooltru cash shell in June 2010, Pierre was appointed as CEO of the listed entity. He held this position until August 2012 when Prescient Holdings listed on the JSE via a reverse listing into PBT Group. He remained CEO of PBT Group during this time. Pierre was again appointed as the CEO of PBT Group after Prescient Holdings was disposed of and the listed entity became PBT Group once more.
MURRAY LOUWFINANCIAL DIRECTORAge 74Appointed March 2004
Murray is a merchant banker with extensive corporate finance experience both locally and abroad. He was elected to the Board of PBT Group in March 2004 (then Wooltru) and appointed Non-Executive Chairman on 13 December 2012. During 2017 his role changed to Financial Director of PBT Group. Murray is also a Non-Executive Director of Trematon Capital Investments.
TONY TAYLORINDEPENDENT NON-EXECUTIVE CHAIRMANAge 72Appointed March 2017
Tony graduated in 1967 with a BA in Social Anthropology at the University of Witwatersrand. He started his career at Edgars in 1968 and held management and Director positions at several major retail companies up to 2009. Since 2009 Tony is an Executive of Pepkor Retail and is also a Non-Executive Director of Truworths.
12

CHEREE DYERSINDEPENDENT NON-EXECUTIVE DIRECTORAge 45Appointed March 2017
Cheree holds a Bachelor of Business Science (Marketing) and a Bachelor of Commerce from the University of Cape Town. She is a CA (SA) and a CFA Charter holder. Following the completion of her articles at KPMG, Cheree joined the Prescient Group in 2005 where she has held various leadership positions. Currently she is the CEO of Prescient Investment Management. Cheree has vast experience in the financial industry and brings a wealth of business acumen to the Board and its audit and governance structures.
ARTHUR WINKLERINDEPENDENT NON-EXECUTIVE DIRECTORAge 42Appointed May 2017
Arthur qualified as a Chartered Accountant, having graduated from the University of Cape Town. He completed his articles at Moores Rowland where he remained as an Audit Manager until joining Wooltru as Company Secretary. He joined the Trematon Group in 2008 where he currently fills the role of Executive Director and Chief Financial Officer of the Group.
HERMAN STEYNNON-EXECUTIVE DIRECTORAge 59Appointed December 2012
Herman has been involved in the investment management industry since 1985, having held senior management positions in several asset management companies. He began his career in investments after studying a BBusSc degree majoring in Actuarial Science, Statistics, and Economics at the University of Cape Town. Herman completed his BBusSc (Honours) in 1984 and in 1998 founded Prescient Investment Management. Herman was appointed as Director and CEO of Prescient in December 2012, in which position he remained until March 2017. Herman is the Executive Chairman of Prescient. He continues to serve on the PBT Group Board as Non-Executive Director.
There have been no changes to the Board during the period under review.
13
PB
T G
RO
UP
• IN
TE
GR
AT
ED
RE
PO
RT
20
19

The Group embraces sound corporate governance and the principles of integrity, transparency, fairness and accountability.
In doing so, PBT Group is committed to the Code of Corporate Governance Practices and Conduct as set out in King IV. The Directors understand that good governance within the Group can create a sustainable value and long-term equity performance for all stakeholders.
The Directors seek to identify and respond to risks, and to promote considered and swift decision-making to facilitate continuous improvement in operational and corporate business practices, underpinned by transparent communication with all stakeholders.
The purpose of this report is to assist stakeholders in evaluating the Group’s approach to corporate governance and compliance with King IV.
Board compositionThe Board was made up of six Directors at year-end, namely Pierre de Wet, Murray Louw, Herman Steyn, Tony Taylor, Cheree Dyers and Arthur Winkler. Of the six Directors, there are three Independent Non-Executive Directors, one Non-Executive Director and two Executive Directors. There were no appointments to or resignations from the Board during the financial year.
Tony Taylor , who is an Independent Non-Executive Director, is the Chairman of the Board. Pierre de Wet continues as the Group’s Chief Executive Officer. The responsibilities of the Chairman and CEO are separate.
The Board, together with the Remuneration and Nomination Committee, are responsible for identifying and nominating new Directors. The appointment process is conducted in a formal and transparent manner. In making new appointments the Committee and the Board take into account the blend of skills and experience, as well as social and business concerns such as B-BBEE.
The roles of Executive and Non-Executive Directors are separate to ensure that no Director can exercise unrestricted decision-making powers. The Chairman provides guidance to the Board, encouraging proper deliberation on all relevant matters while obtaining input from other Directors.
The Executive Directors are primarily responsible for implementing strategy and operational decisions while Non-Executive Directors contribute their independent and objective knowledge and experience to Board deliberations.
In compliance with the JSE Listings Requirements, the Audit and Risk Committee considers the expertise and experience of the Financial Director and confirms its satisfaction with his performance to shareholders annually.
The Directors hold office until the next Annual General Meeting (AGM) when one-third of Directors will retire or, being eligible, make themselves available for re-election by the shareholders. The Executive Directors will not be required to retire on a rotational basis. The Non-Executive Directors have no fixed term of appointment and no service contracts with PBT Group. Letters of appointment confirm the terms of their service.
The Board is comprised of four Non-Executive Directors with a broad diversity of skills and experience. The details of each Director are included on pages 12 and 13.
CO
RP
OR
AT
E
GO
VE
RN
AN
CE
14

Board functioningPBT Group’s Board meets at least four times a year. Meetings are convened by formal notice incorporating a detailed agenda supported by relevant written proposals and reports.
In addition, the Memorandum of Incorporation of the company provides for material decisions taken between meetings to be ratified by way of Directors’ Resolutions. Details of Directors’ attendance at Board and Committee meetings during the year are set out below:
DirectorMeetings attended
Meetings eligible for
Tony Taylor (Chairman) 5 5
Pierre de Wet 5 5
Murray Louw 5 5
Cheree Dyers 5 5
Herman Steyn 5 5
Arthur Winkler 5 5
Directors declare their interests in contracts and other appointments at all Board meetings.
The Company has an induction programme for all new employees and an open invitation is extended to the Non-Executive Directors to attend this programme. In addition, ongoing formal and informal training is provided to the Directors as is appropriate.
The Board members have direct access to the Company Secretary in relation to the affairs of the Group and are entitled to obtain independent professional advice regarding Group matters at the Group’s expense. All members of the Board are expected to contribute to ensuring that PBT Group maintains high standards of corporate governance.
The Board of Directors perform an annual assessment of their performance through a detailed peer review and assessment questionnaire, in order to assess the effectiveness of the Board and the Board members. The Board expressed that the outcome of this annual assessment was satisfactory.
Board CommitteesThe Board has delegated specific roles and responsibilities to various Committees. Presently there are three Committees within the Group: the Audit and Risk Committee, the Remuneration and Nomination Committee and the Social and Ethics Committee. The Board acknowledges that the delegation of its responsibilities does not reduce its accountability and, as such, the Board monitors and oversees the performance of all Committees.
Audit and Risk CommitteeCOMPOSITION OF THE COMMITTEEThe Audit and Risk Committee comprises three Independent Non-Executive Directors, which is consistent with King IV and as described in section 94 of the Companies Act.
The Committee is satisfied that the members thereof have the required knowledge and experience as set out in section 94(5) of the Companies Act of South Africa and Regulation 42 of the Companies Regulation, 2011. The reappointment of Committee members will be a matter for consideration by shareholders at the forthcoming AGM.
In terms of the JSE Listings Requirements, the Audit and Risk Committee must perform an annual evaluation of the finance function of the Group. During the current year the Committee is satisfied that the Financial Director and the finance function possess the appropriate expertise and experience to meet their responsibilities.
BDO Cape Incorporated (BDO Cape Inc) was appointed as the Group’s external auditor for the 2019 financial year. The Committee expressed its satisfaction that BDO Cape Inc is independent of the Group. BDO Cape Inc is accredited on the JSE’s list of auditors in terms of its Listings Requirements. Each year the Committee reviews the extent of non-audit services provided by the external auditors. The Committee has reviewed the performance of the external auditors and has nominated, for approval by shareholders at the forthcoming AGM, BDO Cape Inc as the external auditor for the 2020
Audit and Risk Committee
Remuneration and Nomination Committee
Social and Ethics Committee
PB
T G
RO
UP
• IN
TE
GR
AT
ED
RE
PO
RT
20
19
15

financial year, with Imtiaaz Hashim, a registered auditor and partner of BDO Cape Inc, as the designated auditor.
The Audit and Risk Committee report for the year ended 31 March 2019 is set out on pages 27 and 28.
Remuneration and Nomination CommitteeThe members of the Remuneration and Nomination Committee, which meets once during the year, are Cheree Dyers (Chairperson), Herman Steyn, Tony Taylor and Arthur Winkler. All four members of the Committee are Non-Executive Directors of the Company, the majority being independent. The primary responsibilities of this Committee include:
• Ensuring that the Group’s Chairman, Directors and Senior Executives are rewarded for their contributions in accordance with individual performance.
• Ensuring the retention of key personnel through benchmarking Executive remuneration against industry norms and taking individual and Group performance targets into account in determining Executive remuneration.
• Ensuring appropriate human resources strategies, policies and practices.
• Reviewing the composition and performance of the Board and its Committees.
• Overseeing the Board appointment process.
• Approving the remuneration of Directors and Senior Executives.
The Committee is satisfied that it has fulfilled its responsibilities during the financial year.
REMUNERATION AND NOMINATION COMMITTEE ATTENDANCE
DirectorMeetings attended
Meetings eligible for
Cheree Dyers 1 1
Herman Steyn 1 1
Tony Taylor 1 1
Arthur Winkler 1 1
Social and Ethics CommitteeThe members of the Social and Ethics Committee are Cheree Dyers, Elizna Read (Chairman) and Tony Taylor. Please see pages 12 and 13 for details on the qualifications and experience of Cheree Dyers and Tony Taylor. Elizna Read is the Chief Operating Officer of PBT Group. All members of the Committee are considered to be suitably qualified and experienced.
The responsibilities of the Committee are to monitor the Group’s activities, taking into account relevant legislation, other legal requirements or prevailing codes of best practice, with regard to:
• Social and economic development.
• Corporate citizenship.
• Environment, health and public safety.
• Relationship with all stakeholders.
• Labour and employment.
The Committee meets at least once a year to discuss relevant matters. The Committee Chairman brings any issues that the Committee believes relevant, to the attention of the Board at the next Board meeting.
The Committee is satisfied that it has fulfilled its responsibilities during the financial year.
SOCIAL AND ETHICS COMMITTEE ATTENDANCE
DirectorMeetings attended
Meetings eligible for
Cheree Dyers 1 1
Elizna Read 1 1
Tony Taylor 1 1
CORPORATE GOVERNANCE [CONTINUED]
16

Gender and race diversityIn terms of the JSE Listings Requirements the Board is required to have a policy on the promotion of gender and race diversity at Board level. A formal policy has been established and is available on our website (https://www.pbtgroup.co.za/corporate-governance/). The Board is supportive of the need for, and importance of, gender and race diversity and will be considering this when making new appointments to the Board. The approach to gender and race diversity adopted by the Board of the Company shall be as follows:
• Should a vacancy on the Board arise, or should there be a requirement for an additional Board appointment, consideration will be given to the gender and race of the Director/s so as to attain and maintain a level of gender and race diversity within the Board that is considered appropriate at the time, having due regard to the skills, expertise, experience and background required to fill any such Board position/s, the availability of suitable candidates, the development potential of candidates and to any additional requirements that may be necessary to ensure a mix of skills and experience on the Board and its Committees that will best serve the interests of the Company and its stakeholders.
• Application of the policy in effecting new or replacement appointments to the Board will be subject to the approval/ratification of the shareholders of the Company to such appointments at AGMs of the Company.
Company SecretaryBianca Pieters is the Company Secretary for PBT Group. In terms of the JSE Listings Requirements regulations 3.84(i) and 7.F.6(j), the Board of Directors must satisfy itself, on an annual basis, on the competence, qualifications and experience of the Company Secretary. The Board has satisfied itself on these criteria by confirming the Company Secretary’s qualifications and experience through verification with third parties. In terms of regulation 4.8(c) of the JSE Listings Requirements, the Company Secretary should maintain an arm’s length relationship with the Board of Directors and should ideally not be a Director. The Board is satisfied that an arm’s length relationship does exist between the Company Secretary and itself, thus addressing any possible conflict of interest and/or dilution of the Company Secretary’s independence.
Technology and information governanceThe Audit and Risk Committee is responsible for the governance of technology and information within the Group. The Board has approved an information technology (IT) policy which details the specific terms and conditions around the use of IT within the Group. This policy includes detail on information security to support confidentiality, integrity and availability of information to authorised personnel. The Board has delegated the implementation of this policy to management and it oversees the process.
IT risk management meetings are held by Senior Executives where IT strategies and risks are discussed. Significant IT risks together with manners in which to mitigate those risks are documented in a Group risk register.
Stakeholder communicationPBT Group strives in its communication with stakeholders, particularly the investment community, to present a balanced and easily understandable assessment of the Group’s position. In our financial reporting, formal announcements, media releases, annual meetings, presentations and dialogue with analysts and institutional shareholders, the objective is to provide clear and accurate information, disseminated as widely as possible.
PB
T G
RO
UP
• IN
TE
GR
AT
ED
RE
PO
RT
20
19
17

CORPORATE GOVERNANCE [CONTINUED]
Internal audit and internal controlThe Board and management are responsible for maintaining effective systems of internal control.
These are designed to provide reasonable assurance as to the integrity and reliability of the financial statements, to safeguard, verify and maintain accountability of the Group’s assets, and to detect and minimise significant fraud, potential liability, loss and material misstatement while complying with applicable statutory laws and regulations.
The Group strives to maintain internal controls that ensure financial reporting systems contain complete, accurate and reliable information, and safeguard the Group’s assets. The external auditors report to the shareholders and have ready access to the Chairman of the Audit and Risk Committee and the Directors.
PBT Group does not have a separate internal audit function as the Board does not consider this to be necessary based on the small size of the Group.
Nothing has come to the attention of the Directors to suggest that the accounting records and systems of internal control were not appropriate or satisfactory, neither has any material loss, exposure or misstatement arising from a material breakdown in the functioning of the systems of internal control or accounting been reported to the Directors in respect of the period under review.
Code of ethicsPBT Group’s human resources policy includes the parameters within which staff and Directors are expected to conduct themselves. The policy includes a code of ethics which forms the foundation for the values and ethics of the Group. The policy also incorporates the 10 principles contained within the United Nations Global Compact Principles. Staff and Directors are expected to:
• Conduct themselves in a professional manner.
• Abide by the strictest code of ethical behaviour.
• Maintain an absolute degree of client and corporate confidentiality.
• Ensure that their personal positions are never placed before those of a client.
• Encourage an environment that is productive, efficient and entrepreneurial.
• Facilitate teamwork amongst peers, ensuring that all staff are treated with dignity and respect.
ConclusionGovernance procedures are reviewed on a regular basis to align with any legislative and regulatory changes that arise. The Board is satisfied with the manner in which the recommendations of King IV have been implemented to achieve good corporate governance within the Group.
18

Risk philosophy and governancePBT Group is committed to its operations and innovation without compromising quality or assuming risk that is above what we are willing to accept.
Risk management plays a vital role in assisting PBT Group to understand the impacts and opportunities associated with achieving business priorities.
The Board is ultimately responsible for the governance of risk. The Audit and Risk Committee, as a subcommittee of the Board, assists the Board in carrying out these responsibilities by providing oversight of the adequacy of the risk management process.
Risk management is integral to promoting accountability and good governance. We are committed to embedding risk management into our business’ decision-making.
In creating shareholder value, the objectives of the risk management are as follows:
• Achieve the Group’s performance and profitability goals.
• Prevent loss of resources.
• Ensure effective reporting and compliance with relevant laws and regulations.
• Protect the Group’s reputation.
• Achieve our strategic objectives and effectively manage pitfalls and surprises along the way.
PBT Group’s vision for risk management is for decisions to be made based on an informed understanding of the risks involved and for risks to be managed within risk appetite and tolerance in the achievement of PBT Group’s objectives.
EN
TE
RP
RIS
E R
ISK
M
AN
AG
EM
EN
T PB
T G
RO
UP
• IN
TE
GR
AT
ED
RE
PO
RT
20
19
19

Background statementRemuneration governanceThe Remuneration and Nomination Committee comprises four members, all of whom are Non-Executive members. The members are Cheree Dyers (Chairman), Herman Steyn, Tony Taylor and Arthur Winkler. The Remuneration and Nomination Committee meets once a year.
To ensure that the policy of remuneration is implemented and adhered to the Remuneration and Nomination Committee is tasked with several responsibilities:
• Determine and approve the Group’s general remuneration policy, which is presented at each Annual General Meeting (AGM) for approval by the shareholders.
• Ensure the retention of key personnel through benchmarking Executive remuneration against industry norms and taking individual and Group performance targets into account in determining Executive remuneration.
• Appraise the performance of the Chief Executive Officer.
• Approve the appointment and promotion of key Executives.
• Approve the annual increase percentages.
• Undertake an annual assessment of the effectiveness of the Committee and to report the findings to the Board.
• Approve any changes to the remuneration structure of the Group.
• Approve the performance targets for any long-term incentive awards.
• Prepare an annual Remuneration Report for inclusion in the Group’s Integrated Report.
Due to the operational diversity of the Group and the number of employees across these units, the Committee has delegated the responsibility of allocating percentage increases of individual staff at a non-management level to the operational heads.
The Remuneration and Nomination Committee and the operational heads are fully supported through this process by the human resources function.
The Remuneration PolicyThe Remuneration Policy aims to follow the guidelines and recommendations of King IV and is based on the following principles:
• Remuneration practices are aligned with corporate strategy.
• Total rewards are set at levels that are competitive relative to the ICT industry.
• Incentive awards are earned through achieving performance measures and targets that ensure that they
The aim of remuneration at PBT Group is to reward staff for their contribution to long-term operating and financial performance of the Group. The overall philosophy is to ensure that the remuneration of employees is competitive and ensures that the Group attracts, motivates and retains individuals of the right calibre.
RE
MU
NE
RA
TIO
N
RE
PO
RT
20

are sustainable and are aligned to the well-being of all stakeholders over the short, medium and long term.
• Incentive plans, performance measures and targets are structured to operate effectively throughout the business cycle.
• The design of the incentive plans is prudent and does not expose stakeholders to a position where the Group is placed at risk.
Staff salaries are subject to an annual review which considers the Group’s performance, the performance of the individual, cost-of-living adjustments and changes in the scope of an employee’s role. Various industry surveys are utilised and employees are benchmarked against their respective industry peers to ensure that the remuneration levels are fair and competitive. Each employee is assessed in relation to a comprehensive peer review process that is conducted annually.
The Remuneration Policy and Implementation Report set out herein are proposed to shareholders in separate non-binding advisory votes in terms of the Notice of Annual General Meeting. In the event that either the Remuneration Policy or the Implementation Report, or both, are voted against by 25% or more of the votes exercised at the AGM, the Board of Directors will engage with such shareholders in order to clarify the nature of and evaluate the validity of such objections and will, where possible and prudent, given the objectives of the Remuneration Policy, take those objections into consideration when formulating any amendments to the Company’s Remuneration Policy and
Implementation Report in the following financial year.
Implementation ReportExecutive Directors’ remunerationThe remuneration paid to Executive Directors is set out in the table at the bottom of the page.
Non-Executive Directors’ remunerationThe Board, in reviewing Non-Executive Directors’ fees, makes recommendations to shareholders considering, firstly, fees payable to Non-Executive Directors of comparable companies and, secondly, the importance attached to the retention and attraction of high-calibre individuals as Non-Executive Directors. Remuneration is reviewed annually, with reference to surveys of Non-Executive Directors’ remuneration. This remuneration is not linked to the Company’s share price or performance. Levels of fees are also set by reference to the responsibilities assumed by the Non-Executive Directors in chairing the Board and in chairing or participation in its Committees. To avoid a conflict of interest, the Remuneration and Nomination Committee, which consists entirely of Independent Non-Executive Directors, takes no part in the determination of Non-Executive Directors’ fees or in the recommendation to the Board and shareholders. The Board annually recommends remuneration of Non-Executive Directors for approval by shareholders in advance.
The Non-Executive Directors’ fees for the year were as follows:
Emoluments
Rand 2019 2018
DirectorCheree Dyers 248 750 231 250
Herman Steyn 226 750 211 250
Tony Taylor 323 323 292 125
Arthur Winkler 243 250 207 500
Total 1 042 073 942 125
The Remuneration Committee met once during the 2019 financial year and conducted its affairs in compliance with the Remuneration Policy. The Committee is satisfied that the overall principles set out by King IV have been applied and that the Companies Act has been adhered to.
Executive Directors’ remuneration
Rand EmolumentsValue of contri-
butions paid BonusesFringe
benefits Total
Director2019Pierre de Wet 2 750 820 235 788 937 800 90 411 4 014 819
Murray Louw 735 000 9 135 – – 744 135
Total 3 485 820 244 923 937 800 90 411 4 758 954
2018Pierre de Wet 649 086 291 589 1 785 000 – 2 725 675
Murray Louw 455 000 6 037 – – 461 037
Total 1 104 086 297 626 1 785 000 – 3 186 712
PB
T G
RO
UP
• IN
TE
GR
AT
ED
RE
PO
RT
20
19
21

Broad-Based Black Economic Empowerment (B-BBEE)During the 2019 financial year emphasis was placed on improving PBT Group’s B-BBEE status. The Company previously held a level 2 rating, which was negatively impacted with the introduction of the ICT Amended Codes of Good Practice, resulting in an unsatisfactory level 6 B-BBEE rating during the 2018 financial year.
Focus was placed on skills development, where, in addition to PBT Group’s ongoing business intelligence (BI) internship programme, the Company invested in a recognised learnership for black people with disabilities. In addition, the Group funded a BEE company to acquire a 9.61% interest in the equity of PBT Group Limited. This was done in the open market and further improved the Group’s scorecard. Refer to note 17 in the annual financial statements for more information.
The PBT Group of companies now holds the following B-BBEE certifications:PBT Group (South Africa) Proprietary Limited* Level 4 ContributorTechnique Business Intelligence Software Proprietary Limited Level 2 ContributorCyberPro Consulting Proprietary Limited Level 3 Contributor
* Including subsidiaries PBT Technology Services Proprietary Limited, PBT Technology Services (MEA) Proprietary Limited and BI-Blue Consulting Proprietary Limited.
Employment equity and human resourcesThe profile of PBT Group’s workforce in terms of the Employment Equity Act is detailed below:
Male Female Foreign nationals
TotalOccupational level A C I W A C I W Male Female
Top management – 1 1 8 – – – 2 – – 12
Senior management – 1 – 5 1 – – 5 – – 12
Middle management 2 – 1 10 3 3 – 5 2 – 26
Skilled technical workers, junior management and supervisors
41 21 13 120 17 5 5 33 13 6 274
Semi-skilled and discretionary decision-making
4 2 2 3 7 3 – 15 – – 36
Unskilled 3 1 1 – 5 3 – – 1 1 15
Total permanent 50 26 18 146 33 14 5 60 16 7 375
Temporary employees – – – – – – – – – – –
Total 50 26 18 146 33 14 5 60 16 7 375
These figures exclude independent contractors.
SU
STA
INA
BIL
ITY
R
EP
OR
T22

Furthermore, based on the requirements of the Australian Government’s Racial Discrimination Act 1975, PBT Group (Australia)’s figures have been separately listed as follows:
Occupational level Total
Top management 3
Senior management 1
Middle management 2
Skilled technical workers, junior management and supervisors
15
Semi-skilled and discretionary decision-making
–
Unskilled –
Total permanent 21
Temporary employees 12
Total 33
Skills developmentPBT Group has a staff complement of more than 550 highly skilled and professional consultants who have worked in more than 25 countries worldwide. Our consultants have been exposed to various technologies and industries, and their wealth of experience has ensured the success of every client engagement. PBT Group is also committed to growing the available skills base and enhancing the quality of skills currently in the marketplace. This is being addressed through a specialised internship programme, which has allowed entry into a very competitive market for more than 160 BEE candidates to date. This programme was established in 2004 and is repeated annually.
Corporate social investment (CSI)PBT Group is a responsible corporate citizen, whereby the brand is involved in various CSI initiatives ranging from local soup kitchens, to the provision of IT equipment to schools in previously disadvantaged communities. During the 2019 financial year PBT Group’s main CSI beneficiary was the Hillsong Africa Foundation Innovation Hub in Gugulethu.
The Hillsong Africa Foundation Innovation HubThe Hillsong Africa Foundation (HAF) was founded in 2010 out of a desire to respond to the vast array of needs and challenges in South Africa. The Foundation’s vision is simple and clear: “Building lives that will build the nation.” On average, 1 800 lives are currently impacted weekly through 50 programmes run by 250 volunteers in nine regions across South Africa.
HAF has been actively involved in Gugulethu since 2010. HAF’s relationship with the community began with the donation of wheelchairs to differently-abled children at
Tembaletu School for Learners with Special Educational Needs, which resulted in building a dormitory for 42 of the most vulnerable students. After successful handover to local government, HAF joined forces with local stakeholders to build a school hall at Tembaletu. HAF is currently running kids after-school clubs; a young leaders programme; an art programme; an employment programme; and personal development courses for men, women, new parents and students.
Due to the long-standing relationship with the community of Gugulethu, building an Innovation Hub is the next logical step for HAF to offer a premium experience to combat youth unemployment and to strengthen families.
The visionTo create a state-of-the-art space that accommodates a premium experience where families are strengthened and young people can be equipped to connect to the local and global economy.
This space will be a mixed-use space that not only creates an attractive urban environment in the communities, but also houses a range of functions/programmes including, but not restricted to:
• Entrepreneurship Hive.
• Graphic design, web development and coding training.
• Retail spaces.
• Classroom spaces for education and seminars.
• Homework Club.
• Café and kitchen.
• Indoor and outdoor sports facilities.
• Leadership Labs.
• Library, recording studio and cinema.
• Family empowerment courses.
With an extensive network of connections with local businesses, schools, government bodies and community stakeholders, HAF will work tirelessly to resource the various phases of the project in order to see Gugulethu transformed over the years to come.
A team of PBT Group runners joined forces with HAF to run the Two Oceans Half Marathon on 20 April 2019 in order to raise funds and create awareness of the Hillsong Africa Foundation Innovation Hub in Gugulethu. With the Hub placing a large emphasis on ICT training opportunities, the Company sees this as a great opportunity to further extend our involvement in terms of time and effort, both from PBT Group as a business, whilst also creating opportunities for our employees to give back to the community.
PB
T G
RO
UP
• IN
TE
GR
AT
ED
RE
PO
RT
20
19
23
AP
PL
ICA
TIO
N O
F T
HE
K
ING
IV P
RIN
CIP
LE
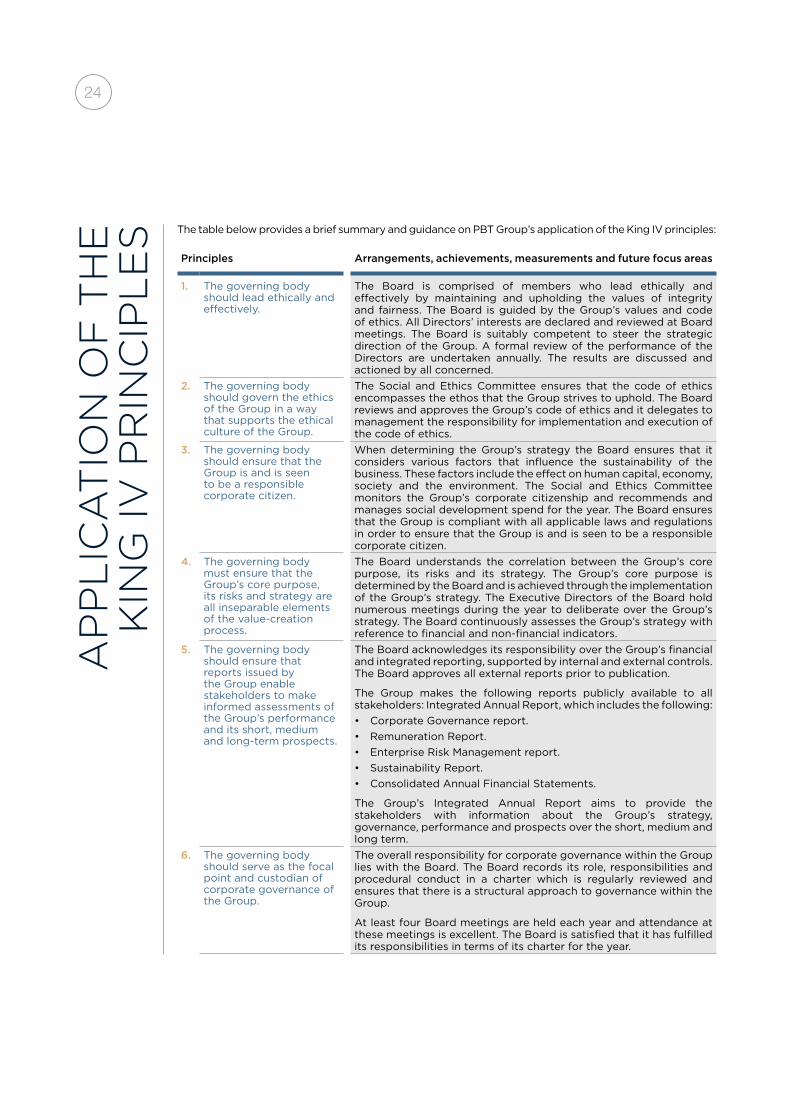
S The table below provides a brief summary and guidance on PBT Group’s application of the King IV principles:
Principles Arrangements, achievements, measurements and future focus areas
1. The governing body should lead ethically and effectively.
The Board is comprised of members who lead ethically and effectively by maintaining and upholding the values of integrity and fairness. The Board is guided by the Group’s values and code of ethics. All Directors’ interests are declared and reviewed at Board meetings. The Board is suitably competent to steer the strategic direction of the Group. A formal review of the performance of the Directors are undertaken annually. The results are discussed and actioned by all concerned.
2. The governing body should govern the ethics of the Group in a way that supports the ethical culture of the Group.
The Social and Ethics Committee ensures that the code of ethics encompasses the ethos that the Group strives to uphold. The Board reviews and approves the Group’s code of ethics and it delegates to management the responsibility for implementation and execution of the code of ethics.
3. The governing body should ensure that the Group is and is seen to be a responsible corporate citizen.
When determining the Group’s strategy the Board ensures that it considers various factors that influence the sustainability of the business. These factors include the effect on human capital, economy, society and the environment. The Social and Ethics Committee monitors the Group’s corporate citizenship and recommends and manages social development spend for the year. The Board ensures that the Group is compliant with all applicable laws and regulations in order to ensure that the Group is and is seen to be a responsible corporate citizen.
4. The governing body must ensure that the Group’s core purpose, its risks and strategy are all inseparable elements of the value-creation process.
The Board understands the correlation between the Group’s core purpose, its risks and its strategy. The Group’s core purpose is determined by the Board and is achieved through the implementation of the Group’s strategy. The Executive Directors of the Board hold numerous meetings during the year to deliberate over the Group’s strategy. The Board continuously assesses the Group’s strategy with reference to financial and non-financial indicators.
5. The governing body should ensure that reports issued by the Group enable stakeholders to make informed assessments of the Group’s performance and its short, medium and long-term prospects.
The Board acknowledges its responsibility over the Group’s financial and integrated reporting, supported by internal and external controls. The Board approves all external reports prior to publication.
The Group makes the following reports publicly available to all stakeholders: Integrated Annual Report, which includes the following: • Corporate Governance report.• Remuneration Report.• Enterprise Risk Management report.• Sustainability Report.• Consolidated Annual Financial Statements.
The Group’s Integrated Annual Report aims to provide the stakeholders with information about the Group’s strategy, governance, performance and prospects over the short, medium and long term.
6. The governing body should serve as the focal point and custodian of corporate governance of the Group.
The overall responsibility for corporate governance within the Group lies with the Board. The Board records its role, responsibilities and procedural conduct in a charter which is regularly reviewed and ensures that there is a structural approach to governance within the Group.
At least four Board meetings are held each year and attendance at these meetings is excellent. The Board is satisfied that it has fulfilled its responsibilities in terms of its charter for the year.
24

Principles Arrangements, achievements, measurements and future focus areas
7. The governing body should comprise the appropriate balance of knowledge, skills, experience, diversity and independence for it to properly discharge its governance role and responsibilities objectively and effectively.
The Board is comprised of six Directors, three of whom are Independent Non-Executive Directors, one Non-Executive Director and two Executive Directors. Each Director has their own skills and experiences, which brings diverse perspectives to Board meetings. The Directors are all adequately qualified and suitable to perform their responsibilities effectively. Brief summaries of each Director’s qualifications, capacity, status and membership can be found on pages 12 and 13.
The Board is considered of an appropriate size to enable it to meet and fulfil its governance role and responsibilities objectively and effectively. The Board performs an annual assessment of the performance of each Director and has found the current year review to be satisfactory.
8. The governing body should ensure that its arrangements for delegation within its own structures promote independent judgement and assist with the balance of power and the effective discharge of its duties.
The Board carefully delegates specific roles and responsibilities to Directors and Committees. When delegating, the Board ensures that there is a balanced distribution of power so that no member can dominate decision-making. Furthermore, the delegation by the Board of its responsibilities does not reduce its accountability.
The following Committees are in place:• Audit and Risk Committee.• Remuneration and Nomination Committee.• Social and Ethics Committee.
Each Committee comprises the appropriate mix of Directors. The roles and responsibilities delegated to each Committee are documented in a formal charter. Annual reviews of each charter are performed by the Board.
The roles and responsibilities delegated to the Chief Executive Officer (CEO) and Financial Director (FD) are recorded and approved by the Board.
9. The governing body should ensure that the evaluation of its own performance and that of its Committees, its Chairperson and its individual members supports continued improvement in its performance and effectiveness.
The Board and all the Committees conduct an annual self-evaluation process to measure its respective performance and that of the Chairman. These results are reviewed by the Remuneration and Nomination Committee and presented to the Board for its conclusion.
The suitability and effectiveness of the Company Secretary is reviewed by the Board on an annual basis.
10. The governing body should ensure that the appointment of and delegation to management contributes to role clarity and the effective exercise of authority and responsibilities.
The Board together with the Remuneration and Nomination Committee are responsible for the nomination and appointment of the CEO.
The CEO reports to the Board on a quarterly basis regarding the implementation and execution of the Group’s approved strategy, policies, operational planning and all other major business developments and proposals. Certain functions are delegated to senior management, who report to the CEO. The CEO undergoes a formal performance evaluation annually, the results of which are discussed with the Board. The Board has satisfied itself as to the appropriateness of this appointment.
Succession planning is an ongoing focus area.
The Group’s Company Secretary provides professional corporate governance services to the Group. The Company Secretary reports to the Board on all statutory, regulatory and governance matters concerning the Group and to the FD on all other duties and administrative matters.
The performance and independence of the Company Secretary is evaluated by the Board on an annual basis and the Board has satisfied itself as to the appropriateness of this appointment.
11. The governing body should govern risk in a way that supports the Group in setting and achieving its strategic objectives.
The Audit and Risk Committee is responsible for monitoring risk in the Group, which is integral to achieving strategic objectives.
The Committee ensures that management identifies potential risks, which may affect the Company or its operations and implements an effective risk management policy and plan, enhancing the Company’s ability to achieve its strategic objectives.
PB
T G
RO
UP
• IN
TE
GR
AT
ED
RE
PO
RT
20
19
25

Principles Arrangements, achievements, measurements and future focus areas
12. The governing body should govern technology and information in a way that supports the Group in setting and achieving its strategic objectives.
The Board acknowledges that information technology (IT) is an integral component of the Group’s strategy. The Audit and Risk Committee is responsible for governance of technology and information.
IT risks are monitored on a weekly basis and any significant risks or changes are reported to management.
The Group has an IT policy in place to manage ethical and responsible use of technology and information.
Any major IT investments are approved by management after taking into consideration costs and risks.
13. The governing body should govern compliance with applicable laws, non-binding rules, codes and standards in a way that supports the Group being ethical and a good corporate citizen.
Sasfin Capital is the Group’s Sponsor and advises the Board, through the Company Secretary, on compliance with the JSE Listings Requirements.
No regulatory penalties, sanctions or fines were imposed by the JSE Limited against the Group or any of the Directors of the Board.
The Group also consults their legal team and auditors to ensure compliance with applicable laws and regulations.
14. The governing body should ensure that the Group remunerates fairly, responsibly and transparently so as to promote the achievement of strategic objectives and positive outcomes in the short, medium and long term.
The Remuneration and Nomination Committee is responsible for setting remuneration policies that are aligned with the Group strategy. The aim of remuneration in the Group is to reward staff for their contribution to long-term operating and financial performance of the Group. The overall philosophy is to ensure that the remuneration of employees is competitive and that the Group attracts, motivates and retains individuals that are of the right calibre.
Details of the Group’s approach to remuneration, policy and implementation are disclosed in the Remuneration Report.
15. The governing body should ensure that assurance services and functions enable an effective control environment and that these support the integrity of information for internal decision-making and of the Group’s external reports.
The Board relies on internal and external assurance providers to aid an effective control environment. The Audit and Risk Committee oversees the assurance services within the Group. The Consolidated Annual Financial Statements included in the 2019 Integrated Report were independently audited by BDO Cape Inc.
Based on the small size of the Group, PBT Group does not have a separate internal audit function.
The information included in the Integrated Report is compiled to disclose information about the Group’s business performance, risks, opportunities and prospects.
The Audit and Risk Committee is satisfied that control systems and procedures are suitably enforced, maintained and supervised by qualified personnel, with appropriate segregation of authority, responsibilities and reporting lines.
16. In the execution of its governance role and responsibilities, the governing body should adopt a stakeholder-inclusive approach that balances the needs, interests and expectations of material stakeholders in the best interests of the organisation over time.
The Board ensures the development of appropriate policies that appreciate that stakeholders’ perceptions affect the Group’s reputation.
The Social and Ethics Committee is responsible for providing guidance on and oversight of the Group’s activities regarding its social and economic development, corporate citizenship, environment, health and public safety, relationship with all stakeholders, labour and employment, and to monitor the Company’s sustainability and governance performance in this regard.
17. The governing body of an institutional investor organisation should ensure that responsible investment is practiced by the organisation to promote the good governance and the creation of value by the companies in which it invests.
Principle 17 is not applicable to the PBT Group.
APPLICATION OF THE KING IV PRINCIPLES [CONTINUED]
26

ANNUAL FINANCIAL STATEMENTS
These financial statements have been prepared under the supervision of the Financial Director, Murray Louw.
Audited in compliance with the applicable requirements of the Companies Act.
27
PB
T G
RO
UP
• IN
TE
GR
AT
ED
RE
PO
RT
20
19

RE
PO
RT
OF
TH
E A
UD
IT
AN
D R
ISK
CO
MM
ITT
EE Composition of the
CommitteeThe Audit and Risk Committee comprises three Independent Non-Executive Directors which is consistent with King IV and as described in section 94 of the Companies Act.
The Committee is satisfied that the members thereof have the required knowledge and experience as set out in section 94(5) of the Companies Act of South Africa and Regulation 42 of the Companies Regulation, 2011. The reappointment of committee members will be a matter for consideration by shareholders at the forthcoming Annual General Meeting.
Objective and scopeThe Committee specifically oversees the following functions:
• Nomination for appointment by the shareholders of the external auditors.
• Liaison with the external auditors and determining the external audit fee.
• Assessment of the independence of the auditor.
• Regulation of non-audit work performed by external auditors.
• Ensure that appropriate financial reporting procedures exist and are working.
• Confirmation of responsibilities pursuant to paragraph 22.15(h) from the auditors.
• Recommendation of financial statements for approval by the Board.
• Monitoring of the adequacy and effectiveness of the internal control systems.
• Safeguarding the Group’s and clients’ assets.
• Assessment of the risk management process.
• Assessment of the governance processes.
• Assessment of the skills, expertise and capability of the finance function.
The role of the Audit and Risk Committee is to assist the Board in fulfilling its responsibility regarding financial and auditing oversight, as well as the overall quality and integrity of financial and internal controls.
Expertise and experience of Financial DirectorIn terms of the JSE Listings Requirements, the Audit and Risk Committee must perform an annual evaluation of the finance function of the Group. During the current year the Committee is satisfied that the Financial Director and the finance function possess the appropriate expertise and experience to meet their responsibilities.
Accounting practices and internal controlInternal controls and systems have been designed to provide reasonable assurance as to the integrity and reliability of the financial information represented in the financial statements, and to safeguard, verify and maintain the assets of the Group. Nothing has come to the attention of the Committee to indicate that any material breakdown in the functioning of the Group’s key internal control systems has occurred during the year under review. The Committee considers the Group’s accounting policies, practices and financial statements to be appropriate. The Audit and Risk Committee has reviewed the JSE’s proactive monitoring review findings and has considered making corrections/adjustments where applicable. Due to the size of the Executive Management structure it is not considered necessary to have an internal audit function.
External auditBDO Cape Incorporated (BDO Cape Inc) were appointed as the Group’s external auditor for the 2019 financial year. The Committee expressed its satisfaction that BDO Cape Inc is independent of the Group. BDO Cape Inc is accredited on the JSE’s list of auditors in terms of its Listings Requirements. Each year the Committee reviews the extent of non-audit services provided by the external auditors. The external auditor’s current tenure is two years. As per the Companies Act, an audit engagement partner is permitted to continue in such capacity for a period of five consecutive years. No mandatory audit engagement partner rotation is required in the current financial year.
28

The Committee has reviewed the performance of the external auditors and has nominated, for approval by shareholders at the forthcoming AGM, BDO Cape Inc as the external auditor for the 2020 financial year, with Imtiaaz Hashim, a registered auditor and partner of BDO Cape Inc, as the designated auditor.
The Committee in consultation with Executive Management agree to the terms of the engagement. The audit fee for the external audit has been considered and referred to the Board for approval, taking into consideration such factors as the timing of the audit, the extent of the work required and the scope. The Board has approved the audit fee for the 2019 financial year.
The Audit and Risk Committee has considered and preapproved all non-audit services provided by the external auditors and the fees relative thereto so as to ensure the independence of the external auditors are maintained.
Financial statementsThe Audit and Risk Committee has evaluated the consolidated and separate annual financial statements for the year ended 31 March 2019 and considers that they comply in all material aspects with the requirements of the Companies Act and International Financial Reporting Standards. The Committee has therefore recommended the Integrated Report to the Board for approval. The Board has subsequently approved the consolidated annual financial statements.
The Audit and Risk Committee has considered the JSE Letters dated 20 February 2018 and 20 February 2019 regarding the proactive monitoring of financial statements for compliance with IFRS and has taken appropriate action to apply the findings.
MeetingsThe Audit and Risk Committee performs the duties assigned to it by section 94(7) of the Companies Act by holding meetings with key role players on a regular basis and by the unrestricted access granted to the external auditors.
The Audit and Risk Committee meets at least three times a year.
Committee meetings are also attended by relevant Senior Executives to provide insight into items under review.
Audit and Risk Committee attendance
DirectorMeeting 1: 25 June 2018
Meeting 2: 18 July 2018
Meeting 3: 28 November 2018
Meeting 4: 27 March 2019
Eligible for meetings
Cheree Dyers Attended Attended Attended Attended Yes
Tony Taylor Attended Attended Attended Attended Yes
Arthur Winkler Attended Attended Attended Attended Yes
Arthur WinklerAudit and Risk Committee Chairman
28 June 2019
PB
T G
RO
UP
• IN
TE
GR
AT
ED
RE
PO
RT
20
19
29

DIR
EC
TOR
S’ R
ES
PO
NS
IBIL
ITIE
S
AN
D A
PP
RO
VA
L The Directors are required in terms of the Companies Act, Act 71 of 2008 (as amended) to maintain adequate accounting records and are responsible for the content and integrity of the consolidated and separate annual financial statements and related financial information included in this report. It is their responsibility to ensure that the consolidated and separate annual financial statements fairly present the state of affairs of the Group as at the end of the financial year and the results of its operations and cash flows for the period then ended, in conformity with International Financial Reporting Standards. The external auditors are engaged to express an independent opinion on the consolidated and separate annual financial statements.
The consolidated and separate annual financial statements are prepared in accordance with International Financial Reporting Standards and are based upon appropriate accounting policies consistently applied and supported by reasonable and prudent judgements and estimates.
The Directors acknowledge that they are ultimately responsible for the system of internal financial control established by the Group and place considerable importance on maintaining a strong control environment. To enable the Directors to meet these responsibilities, the Board of Directors sets standards for internal control aimed at reducing the risk of error or loss in a cost-effective manner. The standards include the proper delegation of responsibilities within a clearly defined framework, effective accounting procedures and adequate segregation of duties to ensure an acceptable level of risk. These controls are monitored throughout the Group and all employees are required to maintain the highest ethical standards in ensuring the Group’s business is conducted in a manner that in all reasonable circumstances is above reproach. The focus of risk management in the Group is on identifying, assessing, managing and monitoring all known forms of risk across the Group. While operating risk cannot be fully eliminated, the Group endeavours to minimise it by ensuring that appropriate infrastructure, controls, systems and ethical behaviour are applied and managed within predetermined procedures and constraints.
The Directors are of the opinion, based on the information and explanations given by management, that the system of internal control provides reasonable assurance that the financial records may be relied on for the preparation of the consolidated and separate annual financial statements. However, any system of internal financial control can provide only reasonable, and not absolute, assurance against material misstatement or loss.
The Directors have reviewed the Group’s cash flow forecast for the next 12 months from report signing date and, in light of this review and the current financial position, they are satisfied that the Group has access to adequate resources to continue in operational existence for the foreseeable future.
The external auditors are responsible for independently auditing and reporting on the Group’s consolidated financial statements. The consolidated and separate financial statements have been examined by the Group’s external auditors and their report is presented on page 35.
The consolidated and separate annual financial statements set out on pages 32 to 100, which have been prepared on the going concern basis, were approved by the Board of Directors on 28 June 2019 and were signed on their behalf by:
Tony TaylorNon-Executive Chairman
Pierre de WetChief Executive Director
Cape Town28 June 2019
30

DE
CL
AR
AT
ION
BY
C
OM
PAN
Y S
EC
RE
TAR
Y Group secretary’s certificationIn terms of section 88(2)(e) of the Companies Act, as amended, I certify that the Group has lodged with the Commissioner all such returns as are required of a public company in terms of the Companies Act and that all such returns are true, correct and up to date.
All Directors have access to the advice and services of the Company Secretary who provides guidance to the Board as a whole and to individual Directors with regard to corporate governance and how they should discharge their responsibilities in the best interests of the Group and Company.
Bianca Pieters, (CA) SACompany Secretary
Cape Town28 June 2019
PB
T G
RO
UP
• IN
TE
GR
AT
ED
RE
PO
RT
20
19
31

DIR
EC
TOR
S’
RE
PO
RT The Directors have pleasure in submitting their report on the consolidated and separate annual financial
statements of PBT Group Limited and the Group for the year ended 31 March 2019.
Nature of businessPBT Group Limited is an information management services provider that enables companies to use business intelligence solutions to optimise the exploitation of one of its biggest assets – data – to its broad client base.
During the year PBT Group successfully disposed of Prescient Capital Proprietary Limited and its subsidiaries on 28 September 2018 as approved by shareholders. Please refer to note 14 for more information on the disposal.
Other than the Prescient Capital disposal, there have been no material changes to the nature of the Group’s business from the prior year.
Review of financial results and activitiesThe consolidated and separate annual financial statements have been prepared in accordance with International Financial Reporting Standards and the requirements of the Companies Act and the Financial Reporting Pronouncements as issued by the Financial Reporting Standards Council, the SAICA Financial Reporting Guides issued by the Accounting Practices Committee and the Listings Requirements of the JSE Limited. The accounting policies have been applied consistently compared to the prior year, except for the adoption of new or revised accounting standards as set out in note 2.
Full details of the financial position, results of operations and cash flows of the Group are set out in these consolidated annual financial statements.
Refer to note 41 on page 96 for a detailed breakdown of the proportion of net income or loss attributable to the various divisions of the Group.
Share capitalDuring the year various transactions affected the share capital of the Group. These include:
• a specific repurchase as approved by shareholders on 28 September 2018;
• the subsequent cancellation of the specific repurchased shares;
• a share consolidation on the basis of one ordinary share for every 10 authorised and issued shares held;
• shares purchased from dissenting shareholders in terms of section 164 of the Companies Act; and
• loan granted to BEE company for the purchase of shares accounted for as treasury shares in accordance with IFRS 2 Share-based Payments.
Refer to note 15 of the consolidated and separate annual financial statements for detail of the movement in authorised and issued share capital.
DividendsThe Company’s dividend policy is to consider an interim and a final dividend in respect of each financial year. At its discretion, the Board of Directors may consider a special dividend, where appropriate. Depending on the perceived need to retain funds for expansion or operating purposes, the Board of Directors may pass on the payment of dividends.
The Board of Directors do not recommend the declaration of a dividend for the 2019 financial year.
32

DirectorsThe Directors in office at the date of this report are as follows:
Directors Office Designation
Tony Taylor Chairman Independent Non-Executive
Pierre de Wet Chief Executive Officer Executive
Murray Louw Financial Director Executive
Cheree Dyers Independent Non-Executive
Herman Steyn Non-Executive
Arthur Winkler Independent Non-Executive
Directors’ interests in sharesAs at 31 March 2019 the Directors of the Company held direct and indirect beneficial interests in 21% (2018: 16%) of its issued ordinary shares, as set out below. The Directors’ holdings that was included in the 2018 Integrated Report was based on the full issued share capital of 1 669 250 950 which included treasury shares of 270 188 033 (before consolidation). In the 2019 Integrated Report it is amended to reflect net of the treasury shares and after the share consolidation of 1-for-10.
Interests in sharesDirect Indirect
Directors 2019 2018 2019 2018
Tony Taylor 96 479 96 479 – –
Pierre de Wet – – 5 390 000 –
Murray Louw – – 367 611 367 611
Cheree Dyers 198 426 478 427 5 610 000 1 032 568
Herman Steyn 170 132 170 132 10 875 562 20 570 493
465 037 745 038 22 243 173 21 970 672
The register of interests of Directors and others in shares of the Company is available to the shareholders on request. There were no changes to the Directors’ shareholding between the end of the financial year and the date of the approval of the Integrated Report.
Company secretaryThe Group Company Secretary is Bianca Pieters, (CA) SA.
Business address:PBT House2 Mews CloseWaterford MewsCentury City7441
As required by JSE Listings Requirement 3.84(i), the Board has satisfied itself that the Company Secretary has the appropriate expertise, competence and experience. The Company Secretary is accountable to the Board and the following duties, among other things, were carried out:
• guidance to the Directors in terms of their duties, responsibilities, powers, training and induction of the responsibilities and liabilities under the Companies Act;
• making the Board aware of any law relevant to and/or affecting the Company;
• preparation of Board packs and recording of proper detailed minutes of meetings;
• ensuring proper and orderly conduct at all Board, Committee and Annual General Meetings;
• disclosure of corporate actions of SENS announcements and Directors’ dealings in securities; and
• compliance with JSE Listings Requirements and the Companies Act.
All Directors have access to the advice and services of the Company Secretary. The Board considered the competence, qualifications and experience of the Company Secretary and is satisfied that they are appropriate. This was concluded after due assessment following a review by the Remuneration Committee of the Company regarding the Company Secretary’s qualifications, experience and performance.
PB
T G
RO
UP
• IN
TE
GR
AT
ED
RE
PO
RT
20
19
33

AuditorsBDO Cape Inc continued in office as auditors for the Company and its subsidiaries for 2019.
At the Annual General Meeting the shareholders will be requested to reappoint BDO Cape Inc as the independent external auditors of the Company and to confirm Imtiaaz Hashim as the designated lead audit partner for the 2020 financial year.
Report of the Audit and Risk CommitteeThe Report of the Audit and Risk Committee, as required in section 94(7)(f) of the Companies Act, is set out on pages 28 and 29 of these consolidated annual financial statements.
Board evaluation of the Audit and Risk CommitteeThe Board of Directors believes that the Committee has satisfied its responsibilities for the year in compliance with the terms of reference of the Companies Act.
Going concernThe Directors believe that the Group has adequate financial resources to continue in operation for the foreseeable future and accordingly the consolidated and separate annual financial statements have been prepared on a going concern basis. The Directors have satisfied themselves that the Group and Company are in a sound financial position and that it has access to sufficient borrowing facilities to meet its foreseeable cash requirements. The Directors are
not aware of any new material changes that may adversely impact the Group or Company. The Directors are also not aware of any material non-compliance with statutory or regulatory requirements or of any pending changes to legislation which may affect the Group or Company.
Events after the reporting periodThe Directors are not aware of any material event which occurred after the reporting date and up to the date of this report.
Date of authorisation for issue of financial statementsThe consolidated and separate annual financial statements have been authorised for issue by the Directors on 28 June 2019. No authority was given to anyone to amend the consolidated and separate annual financial statements after the date of issue.
Discontinued operationsOn 28 September 2018 shareholders approved the transactions as previously communicated to shareholders in the Circular and Supplementary Circular posted on 23 March 2018 and 28 August 2018, respectively.
The transaction related to the disposal of Prescient Capital Proprietary Limited and its subsidiaries as well as the Prescient Holdings Proprietary Limited shares in exchange for a cash consideration of R4.8 million and the specific repurchase of 305 062 917 number of PBT Group Limited shares valued at 14 cents per share as at 28 September 2018 (the market value at the effective date of disposal).
Refer to note 14 for detail on the transaction.
DIRECTORS’ REPORT [CONTINUED]
34

Report on the audit of the consolidated and separate financial statements
OpinionWe have audited the consolidated and separate financial statements of PBT Group Limited (the Group and Company) set out on pages 38 to 100, which comprise the consolidated and separate statements of financial position as at 31 March 2019, and the consolidated and separate statements of comprehensive income, the consolidated and separate statements of changes in equity and the consolidated and separate statements of cash flows for the year then ended, and notes to the consolidated and separate financial statements, including a summary of significant accounting policies.
In our opinion, the consolidated and separate financial statements present fairly, in all material respects, the consolidated and separate financial position of PBT Group Limited as at 31 March 2019, and its consolidated and separate financial performance and consolidated and separate cash flows for the year then ended in accordance with International Financial Reporting Standards and the Companies Act of South Africa.
Basis for opinionWe conducted our audit in accordance with International Standards on Auditing (ISAs). Our responsibilities under those standards are further described in the Auditor’s Responsibilities for the Audit of the Consolidated and Separate Financial Statements section of our report. We are independent of the Group and Company
in accordance with the sections 290 and 291 of the Independent Regulatory Board for Auditors’ Code of Professional Conduct for Registered Auditors (Revised January 2018), parts 1 and 3 of the Independent Regulatory Board for Auditors’ Code of Professional Conduct for Registered Auditors (Revised November 2018) (together the IRBA Codes) and other independence requirements applicable to performing audits of financial statements in South Africa. We have fulfilled our other ethical responsibilities, as applicable, in accordance with the IRBA Codes and in accordance with other ethical requirements applicable to performing audits in South Africa. The IRBA Codes are consistent with the corresponding sections of the International Ethics Standards Board for Accountants’ Code of Ethics for Professional Accountants and the International Ethics Standards Board for Accountants’ International Code of Ethics for Professional Accountants (including International Independence Standards), respectively. We believe that the audit evidence we have obtained is sufficient and appropriate to provide a basis for our opinion.
Key audit mattersKey audit matters are those matters that, in our professional judgement, were of most significance in our audit of the consolidated and separate financial statements of the current period. These matters were addressed in the context of our audit of the consolidated and separate financial statements as a whole, and in forming our opinion thereon, and we do not provide a separate opinion on these matters.
IND
EP
EN
DE
NT
AU
DIT
OR
’S R
EP
OR
TTo
the
sha
reho
lder
s o
f P
BT
Gro
up L
imit
ed PB
T G
RO
UP
• IN
TE
GR
AT
ED
RE
PO
RT
20
19
35

The following key audit matters relate to the consolidated financial statements. We have determined that there are no key audit matters in respect of the separate financial statements.
Key audit matter Audit responses
VALUATION OF GOODWILL (NOTES 1.3 AND 5)
At 31 March 2019 goodwill comprises 42% of total assets as per the statement of financial position.
In terms of IAS 36 Impairment of Assets, management is required to annually test goodwill for impairment.
We have determined this is a key audit matter due to the judgement required by management in preparing a “value-in-use” model to satisfy the impairment test. Forecasting future cash flows and applying an appropriate discount rate, inherently involves a high degree of estimation and judgement by management.
Our audit procedures focused on evaluating and challenging the key assumptions used by management in conducting the impairment review. These procedures included, amongst others:
• Reviewing the model used for compliance with IAS 36 Impairment of Assets.
• Verifying the mathematical accuracy and methodology appropriateness of the underlying model calculations.
• Involvement of our internal valuation specialist to assess the reasonability of the inputs by comparing the key growth rate assumptions to historical results, economic and industry forecasts, and assessing the discount rate by reference to the cost of capital of the Group.
• Actual results were compared to the 2018 financial year forecast included in the prior year to assess the accuracy of management’s forecasting capabilities.
• Performing a sensitivity analysis to assess the effect of reasonably possible changes in key assumptions.
• Assessing and validating that the disclosures made in the financial statements were in accordance with IFRS (IAS 36 Impairment of Assets) statements.
Other informationThe Directors are responsible for the other information. The other information comprises the information included in the document titled “2019 Integrated Report” which includes the Directors’ Report, the Report of the Audit and Risk Committee and the Company Secretary’s Certificate as required by the Companies Act of South Africa. Other information does not include the consolidated and separate financial statements and our auditor’s report thereon.
Our opinion on the consolidated and separate financial statements does not cover the other information and we do not express an audit opinion or any form of assurance conclusion thereon.
In connection with our audit of the consolidated and separate financial statements, our responsibility is to read the other information and, in doing so, consider whether the other information is materially inconsistent with the consolidated and separate financial statements or our knowledge obtained in the audit, or otherwise appears to be materially misstated. If, based on the work we have performed we conclude that there is a material misstatement of this other information, we are required to report that fact. We have nothing to report in this regard.
Responsibilities of the Directors for the consolidated financial statementsThe Directors are responsible for the preparation and fair presentation of the consolidated and separate financial statements in accordance with International Financial Reporting Standards and the requirements of the Companies Act of South Africa, and for such internal control as the Directors determine is necessary to enable the preparation of consolidated and separate financial statements that are free from material misstatement, whether due to fraud or error.
In preparing the consolidated and separate financial statements, the Directors are responsible for assessing the Group’s and the Company’s ability to continue as a going concern, disclosing, as applicable, matters related to going concern and using the going concern basis of accounting unless the Directors either intend to liquidate the Group and/or the Company or to cease operations, or have no realistic alternative but to do so.
INDEPENDENT AUDITOR’S REPORT [CONTINUED]
36

Auditor’s responsibilities for the audit of the consolidated and separate financial statements Our objectives are to obtain reasonable assurance about whether the consolidated and separate financial statements as a whole are free from material misstatement, whether due to fraud or error, and to issue an auditor’s report that includes our opinion. Reasonable assurance is a high level of assurance, but is not a guarantee that an audit conducted in accordance with ISAs will always detect a material misstatement when it exists. Misstatements can arise from fraud or error and are considered material if, individually or in the aggregate, they could reasonably be expected to influence the economic decisions of users taken on the basis of these consolidated and separate financial statements.
As part of an audit in accordance with ISAs, we exercise professional judgement and maintain professional scepticism throughout the audit. We also:
• Identify and assess the risks of material misstatement of the consolidated financial statements, whether due to fraud or error, design and perform audit procedures responsive to those risks, and obtain audit evidence that is sufficient and appropriate to provide a basis for our opinion. The risk of not detecting a material misstatement resulting from fraud is higher than for one resulting from error, as fraud may involve collusion, forgery, intentional omissions, misrepresentations, or the override of internal control.
• Obtain an understanding of internal control relevant to the audit in order to design audit procedures that are appropriate in the circumstances, but not for the purpose of expressing an opinion on the effectiveness of the group’s internal control.
• Evaluate the appropriateness of accounting policies used and the reasonableness of accounting estimates and related disclosures made by the Directors.
• Conclude on the appropriateness of the Directors’ use of the going concern basis of accounting and, based on the audit evidence obtained, whether a material uncertainty exists related to events or conditions that may cast significant doubt on the Group’s and/or the Company’s ability to continue as a going concern. If we conclude that a material uncertainty exists, we are required to draw attention in our auditor’s report to the related disclosures in the consolidated financial statements or, if such disclosures are inadequate, to modify our opinion. Our conclusions are based on the audit evidence obtained up to the date of our auditor’s report. However, future events or conditions may cause the Group to cease to continue as a going concern.
• Evaluate the overall presentation, structure and content of the consolidated financial statements, including the disclosures, and whether the consolidated financial statements represent the underlying transactions and events in a manner that achieves fair presentation.
• Obtain sufficient appropriate audit evidence regarding the financial information of the entities or business activities within the Group to express an opinion on the consolidated financial statements. We are responsible for the direction, supervision and performance of the Group audit. We remain solely responsible for our audit opinion.
We communicate with the Directors regarding, among other matters, the planned scope and timing of the audit and significant audit findings, including any significant deficiencies in internal control that we identify during our audit.
We also provide the Directors with a statement that we have complied with relevant ethical requirements regarding independence, and to communicate with them all relationships and other matters that may reasonably be thought to bear on our independence and, where applicable, related safeguards.
From the matters communicated with the Directors, we determine those matters that were of most significance in the audit of the separate and consolidated financial statements of the current period and are therefore the key audit matters. We describe these matters in our auditor’s report unless law or regulation precludes public disclosure about the matter or when, in extremely rare circumstances, we determine that a matter should not be communicated in our report because the adverse consequences of doing so would reasonably be expected to outweigh the public interest benefits of such communication.
Report on other legal and regulatory requirementsIn terms of the IRBA Rule published in Government Gazette Number 39475 dated 4 December 2015, we report that BDO Cape Inc has been the auditor of PBT Group Limited for two years.
BDO CAPE INCORPORATEDRegistered AuditorsPractice number: 970879-0000
Imtiaaz HashimDirectorRegistered AuditorChartered Accountant (SA)
28 June 2019
6th Floor, BDO House123 Hertzog Boulevard ForeshoreCape Town
PB
T G
RO
UP
• IN
TE
GR
AT
ED
RE
PO
RT
20
19
37

STATEMENT OF FINANCIAL POSITION as at 31 March 2019
GROUP COMPANY
Rand Notes 2019 2018 2019 2018
ASSETSNon-current assetsProperty, plant and equipment 4 4 247 142 6 030 533 – –
Goodwill 5 135 666 420 135 666 420 – –
Intangible assets 6 244 626 675 082 – –
Investments in subsidiaries 7 – – 103 217 726 76 564 004
Loans to Group companies 8 – – 118 665 805 140 352 010
Loans receivable 10 6 458 606 – – –
Investments at fair value 12 26 868 915 – – –
Other financial assets 10, 12 – 25 785 812 – –
Deferred tax 9 2 891 191 2 139 120 395 146 –
176 376 900 170 296 967 222 278 677 216 916 014
Current assetsLoans receivable 10 1 295 275 – – –
Trade and other receivables 11 112 075 437 91 270 083 125 758 2 798 435
Current tax receivable 521 042 1 815 649 – –
Other financial assets 10, 12 – 3 206 276 – –
Cash and cash equivalents 13 31 079 809 34 202 850 626 135 1 319 432
144 971 563 130 494 858 751 893 4 117 867
Non-current assets held for sale and assets of disposal group
14 – 57 120 959 – 50 548 926
Total assets 321 348 463 357 912 784 223 030 570 271 582 807
EQUITY AND LIABILITIESEquityEquity attributable to equity holders of parentShare capital 15 3 490 921 65 358 941 2 018 815 262 2 081 368 051
Reserves 5 482 400 12 909 171 32 147 –
Retained income 247 931 820 221 403 368 (1 796 992 655) (1 815 068 904)
256 905 141 299 671 480 221 854 754 266 299 147
Non-controlling interest 13 854 001 6 915 887 – –
Total equity 270 759 142 306 587 367 221 854 754 266 299 147
LiabilitiesNon-current liabilitiesDeferred tax 9 1 615 464 183 984 – –
Current liabilitiesTrade and other payables 19 37 699 855 34 058 359 93 540 4 856 989
Current tax payable 2 777 895 1 774 418 1 082 276 426 671
Payroll-related accruals 18 8 396 227 8 584 433 – –
Bank overdraft 13 99 880 152 191 – –
48 973 857 44 569 401 1 175 816 5 283 660
Liabilities of disposal group 14 – 6 572 032 – –
Total liabilities 50 589 321 51 325 417 1 175 816 5 283 660
Total equity and liabilities 321 348 463 357 912 784 223 030 570 271 582 807
38

STATEMENT OF PROFIT OR LOSS AND OTHER COMPREHENSIVE INCOMEfor the year ended 31 March 2019
GROUP COMPANY
Rand Notes 2019 2018 2019 2018
Continuing operationsRevenue 20 588 414 409 556 093 567 – 42 425 249Cost of sales 21 (440 865 367) (457 972 710) – –Gross profit 147 549 042 98 120 857 – 42 425 249Other income 22 1 272 869 2 756 748 1 882 129 482 500Other operating (losses)/gains 23 (497 750) 57 313 – –Movement in credit loss allowances 24 4 752 726 – 2 790 720 –Gain/(loss) on exchange differences 23 1 152 300 (4 408 936) 1 165 –Impairment loss 25 (38 367) (127 040 905) (213 071) (265 083 544)Other operating expenses (106 048 629) (87 680 084) (5 334 037) (1 996 585)Operating profit/(loss) 24 48 142 191 (118 195 007) (873 094) (224 172 380)Investment income 26 3 812 254 6 035 269 36 587 124 421Finance costs 27 (1 208 747) (5 190 937) (7 262) (3 160)Profit/(loss) before taxation 50 745 698 (117 350 675) (843 769) (224 051 119)Taxation 28 (17 097 985) (22 018 328) (1 444 347) (182 518)Profit/(loss) from continuing operations 33 647 713 (139 369 003) (2 288 116) (224 233 637)
Discontinued operationsProfit/(loss) from discontinued operations 14 9 113 855 (42 280 605) 23 585 663 (42 413 227)Profit/(loss) for the year 42 761 568 (181 649 608) 21 297 547 (266 646 864)
Other comprehensive income:Items that will not be reclassified to profit or loss:Gains on valuation of investments in equity instruments
470 363 – – –
Items that may be reclassified to profit or loss:Exchange differences on translating foreign operations
(7 929 281) 193 591 – –
Other comprehensive (loss)/income for the year net of taxation
31 (7 458 918) 193 591 – –
Total comprehensive income/(loss) for the year
35 302 650 (181 456 017) 21 297 547 (266 646 864)
Profit/(loss) attributable to:Owners of the parentFrom continuing operations 22 299 599 (145 835 399) (2 288 116) (224 233 637)From discontinued operations 9 113 855 (42 280 605) 23 585 663 (42 413 227)
31 413 454 (188 116 004) 21 297 547 (266 646 864)
Non-controlling interestFrom continuing operations 11 348 114 6 466 396 – –
42 761 568 (181 649 608) 21 297 547 (266 646 864)
Total comprehensive income/(loss) attributable to:Owners of the parent 23 954 536 (187 922 413) 21 297 547 (266 646 864)Non-controlling interest 11 348 114 6 466 396 – –
35 302 650 (181 456 017) 21 297 547 (266 646 864)
Earnings per share (cents)From continuing operationsBasic earnings/(loss) per share 40 17.97 (97.28) – –Diluted earnings/(loss) per share 40 17.97 (97.28) – –
From discontinued operationsBasic earnings/(loss) per share 40 7.35 (28.20) – –Diluted earnings/(loss) per share 40 7.35 (28.20) – –
PB
T G
RO
UP
• IN
TE
GR
AT
ED
RE
PO
RT
20
19
39

STATEMENT OF CHANGES IN EQUITYfor the year ended 31 March 2019
Rand NotesShare
capital
Foreign currency
translation reserve
Share-based payment
reserveRevaluation
reserveTotal
reservesRetained
income
Total attributable to equity holders of the Group/
Company
Non-controlling
interestTotal
equity
GROUP
Balance at 1 April 2017 136 698 640 12 715 580 – – 12 715 580 409 519 372 558 933 592 12 434 173 571 367 765
Loss for the year – – – – – (188 116 004) (188 116 004) 6 466 396 (181 649 608)
Other comprehensive income 38 – 193 591 – – 193 591 – 193 591 – 193 591
Total comprehensive loss for the year – 193 591 – – 193 591 (188 116 004) (187 922 413) 6 466 396 (181 456 017)
Capital distribution (26 209 633) – – – – – (26 209 633) – (26 209 633)
Purchase of own shares (45 130 066) – – – – – (45 130 066) – (45 130 066)
Loss of control – – – – – – – (2 913 149) (2 913 149)
Dividends – – – – – – – (9 065 000) (9 065 000)
Change in ownership – – – – – – – (6 533) (6 533)
Total contributions by and distributions to owners of Company recognised directly in equity
(71 339 699) – – – – – (71 339 699) (11 984 682) (83 324 381)
Opening balance as previously reported 65 358 941 12 909 171 – – 12 909 171 221 403 368 299 671 480 6 915 887 306 587 367
Change in accounting policy 2 – – – – – (4 692 998) (4 692 998) – (4 692 998)
Balance at 1 April 2018 as restated 65 358 941 12 909 171 – – 12 909 171 216 518 366 294 786 478 6 915 887 301 702 365
Profit for the year – – – – – 31 413 454 31 413 454 11 348 114 42 761 568
Other comprehensive income 38 – (7 929 281) – 470 363 (7 458 918) – (7 458 918) – (7 458 918)
Total comprehensive income for the year – (7 929 281) – 470 363 (7 458 918) 31 413 454 23 954 536 11 348 114 35 302 650
Shares repurchased from dissenting shareholders (3 343 931) – – – – – (3 343 931) – (3 343 931)
Specific repurchase of shares (42 708 858) – – – – – (42 708 858) – (42 708 858)
Share-based payment shares included as treasury shares 17 (16 500 000) – – – – – (16 500 000) – (16 500 000)
Dividend – – – – – – – (4 410 000) (4 410 000)
Share-based payment – – 32 147 – 32 147 – 32 147 – 32 147
Adjustment to share capital following the discontinued operations
684 769 – – – – – 684 769 – 684 769
Total contributions by and distributions to owners of Company recognised directly in equity
(61 868 020) – 32 147 – 32 147 – (61 835 873) (4 410 000) (66 245 873)
Balance at 31 March 2019 3 490 921 4 979 890 32 147 470 363 5 482 400 247 931 820 256 905 141 13 854 001 270 759 142
Notes 15 16, 31 17 31
40

Rand NotesShare
capital
Foreign currency
translation reserve
Share-based payment
reserveRevaluation
reserveTotal
reservesRetained
income
Total attributable to equity holders of the Group/
Company
Non-controlling
interestTotal
equity
GROUP
Balance at 1 April 2017 136 698 640 12 715 580 – – 12 715 580 409 519 372 558 933 592 12 434 173 571 367 765
Loss for the year – – – – – (188 116 004) (188 116 004) 6 466 396 (181 649 608)
Other comprehensive income 38 – 193 591 – – 193 591 – 193 591 – 193 591
Total comprehensive loss for the year – 193 591 – – 193 591 (188 116 004) (187 922 413) 6 466 396 (181 456 017)
Capital distribution (26 209 633) – – – – – (26 209 633) – (26 209 633)
Purchase of own shares (45 130 066) – – – – – (45 130 066) – (45 130 066)
Loss of control – – – – – – – (2 913 149) (2 913 149)
Dividends – – – – – – – (9 065 000) (9 065 000)
Change in ownership – – – – – – – (6 533) (6 533)
Total contributions by and distributions to owners of Company recognised directly in equity
(71 339 699) – – – – – (71 339 699) (11 984 682) (83 324 381)
Opening balance as previously reported 65 358 941 12 909 171 – – 12 909 171 221 403 368 299 671 480 6 915 887 306 587 367
Change in accounting policy 2 – – – – – (4 692 998) (4 692 998) – (4 692 998)
Balance at 1 April 2018 as restated 65 358 941 12 909 171 – – 12 909 171 216 518 366 294 786 478 6 915 887 301 702 365
Profit for the year – – – – – 31 413 454 31 413 454 11 348 114 42 761 568
Other comprehensive income 38 – (7 929 281) – 470 363 (7 458 918) – (7 458 918) – (7 458 918)
Total comprehensive income for the year – (7 929 281) – 470 363 (7 458 918) 31 413 454 23 954 536 11 348 114 35 302 650
Shares repurchased from dissenting shareholders (3 343 931) – – – – – (3 343 931) – (3 343 931)
Specific repurchase of shares (42 708 858) – – – – – (42 708 858) – (42 708 858)
Share-based payment shares included as treasury shares 17 (16 500 000) – – – – – (16 500 000) – (16 500 000)
Dividend – – – – – – – (4 410 000) (4 410 000)
Share-based payment – – 32 147 – 32 147 – 32 147 – 32 147
Adjustment to share capital following the discontinued operations
684 769 – – – – – 684 769 – 684 769
Total contributions by and distributions to owners of Company recognised directly in equity
(61 868 020) – 32 147 – 32 147 – (61 835 873) (4 410 000) (66 245 873)
Balance at 31 March 2019 3 490 921 4 979 890 32 147 470 363 5 482 400 247 931 820 256 905 141 13 854 001 270 759 142
Notes 15 16, 31 17 31
PB
T G
RO
UP
• IN
TE
GR
AT
ED
RE
PO
RT
20
19
41

STATEMENT OF CHANGES IN EQUITY [CONTINUED]for the year ended 31 March 2019
Rand NotesShare
capital
Foreign currency
translation reserve
Share-based payment
reserveRevaluation
reserveTotal
reservesRetained
income
Total attributable to equity holders of the Group/
Company
Non-controlling
interestTotal
equity
COMPANY
Balance at 1 April 2017 2 156 178 686 – – – – (1 548 422 040) 607 756 646 – 607 756 646
Loss for the year – – – – – (266 646 864) (266 646 864) – (266 646 864)
Total comprehensive loss for the year – – – – – (266 646 864) (266 646 864) – (266 646 864)
Purchase of own shares (51 891 691) – – – – – (51 891 691) – (51 891 691)
Capital distribution (22 918 944) – – – – – (22 918 944) – (22 918 944)
Total contributions by and distributions to owners of Company recognised directly in equity
(74 810 635) – – – – – (74 810 635) – (74 810 635)
Opening balance as previously reported 2 081 368 051 – – – – (1 815 068 904) 266 299 147 – 266 299 147
Change in accounting policy 2 – – – – – (3 221 298) (3 221 298) – (3 221 298)
Balance at 1 April 2018 as restated 2 081 368 051 – – – – (1 818 290 202) 263 077 849 – 263 077 849
Profit for the year – – – – – 21 297 547 21 297 547 – 21 297 547
Other comprehensive income – – – – – – – – –
Total comprehensive income for the year – – – – – 21 297 547 21 297 547 – 21 297 547
Specific repurchase of shares (42 708 858) – – – – – (42 708 858) – (42 708 858)
Shares repurchased from dissenting shareholders (3 343 931) – – – – – (3 343 931) – (3 343 931)
Share-based payment shares included as treasury shares 17 (16 500 000) – – – – – (16 500 000) – (16 500 000)
Share-based payment – – 32 147 – 32 147 – 32 147 – 32 147
Total contributions by and distributions to owners of Company recognised directly in equity
(62 552 789) – 32 147 – 32 147 – (62 520 642) – (62 520 642)
Balance at 31 March 2019 2 018 815 262 – 32 147 – 32 147 (1 796 992 655) 221 854 754 – 221 854 754
Notes 15 16, 31 17 31
42

Rand NotesShare
capital
Foreign currency
translation reserve
Share-based payment
reserveRevaluation
reserveTotal
reservesRetained
income
Total attributable to equity holders of the Group/
Company
Non-controlling
interestTotal
equity
COMPANY
Balance at 1 April 2017 2 156 178 686 – – – – (1 548 422 040) 607 756 646 – 607 756 646
Loss for the year – – – – – (266 646 864) (266 646 864) – (266 646 864)
Total comprehensive loss for the year – – – – – (266 646 864) (266 646 864) – (266 646 864)
Purchase of own shares (51 891 691) – – – – – (51 891 691) – (51 891 691)
Capital distribution (22 918 944) – – – – – (22 918 944) – (22 918 944)
Total contributions by and distributions to owners of Company recognised directly in equity
(74 810 635) – – – – – (74 810 635) – (74 810 635)
Opening balance as previously reported 2 081 368 051 – – – – (1 815 068 904) 266 299 147 – 266 299 147
Change in accounting policy 2 – – – – – (3 221 298) (3 221 298) – (3 221 298)
Balance at 1 April 2018 as restated 2 081 368 051 – – – – (1 818 290 202) 263 077 849 – 263 077 849
Profit for the year – – – – – 21 297 547 21 297 547 – 21 297 547
Other comprehensive income – – – – – – – – –
Total comprehensive income for the year – – – – – 21 297 547 21 297 547 – 21 297 547
Specific repurchase of shares (42 708 858) – – – – – (42 708 858) – (42 708 858)
Shares repurchased from dissenting shareholders (3 343 931) – – – – – (3 343 931) – (3 343 931)
Share-based payment shares included as treasury shares 17 (16 500 000) – – – – – (16 500 000) – (16 500 000)
Share-based payment – – 32 147 – 32 147 – 32 147 – 32 147
Total contributions by and distributions to owners of Company recognised directly in equity
(62 552 789) – 32 147 – 32 147 – (62 520 642) – (62 520 642)
Balance at 31 March 2019 2 018 815 262 – 32 147 – 32 147 (1 796 992 655) 221 854 754 – 221 854 754
Notes 15 16, 31 17 31
PB
T G
RO
UP
• IN
TE
GR
AT
ED
RE
PO
RT
20
19
43

STATEMENT OF CASH FLOWSfor the year ended 31 March 2019
GROUP COMPANY
Rand Notes 2019 2018 2019 2018
Cash flows from operating activities
Cash generated from operations 29 36 526 175 100 372 338 103 751 114 015 041
Interest income 3 812 254 4 166 997 36 587 124 421
Dividend income – 1 868 272 – –
Finance costs (1 208 747) (5 190 937) (7 262) (3 160)
Tax paid (13 637 077) (30 059 131) (203 231) (194 091)
Cash flows of held-for-sale/discontinued operations
1 089 358 – – –
Net cash from operating activities 26 581 963 71 157 539 (70 155) 113 942 211
Cash flows from investing activities
Purchase of property, plant and equipment 4 (1 144 278) (2 017 105) – –
Sale of property, plant and equipment 4 77 477 339 574 – –
Purchase of intangible assets 6 (304 255) (273 046) – –
Loans receivable advanced (2 732 215) (1 941 000) – –
Sale of financial assets – 5 970 405 – –
Repayment of loans with Group companies – – (1 300 000) (42 860 000)
Non-cash movement in other financial assets
– – – (21 229 808)
Receipt of loans with Group companies – – 676 858 7 940 386
Non-cash movement in loans to Group companies
– – – (12 904 687)
Net cash flows of discontinued operations (937 176) – – –
Net cash from investing activities (5 040 447) 2 078 828 (623 142) (69 054 109)
Cash flows from financing activities
Share-based payment advance 15 (16 500 000) – – –
Reduction of share capital 15 – (26 209 633) – –
Shares repurchased from dissenting shareholders
15 (3 343 931) – – –
Dividend paid to non-controlling interests (4 410 000) – – –
Repayment of other financial liabilities – (35 000 000) – –
Non-cash movement in treasury shares – – – (32 474 724)
Non-cash movement in revaluation reserve – – – (11 363 486)
Net cash flows of discontinued operations (351 378) – – –
Acquisition of shares – (8 053 481) – (8 053 481)
Net cash from financing activities (24 605 309) (69 263 114) – (51 891 691)
Total cash movement for the year (3 063 793) 3 973 253 (693 297) (7 003 589)
Cash at the beginning of the year 34 050 659 30 090 060 1 319 432 8 323 021
Effect of exchange rate movement on cash balances
(6 937) (12 654) – –
Total cash at the end of the year 13 30 979 929 34 050 659 626 135 1 319 432
44

NOTES TO THE CONSOLIDATED AND SEPARATE FINANCIAL STATEMENTSfor the year ended 31 March 2019
1. Significant accounting policies The principal accounting policies applied in the
preparation of these consolidated and separate annual financial statements are set out below.
1.1 Basis of preparationThe consolidated and separate annual financial statements have been prepared on the going concern basis in accordance with, and in compliance with, International Financial Reporting Standards (IFRS), the JSE Listings Requirements and International Financial Reporting Interpretations Committee (IFRIC) interpretations issued and effective at the time of preparing these consolidated and separate annual financial statements and the Companies Act, Act 71 of 2008 of South Africa, as amended.
These consolidated and separate annual financial statements comply with the requirements of the SAICA financial reporting guides as issued by the Accounting Practices Committee and the Financial Reporting Pronouncements as issued by the Financial Reporting Standards Council.
The consolidated and separate annual financial statements have been prepared on the historic cost convention, unless otherwise stated in the accounting policies which follow and incorporate the principal accounting policies set out below. They are presented in Rand, which is the Group’s and Company’s functional currency.
These accounting policies are consistent with the previous period, except for the changes set out in note 2.
1.2 ConsolidationBasis of consolidationThe consolidated and separate annual financial statements incorporate the annual financial statements of the Company and all subsidiaries. Subsidiaries are entities which are controlled by the Group.
The Group has control of an entity when it is exposed to or has rights to variable returns from involvement with the entity and it has the ability to affect those returns through using its power over the entity.
Non-controlling interests in the net assets of consolidated subsidiaries are identified and recognised separately from the Group’s interest therein, and are recognised within equity. Losses of subsidiaries attributable to non-controlling interests are allocated to the non-controlling interest even if this results in a debit balance being recognised for non-controlling interest.
Transactions with non-controlling interests that do not result in loss of control are accounted for as equity transactions and are recognised directly in the statement of changes in equity.
The difference between the fair value of consideration paid or received and the movement in non-controlling interest for such transactions is recognised in equity attributable to the owners of the Company.
1.3 Significant judgements and sources of estimation uncertaintyThe preparation of consolidated and separate annual financial statements in conformity with IFRS requires management, from time to time, to make judgements, estimates and assumptions that affect the application of policies and reported amounts of assets, liabilities, income and expenses. These estimates and associated assumptions are based on experience and various other factors that are believed to be reasonable under the circumstances. Actual results may differ from these estimates. The estimates and underlying assumptions are reviewed on an ongoing basis. Revisions to accounting estimates are recognised in the period in which the estimates are revised and in any future periods affected.
Critical judgements in applying accounting policiesThe critical judgements made by management in applying accounting policies, apart from those involving estimations, that have the most significant effect on the amounts recognised in the financial statements, are outlined as follows:
Loan granted to BEE companyThe accounting of the loan advanced to Spalding Investments 10 Proprietary Limited, taking into account the terms of the shareholders’ agreement and the preference share agreement, required judgement and resulted in a conclusion that the loan should be presented as treasury shares.
Key sources of estimation uncertaintyImpairment of financial assetsThe impairment provisions for financial assets are based on assumptions about risk of default and expected loss rates. The Group uses judgement in making these assumptions and selecting the inputs to the impairment calculation, based on the Group’s past history, existing market conditions as well as forward-looking estimates at the end of each reporting period. For details of the key assumptions and inputs used, refer to the individual notes addressing financial assets.
The historical credit loss rates for trade receivables and loans receivable have been very low and management has made the judgement, taking into account forward-looking indicators, that the expected credit loss rates will continue to be at similarly low levels.
Fair value estimationInvestments of the Group are either measured at fair value or disclosure is made of their fair values.
The fair value measurement of the Group’s financial and non-financial assets and liabilities utilises market observable inputs and data as far as possible. Inputs
PB
T G
RO
UP
• IN
TE
GR
AT
ED
RE
PO
RT
20
19
45

NOTES TO THE CONSOLIDATED AND SEPARATE FINANCIAL STATEMENTS [CONTINUED]for the year ended 31 March 2019
used in determining fair value measurements are categorised into different levels based on how observable the inputs used in the valuation technique utilised are (the fair value hierarchy):
• Level 1: Quoted prices in active markets for identical items (unadjusted).
• Level 2: Observable direct or indirect inputs other than Level 1 inputs.
• Level 3: Unobservable inputs (i.e. not derived from market data).
The classification of an item into the above levels is based on the lowest level of the inputs used that has a significant effect on the fair value measurement of the item. Transfers of items between levels are recognised in the period they occur.
Observable market data is used as inputs to the extent that it is available. Qualified external valuers are consulted for the determination of appropriate valuation techniques and inputs.
Information about the specific techniques and inputs of the various assets is disclosed in note 12.
Impairment testing – goodwillThe recoverable amount of the cash-generating units has been determined based on a value-in-use calculation. Key assumptions applied to determine the recoverable amount of the cash-generating units, using the value-in-use calculation relating to sales growth rates, working capital requirements and capital expenditure.
The following assumptions were utilised:
Pre-tax discount rate: 16.4% (2018: 19.05%)Terminal growth rate: 5.5% (2018: 3.00%)Number of years: 4 years (2018: 5 years)
No reasonable possible change is expected in a key assumption used in the value-in-use calculation that would change the value in use to be lower than the carrying value of goodwill.
TaxationEstimates are required in determining the provision for income taxes due to the complexity of legislation. There are many transactions and calculations for which the ultimate tax determination is uncertain during the ordinary course of business. The Group recognises liabilities for anticipated tax audit issues based on estimates of whether additional taxes will be due. Where the final tax outcome of these matters is different from the amounts that were initially recorded, such differences will impact the income tax and deferred tax provisions in the period in which such determination is made.
The Group recognises the net future tax benefit related to deferred income tax assets to the extent that it is probable that the deductible temporary differences will reverse in the foreseeable future. Assessing the recoverability of deferred income tax assets requires
the Group to make significant estimates related to expectations of future taxable income. Estimates of future taxable income are based on forecast cash flows from operations and the application of existing tax laws in each jurisdiction. To the extent that future cash flows and taxable income differ significantly from estimates, the ability of the Group to realise the net deferred tax assets recorded at the end of the reporting period could be impacted.
The deferred tax assets (arising mainly from assessed losses) in two subsidiaries of the Group were not recognised in neither the current nor prior year as management does not anticipate that there will be taxable income in either of these entities in the foreseeable future.
1.4 Property, plant and equipmentProperty, plant and equipment is initially measured at cost. Cost includes all of the expenditure which is directly attributable to the acquisition or construction of the asset.
The useful lives of items of property, plant and equipment have been assessed as follows:
ItemDepreciation method
Average useful life
Furniture and fixtures Straight line 6 years
Office equipment Straight line 5 years
Computer equipment Straight line 3 years
The residual value, useful life and depreciation method of each asset are reviewed at the end of each reporting year. If the expectations differ from previous estimates, the change is accounted for prospectively as a change in accounting estimate.
The depreciation charge for each year is recognised in profit or loss.
Impairment tests are performed on property, plant and equipment when there is an indicator that they may be impaired. When the carrying amount of an item of property, plant and equipment is assessed to be higher than the estimated recoverable amount, an impairment loss is recognised immediately in profit or loss to bring the carrying amount in line with the recoverable amount.
1.5 Intangible assetsIntangible assets are initially recognised at cost.
Amortisation is provided to write down the intangible assets, on a straight-line basis, to a nil value as follows:
Item Useful life
Computer software 2 years
Internally developed software 5 years
Other intangible assets 5 years
46

1.6 Investments in subsidiariesInvestments in subsidiaries are carried at cost less any accumulated impairment losses. This excludes investments which are held for sale and are consequently accounted for in accordance with IFRS 5 Non-current Assets Held for Sale and Discontinued Operations.
1.7 Financial instrumentsFinancial instruments held by the Group are classified in accordance with the provisions of IFRS 9 Financial Instruments.
Broadly, the classification possibilities, which are adopted by the Group, as applicable, are as follows:
• Financial assets which are equity instruments: – fair value through profit or loss; or – fair value through other comprehensive income.
• Financial assets which are debt instruments: – amortised cost (This category applies only
when the contractual terms of the instrument give rise, on specified dates, to cash flows that are solely payments of principal and interest on principal, and where the instrument is held under a business model whose objective is met by holding the instrument to collect contractual cash flows).
• Financial liabilities: – amortised cost.
Note 35 – Financial Instruments and risk management presents the financial instruments held by the Group based on their specific classifications.
The specific accounting policies for the classification, recognition and measurement of each type of financial instrument held by the Group are presented below:
Financial assetsAmortised costThese assets arise principally from the provision of services to clients (e.g. trade receivables), but also incorporate other types of financial assets where the objective is to hold these assets in order to collect contractual cash flows and the contractual cash flows are solely payments of principal and interest. They are initially recognised at fair value plus transaction costs that are directly attributable to their acquisition or issue, and are subsequently carried at amortised cost using the effective interest rate method, less provision for impairment.
Impairment provisions for current receivables are recognised based on the simplified approach within IFRS 9 using a provision matrix in the determination of the lifetime expected credit losses. During this process the probability of the non-payment of the trade receivables is assessed. This probability is then multiplied by the amount of the expected loss arising from default to determine the lifetime expected credit
loss for the trade receivables. For trade receivables, which are reported net, such provisions are recorded in a separate provision account with the loss being recognised in the consolidated and separate statement of comprehensive income. On confirmation that the trade receivable will not be collectible, the gross carrying value of the asset is written off against the associated provision.
Impairment provisions for loans to related parties are recognised based on a forward-looking expected credit loss model. The methodology used to determine the amount of the provision is based on whether there has been a significant increase in credit risk since initial recognition of the financial asset. For those where the credit risk has not increased significantly since initial recognition of the financial asset, twelve-month expected credit losses along with gross interest income are recognised.
For those for which credit risk has increased significantly, lifetime expected credit losses along with the gross interest income are recognised. For those that are determined to be credit impaired, lifetime expected credit losses along with interest income on a net basis are recognised.
The Group’s financial assets measured at amortised cost comprise trade and other receivables, and cash and cash equivalents in the consolidated and separate statement of financial position. Cash and cash equivalents includes cash in hand and – for the purpose of the statement of cash flows – bank overdrafts. Bank overdrafts are shown within loans and borrowings in current liabilities on the consolidated and separate statement of financial position.
Fair value through profit and lossThe Group has an investment in an unlisted entity which is not accounted for as a subsidiary, an associate or jointly controlled entity. For this investment, the Group classified the investment at fair value through profit and loss as the Group considers this measurement to be the most representative of the business model for this asset. It is carried at fair value with changes in fair value recognised in profit or loss in other operating gains or losses.
Fair value through other comprehensive income The Group has an investment in an unlisted entity which is not accounted for as a subsidiary, an associate or jointly controlled entity. For this investment the Group has made an irrevocable election to classify the investment at fair value through other comprehensive income as the Group considers this measurement to be the most representative of the business model for this asset. It is carried at fair value with changes in fair value recognised in other comprehensive income and accumulated in the revaluation reserve. Upon disposal any balance within the revaluation reserve is reclassified directly to retained earnings and is not reclassified to profit or loss.
PB
T G
RO
UP
• IN
TE
GR
AT
ED
RE
PO
RT
20
19
47

NOTES TO THE CONSOLIDATED AND SEPARATE FINANCIAL STATEMENTS [CONTINUED]for the year ended 31 March 2019
Financial liabilitiesThe Group classifies its financial liabilities into one category, being amortised cost.
Amortised costFinancial liabilities include bank overdrafts and trade and other payables and are subsequently measured at amortised cost using the effective interest rate method, which ensures that any interest expense over the period to repayment is at a constant rate on the balance of the liability carried in the consolidated and separate statement of financial position.
1.8 Financial instruments: IAS 39 comparativesClassificationThe Group classifies financial assets and financial liabilities into the following categories:
• financial assets at fair value through profit or loss – designated;
• loans and receivables; and
• financial liabilities measured at amortised cost.
Classification depends on the purpose for which the financial instruments were obtained/incurred and takes place at initial recognition. Classification is reassessed on an annual basis, except for derivatives and financial assets designated as at fair value through profit or loss, which shall not be classified out of the fair value through profit or loss category.
Initial recognition and measurementFinancial instruments are recognised initially when the Group becomes a party to the contractual provisions of the instruments.
The Group classifies financial instruments, or their component parts, on initial recognition as a financial asset, a financial liability or an equity instrument in accordance with the substance of the contractual arrangement.
Financial instruments are measured initially at fair value, except for equity investments for which a fair value is not determinable, which are measured at cost and are classified as available-for-sale financial assets.
For financial instruments which are not at fair value through profit or loss, transaction costs are included in the initial measurement of the instrument.
Transaction costs on financial instruments at fair value through profit or loss are recognised in profit or loss.
Subsequent measurementFinancial instruments at fair value through profit or loss are subsequently measured at fair value, with gains and losses arising from changes in fair value being included in profit or loss for the period.
Dividend income is recognised in profit or loss as part of other income when the Group’s right to receive payment is established.
Loans and receivables are subsequently measured at amortised cost, using the effective interest method, less accumulated impairment losses.
Financial liabilities at amortised cost are subsequently measured at amortised cost, using the effective interest method.
DerecognitionFinancial assets are derecognised when the rights to receive cash flows from the investments have expired or have been transferred and the Group has transferred substantially all risks and rewards of ownership.
Impairment of financial assetsAt each reporting date the Group assesses all financial assets, other than those at fair value through profit or loss, to determine whether there is objective evidence that a financial asset or group of financial assets has been impaired.
For amounts due to the Group, significant financial difficulties of the debtor, probability that the debtor will enter bankruptcy and default of payments are all considered indicators of impairment.
Impairment losses are recognised in profit or loss.
Impairment losses are reversed when an increase in the financial asset’s recoverable amount can be related objectively to an event occurring after the impairment was recognised, subject to the restriction that the carrying amount of the financial asset at the date that the impairment is reversed shall not exceed what the carrying amount would have been had the impairment not been recognised.
Reversals of impairment losses are recognised in profit or loss.
Where financial assets are impaired through use of an allowance account, the amount of the loss is recognised in profit or loss within operating expenses. When such assets are written off, the write-off is made against the relevant allowance account. Subsequent recoveries of amounts previously written off are credited against operating expenses.
Loans to/(from) Group companiesThese include loans to and from subsidiaries and are recognised initially at fair value plus direct transaction costs.
Loans to Group companies are classified as loans and receivables.
Loans from Group companies are classified as financial liabilities measured at amortised cost.
Trade and other receivablesTrade receivables are measured at initial recognition at fair value, plus direct transaction costs, and are subsequently measured at amortised cost using the effective interest rate method. Appropriate allowances for estimated irrecoverable amounts are recognised in
48

profit or loss when there is objective evidence that the asset is impaired. Significant financial difficulties of the debtor, probability that the debtor will enter bankruptcy or financial reorganisation, and default or delinquency in payments (more than 30 days overdue) are considered indicators that the trade receivable is impaired. The allowance recognised is measured as the difference between the asset’s carrying amount and the present value of estimated future cash flows discounted at the effective interest rate computed at initial recognition.
The carrying amount of the asset is reduced through the use of an allowance account and the amount of the loss is recognised in profit or loss within operating expenses. When a trade receivable is uncollectible, it is written off against the allowance account for trade receivables. Subsequent recoveries of amounts previously written off are credited against operating expenses in profit or loss.
Trade and other receivables are classified as loans and receivables.
Trade and other payablesTrade payables are initially measured at fair value and are subsequently measured at amortised cost using the effective interest rate method.
Cash and cash equivalentsCash and cash equivalents comprise cash on hand and demand deposits. These are initially and subsequently recorded at fair value.
Bank overdraft and borrowingsBank overdrafts and borrowings are initially measured at fair value and are subsequently measured at amortised cost using the effective interest rate method. Any difference between the proceeds (net of transaction costs) and the settlement or redemption of borrowings is recognised over the term of the borrowings in accordance with the Group’s accounting policy for borrowing costs.
1.9 TaxCurrent tax assets and liabilitiesCurrent tax for current and prior periods is, to the extent unpaid, recognised as a liability. If the amount already paid in respect of current and prior periods exceeds the amount due for those periods, the excess is recognised as an asset.
Current tax liabilities (assets) for the current and prior periods are measured at the amount expected to be paid to (recovered from) the tax authorities, using the tax rates (and tax laws) that have been enacted or substantively enacted by the end of the reporting period.
Deferred tax assets and liabilitiesA deferred tax liability is recognised for all taxable temporary differences, except to the extent that the
deferred tax liability arises from the initial recognition of an asset or liability in a transaction which at the time of the transaction, affects neither accounting profit nor taxable profit (tax loss).
A deferred tax asset is recognised for all deductible temporary differences to the extent that it is probable that taxable profit will be available against which the deductible temporary difference can be utilised. A deferred tax asset is not recognised when it arises from the initial recognition of an asset or liability in a transaction at the time of the transaction, affects neither accounting profit nor taxable profit (tax loss).
A deferred tax asset is recognised for the carry forward of unused tax losses to the extent that it is probable that future taxable profit will be available against which the unused tax losses can be utilised.
Deferred tax assets and liabilities are measured at the tax rates that are expected to apply to the period when the asset is realised or the liability is settled, based on tax rates (and tax laws) that have been enacted or substantively enacted by the end of the reporting period.
Tax expensesCurrent and deferred taxes are recognised as income or an expense and included in profit or loss for the period, except to the extent that the tax arises from:
• a transaction or event which is recognised, in the same or a different period, to other comprehensive income; or
• a business combination.
Current tax and deferred taxes are charged or credited to other comprehensive income if the tax relates to items that are credited or charged, in the same or a different period, to other comprehensive income.
Current tax and deferred taxes are charged or credited directly to equity if the tax relates to items that are credited or charged, in the same or a different period, directly in equity.
1.10 LeasesA lease is classified as a finance lease if it transfers substantially all the risks and rewards incidental to ownership. A lease is classified as an operating lease if it does not transfer substantially all the risks and rewards incidental to ownership.
Operating leases – lesseeOperating lease payments are recognised as an expense on a straight-line basis over the lease term. The difference between the amounts recognised as an expense and the contractual payments are recognised as an operating lease liability. This liability is not discounted.
Any contingent rents are expensed in the period they are incurred.
PB
T G
RO
UP
• IN
TE
GR
AT
ED
RE
PO
RT
20
19
49

NOTES TO THE CONSOLIDATED AND SEPARATE FINANCIAL STATEMENTS [CONTINUED]for the year ended 31 March 2019
1.11 Non-current assets (disposal groups) held for saleNon-current assets and disposal groups are classified as held for sale or held for distribution when their carrying amount will be recovered principally through a sale transaction or distribution rather than through continuing use. Non-current assets and disposal groups are classified in this category only when the sale or distribution is considered to be highly probable.
Non-current assets (or disposal groups) held for sale (distribution to owners) are measured at the lower of their carrying amount and fair value less costs to sell (distribute).
1.12 Treasury sharesConsideration paid for the purchase of treasury shares is recognised directly in equity. The cost of treasury shares held is presented together with share capital. In the prior-year treasury shares were presented as a separate reserve (“treasury shares”). Any excess of the consideration received on the sale of treasury shares over the weighted average cost of the shares sold is credited to retained earnings.
Included in treasury shares are shares held by a BEE company called Spalding Investments 10 Proprietary Limited. A loan has been advanced to this company to purchase shares in PBT Group Limited with the only recourse being the shares in PBT Group Limited. This loan receivable is not recognised as a financial asset but rather as treasury shares until the loan has been repaid according to the terms and conditions of the transaction.
1.13 Share capital and equityAn equity instrument is any contract that evidences a residual interest in the assets of an entity after deducting all of its liabilities.
Ordinary shares are classified as equity.
1.14 Earnings per shareEarnings per share is calculated on the weighted average number of shares in issue, net of treasury shares, in respect of the year and is based on profit attributable to ordinary shareholders. Headline earnings per share is calculated in terms of the requirements set out in Circular 04/2018 issued by SAICA.
1.15 Discontinued operationsA discontinued operation is a component of the Group, the operations and cash flows of which has been disposed of or is classified as held for sale, and:
• represents a separate major line of business or geographical area of operations;
• is part of a single co-ordinated plan to dispose of this separate major line if business or geographical area of operations; or
• is a subsidiary acquired exclusively with a view to resell.
Classification as a discontinued operation occurs on disposal or when the operation meets the criteria to be classified as held for sale, if earlier.
When an operation is classified as a discontinued operation, the comparative statement of profit or loss and other comprehensive income is restated as if the operations had been discontinued from the commencement of the comparative year.
1.16 Employee benefitsShort-term employee benefitsThe cost of short-term employee benefits, (those payable within 12 months after the service is rendered, such as paid vacation leave and sick leave, bonuses, and non-monetary benefits such as medical care), are recognised in the period in which the service is rendered and are not discounted.
The expected cost of compensated absences is recognised as an expense as the employees render services that increase their entitlement or, in the case of non-accumulating absences, when the absence occurs.
The expected cost of profit sharing and bonus payments is recognised as an expense when there is a legal or constructive obligation to make such payments as a result of past performance.
Defined contribution plansA defined contribution plan is a post employment benefit plan under which an entity pays fixed contributions into a separate legal entity and will have no legal or constructive obligation to pay further amounts. Obligations for contributions to these funds are recognised in profit or loss in the period during which services are rendered by employees.
1.17 GoodwillGoodwill is initially measured at cost, being the excess of the consideration transferred over the Group’s net identifiable assets acquired and liabilities assumed. If this consideration is lower than the fair value of the net assets of the subsidiary acquired, the difference is recognised in profit or loss. After initial recognition goodwill is measured at cost less any accumulated impairment losses.
Goodwill is capitalised as an intangible asset with any impairment in carrying value being charged to the consolidated statement of comprehensive income.
Goodwill that arises on the acquisition of subsidiaries is presented separately.
1.18 Revenue from contracts with customersThe Group recognises revenue from the following major sources:• time and material contracts;
50

• fixed price contracts;• project-based contracts;• software licence sales (off the shelf); and• usage-based licences.
Performance obligations and timing of revenue recognitionThe Group provides data and analytics solutions and services to various clients.
Revenue from time and material contracts as well as fixed price contracts is recognised on an overtime basis, as the client simultaneously receives and consumes the service that the Company provides. Revenue from providing services is recognised in the accounting period in which the service is rendered, i.e. when the performance obligation of the contract is met.
For time and material contracts, revenue is recognised as and when the service is provided, based on the number of hours worked per resource. For fixed price contracts, revenue is recognised monthly at a fixed amount per the contract as and when the service is provided. For both these types of contracts the Group has elected to take advantage of the practical expedient available in paragraph B16 of IFRS 15, because the amount invoiced corresponds directly with the value to the client of the Group’s performance completed to date.
No significant judgements have been made when determining the performance obligations and timing of recognition of revenue.
Project contracts are recognised on an overtime basis at an amount agreed upon in the contract between the Group and the client. Each project comprises a single performance obligation. The project satisfies the performance obligation over time as the Group’s performance does not create an asset with an alternative use and the Group has an enforceable right to payment for the performance completed to date.
The Group sells standard off-the-shelf software licences to clients. These software licences are sold separately and are not included as part of any service contract.
Software licence revenue is therefore recognised at a point in time when control of the good is transferred to the client. There is limited judgement needed in identifying the point when control passes; as transfer occurs once the software is activated for the client.
Revenue from usage based licenses is recognised on an over time basis. The Group has elected to use the practical expedient available in paragraph B16 of IFRS 15 as the usage based license fee invoiced monthly corresponds to the value received by the client of the performance completed to date.
Payment terms for the majority of the contracts are 30 days from date of statement. The Group does not expect to have any contracts where the period between the transfer of the services to the client and payment by the client exceeds one year. As a result the Group does not adjust any of the transaction prices for a significant financing component.
Due to the nature of the Group’s revenue, no obligations exist for returns or refunds.
Determining the transaction price and allocating amounts to performance obligationsThe transaction price is determined based on the type of revenue contract.
Time and material contracts have predefined rates per hour per resource, as stipulated in the contract. These rates per hour are considered by management to be the stand-alone rates applicable to each type of resource.
Fixed price contracts have predetermined monthly amounts stipulated in each contract and therefore this amount reflects the transaction price.
Time and material and fixed price contracts do not contain elements of variable consideration such as volume rebates, discounts or penalties, etc.
Project contracts have a predetermined price per contract which is agreed to between the Group and the client.
The transaction price for software sales is the amount per invoice.
Usage-based licence contracts are calculated with reference to the number of beneficiaries per the medical scheme or based on a sliding scale of the clients’ turnover.
For all contracts there is no judgement involved in allocating the transaction price to the performance obligations.
1.19 Revenue: IAS 18 comparativeRevenue is recognised to the extent that it is probable that the economic benefits will flow to the Group and the revenue can be reliably measured, regardless of when the payment is being made. Revenue is measured at the fair value of the consideration received or receivable, taking into account contractually defined terms of payment and excluding taxes.
Revenue comprises service fee income, interest income and dividend income.
Service fee income is recognised when the outcome of a transaction involving the rendering of services can be estimated reliably. The revenue is then recognised by reference to the stage of completion of the transaction at the end of the reporting period.
PB
T G
RO
UP
• IN
TE
GR
AT
ED
RE
PO
RT
20
19
51

NOTES TO THE CONSOLIDATED AND SEPARATE FINANCIAL STATEMENTS [CONTINUED]for the year ended 31 March 2019
The outcome of a transaction can be reliably estimated when all of the following conditions are satisfied:
• The amount of revenue can be estimated reliably.
• It is probable that the economic benefits associated with the transaction will flow to the Company.
• The stage of completion of the transaction at the end of the reporting period can be measured reliably.
• The costs incurred for the transition and the cost to completion can be measured reliably.
Stage of completion is determined as follows:
• Income from time and material contracts is recognised at the contractual rates as labour hours and direct expenses are incurred.
• Income from fixed price contracts which run for a set period of time and where services are performed by an indeterminate number of acts is recognised on a straight-line basis over the specified period.
• Income from large customised projects’ stage of completion is measured relative to the milestones achieved as specified in the contract.
When the outcome of the transaction involving the rendering of services cannot be estimated reliably, revenue shall only be recognised to the extent of the expenses incurred and recognised that are recoverable.
Income is measured at the fair value of the consideration received or receivable, net of value-added tax.
1.20 Cost of salesThe related cost of providing services recognised as revenue in the current period is included in cost of sales.
Contract costs comprise:
• costs that relate directly to the specific contract;
• costs that are attributable to contract activity in general and can be allocated to the contract; and
• such other costs as are specifically chargeable to the client under the terms of the contract.
1.21 Borrowing costsBorrowing costs are recognised as an expense in the period in which they are incurred.
1.22 Translation of foreign currenciesForeign currency transactionsA foreign currency transaction is recorded, on initial recognition in Rand, by applying to the foreign currency amount the spot exchange rate between the
functional currency and the foreign currency at the date of the transaction.
At the end of the reporting period:
• foreign currency monetary items are translated using the closing rate.
Exchange differences arising on the settlement of monetary items or on translating monetary items at rates different from those at which they were translated on initial recognition during the period or in previous consolidated and separate annual financial statements are recognised in profit or loss in the period in which they arise.
When a gain or loss on a non-monetary item is recognised to other comprehensive income and accumulated in equity, any exchange component of that gain or loss is recognised to other comprehensive income and accumulated in equity. When a gain or loss on a non-monetary item is recognised in profit or loss, any exchange component of that gain or loss is recognised in profit or loss.
Cash flows arising from transactions in a foreign currency are recorded in Rand by applying to the foreign currency amount the exchange rate between the Rand and the foreign currency at the date of the cash flow.
Investments in subsidiaries, joint ventures and associatesThe results and financial position of a foreign operation are translated into the functional currency using the following procedures:
• assets and liabilities for each statement of financial position presented are translated at the closing rate at the date of that statement of financial position;
• income and expenses for each item of profit or loss are translated at exchange rates at the dates of the transactions; and
• all resulting exchange differences are recognised to other comprehensive income and accumulated as a separate component of equity.
Exchange differences arising on a monetary item that forms part of a net investment in a foreign operation are recognised initially to other comprehensive income and accumulated in the translation reserve. They are recognised in profit or loss as a reclassification adjustment through to other comprehensive income on disposal of net investment.
Any goodwill arising on the acquisition of a foreign operation and any fair value adjustments to the carrying amounts of assets and liabilities arising on the acquisition of that foreign operation are treated as assets and liabilities of the foreign operation.
52

The cash flows of a foreign subsidiary are translated at the exchange rates between the functional currency and the foreign currency at the dates of the cash flows.
1.23 Interest and dividend incomeInterest income comprises interest income on funds invested. Interest income is recognised as it accrues in profit or loss, using the effective interest method.
Dividend income is recognised as income when the Group’s right to receive payments is established.
1.24 Segmental reportingOperating segments are reported in a manner consistent with the internal reporting provided to the chief operating decision-maker. The chief operating decision-maker, who is responsible for allocating resources and assessing performance of the operating segments, has been identified as the executive management.
Segment results include revenue and expenses directly attributable to a segment and the relevant portion of enterprise revenue and expenses that can be allocated on a reasonable basis to a segment, whether from external transactions with other Group segments. Segment results are determined before any adjustments for non-controlling interests.
Segment assets and liabilities comprise the operating assets and liabilities that are directly attributable to the segment or can be allocated to the segment on a reasonable basis. Segment assets are determined after deducting related allowances that are reported as direct offsets in the Group’s statement of financial position. Capital expenditure represents the total costs incurred during the period to acquire segment assets that are expected to be used during more than one period, namely property, plant and equipment, and intangible assets other than goodwill.
Business segments comprise the following, which are aggregated upon consolidation:
• South Africa;
• Australia; and
• Europe.
Revenue comprises sales to clients and services rendered to clients.
2. Changes in accounting policyThe consolidated and separate annual financial statements have been prepared in accordance with International Financial Reporting Standards on a basis consistent with the prior year except for the adoption of the following new or revised standards.
Application of IFRS 9 Financial InstrumentsIn the current year the Group and the Company have applied IFRS 9 Financial Instruments (IFRS 9) (as revised in July 2014) and the related consequential amendments to other IFRS. IFRS 9 replaces IAS 39 Financial Instruments: Recognition and Measurement (IAS 39) and introduces new requirements for the classification and measurement of financial assets and financial liabilities, impairment for financial assets and general hedge accounting. Details of these new requirements as well as their impact on the Group’s financial statements are described below.
The Group and the Company have applied IFRS 9 in accordance with the transition provisions set out in IFRS 9.
Classification and measurement of financial assetsThe date of initial application (i.e. the date on which the Group has assessed its existing financial assets and financial liabilities in terms of the requirements of IFRS 9) is 1 April 2018. Accordingly, the Group has applied the requirements of IFRS 9 to instruments that have not been derecognised as at 1 April 2018 and has not applied the requirements to instruments that have already been derecognised as at 1 April 2018. Comparatives in relation to instruments that have not been derecognised as at 1 April 2018 have not been restated. Instead, cumulative adjustments to retained earnings have been recognised in retained earnings as at 1 April 2018.
All recognised financial assets that are within the scope of IFRS 9 are required to be subsequently measured at amortised cost or fair value on the basis of the entity’s business model for managing the financial assets and the contractual cash flow characteristics of the financial assets.
The measurement requirements are summarised below:
• amortised cost;
• fair value through other comprehensive income equity instrument; and
• fair value through profit or loss (FVPL).
The classification of financial assets under IFRS 9 is generally based on the business model in which a financial asset is managed and its contractual cash flow characteristics.
The Directors reviewed and assessed the Group’s existing financial assets as at 1 April 2018 based on the facts and circumstances that existed at that date.
PB
T G
RO
UP
• IN
TE
GR
AT
ED
RE
PO
RT
20
19
53

NOTES TO THE CONSOLIDATED AND SEPARATE FINANCIAL STATEMENTS [CONTINUED]for the year ended 31 March 2019
The following tables show the adjustments recognised in opening retained income on adoption of IFRS 9, for each line item of the financial statements affected:
Notes Adjustments
31 March 2018As originally presented IFRS 9
1 April 2018As restated
GROUP
STATEMENT OF FINANCIAL POSITION
ASSETS
Non-current assets
Property, plant and equipment 6 030 533 – 6 030 533
Goodwill 135 666 420 – 135 666 420
Intangible assets 675 082 – 675 082
Other financial assets (a), (b) 25 785 812 (86 145) 25 699 667
Deferred tax (c) 2 139 120 675 416 2 814 536
170 296 967 589 271 170 886 238
Current assets
Trade and other receivables (a) 91 270 083 (5 282 269) 85 987 814
Other financial assets 3 206 276 – 3 206 276
Current tax receivable 1 815 649 – 1 815 649
Cash and cash equivalents 34 202 850 – 34 202 850
130 494 858 (5 282 269) 125 212 589
Non-current assets held for sale and assets of disposal group
57 120 959 – 57 120 959
Total assets 357 912 784 (4 692 998) 353 219 786
EQUITY AND LIABILITIES
Equity
Equity attributable to equity holders of the parent
Share capital 39 65 358 941 – 65 358 941
Reserves 39 12 909 171 – 12 909 171
Retained earnings (a), (c) 221 403 368 (4 692 998) 216 710 370
299 671 480 (4 692 998) 294 978 482
Non-controlling interest 6 915 887 – 6 915 887
306 587 367 (4 692 998) 301 894 369
Liabilities
Non-current liabilities
Deferred tax 183 984 – 183 984
Current liabilities
Trade and other payables 34 058 359 – 34 058 359
Current tax payable 1 774 418 – 1 774 418
Payroll-related accruals 8 584 433 – 8 584 433
Bank overdraft 152 191 – 152 191
44 569 401 – 44 569 401
Liabilities of disposal group 6 572 032 – 6 572 032
Total liabilities 51 325 417 – 51 325 417
Total equity and liabilities 357 912 784 (4 692 998) 353 219 786
54

Note Adjustments
31 March 2018As originally presented IFRS 9
1 April 2018As restated
COMPANY
STATEMENT OF FINANCIAL POSITION
ASSETS
Non-current assets
Investment in subsidiaries 76 564 004 – 76 564 004
Loans to Group companies (a) 140 352 010 (1 403 520) 138 948 490
Deferred tax (c) – 980 657 980 657
216 916 014 (422 863) 216 493 151
Current assets
Trade and other receivables (a) 2 798 435 (2 798 435) –
Cash and cash equivalents 1 319 432 – 1 319 432
4 117 867 (2 798 435) 1 319 432
Non-current assets held for sale and assets of disposal groups
50 548 926 – 50 548 926
Total assets 271 582 807 (3 221 298) 268 361 509
EQUITY AND LIABILITIES
Equity
Equity attributable to equity holders of the parent
Share capital 39 2 081 368 051 – 2 081 368 051
Retained earnings (a), (c) (1 815 068 904) (3 221 298) (1 818 290 202)
266 299 147 (3 221 298) 263 077 849
Non-controlling interest – – –
266 299 147 (3 221 298) 263 077 849
Liabilities
Current liabilities
Trade and other payables 4 856 989 – 4 856 989
Current tax payable 426 671 – 426 671
Total liabilities 5 283 660 – 5 283 660
Total equity and liabilities 271 582 807 (3 221 298) 268 361 509
PB
T G
RO
UP
• IN
TE
GR
AT
ED
RE
PO
RT
20
19
55

NOTES TO THE CONSOLIDATED AND SEPARATE FINANCIAL STATEMENTS [CONTINUED]for the year ended 31 March 2019
The nature of the adjustments resulting from the adoption of IFRS 9 Financial Instruments are described below:
IFRS 9 replace IAS 39 Financial Instruments: Recognition and Measurement (IAS 39), and has had a significant effect on the Group in the following areas:
(a) The Group and Company applied the expected credit loss model when calculating impairment losses on its financial assets measured at amortised costs (such as trade and other receivables, loans to group companies and loans and receivables included in other financial assets (both current and non-current)). This resulted in increased impairment provisions and greater judgement due to the need to factor in forward-looking information when estimating the appropriate amount of provisions. In applying IFRS 9 the Group and Company considered the probability of a default occurring over the contractual life of its trade receivables and loans and receivables included in other financial asset balances on initial recognition of those assets. Under the existing incurred loss model each trade and other receivable and loans and receivables included in other financial asset was assessed individually to determined if a loss has incurred. The bad debts for the Group recognised was R235 437. Under the new model applied to all trade and other receivables and loans and receivables included in other financial assets these amounts for the Group increased to R5 282 269 and R86 145, respectively as at 1 April 2018 based on the 31 March 2018 figures and was accounted for directly in retained earnings. The Company under the new model applied to loans to Group companies and to all trade and other receivables increased from RNil to R1 403 520 and R2 798 435, respectively as at 1 April 2018 based on the 31 March 2018 figures and was accounted for directly in retained earnings.
(b) Included in other financial assets are two investments that was previously accounted at cost. With the application of IFRS 9 the categories changed for each of the investments. The investment in All Claims Proprietary Limited is now classified as at fair value through profit or loss (FVPL) and the investment in Zuuse Limited (previously Progressclaim.com Limited) is now classified as at fair value through other comprehensive income. This has resulted in a change in the measurement basis.
(c) The expected credit loss allowance balances gave rise to deductible temporary differences and the recognition of a deferred tax asset. The income statement deferred tax credit has been accounted for directly in retained earnings.
The Group and the Company have chosen not to restate comparatives on adoption of IFRS 9 and, therefore, these changes have been processed at the date of initial recognition (i.e. 1 April 2018), and presented in the statement of changes in equity.
Application of IFRS 15 Revenue from Contracts with CustomersIn the current year the Group has applied IFRS 15 Revenue from Contracts with Customers (as revised in April 2016) and the related consequential amendments to other IFRS. IFRS 15 replaces IAS 11 Construction Contracts, IAS 18 Revenue as well as various interpretations previously issued by the IFRS Interpretations Committee.
IFRS 15 introduces a five-step approach to revenue recognition. Far more prescriptive guidance has been added in IFRS 15 to deal with specific scenarios. Details of these new requirements as well as their impact on the Group financial statements are described below. Refer to the revenue accounting policy for additional details.
The Group has applied IFRS 15 with an initial date of application of 1 April 2018 in accordance with the cumulative effect method, by recognising the cumulative effect of initially applying IFRS 15 as an adjustment to the opening balance of equity at 1 April 2018. The comparative information has therefore not been restated.
Under IAS 18 Revenue, the Company recognised revenue on an invoice basis, with the amount of revenue recognised being dependent on the contract type. Project revenue was recognised as revenue upon completion of each milestone.
Under IFRS 15 Revenue from Contracts with Customers, management has elected to apply the practical expedient available in paragraph B16 for all applicable contract types. As such, the manner of revenue recognition has not changed from the method applied under IAS 18.
Therefore there has been no change in the revenue amount recognised for the prior year and consequently there is no cumulative adjustment required.
56

3. New standards and interpretations3.1 Standards and interpretations not yet effective
The Group has chosen not to early adopt the following standards and interpretations, which have been published and are mandatory for the Group’s accounting periods beginning on or after 1 April 2019 or later periods:
Standard/Interpretation:Effective date: Years beginning on or after Expected impact:
IAS 1 Presentation of Financial Statements 1 January 2020 Unlikely there will be a material impact
IAS 8 Accounting Policies, Changes in Accounting Estimates and Errors
1 January 2020 Unlikely there will be a material impact
Prepayment Features with Negative Compensation Amendment to IFRS 9
1 January 2019 Unlikely there will be a material impact
Amendments to IAS 12 Income Taxes: Annual Improvements to IFRS 2015 – 2017 cycle
1 January 2019 Unlikely there will be a material impact
Amendments to IAS 23 Borrowing Costs: Annual Improvements to IFRS 2015 – 2017 cycle
1 January 2019 Unlikely there will be a material impact
Uncertainty over Income Tax Treatments 1 January 2019 Unlikely there will be a material impact
IFRS 16 Leases 1 January 2019 Expected impact is described below
Management has assessed the impact of “IFRS 16: Leases” on the current annual financial statements. Management’s assessment is that the impact will be material to certain balances on the statement of financial position and line items on the statement of comprehensive income. The main impact is particularly in relation to the recognition of “right-of-use” assets and lease liabilities that were previously treated as operating leases. As such, changes will be noted under property, plant and equipment, operating lease liabilities, depreciation, lease rentals on operating lease and finance costs. Key statement of financial position metrics such as leverage and finance ratios, debt covenants and statement of profit or loss and other comprehensive income metrics, such as earnings before interest, taxes, depreciation and amortisation (EBITDA), will be impacted.
Management anticipates that the cumulative effect transition method will be applied on initial application of IFRS 16 in the next financial year. The aggregate impact of the initial application of IFRS 16 on the Group’s consolidated and separate annual financial statements is expected to be as follows:
Statement of profit or loss and other comprehensive income for the year 31 March 2020
Net movement due to change in:
Depreciation 5 741 620
Interest expense 2 129 142
Lease expense (7 285 845)
Deferred tax expense (163 777)
421 140
Statement of financial position for the year ended 31 March 2020
Right-of-use asset 23 029 912
Right-of-use asset – accumulated depreciation (5 741 620)
Lease liability (17 873 209)
Deferred tax 163 777
(421 140)
PB
T G
RO
UP
• IN
TE
GR
AT
ED
RE
PO
RT
20
19
57

NOTES TO THE CONSOLIDATED AND SEPARATE FINANCIAL STATEMENTS [CONTINUED]for the year ended 31 March 2019
4. Property, plant and equipment2019 2018
Rand CostAccumulated depreciation
Carrying value Cost
Accumulated depreciation
Carrying value
GROUP
Computer equipment 16 687 826 (14 941 503) 1 746 323 16 319 607 (13 555 705) 2 763 902
Furniture and fixtures 4 978 878 (2 505 678) 2 473 200 5 582 892 (2 328 008) 3 254 884
Office equipment 231 301 (203 682) 27 619 183 831 (172 084) 11 747
Total 21 898 005 (17 650 863) 4 247 142 22 086 330 (16 055 797) 6 030 533
Reconciliation of property, plant and equipment
RandOpening balance Additions Disposals Transfers
Foreignexchange
movements Depreciation Total
GROUP
2019
Computer equipment 2 763 902 966 560 (46 095) – – (1 938 044) 1 746 323
Furniture and fixtures 3 254 884 111 272 (383 177) (17 491) – (492 288) 2 473 200
Office equipment 11 747 66 446 (39) 17 491 – (68 026) 27 619
6 030 533 1 144 278 (429 311) – – (2 498 358) 4 247 142
2018
Computer equipment 4 041 851 1 503 000 (336 049) – – (2 444 900) 2 763 902
Furniture and fixtures 3 655 690 406 274 – – 14 711 (821 791) 3 254 884
Office equipment 94 444 107 831 – – 19 786 (210 314) 11 747
7 791 985 2 017 105 (336 049) – 34 497 (3 477 005) 6 030 533
A register containing the information required by regulation 25(3) of the Companies Regulations, 2011 is available for inspection at the registered office of the Company.
58

5. Goodwill2019 2018
Rand CostAccumulated
impairmentCarrying
value CostAccumulated
impairmentCarrying
value
GROUP
Goodwill 285 572 420 (149 906 000) 135 666 420 285 572 420 (149 906 000) 135 666 420
Reconciliation of goodwill
2019 2018
RandOpening balance
Impairment loss Total
Opening balance
Impairment loss Total
GROUP
Goodwill 135 666 420 – 135 666 420 253 927 313 (118 260 893) 135 666 420
The goodwill on the statement of financial position arose from the reverse acquisition of PBT Group Limited by the Prescient Holdings Group of companies (Prescient Holdings) effective 1 September 2012. According to IFRS 3 Business Combinations, PBT Group Limited was treated as the accounting acquiree and goodwill on the PBT Group of companies arose as a result.
During the 2017 financial year the financial services segment of the business, being Prescient Holdings, was disposed of by the Group, leaving the PBT Group of companies and Prescient Capital Group of companies. PBT Group comprises IT services. With the 2012 goodwill calculation and allocation, the PBT Group of companies was seen as a separate cash-generating unit (CGU).
In terms of IFRS the Group performs an annual impairment test on goodwill based on CGUs. The recoverable amount of each CGU to which goodwill is allocated has been determined based on the value-in-use calculation which uses cash flow projections on financial forecasts.
Management based its cash flow projections on historical information and taking into account the exit of the Middle East/Africa business. A steady and prudent revenue growth rate was used and was calculated over a period of four years.
The discount rate (based on the weighted cost of capital for the Group) used to calculate the value-in-use figure is 16.4% (2018: 19%) and the terminal growth rate 5.5% (2018: 3%).
At year-end, in terms of IFRS, the PBT Group of companies is still seen as a separate CGU and an impairment test was performed. During the 2018 financial year the goodwill figure was impaired from R253.9 million to R135.7 million in accordance with a Directors’ calculation. For the 2019 financial year the goodwill figure has not been impaired as the recoverable amount was considerably higher than the goodwill figure.
No reasonable possible change is expected in a key assumption used in the value-in-use calculation that would change the value in use to be lower than the carrying value of goodwill.
PB
T G
RO
UP
• IN
TE
GR
AT
ED
RE
PO
RT
20
19
59

NOTES TO THE CONSOLIDATED AND SEPARATE FINANCIAL STATEMENTS [CONTINUED]for the year ended 31 March 2019
6. Intangible assets2019 2018
Rand CostAccumulated amortisation
Carrying value Cost
Accumulated amortisation
Carrying value
GROUP
Computer software 3 459 547 (3 430 312) 29 235 3 446 682 (3 241 604) 205 078
Internally developed software
31 020 907 (30 805 516) 215 391 33 777 771 (33 307 767) 470 004
Other intangible assets – – – 7 339 000 (7 339 000) –
Total 34 480 454 (34 235 828) 244 626 44 563 453 (43 888 371) 675 082
Reconciliation of intangible assets
RandOpening balance Additions
Other changes,
movements AmortisationImpairment
loss Total
GROUP
2019
Computer software 205 078 12 866 – (188 709) – 29 235
Internally developed software
470 004 291 389 – (546 002) – 215 391
675 082 304 255 – (734 711) – 244 626
2018
Computer software 870 435 – – (665 357) – 205 078
Internally developed software
1 356 885 273 046 33 609 (1 193 536) – 470 004
Other intangible assets 7 339 000 – – – (7 339 000) –
9 566 320 273 046 33 609 (1 858 893) (7 339 000) 675 082
Other intangible assets that was recognised in 2014 due to the purchase price allocation calculation was allocated to the Middle East/Africa segment of PBT Group. As a result of exiting the operations in Middle East/Africa, Management no longer considers Middle East/Africa a separate reportable segment and the full value of this asset was impaired during the 2018 financial year.
Computer software has a two-year useful life and the remaining computer software has an average remaining life of one year left.
Internally developed software are capitalised each year and each capitalisation has a life span of five years. The average remaining useful life of each year’s capitalisation will differ depending on what year it was capitalised.
60

7. Interests in subsidiariesThe following table lists the entities which are controlled by the Group, either directly or indirectly through subsidiaries.
Number of ordinary shares held % holding
2019 2018 2019 2018
GROUP COMPANIES
BI-Blue Consulting Proprietary Limited 1 000 1 000 100 100
CyberPro Consulting Proprietary Limited 51 51 51 51
PBT Group (Australia) Proprietary Limited 11 000 11 000 100 100
PBT Group (South Africa) Proprietary Limited 100 100 100 100
PBT Group Europe Besloten Vennootschap 1 000 – 100 –
PBT Group International Besloten Vennootschap 1 000 – 100 –
PBT Infosight Proprietary Limited 100 100 100 100
PBT Insurance Technologies Proprietary Limited 5 500 000 5 500 000 100 100
PBT Technology Services (MEA) Proprietary Limited
100 100 100 100
PBT Technology Services Proprietary Limited 100 100 100 100
PBT Technology Services Ireland Limited 100 – 100 –
Prescient Capital Proprietary Limited – 2 394 – 100
Prescient Property Holdings Proprietary Limited – 38 010 000 – 100
Stadia International British Virgin Islands 1 000 – 100 –
Stricklands Tetra Cape Proprietary Limited 100 100 100 100
Technique Business Intelligence Software Proprietary Limited
700 700 70 70
% holding Carrying amount
Rand 2019 2018 2019 2018
COMPANY
PBT Group (Australia) Proprietary Limited 100 100 6 793 144 6 793 144
PBT Group (South Africa) Proprietary Limited
100 100 88 760 904 88 760 904
PBT Group International Besloten Vennootschap
100 – 17 430 –
Stadia International British Virgin Islands 100 – 26 636 292 –
Cumulative impairment of investment in PBT Group (South Africa) Proprietary Limited
(18 990 044) (18 990 044)
103 217 726 76 564 004
Country of incorporationAll the entities are incorporated in South Africa except for:
PBT Group (Australia) Proprietary Limited – incorporated in Australia;PBT Group International Besloten Vennootschap – incorporated in the Netherlands; PBT Group Europe Besloten Vennootschap – incorporated in the Netherlands; PBT Technology Services Ireland Limited – incorporated in Ireland; andStadia International British Virgin Islands – incorporated in the British Virgin Islands.
Subsidiaries for which control was lost during the yearOn 28 September 2018, as part of the transaction approved by the shareholders, the Group disposed of its interest in Prescient Capital Proprietary Limited and its subsidiaries. Refer to note 14 for further details.
The profit/(loss) has been included in profit/(loss) from discontinued operations in the statement of comprehensive income.
PB
T G
RO
UP
• IN
TE
GR
AT
ED
RE
PO
RT
20
19
61

NOTES TO THE CONSOLIDATED AND SEPARATE FINANCIAL STATEMENTS [CONTINUED]for the year ended 31 March 2019
8. Loans to Group companiesGROUP COMPANY
Rand 2019 2018 2019 2018
SUBSIDIARIES
PBT Group (South Africa) Proprietary Limited – – 116 139 750 137 800 439
The above loan is unsecured, bears no interest (2018: bore interest at the prime lending rate) and has no fixed terms of repayment. No capital repayments are required in the next 12 months. An agreement was reached to subordinate its claim against the Company in favour of and for the benefit of other creditors.
Stadia International Limited – – 2 526 055 2 551 571
The above loan is unsecured, bears no interest and has no fixed terms of repayment. No capital repayments are required in the next 12 months.
– – 118 665 805 140 352 010
Split between non-current and current portions
Non-current assets – – 118 665 805 140 352 010
Reconciliation of loss allowances
The following table shows the movement in the loss allowance (lifetime expected credit losses) for loans to group companies:Opening balance in accordance with IAS 39 Financial Instruments
– – – –
Adjustments upon application of IFRS 9 – – 1 403 520 –
Opening balance in accordance with IFRS 9 – – 1 403 520 –
Increase in provisions for expected credit loss allowance
– – 7 715 –
Closing balance – – 1 411 235 –
62

9. Deferred taxGROUP COMPANY
Rand 2019 2018 2019 2018
Deferred tax liability
Accrued income – (172 090) – –
Contract asset (1 613 328) – – –
Prepaid expenses (2 136) (11 894) – –
Total deferred tax liability (1 615 464) (183 984) – –
Deferred tax asset
Allowance for expected credit losses 641 186 – 395 146 –
Income received in advance 183 875 183 875 – –
Lease liability 40 459 – – –
Payroll-related accruals 1 685 959 1 472 678 – –
Deferred tax balance from temporary differences other than unused tax losses
2 551 479 1 656 553 395 146 –
Tax losses available for set-off against future taxable income
339 712 482 567 – –
Total deferred tax asset 2 891 191 2 139 120 395 146 –
Deferred tax liability (1 615 464) (183 984) – –
Deferred tax asset 2 891 191 2 139 120 395 146 –
Total net deferred tax asset 1 275 727 1 955 136 395 146 –
Reconciliation of deferred tax asset/(liability)
At the beginning of the year 1 955 136 1 432 178 – –
Accrued income – 11 522 – –
Allowance for expected credit losses 641 186 – 395 146 –
Assessed loss (utilised)/raised (142 855) 482 567 – –
Contract asset (1 441 238) – – –
Income received in advance – (221 609) – –
Lease liability 40 459 – – –
Payroll-related accruals 213 281 262 372 – –
Prepaid expenses 9 758 (11 894) – –
1 275 727 1 955 136 395 146 –
PBT Technology Services (MEA) Proprietary Limited has an estimated tax loss carried forward of R54 735 770 (2018: R38 513 866). A deferred tax asset of R15 295 759 (2018: R11 949 422) has not been recognised.
PB
T G
RO
UP
• IN
TE
GR
AT
ED
RE
PO
RT
20
19
63

NOTES TO THE CONSOLIDATED AND SEPARATE FINANCIAL STATEMENTS [CONTINUED]for the year ended 31 March 2019
10. Loans receivableLoans receivable are presented at amortised cost, which is net of loss allowance, as follows:
GROUP COMPANY
Rand 2019 2018 2019 2018
PBT Insurance Technologies Employees 4 723 230 1 508 907 – –
The unsecured loan bears interest at prime minus 2% and has no fixed terms of repayment. No capital repayments are required in the next 12 months.
Enterprise development loans 2 537 400 1 840 000 – –
The unsecured loan bears no interest and has no fixed terms of repayment. No capital repayments are required in the next 12 months.
Bonds 493 251 432 787 – –
Other loans and receivables – 1 366 276 – –
The unsecured loan bears interest at prime and has been repaid in the current year.
7 753 881 5 147 970 – –
Split between non-current and current portions
Non-current assets 6 458 606 1 941 694 – –
Current assets 1 295 275 3 206 276 – –
7 753 881 5 147 970 – –
Reconciliation of loss allowances
The following table shows the movement in the loss allowance (lifetime expected credit losses) for the loans and receivables:
Opening balance in accordance with IAS 39 Financial instruments
– – – –
Adjustments upon application of IFRS 9 (86 145) – – –
Opening balance in accordance with IFRS 9 (86 145) – – –
Increase in provisions for expected credit loss allowance
(91 619) – – –
Closing balance (177 764) – – –
The prior-year figures presented in this note was classified differently according to IAS 39 Financial Instruments: Recognition and Measurement but included in this note to better present the information for comparative purposes.
64

11. Trade and other receivablesGROUP COMPANY
Rand 2019 2018 2019 2018
Financial instrumentsTrade receivables 103 401 062 88 709 265 125 758 2 798 435
Loss allowance (437 924) – – –
Trade receivables at amortised cost 102 963 138 88 709 265 125 758 2 798 435
Non-financial instrumentsAccrued income – 1 077 856 – –
Contract asset 5 761 883 – – –
Deposits 2 764 612 1 440 484 – –
Prepayments 359 569 42 478 – –
VAT 226 235 – – –
Total trade and other receivables 112 075 437 91 270 083 125 758 2 798 435
Categorisation of trade and other receivablesTrade and other receivables are categorised as follows in accordance with IFRS 9 Financial Instruments:At amortised cost 102 963 138 88 709 265 125 758 2 798 435
Non-financial instruments 9 112 299 2 560 818 – –
112 075 437 91 270 083 125 758 2 798 435
Exposure to credit riskTrade receivables inherently expose the Group to credit risk, being the risk that the Group will incur financial loss if clients fail to make payments as they fall due. Refer to note 35.
Reconciliation of loss allowancesThe following table shows the movement in the loss allowance (lifetime expected credit losses) for trade and other receivables:Opening balance in accordance with IAS 39 Financial Instruments
4 126 763 – – –
Adjustments upon application of IFRS 9 1 155 505 – 2 798 435 –
Opening balance in accordance with IFRS 9 5 282 268 – 2 798 435 –
Provisions reversed on settled trade receivables
(4 844 344) – – –
Provision reversed on write-off of trade receivables
– – (2 798 435) –
Closing balance 437 924 – – –
Fair value of trade and other receivablesThe fair value of trade and other receivables approximates their carrying amounts.
Reconciliation of contract assetOpening balance – – – –
Revenue recognised but not invoiced 5 761 883 – – –
5 761 883 – – –
PB
T G
RO
UP
• IN
TE
GR
AT
ED
RE
PO
RT
20
19
65

NOTES TO THE CONSOLIDATED AND SEPARATE FINANCIAL STATEMENTS [CONTINUED]for the year ended 31 March 2019
12. Investments at fair valueInvestments held by the Group which are measured at fair value are as follows:
GROUP COMPANY
Rand 2019 2018 2019 2018
Equity investments at fair value through profit or loss
124 729 245 241 – –
Equity investments at fair value through other comprehensive income
26 744 186 23 598 877 – –
26 868 915 23 844 118 – –
Fair value through profit or loss
All Claims Proprietary Limited 124 729 245 241 – –
Equity investments at fair value through other comprehensive income
Zuuse Limited (previously Progressclaim.com Limited)
26 744 186 23 598 877 – –
26 868 915 23 844 118 – –
Split between non-current and current portions
Non-current assets 26 868 915 23 844 118 – –
Refer to note 36 – Fair value information for details of valuation policies and processes.
Equity instruments at fair value through other comprehensive incomeThe investment in Zuuse Limited is not held for trading, it is held for long-term strategic purposes and has therefore been designated as at fair value through other comprehensive income. No dividends were received related to this investment in the current or prior year.
In the prior year this investment was measured at cost, although it was classified as at fair value through profit or loss. The investment was measured at cost due to the minority interest it had in a private internet-based software company which is in a growth phase and is very volatile in nature and as a result has an extremely wide valuation matrix.
In the current year this investment was measured at fair value through other comprehensive income.
IFRS 9 Financial Instruments was adopted in the current year and replaces IAS 39. This note reflects the application of IFRS 9 to the specified instruments. Prior-year figures have not been restated.
66

13. Cash and cash equivalentsCash and cash equivalents consist of:
GROUP COMPANY
Rand 2019 2018 2019 2018
Cash on hand 25 426 17 865 – –
Bank balances 28 300 137 22 430 437 610 702 1 305 080
Other cash and cash equivalents 2 754 246 11 754 548 15 433 14 352
Bank overdraft (99 880) (152 191) – –
30 979 929 34 050 659 626 135 1 319 432
Current assets 31 079 809 34 202 850 626 135 1 319 432
Current liabilities (99 880) (152 191) – –
30 979 929 34 050 659 626 135 1 319 432
As at 31 March 2019 CyberPro Consulting Proprietary Limited has an overdraft facility of R6 050 000 (2018: R3 050 000). In the prior year CyberPro Consulting Proprietary Limited had a bank guarantee of R50 000. This overdraft facility is secured by unrestricted cession of the debtors’ book of CyberPro Consulting Proprietary Limited.
As at 31 March 2019 the following Group companies had unsecured overdraft facilities:• Technique Business Intelligence Software Proprietary Limited – R800 000.• PBT Technology Services (MEA) Proprietary Limited – R500 000.
PB
T G
RO
UP
• IN
TE
GR
AT
ED
RE
PO
RT
20
19
67

NOTES TO THE CONSOLIDATED AND SEPARATE FINANCIAL STATEMENTS [CONTINUED]for the year ended 31 March 2019
14. Discontinued operationsPBT Group successfully disposed of Prescient Capital and its subsidiaries (Prescient Capital) and shares held in Prescient Holdings Proprietary Limited (Prescient Holdings) on 28 September 2018. The necessary announcement was published on SENS for the finalisation of the transaction. The settlement of the total purchase price of R65.8 million for Prescient Capital and Prescient Holdings was settled by way of a deposit of R4.8 million and the balance was accounted for as a specific share repurchase against equity.
Also included in the Circular and Supplementary Circular released on 23 March 2018 and 28 August 2018, respectively, was a share consolidation on the basis of one ordinary share for every 10 authorised and issued ordinary shares and the cancellation of the specific repurchase received as part of the consideration. Please refer to note 15 – Share capital for the effects of the specific repurchase and share consolidation on the share capital of the Group.
The transaction is classified as both a specific repurchase and a related party transaction in terms of the JSE Listings Requirements.
GROUP COMPANY
Rand 2019 2018 2019 2018
Results of discontinued operations
Revenue 4 816 394 11 542 901 – –
Other income 1 124 409 2 315 088 – –
Foreign currency reserve released 20 723 419 – – –
Impairment loss (12 842 435) (42 848 287) – (42 413 227)
Expenses (4 770 558) (13 452 860) – –
Results from operating activities 9 051 229 (42 443 158) – (42 413 227)
Tax 62 626 162 553 – –
Results from operating activities, net of tax 9 113 855 (42 280 605) – (42 413 227)
Gain on sale of discontinued operations – – 23 585 663 –
Profit for the year 9 113 855 (42 280 605) 23 585 663 (42 413 227)
Earnings/(loss) per share (cents)
Basic earnings per share 7.34 (2.82)
Diluted earnings per share 7.34 (2.82)
Profit from discontinued operations of R9.1 million (2018: loss of R42.3 million) was attributable to the owners of the Company.
The consideration for the assets disposed of is based on the sum of the cash received and the value of the underlying shares received.
68

14. Discontinued operations (continued)
GROUP COMPANY
Rand 2019 2018 2019 2018
Carrying value of assets 60 340 731 93 397 213 50 548 926 92 962 153
Fair value of consideration received:
Cash 4 789 488 4 789 488 4 789 488 4 789 488
Fair value of underlying shares received (305 062 917 at 14 cents per share) (2018: 305 062 917 at 15 cents per share)
42 708 808 45 759 438 42 708 808 45 759 438
47 498 296 50 548 926 47 498 296 50 548 926
Impairment loss 12 842 435 42 848 287 3 050 629 42 413 227
Cash flows from/(used in) discontinued operations
Net cash from operating activities 1 089 358 24 816 072
Net cash used in investing activities (937 176) 30 404 900
Net cash from financing activities (351 378) (54 363 206)
Net cash flow for the year (199 196) 857 766
Net assets disposed of during the year
Assets disposed of during the year (2018: assets held for sale)
Property and equipment 730 379 47 608 – –
Investment property 29 754 662 36 428 050 – –
Financial assets at fair value through profit or loss
19 478 737 17 776 668 47 498 296 50 548 926
Trade and other receivables 1 045 293 920 608 – –
Long-term loans receivable 127 546 288 480 – –
Taxation receivable – 128 042 – –
Cash and cash equivalents 1 259 872 1 531 504 – –
52 396 489 57 120 960 47 498 296 50 548 926
Liabilities sold during the year (2018: liabilities of disposal group)
Deferred tax liability (219 467) (302 957) – –
Long-term loans payable (3 555 621) (5 259 536) – –
Trade and other payables (1 123 106) (1 009 540) – –
(4 898 194) (6 572 033) – –
Net assets and liabilities disposed of during the year (2018: held for sale)
47 498 295 50 548 927 47 498 296 50 548 926
Consideration received in cash – (4 789 488) – (4 789 488)
Cash and cash equivalents – (1 531 504) – –
Net cash inflow – (6 320 992) – (4 789 488)
PB
T G
RO
UP
• IN
TE
GR
AT
ED
RE
PO
RT
20
19
69

NOTES TO THE CONSOLIDATED AND SEPARATE FINANCIAL STATEMENTS [CONTINUED]for the year ended 31 March 2019
15. Share capitalGROUP
Rand 2019 2018
Authorised
200 000 000 ordinary shares of no par value (2018: 2 000 000 000 ordinary shares of no par value)
– –
Reconciliation of number of shares issued
Reported as at 1 April 1 669 250 950 1 669 250 950
Specific repurchased shares cancelled (305 062 917) –
Share consolidation (2 November 2018) (1 227 769 230) –
Fraction rate shares delisted (54) –
Treasury shares to be cancelled (28 471 787) (270 188 033)
Shares held by BEE company (Spalding Investments 10 Proprietary Limited) treated as treasury shares
(10 373 282) –
97 573 680 1 399 062 917
92 053 038 unissued ordinary shares are under the control of the Directors in terms of a resolution of members passed at the last Annual General Meeting. This authority remains in force until the next Annual General Meeting.
GROUP COMPANY
Rand 2019 2018 2019 2018
Issued
Ordinary shares of no par value 117 935 401 117 804 955 2 133 259 742 2 133 259 742
Share-based payment shares included in treasury shares
(16 500 000) – (16 500 000) –
Treasury shares (97 944 480) (52 446 014) (97 944 480) (51 891 691)
3 490 921 65 358 941 2 018 815 262 2 081 368 051
Transactions during the yearAs part of the consideration for the disposal of the Prescient Capital Group, PBT Group received 305 062 917 PBT Group Limited shares. These shares are treated as a specific share repurchase against equity and was included in treasury shares. These shares have been cancelled and does not form part of the issued capital anymore.
As part of the Circular and Supplementary Circular released on 23 March 2018 and 28 August 2018, respectively, a share consolidation of the Company’s authorised and issued share capital on a 1-for-10 basis was approved and has taken effect on 2 November 2018.
Treasury sharesThe treasury shares that were previously separately disclosed are shares held by PBT Group Limited. As per section 35(5) of the Companies Act, shares that are acquired by a company have the same status as shares that have been authorised but not issued. These treasury shares that have not been cancelled are now presented net as a reduction of share capital instead of gross in an equity reserve.
70

15. Share capital (continued)
BEE transaction treated as treasury sharesDuring February 2019 PBT Group Limited granted a loan of R16 500 000 to a BEE company in order to purchase shares in PBT Group Limited. The loan is structured as a preference share agreement and the owners of the BEE company are employees within the Group. Future dividends received through these shares will be applied to cover the preference dividends calculated at 72% of prime rate compounded six monthly. As the only security for the repayment of the loan is the underlying PBT Group Limited shares, with no recourse, the transaction is treated as the issue of an option to the BEE parties and the amount is reflected as treasury shares (deduction in equity).
Please refer to note 17 for more information on the transaction.
The loan to the BEE company was advanced by a subsidiary in the PBT Group. Therefore in the Company’s accounts this was a non-cash financing transaction.
The shares that the BEE company owns are still considered to be issued and will not form part of the unissued shares under the control of the Directors. These shares are classified as treasury shares as per IFRS 2 Share-based Payments.
Number of shares 2019 2018
Treasury share movements during the year
Reported as at 1 April 2018 270 188 033 9 871 888
Specific repurchase as per specific authority granted 305 062 917 –
Specific repurchased shares cancelled* (305 062 917) –
Purchased by PBT Group Limited – 47 776 900
Purchased by subsidiary – 2 221 178
Transfers – 210 318 067
Share consolidation** (243 169 229) –
Shares purchased from dissenting shareholders in terms of section 164 of the Companies Act
1 452 983 –
Shares held by BEE company (Spalding Investments 10 Proprietary Limited) treated as treasury shares
10 373 282 –
38 845 069 270 188 033
* On 28 September 2018 the shareholders approved Special Resolution Number 1 for the specific repurchase of 305 062 917 ordinary shares and the subsequent cancellation of the treasury shares. The effective date of the cancellation of the treasury shares was 30 October 2018 and the shares were delisted.
** On 28 September 2018 the shareholders approved Special Resolution Number 2 for a share consolidation on the basis of one ordinary share for every 10 authorised and issued ordinary shares, with all fractional entitlements rounded down to the nearest whole number. The effective date of the share consolidation was 2 November 2018. As a result of the share consolidation the number of authorised shares in issue as at the date of this report is 200 000 000.
Other than the specific transactions mentioned above, no purchases were made during the 2019 financial year. The average purchase price per share during the 2018 financial year was 16.14 cents per share. (If the share consolidation that took place on 2 November 2018 is taken into account the average price would have been R1.61.)
During the 2018 financial year the Group made a capital reduction payment of a net amount of R26 209 633.
PB
T G
RO
UP
• IN
TE
GR
AT
ED
RE
PO
RT
20
19
71

NOTES TO THE CONSOLIDATED AND SEPARATE FINANCIAL STATEMENTS [CONTINUED]for the year ended 31 March 2019
16. Foreign currency translation reserveTranslation reserve comprises exchange differences on consolidation of foreign subsidiaries.
GROUP COMPANY
Rand 2019 2018 2019 2018
Opening balance 12 909 171 12 715 580 – –
Foreign exchange on translation of foreign subsidiaries
12 794 138 193 591 – –
Release foreign currency translation reserve after disposal of foreign subsidiaries
(20 723 419) – – –
4 979 890 12 909 171 – –
17. Share-based paymentsDuring February 2019 PBT Group Limited entered into a loan agreement with a BEE company called Spalding Investments 10 Proprietary Limited (Spalding or the BEE company). A loan of R16 500 000 was advanced to the BEE company for the purpose of purchasing shares in PBT Group Limited. The owners of Spalding are employees of the PBT Group and are required to remain employed within the Group for a period of seven years in accordance with the shareholders’ agreement. The loan was structured as a preference share agreement with the following key terms:
• The preference dividends are calculated in arrears at a rate of 72% of the prime rate.
• Any preference dividends not paid out on a six-monthly basis will be rolled up and accrued for repayment at a later date, the latest date being the redemption date.
• The preference shares are redeemable in three tranches, being: – the first 33.33% five years after issue date (February 2024); – the next 33.33% six years after issue date (February 2025); and – the final 33.33% seven years after issue date (February 2026), including any rolled up or unpaid preference
dividends.
• The dividends that Spalding will receive from its investment in PBT Group Limited will be utilised to repay the preference dividends and part capital if the dividends received are in excess of the preference dividends payable.
As the only security for the repayment of the loan is the underlying PBT Group shares, with no other recourse, the transaction is treated as a share-based payment transaction under IFRS 2 and the loan is accounted for as treasury shares. The vesting period is seven years, with the only vesting condition being that the individual remains an employee of the Group over the period.
72

17. Share-based payments (continued)
The fair value of the share-based payment award has been calculated using share option valuation techniques on the following basis:
Number of shares
Vesting date
Strike price
Fair value at grant date
Tranche 1 3 457 761 Feb 2024 Variable 20 cents
Tranche 2 3 457 761 Feb 2025 Variable 19 cents
Tranche 3 3 457 760 Feb 2026 Variable 14 cents
Total 10 373 282 17.66 cents*
* Weighted average.
The strike price has been defined as the redemption price of the preference shares with adjustments made for compounded interest payments on the preference shares, reduced by expected future PBT dividend payments in accordance with the terms of the agreement.
No options have vested or were exercised yet as the transaction was only implemented on 14 February 2019 and the first tranche vests in five years’ time. The weighted average fair value of each option granted during the year was 17.66 cents.
2019 2018
Equity settled
Not applicable
for the 2018 year
Option pricing model used Black-Scholes
Share price at date of grant (cents) 135
Contractual life (days) 1 825 – 2 555
Volatility relative to comparator index 33.48%
Risk-free interest rate:
5-year maturity 8.6%
6-year maturity 8.94%
7-year maturity 9.24%
Dividend growth rate relative to comparator index 6%
The implied volatility was calculated on the stock price movement of PBT Group Limited. However, numerous anomalous events occurred that distorted the percentage and reverted to comparable companies to calculate the volume weighted average volatility.
The share-based remuneration expense comprises:
Rand 2019 2018
Equity settled 32 147 –
The Group did not enter into any share-based payment transactions with parties other than employees during the current or previous period.
PB
T G
RO
UP
• IN
TE
GR
AT
ED
RE
PO
RT
20
19
73

NOTES TO THE CONSOLIDATED AND SEPARATE FINANCIAL STATEMENTS [CONTINUED]for the year ended 31 March 2019
18. Payroll-related accrualsReconciliation of payroll-related accruals
Opening balance Additions
Utilised during the year Total
GROUP
2019
Accrual for bonus 938 770 1 472 958 (938 770) 1 472 958
Accrual for commission – 766 251 – 766 251
Accrual for leave 5 135 915 3 833 821 (5 135 915) 3 833 821
Accrual for overtime 1 820 902 2 323 197 (1 820 902) 2 323 197
Accrual for salaries 688 846 – (688 846) –
8 584 433 8 396 227 (8 584 433) 8 396 227
2018
Accrual for bonus 502 809 938 770 (502 809) 938 770
Accrual for leave 5 075 431 5 135 915 (5 075 431) 5 135 915
Accrual for overtime 5 611 316 1 820 902 (5 611 316) 1 820 902
Accrual for salaries – 688 846 – 688 846
11 189 556 8 584 433 (11 189 556) 8 584 433
19. Trade and other payablesGROUP COMPANY
Rand 2019 2018 2019 2018
Financial instruments
Trade payables 16 040 452 18 399 896 93 540 67 501
Accrued expenses 5 656 533 2 997 868 – –
Non-financial instruments
Amounts received in advance 801 624 656 696 – –
Deposit received – 4 789 488 – 4 789 488
PAYE payable 9 243 343 2 569 773 – –
Operating lease payables 144 495 452 682 – –
Other payables – 23 750 – –
VAT 5 813 408 4 168 206 – –
37 699 855 34 058 359 93 540 4 856 989
Fair value of trade and other payablesThe fair value of trade and other payables approximates their carrying amounts.
74

20. RevenueGROUP COMPANY
Rand 2019 2018 2019 2018
Revenue from contracts with customersSale of goods 3 395 635 3 883 128 – –
Rendering of services 585 018 774 552 210 439 – –
588 414 409 556 093 567 – –
Revenue other than from contracts with customersDividends received (trading) – – – 42 425 249
588 414 409 556 093 567 – 42 425 249
Disaggregation of revenue from contracts with customersThe Group has disaggregated revenue into various categories in the following table which is intended to:
• depict the nature, amount and timing of revenue; and
• enable users to understand the various types of counterparties that the Group provides services to.
Contract typeFixed price contracts 121 383 350 – – –
Projects 24 403 240 – – –
Software licences 3 395 635 – – –
Time and material 421 969 573 – – –
Usage-based licences 17 262 611 – – –
588 414 409 – – –
Contract counterpartiesEnergy 13 422 800 – – –
Financial services 289 071 318 – – –
Information technology 99 958 858 – – –
Medical 29 656 057 – – –
Retail 45 010 492 – – –
Services 22 012 498 – – –
Telecommunications 89 282 386 – – –
588 414 409 – – –
Total revenue from contracts with customers 588 414 409 – – –
Timing of revenue recognitionAt a point in timeSale of goods 3 395 635 – – –
Over timeRendering of services 585 018 774 – – –
Total revenue from contracts with customers 588 414 409 – – –
The Board has elected to apply the modified retrospective adoption method when transitioning to IFRS 15 and as such no comparative figures are required to be disclosed in this note.
PB
T G
RO
UP
• IN
TE
GR
AT
ED
RE
PO
RT
20
19
75

NOTES TO THE CONSOLIDATED AND SEPARATE FINANCIAL STATEMENTS [CONTINUED]for the year ended 31 March 2019
GROUP COMPANY
Rand 2019 2018 2019 2018
21. Cost of salesSale of goods 3 238 594 3 712 900 – –
Rendering of services 437 626 773 454 259 810 – –
440 865 367 457 972 710 – –
22. Other incomeBad debts recovered 875 924 855 404 – –
Realised gain on financial assets – 1 371 515 – –
Recovery income 130 064 70 135 1 882 129 482 500
Sundry income 266 881 415 195 – –
Write-off of share-based payment plan – 44 499 – –
1 272 869 2 756 748 1 882 129 482 500
23. Other operating gains/(losses)Gains/(losses) on disposals, scrappings and settlements
Property, plant and equipment (refer to note 4)
(351 834) 3 525 – –
Other assets – (64 010) – –
Profit on disposal of non-current assets 3 681 2 800 – –
(348 153) (57 685) – –
Foreign exchange gains/(losses)
Net foreign exchange gains/(losses) 1 152 300 (4 408 936) 1 165 –
Fair value gains/(losses)
Financial assets at fair value through profit or loss
(149 598) – – –
Financial assets designated as at fair value through profit or loss
– 114 998 – –
(149 598) 114 998 – –
Total other operating gains/(losses) 654 549 (4 351 623) 1 165 –
76

24. Operating profit/(loss)Operating profit/(loss) for the year is stated after charging/(crediting) the following, amongst others:
GROUP COMPANY
Rand 2019 2018 2019 2018
Remuneration, other than to employees
Administrative and managerial services 843 289 773 431 155 455 454 860
Consulting and professional services 9 776 701 5 171 612 916 513 –
Secretarial services 277 731 358 077 12 148 14 705
10 897 721 6 303 120 1 084 116 469 565
Employee costs
Salaries, wages, bonuses and other benefits – administration
54 133 728 42 462 371 1 042 073 1 403 161
Salaries, wages, bonuses and other benefits – cost of sales
247 233 972 288 274 986 – –
Share-based compensation expense 32 147 – 32 147 –
Total employee costs 301 399 847 330 737 357 1 074 220 1 403 161
Depreciation and amortisation
Depreciation of property, plant and equipment
2 498 358 3 477 005 – –
Amortisation of intangible assets 734 712 1 825 284 – –
Total depreciation and amortisation 3 233 070 5 302 289 – –
Impairment losses
Goodwill – 118 260 893 – –
Intangible assets – 7 339 000 – –
Other financial assets 38 367 1 421 356 – –
38 367 127 021 249 – –
Movement in credit loss allowances
Loans receivables at amortised cost 91 619 – – –
Loans to Group companies – – 7 715 –
Trade and other receivables (4 844 345) – (2 798 435) –
(4 752 726) – (2 790 720) –
PB
T G
RO
UP
• IN
TE
GR
AT
ED
RE
PO
RT
20
19
77
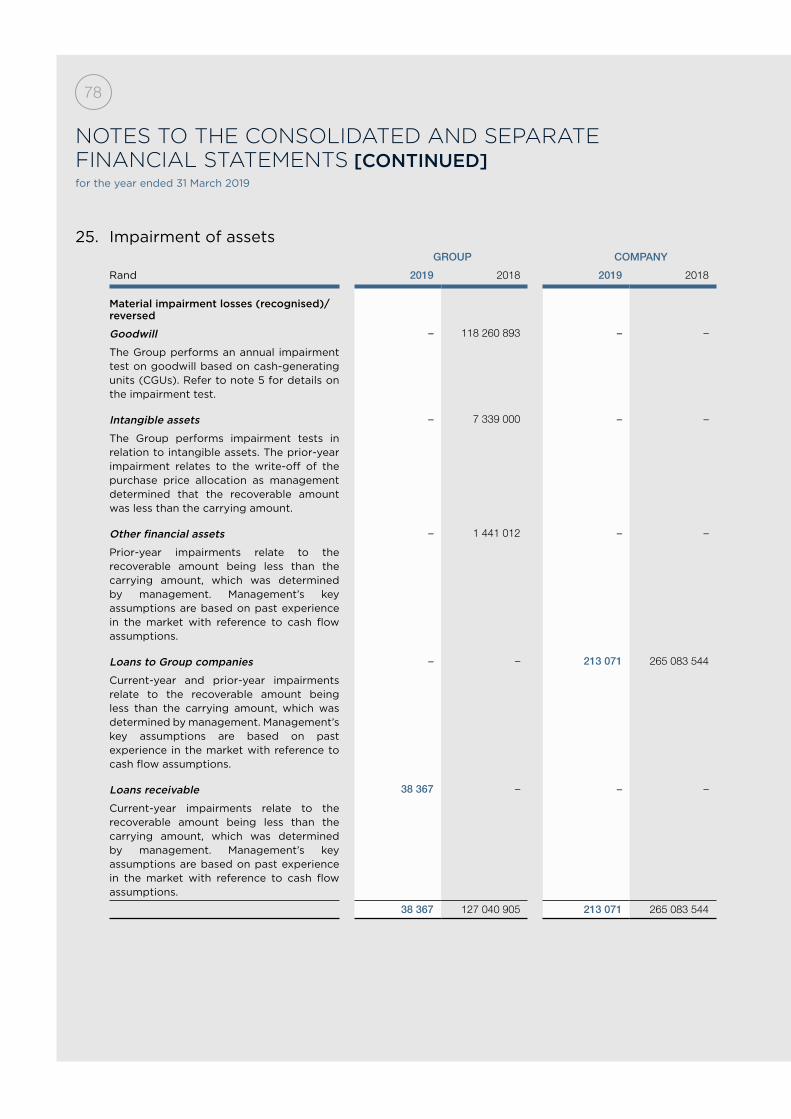
NOTES TO THE CONSOLIDATED AND SEPARATE FINANCIAL STATEMENTS [CONTINUED]for the year ended 31 March 2019
25. Impairment of assetsGROUP COMPANY
Rand 2019 2018 2019 2018
Material impairment losses (recognised)/reversed
Goodwill – 118 260 893 – –
The Group performs an annual impairment test on goodwill based on cash-generating units (CGUs). Refer to note 5 for details on the impairment test.
Intangible assets – 7 339 000 – –
The Group performs impairment tests in relation to intangible assets. The prior-year impairment relates to the write-off of the purchase price allocation as management determined that the recoverable amount was less than the carrying amount.
Other financial assets – 1 441 012 – –
Prior-year impairments relate to the recoverable amount being less than the carrying amount, which was determined by management. Management’s key assumptions are based on past experience in the market with reference to cash flow assumptions.
Loans to Group companies – – 213 071 265 083 544
Current-year and prior-year impairments relate to the recoverable amount being less than the carrying amount, which was determined by management. Management’s key assumptions are based on past experience in the market with reference to cash flow assumptions.
Loans receivable 38 367 – – –
Current-year impairments relate to the recoverable amount being less than the carrying amount, which was determined by management. Management’s key assumptions are based on past experience in the market with reference to cash flow assumptions.
38 367 127 040 905 213 071 265 083 544
78

GROUP COMPANY
Rand 2019 2018 2019 2018
26. Investment incomeDividend income
Equity instruments at fair value through profit or loss
Dividend income from pledged shares from termination of the Group’s FSP in December 2016
– 1 868 272 – –
Interest income
Investments in financial assets
Bank and other cash 3 126 640 2 297 650 36 587 96 263
Loans receivable at amortised cost – 12 258 – –
Trade and other receivables 23 791 56 300 – –
Other financial assets 285 062 101 769 – –
Loans to Group companies
Subsidiaries – – – 28 158
Other 376 761 1 699 020 – –
Total interest income 3 812 254 4 166 997 36 587 124 421
Total investment income 3 812 254 6 035 269 36 587 124 421
27. Finance costsBank overdraft 692 442 1 796 600 293 –
Other financial liabilities – 1 796 871 – 3 160
Other related parties 339 476 1 592 187 – –
Tax authorities 176 384 – 6 969 –
Trade and other payables 445 5 279 – –
Total finance costs 1 208 747 5 190 937 7 262 3 160P
BT
GR
OU
P •
INT
EG
RA
TE
D R
EP
OR
T 2
019
79

NOTES TO THE CONSOLIDATED AND SEPARATE FINANCIAL STATEMENTS [CONTINUED]for the year ended 31 March 2019
28. TaxationMajor components of the tax expense
GROUP COMPANY
Rand 2019 2018 2019 2018
Current
Local income tax – current period 12 400 098 8 431 207 1 082 272 162 043
Local income tax – recognised in current tax for prior periods
(190 712) (1 570 415) (336 901) –
Securities transfer tax 113 465 22 425 113 465 20 475
Foreign income tax or withholding tax – current period
2 051 500 8 832 160 – –
Foreign income tax or withholding tax – recognised in current tax for prior periods
1 368 810 6 825 909 – –
15 743 161 22 541 286 858 836 182 518
Deferred
Originating and reversing temporary differences on:
Accrued income – (11 522) – –
Allowance for expected credit losses 34 229 – 585 511 –
Assessed loss (utilised)/raised 142 855 (482 567) – –
Contract asset 1 441 238 – – –
Income received in advance – 221 609 – –
Lease liability (40 459) – – –
Payroll-related accruals (213 281) (262 372) – –
Prepaid expenses (9 758) 11 894 – –
1 354 824 (522 958) 585 511 –
17 097 985 22 018 328 1 444 347 182 518
80

28. Taxation (continued)
Reconciliation of the tax expenseReconciliation between applicable tax rate and average effective tax rate.
Percent 2019 2018 2019 2018
Applicable tax rate 28.00 28.00 28.00 28.00
Accounting loss on sale of fixed assets 0.17 – – –
Assessed loss (1.81) – – –
Deferred tax asset not raised 1.35 (33.41) (116.22) –
Dividends received – 0.45 – 4.46
Expenses of capital nature: bad debts 1.29 – (77.80) –
legal fees 0.51 – (22.78) –
listing fees 0.12 – – –
other 0.04 – – –
Fair value adjustments – 0.02 – –
Foreign tax rate adjustment: Australia at 27.5%
(0.02) 0.01 – –
Foreign tax rate adjustment: Ireland at 12.5%
(0.49) – – –
Impairments of loans receivable 0.02 – (7.07) (32.31)
Learnership allowances (0.71) – – –
Non-deductible expenses: interest and penalties
0.14 (1.81) (0.72) (0.21)
Non-deductible expenses: other 0.51 – – –
Non-deductible expenses: share-based payment
0.02 – (1.07) –
Non-taxable income (0.15) – – –
Prior-year tax adjustment (0.38) 1.34 39.93 –
Security transfer tax 0.22 (0.02) (13.45) (0.01)
Withholdings tax – section 6quat(1C) 4.85 (13.34) – –
33.68 (18.76) (171.18) (0.07)
PBT Technology Services (MEA) Proprietary Limited has an estimated tax loss carried forward of R54 735 770 (2018: R38 513 866).
PB
T G
RO
UP
• IN
TE
GR
AT
ED
RE
PO
RT
20
19
81

NOTES TO THE CONSOLIDATED AND SEPARATE FINANCIAL STATEMENTS [CONTINUED]for the year ended 31 March 2019
29. Cash generated from operationsGROUP COMPANY
Rand 2019 2018 2019 2018
Profit/(loss) before taxation 50 745 698 (117 350 675) (843 769) (224 051 119)
Adjustments for
Depreciation and amortisation 3 233 070 5 302 289 – –
Losses on disposals, scrappings and settlements of assets and liabilities
348 153 4 393 – –
(Gains)/losses on foreign exchange (1 152 300) 4 408 936 (1 165) –
Dividend income – (1 868 272) – –
Interest income (3 812 254) (4 166 997) (36 587) (124 421)
Finance costs 1 208 747 5 190 937 7 262 3 160
Fair value losses/(gains) 149 598 (114 998) – –
Net impairments and movements in credit loss allowances
(4 714 359) 127 040 905 (2 577 649) 265 083 544
Movements in payroll-related accruals (188 206) (2 605 125) – –
Write-off of share plan liability – (45 000) – –
Gain on financial assets – (1 371 515) – –
Other non-cash items 7 236 719 – 7 049 949 –
Change in accounting policy (5 368 413) – (4 201 954) –
Changes in working capital
Inventories – 19 787 410 – –
Trade and other receivables (14 789 275) 128 554 000 5 471 112 91 778 372
Trade and other payables 3 628 997 6 459 050 (4 763 448) 4 244 449
Trade and other receivables: non-cash items
– (68 853 000) – (22 918 944)
36 526 175 100 372 338 103 751 114 015 041
30. Non-cash movementsNon-cash movements from financing activities
Discontinued operations (3 570 250) – 4 772 009 –
Reserves 10 806 969 – 32 147 –
Share capital – – (19 843 931) –
Non-cash movements from investing activities
Loans to/(from) Group companies – – 22 089 724 –
7 236 719 – 7 049 949 –
82

31. Other comprehensive incomeComponents of other comprehensive income
Rand Gross Tax Net
GROUP
2019Items that will not be reclassified to profit/(loss)Movements on valuation of equity investmentsGains on valuation 470 363 – 470 363
Items that may be reclassified to profit/(loss)Exchange differences on translating foreign operations Exchange differences arising during the year 12 794 138 – 12 794 138
Reclassifying adjustment for exchange differences included in profit/(loss)
(20 723 419) – (20 723 419)
(7 929 281) – (7 929 281)
Total (7 458 918) – (7 458 918)
2018Items that may be reclassified to profit/(loss)Exchange differences on translating foreign operations Exchange differences arising during the year 193 591 – 193 591
32. CommitmentsGROUP COMPANY
Rand 2019 2018 2019 2018
Operating leases – as lesseeMinimum lease payments due– within one year 4 963 171 3 479 873 – –
– in second to fifth year inclusive 18 359 461 50 848 – –23 322 632 3 530 721 – –
Operating lease payments represent rentals payable by the Group for certain of its office properties. No contingent rent is payable.
33. Related partiesRelationships
Subsidiaries Members of key management and loans to staff
BI-Blue Consulting Proprietary LimitedCyberPro Consulting Proprietary LimitedPBT Group (South Africa) Proprietary LimitedPBT Group Europe Besloten VennootschapPBT Group International Besloten VennootschapPBT Infosight Proprietary LimitedPBT Insurance Technologies Proprietary LimitedPBT Technology Services (MEA) Proprietary LimitedPBT Technology Services Proprietary LimitedPBT Technology Services Ireland LimitedSpalding Investments 10 Proprietary LimitedStadia International British Virgin IslandsStricklands Tetra Cape Proprietary LimitedTechnique Business Intelligence Software Proprietary Limited
NA FreddyJC du ToitMN EngelbrechtNJ ViljoenW ViljoenM VisserHB VoslooH Woest
PB
T G
RO
UP
• IN
TE
GR
AT
ED
RE
PO
RT
20
19
83

NOTES TO THE CONSOLIDATED AND SEPARATE FINANCIAL STATEMENTS [CONTINUED]for the year ended 31 March 2019
33. Related parties (continued)
GROUP COMPANY
Rand 2019 2018 2019 2018
Related party balances
Loan accounts owing by related parties
PBT Group (South Africa) Proprietary Limited
– – 137 169 954 137 800 439
Stadia International British Virgin Islands – – 2 526 055 2 551 571
JC du Toit 416 343 50 338 – –
MN Engelbrecht 329 391 – – –
NJ Viljoen 416 343 50 338 – –
W Viljoen 2 445 930 1 307 542 – –
M Visser 416 343 50 338 – –
HB Vosloo 413 185 – – –
H Woest 416 343 50 338 – –
Amounts included in trade and other receivables regarding related parties
NA Freddy 20 786 – – –
Related party transactions
Dividends received from related parties
PBT Group (Australia) Limited – – – 2 551 571
PBT Group (South Africa) Proprietary Limited
– – – 5 355 000
Prescient Capital Proprietary Limited – – – 32 650 406
Interest received from related parties
PBT Technology Services Proprietary Limited
– – – 28 158
Administration fees received from related parties
BI-Blue Consulting Proprietary Limited – – 38 733 –
PBT Insurance Technologies Proprietary Limited
– – 143 690 –
PBT Technology Services (MEA) Proprietary Limited
– – 213 071 –
PBT Technology Services Proprietary Limited
– – 1 384 993 –
Technique Business Intelligence Software Proprietary Limited
– – 101 642 –
Compensation to Directors and other key management
Short-term employee benefits 27 765 511 10 065 000 1 042 073 10 065 000
A loan was advanced to Spalding Investment 10 Proprietary Limited to the amount of R16 500 000, which used the proceeds to purchase ordinary shares in PBT Group Limited. As the only security for the repayment of the loan is the underlying PBT Group shares, with no recourse, the transaction is treated as the issue of an option to the BEE parties and the loan and shares issued are not recognised. Please refer to note 17 for full details on the transaction.
84

34. Directors’ emoluments
Rand Basic salary
Value of contributions
paid BonusFringe
benefits Total
Executive
2019
Pierre de Wet 2 750 820 235 788 937 800 90 411 4 014 819
Murray Louw 735 000 9 135 – – 744 135
3 485 820 244 923 937 800 90 411 4 758 954
2018
Pierre de Wet 649 086 208 675 1 785 000 82 914 2 725 675
Murray Louw 454 999 6 037 – – 461 036
1 104 085 214 712 1 785 000 82 914 3 186 711
Rand Directors’ fees
Non-executive
2019
Tony Taylor 323 323
Cheree Dyers 248 750
Herman Steyn 226 750
Arthur Winkler 243 250
1 042 073
2018
Tony Taylor 292 125
Cheree Dyers 231 250
Herman Steyn 211 250
Arthur Winkler 207 500
942 125P
BT
GR
OU
P •
INT
EG
RA
TE
D R
EP
OR
T 2
019
85

NOTES TO THE CONSOLIDATED AND SEPARATE FINANCIAL STATEMENTS [CONTINUED]for the year ended 31 March 2019
35. Financial instruments and risk managementCategories of financial instruments
Rand Notes
Fair value through other
comprehensive income –
equity instruments
Fair value through profit
or lossAmortised
cost Total
Categories of financial assets
GROUP
2019
Loans receivable 10 – – 7 753 881 7 753 881
Investments at fair value 12 26 744 186 124 729 – 26 868 915
Trade and other receivables 11 – – 102 963 138 102 963 138
Cash and cash equivalents 13 – – 31 079 809 31 079 809
26 744 186 124 729 141 796 828 168 665 743
Rand Notes
Fair value through profit
and lossLoans and receivables Total
GROUP
2018
Trade and other receivables 11 – 88 709 265 88 709 265
Other financial assets 24 276 905 4 715 183 28 992 088
Cash and cash equivalents 13 – 34 202 850 34 202 850
24 276 905 127 627 298 151 904 203
Rand NotesAmortised
cost
COMPANY
2019
Loans to Group companies 8 118 665 805
Trade and other receivables 11 125 758
Cash and cash equivalents 13 626 135
119 417 698
Rand NotesLoans and
receivables
COMPANY
2018
Loans to Group companies 8 140 352 010
Trade and other receivables 11 2 798 435
Cash and cash equivalents 13 1 319 432
144 469 877
86

35. Financial instruments and risk management (continued)
Rand NotesAmortised
cost
Categories of financial liabilities
GROUP
2019
Trade and other payables (including payroll-related accruals) 18, 19 30 093 212
Bank overdraft 13 99 880
30 193 092
2018
Trade and other payables (including payroll-related accruals) 18, 19 29 982 197
Bank overdraft 13 152 191
30 134 388
COMPANY
2019
Trade and other payables 19 93 540
2018
Trade and other payables 19 67 501
Capital risk managementThe Group’s objectives when maintaining capital are:
• to safeguard the entity’s ability to continue as a going concern, so that it can continue to provide returns for shareholders and benefits for other stakeholders; and
• to provide an adequate return to shareholders by pricing services commensurately with the level of risk.
The Group sets the amount of capital it requires in proportion to risk. The Group manages its capital structure and makes adjustments to it in the light of changes in economic conditions and the risk characteristics of the underlying assets. In order to maintain or adjust the capital structure, the Group may adjust the amount of dividends paid to shareholders, issue new shares or sell assets to reduce debt. There have been no changes from the prior year in the manner in which the Group manages its capital.
Currently the Group has no significant borrowings from third parties and as such no externally imposed capital requirements exist.
PB
T G
RO
UP
• IN
TE
GR
AT
ED
RE
PO
RT
20
19
87

NOTES TO THE CONSOLIDATED AND SEPARATE FINANCIAL STATEMENTS [CONTINUED]for the year ended 31 March 2019
35. Financial instruments and risk management (continued)
Financial risk managementCredit riskCredit risk is the risk of financial loss to the Group if a client or counterparty to a financial instrument fails to meet its contractual obligations.
Significant increase in credit riskIn assessing whether the credit risk on a loan or trade receivable has increased significantly since initial recognition, the Group compares the risk of a default occurring as at the reporting date with the risk of a default occurring as at the date of initial recognition.
The Group considers both quantitative and qualitative information that is reasonable and supportable, including historical experience, cash flow and liquid asset position and forward-looking information that is available without undue cost or effort. Forward-looking information considered includes the future prospects of the industries in which the counterparties operate as well as consideration of various external sources of actual and forecast economic information.
Irrespective of the outcome of the above assessment, the credit risk on a loan or trade receivable is always presumed to have increased significantly since initial recognition if the contractual payments are past their contractual pay dates, unless the Group has reasonable and supportable information that demonstrates otherwise.
By contrast, if a loan or trade receivable is assessed to have a low credit risk at the reporting date, then it is assumed that the credit risk on the loan has not increased significantly since initial recognition.
The Group regularly monitors the effectiveness of the criteria used to identify whether there has been a significant increase in credit risk and revises them as appropriate to ensure that the criteria are capable of identifying significant increases in credit risk before the amount becomes past due.
Definition of a defaultFor purposes of internal credit risk management, the Group considers that a default event has occurred if there is either a breach of financial covenants by the counterparty or if the borrower is in significant financial difficulty such that it will have insufficient funds to repay the loan on demand. This is based on a number of factors including various liquidity and solvency ratios.
Write-off policyThe Group writes off a loan or trade receivable when there is information indicating that the counterparty is in severe financial difficulty and there is no realistic prospect of recovery. Loans or trade receivables written off may still be subject to enforcement activities under the Group recovery procedures, taking into account legal advice where appropriate. Any recoveries made are recognised in profit or loss.
Trade receivables comprise a widespread geographical base. Management evaluates credit risk relating to customers on an ongoing basis. If clients are independently rated, these ratings are used. Otherwise, if there is no independent rating, risk control assesses the credit quality of the client, taking into account its financial position, past experience and other factors.
The maximum exposure to credit risk is represented by the carrying amount of each financial asset in the statement of financial position.
88

35. Financial instruments and risk management (continued)
The maximum exposure to credit risk is presented in the table below:
Rand NotesGross carrying
amountCredit loss allowance
Amortised cost/fair value
GROUP
2019
Loans receivable 10 7 931 645 (177 764) 7 753 881
Trade and other receivables 11 103 401 062 (437 924) 102 963 138
Cash and cash equivalents 13 31 079 809 – 31 079 809
142 412 516 (615 688) 141 796 828
2018
Loans receivable 10 – – –
Trade and other receivables 11 88 709 265 – 88 709 265
Cash and cash equivalents 13 34 206 340 – 34 206 340
122 915 605 – 122 915 605
COMPANY
2019
Loans to Group companies 8 806 725 444 (688 059 639) 118 665 805
Trade and other receivables 11 125 758 – 125 758
Cash and cash equivalents 13 626 135 – 626 135
807 477 337 (688 059 639) 119 417 698
2018
Loans to Group companies 8 826 787 343 (686 435 333) 140 352 010
Trade and other receivables 11 2 798 435 – 2 798 435
Cash and cash equivalents 13 1 319 432 – 1 319 432
830 905 210 (686 435 333) 144 469 877
PB
T G
RO
UP
• IN
TE
GR
AT
ED
RE
PO
RT
20
19
89
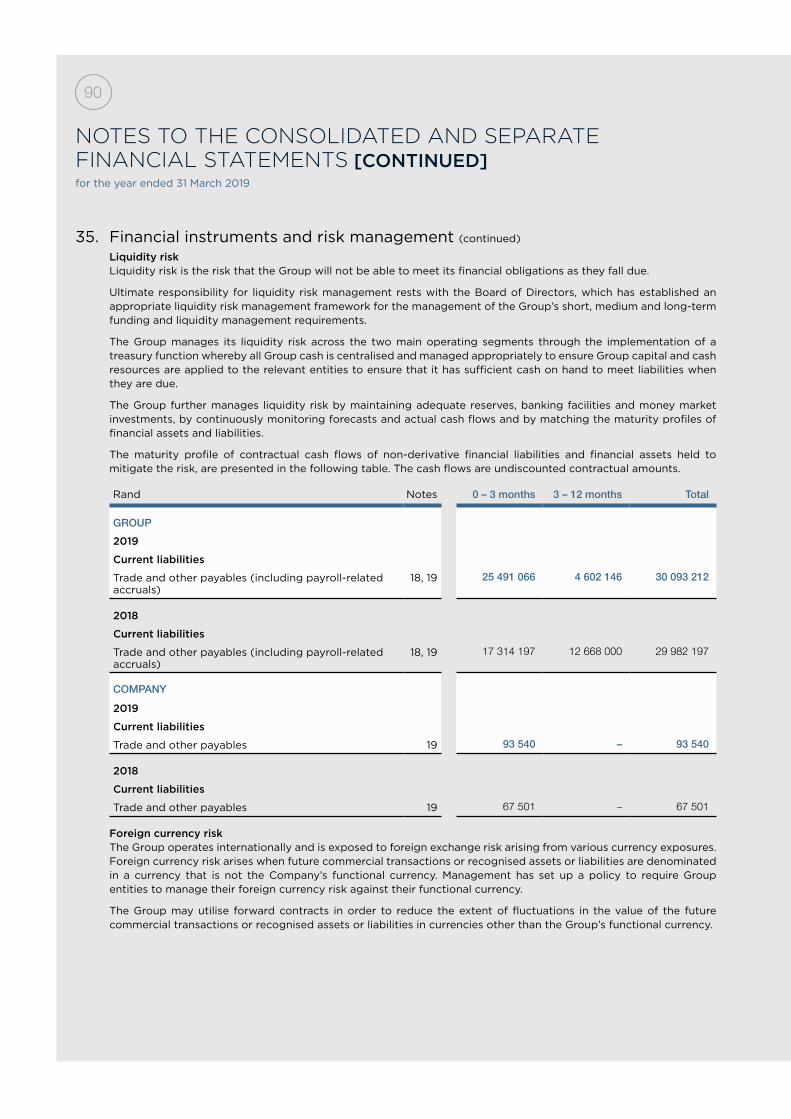
NOTES TO THE CONSOLIDATED AND SEPARATE FINANCIAL STATEMENTS [CONTINUED]for the year ended 31 March 2019
35. Financial instruments and risk management (continued)
Liquidity riskLiquidity risk is the risk that the Group will not be able to meet its financial obligations as they fall due.
Ultimate responsibility for liquidity risk management rests with the Board of Directors, which has established an appropriate liquidity risk management framework for the management of the Group’s short, medium and long-term funding and liquidity management requirements.
The Group manages its liquidity risk across the two main operating segments through the implementation of a treasury function whereby all Group cash is centralised and managed appropriately to ensure Group capital and cash resources are applied to the relevant entities to ensure that it has sufficient cash on hand to meet liabilities when they are due.
The Group further manages liquidity risk by maintaining adequate reserves, banking facilities and money market investments, by continuously monitoring forecasts and actual cash flows and by matching the maturity profiles of financial assets and liabilities.
The maturity profile of contractual cash flows of non-derivative financial liabilities and financial assets held to mitigate the risk, are presented in the following table. The cash flows are undiscounted contractual amounts.
Rand Notes 0 – 3 months 3 – 12 months Total
GROUP
2019
Current liabilities
Trade and other payables (including payroll-related accruals)
18, 19 25 491 066 4 602 146 30 093 212
2018
Current liabilities
Trade and other payables (including payroll-related accruals)
18, 19 17 314 197 12 668 000 29 982 197
COMPANY
2019
Current liabilities
Trade and other payables 19 93 540 – 93 540
2018
Current liabilities
Trade and other payables 19 67 501 – 67 501
Foreign currency riskThe Group operates internationally and is exposed to foreign exchange risk arising from various currency exposures. Foreign currency risk arises when future commercial transactions or recognised assets or liabilities are denominated in a currency that is not the Company’s functional currency. Management has set up a policy to require Group entities to manage their foreign currency risk against their functional currency.
The Group may utilise forward contracts in order to reduce the extent of fluctuations in the value of the future commercial transactions or recognised assets or liabilities in currencies other than the Group’s functional currency.
90

35. Financial instruments and risk management (continued)
The net carrying amounts, in Rand, of the various exposures, are denominated in the following currencies. The amounts have been presented in Rand by converting the foreign currency amounts at the closing rate at the reporting date:
GROUP COMPANY
Exposure in Rand Notes 2019 2018 2019 2018
Euro exposure
Current liabilities
Trade and other payables 19 (1 478 354) (1 327 843) – –
Great British Pound exposure
Current assets
Trade and other receivables 11 – 1 801 822 – –
Cash and cash equivalents 13 93 085 1 771 – –
93 085 1 803 593 – –
Nigerian Naira exposure
Current assets
Cash and cash equivalents 13 1 160 138 2 442 373 – –
United States Dollar exposure
Current assets
Trade and other receivables 11 1 747 131 15 185 221 – –
Current liabilities
Trade and other payables 19 (5 502 855) (4 331 863) – –
Net United States Dollar exposure (3 755 724) 10 853 358 – –
Net exposure to foreign currency in Rand
(3 980 855) 13 771 481 – –
Exchange rates
Rand per unit of foreign currency
Euro 16.265 14.609 –
Great British Pound 18.905 16.608 –
Nigerian Naira 0.040 0.033 –
United States Dollar 14.495 11.853 –
Interest rate risk As the Group has no significant interest-bearing assets, the Group’s income and operating cash flows are substantially independent of changes in market interest rates.
PB
T G
RO
UP
• IN
TE
GR
AT
ED
RE
PO
RT
20
19
91

NOTES TO THE CONSOLIDATED AND SEPARATE FINANCIAL STATEMENTS [CONTINUED]for the year ended 31 March 2019
36. Fair value informationFair value hierarchyThe table below analyses assets and liabilities carried at fair value. The different levels are defined as follows:
Level 1: Quoted unadjusted prices in active markets for identical assets or liabilities that the Group can access at measurement date.
Level 2: Inputs other than quoted prices included in level 1 that are observable for the asset or liability either directly or indirectly.
Level 3: Unobservable inputs for the asset or liability.
GROUP COMPANY
Exposure in Rand Notes 2019 2018 2019 2018
Levels of fair value measurements
Level 2
Financial assets at fair value through profit/(loss)
Bonds – 432 787 – –
Valuation techniques using observable inputs: quoted prices (other than those included in level 1) for similar instruments in active markets or quoted prices for identical or similar instruments in markets that are less than active and financial assets and liabilities valued using models where all significant inputs are observable directly or indirectly from market data.
Level 3
Recurring fair value measurements
ASSETS
Loans and receivables
Loans and receivables – 4 715 183 – –
Financial assets designated at fair value through profit and loss
Zuuse Limited (previously Progressclaim.com Limited)
– 23 844 118 – –
Equity investments at fair value through other comprehensive income
12
Zuuse Limited (previously Progressclaim.com Limited)
26 744 186 – – –
Financial assets at fair value through profit or loss
12
All Claims Proprietary Limited 124 729 – – –
Total 26 868 915 24 276 905 – –
92

36. Fair value information (continued)
Fair value reconciliationValuation techniques using significant unobservable inputs: financial assets and liabilities valued using valuation techniques where one or more inputs are unobservable and have a significant effect on the instrument’s valuation.
Financial assets recognised at fair value through profit or lossFor the investment classified as an asset held at fair value through profit or loss, the net asset value is management’s best judgement to be the fair value.
Equity instruments at fair value through other comprehensive incomeThe “revenue multiple” method was used to calculate the fair value of the investment as at year-end. A size discount of 13% was used as the entity is still small comparative to it peers and it is still in a startup phase. A minority and marketability discount of 20% was applied as the Group only owns a minority stake in the equity of the company and the shares are not freely traded on a stock market.
Reconciliation of assets and liabilities measured at level 3
Rand FVOCI FVTPL Total
Fair value reconciliation
Opening balance 23 598 877 245 241 23 844 118
Gains or losses for the period recognised in profit or loss* (154 774) (154 774)
Gains or losses for the period recognised in other comprehensive income#
3 145 309 34 262 3 179 571
26 744 186 124 729 26 868 915
* Gains and losses recognised in profit or loss are included in other operating gains on the statement of comprehensive income.# Gains and losses recognised in other comprehensive income are included in gains on valuation of investments in equity instruments
and exchange differences on translation of foreign operations on the statement of comprehensive income.
37. Going concernThe Directors believe that the Group has adequate financial resources to continue in operation for the foreseeable future and accordingly the consolidated annual financial statements have been prepared on a going concern basis. The Directors have satisfied themselves that the Group and Company are in a sound financial position and that they have access to sufficient borrowing facilities to meet their foreseeable cash requirements. The Directors are not aware of any new material changes that may adversely impact the Group or Company. The Directors are also not aware of any material non-compliance with statutory or regulatory requirements or of any pending changes to legislation which may affect the Group or Company.
38. Events after the reporting periodThe Directors are not aware of any matter or circumstance arising since the end of the financial year that materially affects the results of the Group for the year ended 31 March 2019 or the financial position as at that date.
PB
T G
RO
UP
• IN
TE
GR
AT
ED
RE
PO
RT
20
19
93

NOTES TO THE CONSOLIDATED AND SEPARATE FINANCIAL STATEMENTS [CONTINUED]for the year ended 31 March 2019
39. Comparative figuresCertain prior-year comparative figures have been reclassified for consistency with the current-year presentation of the consolidated and separate annual financial statements. These reclassifications had no effect on the reported results of operations.
The effects of the reclassification are as follows:
31 March 2018As originally presented
Reclassifi-cation
31 March 2018As restated
GROUP
Statement of financial position
Share capital1 117 804 955 (52 446 014) 65 358 941
Reserves1 (39 536 842) 52 446 014 12 909 172
Payroll-related accruals (previously provisions)2 6 790 383 1 794 050 8 584 433
Trade and other payables2 35 852 408 (1 794 050) 34 058 358
COMPANY
Statement of financial position
Share capital1 2 133 259 742 (51 891 691) 2 081 368 052
Reserves1 (51 891 691 ) 51 891 691 –
1. Treasury shares were previously classified under reserves in the statement of financial position. These shares have now been reclassified to share capital.
2. The line item on the face of the statement of financial position has been renamed from provisions to payroll-related accruals. An accrual for leave pay was previously classified under trade and other payables. This amount has now been reclassified from trade and other payables to payroll-related accruals.
40. Earnings per shareCents 2019 2018
Basic earnings per share Continuing operations 17.97 (97.28)
Discontinued operations 7.35 (28.20)
Diluted earnings per shareContinuing operations 17.97 (97.28)
Discontinued operations 7.35 (28.20)
The calculation of basic earnings per share as at 31 March 2019 was based on the profit attributable to ordinary shareholders of R31 million (2018: loss of R188.1 million) and a weighted average of ordinary shares outstanding of 124 063 076 (2018: 149 920 549).
Diluted earnings per share is equal to basic earnings per share. Diluted headline earnings per share is equal to headline earnings per share.
Weighted average number of ordinary sharesOrdinary shares at 1 April 1 669 250 950 1 669 250 950
Share consolidation 166 925 095 166 925 095
Effect of treasury shares held (42 521 023) (17 004 546)
Shares held by BEE company included in treasury shares (340 996) –
124 063 076 149 920 549
94

40. Earnings per share (continued)
Headline earnings per share
GROUP
2019 2018
Rand Gross Net Gross Net
Continuing operations
Profit attributable to equity holders of the parent
22 299 599 (145 835 399)
Losses on disposal of assets 348 153 250 670 – –
Impairments of assets 38 367 27 624 125 599 893 125 599 893
Headline earnings 22 577 893 (20 235 506)
Discontinued operations
Profit attributable to equity holders of the parent
9 113 855 (42 280 605)
Restatement to fair value of discontinued operations
12 842 435 12 842 435 16 371 089 16 371 089
Release of foreign currency translation reserve to the statement of profit/loss
(20 723 419) (20 723 419) – –
Change in fair value of investment property – – (3 545 056) (3 545 056)
Impairments of assets – – 26 477 198 26 477 198
1 232 871 (2 977 373)
GROUP
Cents 2019 2018
Headline earnings per share
Continuing operations 18.18 (13.50)
Discontinued operations 0.99 (1.99)
Diluted headline earnings per share
Continuing operations 18.18 (13.50)
Discontinued operations 0.99 (1.99)
Distributions
Capital reduction distribution – 1.57
Headline earnings per share has been calculated in accordance with Circular 01/2018 issued by the South African Institute of Chartered Accountants.
PB
T G
RO
UP
• IN
TE
GR
AT
ED
RE
PO
RT
20
19
95

41. Segment reportAs a result of the exiting of services in the Middle East/Africa (MEA), management no longer considers MEA to be a reportable segment.
Furthermore, the MEA operating segment does not meet any of the quantitative threshold requirements in terms of IFRS 8 Operating Segments.
All amounts relating to the MEA have been presented in the “Other” segment in the current year.
Due to the expansion of the business into the European market, management considers Europe to be a new segment in the current year.
The reportable segments for the current financial year are according to geographical areas, namely South Africa, Australia and Europe.
• South Africa includes consulting and implementation of data, management information software and healthcare administration services in the Republic of South Africa.
• Australia includes consulting and implementation of data, management information software and healthcare administration services in Australia.
• Europe includes consulting and implementation of data, and management information software in Europe.
The Group evaluates segmental performance on the basis of profit or loss from operations calculated in accordance with IFRS but excluding non-recurring losses such as goodwill impairment and the effects of share-based payments.
South Africa Australia Europe Other Total
Rand2019 2018
Restated2019 2018 2019 2018
Restated2019 2018
Restated2019 2018
Continuing operations
Revenues from external clients 476 915 874 404 231 382 60 041 772 64 383 335 10 324 203 6 038 126 41 132 560 81 440 724 588 414 409 556 093 567
Other income 240 903 52 325 – 272 982 – – 1 031 966 2 542 050 1 272 869 2 867 357
Interest revenue 3 260 745 2 026 453 112 129 115 664 – – 439 380 3 893 152 3 812 254 6 035 269
Cost of sales (361 587 160) (301 312 403) (52 173 460) (55 010 480) (1 315 017) (4 180 552) (25 789 730) (97 469 276) (440 865 367) (457 972 710)
Depreciation and amortisation (1 403 862) (1 774 267) (49 918) (516 440) – – (1 779 291) (3 011 582) (3 233 070) (5 302 289)
Impairments (38 367) (75 020) – – – – – (1 365 992) (38 367) (1 441 012)
Operating expenses (75 314 699) (65 569 469) (6 071 290) (6 866 555) (4 258 924) – (17 138 499) (14 404 005) (102 783 412) (86 840 028)
Interest expense (852 465) (1 785 363) (88) (5 078) – – (356 193) (3 400 496) (1 208 747) (5 190 937)
Income tax expense (12 127 336) (7 115 833) (553 765) (681 346) (38 713) – (4 378 171) (14 221 149) (17 097 985) (22 018 328)
Profit/(loss) for the year 29 093 632 28 677 807 1 305 380 1 692 083 4 711 550 1 857 574 (6 837 978) (45 996 573) 28 272 584 (13 769 110)
Discontinued operations
Revenues from external clients – – – – – – 4 816 394 11 542 901 4 816 394 11 542 901
Other income – – – – – – 1 096 511 3 693 331 1 096 511 3 693 331
Interest revenue – – – – – – 27 898 127 489 27 898 127 489
Foreign currency reserve released – – – – – – 20 723 419 – 20 723 419 –
Depreciation and amortisation – – – – – – (19 196) (52 021) (19 196) (52 021)
Impairments – – – – – – (12 842 435) (14 286 917) (12 842 435) (14 286 917)
Operating expenses – – – – – – (4 385 212) (19 609 575) (4 385 212) (19 609 575)
Interest expense – – – – – – (366 150) (1 136 392) (366 150) (1 136 392)
Income tax expense – – – – – – 62 626 162 553 62 626 162 553
Profit/(loss) for the year – – – – – – 9 113 855 (19 558 630) 9 113 855 (19 558 630)
NOTES TO THE CONSOLIDATED AND SEPARATE FINANCIAL STATEMENTS [CONTINUED]for the year ended 31 March 2019
96

41. Segment reportAs a result of the exiting of services in the Middle East/Africa (MEA), management no longer considers MEA to be a reportable segment.
Furthermore, the MEA operating segment does not meet any of the quantitative threshold requirements in terms of IFRS 8 Operating Segments.
All amounts relating to the MEA have been presented in the “Other” segment in the current year.
Due to the expansion of the business into the European market, management considers Europe to be a new segment in the current year.
The reportable segments for the current financial year are according to geographical areas, namely South Africa, Australia and Europe.
• South Africa includes consulting and implementation of data, management information software and healthcare administration services in the Republic of South Africa.
• Australia includes consulting and implementation of data, management information software and healthcare administration services in Australia.
• Europe includes consulting and implementation of data, and management information software in Europe.
The Group evaluates segmental performance on the basis of profit or loss from operations calculated in accordance with IFRS but excluding non-recurring losses such as goodwill impairment and the effects of share-based payments.
South Africa Australia Europe Other Total
Rand2019 2018
Restated2019 2018 2019 2018
Restated2019 2018
Restated2019 2018
Continuing operations
Revenues from external clients 476 915 874 404 231 382 60 041 772 64 383 335 10 324 203 6 038 126 41 132 560 81 440 724 588 414 409 556 093 567
Other income 240 903 52 325 – 272 982 – – 1 031 966 2 542 050 1 272 869 2 867 357
Interest revenue 3 260 745 2 026 453 112 129 115 664 – – 439 380 3 893 152 3 812 254 6 035 269
Cost of sales (361 587 160) (301 312 403) (52 173 460) (55 010 480) (1 315 017) (4 180 552) (25 789 730) (97 469 276) (440 865 367) (457 972 710)
Depreciation and amortisation (1 403 862) (1 774 267) (49 918) (516 440) – – (1 779 291) (3 011 582) (3 233 070) (5 302 289)
Impairments (38 367) (75 020) – – – – – (1 365 992) (38 367) (1 441 012)
Operating expenses (75 314 699) (65 569 469) (6 071 290) (6 866 555) (4 258 924) – (17 138 499) (14 404 005) (102 783 412) (86 840 028)
Interest expense (852 465) (1 785 363) (88) (5 078) – – (356 193) (3 400 496) (1 208 747) (5 190 937)
Income tax expense (12 127 336) (7 115 833) (553 765) (681 346) (38 713) – (4 378 171) (14 221 149) (17 097 985) (22 018 328)
Profit/(loss) for the year 29 093 632 28 677 807 1 305 380 1 692 083 4 711 550 1 857 574 (6 837 978) (45 996 573) 28 272 584 (13 769 110)
Discontinued operations
Revenues from external clients – – – – – – 4 816 394 11 542 901 4 816 394 11 542 901
Other income – – – – – – 1 096 511 3 693 331 1 096 511 3 693 331
Interest revenue – – – – – – 27 898 127 489 27 898 127 489
Foreign currency reserve released – – – – – – 20 723 419 – 20 723 419 –
Depreciation and amortisation – – – – – – (19 196) (52 021) (19 196) (52 021)
Impairments – – – – – – (12 842 435) (14 286 917) (12 842 435) (14 286 917)
Operating expenses – – – – – – (4 385 212) (19 609 575) (4 385 212) (19 609 575)
Interest expense – – – – – – (366 150) (1 136 392) (366 150) (1 136 392)
Income tax expense – – – – – – 62 626 162 553 62 626 162 553
Profit/(loss) for the year – – – – – – 9 113 855 (19 558 630) 9 113 855 (19 558 630)
PB
T G
RO
UP
• IN
TE
GR
AT
ED
RE
PO
RT
20
19
97

41. Segment report (continued)
South Africa Australia Europe Other Total
Rand2019 2018
Restated2019 2018 2019 2018
Restated2019 2018
Restated2019 2018
Group
Revenues from external clients 476 915 874 404 231 382 60 041 772 64 383 335 10 324 203 6 038 126 45 948 954 92 983 625 593 230 803 567 636 468
Other income 240 903 52 325 – 272 982 – – 2 128 477 6 235 381 2 369 380 6 560 688
Interest revenue 3 260 745 2 026 453 112 129 115 664 – – 467 278 4 020 641 3 840 152 6 162 758
Foreign currency reserve released – – – – – – 20 723 419 – 20 723 419 –
Cost of sales (361 587 160) (301 312 403) (52 173 460) (55 010 480) (1 315 017) (4 180 552) (25 789 730) (97 469 276) (440 865 367) (457 972 710)
Depreciation and amortisation (1 403 862) (1 774 267) (49 918) (516 440) – – (1 798 487) (3 063 603) (3 252 266) (5 354 310)
Impairments (38 367) (75 020) – – – – (12 842 435) (15 652 909) (12 880 802) (15 727 928)
Operating expenses (75 314 699) (65 569 469) (6 071 290) (6 866 555) (4 258 924) – (21 523 711) (34 013 580) (107 168 624) (106 449 603)
Interest expense (852 465) (1 785 363) (88) (5 078) – – (722 343) (4 536 888) (1 574 897) (6 327 329)
Income tax expense (12 127 336) (7 115 833) (553 765) (681 346) (38 713) – (4 315 545) (14 058 596) (17 035 358) (21 855 775)
Profit/(loss) for the year 29 093 632 28 677 807 1 305 380 1 692 083 4 711 550 1 857 574 2 275 878 (65 555 204) 37 386 440 (33 327 741)
Continuing operations
Segment assets* 120 003 612 90 013 256 26 105 076 20 282 517 5 286 300 – 34 042 428 54 154 550 185 437 417 164 450 323
Intangible assets 221 872 479 430 – – – – 22 754 195 653 244 626 675 082
Total assets 120 225 485 90 492 686 26 105 076 20 282 517 5 286 300 – 34 065 182 54 350 203 185 682 043 165 125 405
Segment liabilities (35 286 857) (27 632 909) (7 160 215) (4 748 301) (361 008) – (7 781 242) (12 372 175) (50 589 321) (44 753 385)
Discontinued operations
Segment assets* – – – – – – – 57 120 959 – 57 120 959
Intangible assets – – – – – – – – – –
Total assets – – – – – – – 57 120 959 – 57 120 959
Segment liabilities – – – – – – – (6 572 032) – (6 572 032)
Group
Segment assets* 120 003 612 90 013 256 26 105 076 20 282 517 5 286 300 – 34 042 428 111 275 509 185 437 417 221 571 282
Intangible assets 221 872 479 430 – – – – 22 754 195 653 244 626 675 082
Total assets 120 225 485 90 492 686 26 105 076 20 282 517 5 286 300 – 34 065 182 111 471 162 185 682 043 222 246 364
Segment liabilities (35 286 857) (27 632 909) (7 160 215) (4 748 301) (361 008) – (7 781 242) (18 944 208) (50 589 321) (51 325 417)
* Goodwill is not managed as part of segment assets and has therefore been excluded.
SEGMENT REPORT [CONTINUED]for the year ended 31 March 2019
98

41. Segment report (continued)
South Africa Australia Europe Other Total
Rand2019 2018
Restated2019 2018 2019 2018
Restated2019 2018
Restated2019 2018
Group
Revenues from external clients 476 915 874 404 231 382 60 041 772 64 383 335 10 324 203 6 038 126 45 948 954 92 983 625 593 230 803 567 636 468
Other income 240 903 52 325 – 272 982 – – 2 128 477 6 235 381 2 369 380 6 560 688
Interest revenue 3 260 745 2 026 453 112 129 115 664 – – 467 278 4 020 641 3 840 152 6 162 758
Foreign currency reserve released – – – – – – 20 723 419 – 20 723 419 –
Cost of sales (361 587 160) (301 312 403) (52 173 460) (55 010 480) (1 315 017) (4 180 552) (25 789 730) (97 469 276) (440 865 367) (457 972 710)
Depreciation and amortisation (1 403 862) (1 774 267) (49 918) (516 440) – – (1 798 487) (3 063 603) (3 252 266) (5 354 310)
Impairments (38 367) (75 020) – – – – (12 842 435) (15 652 909) (12 880 802) (15 727 928)
Operating expenses (75 314 699) (65 569 469) (6 071 290) (6 866 555) (4 258 924) – (21 523 711) (34 013 580) (107 168 624) (106 449 603)
Interest expense (852 465) (1 785 363) (88) (5 078) – – (722 343) (4 536 888) (1 574 897) (6 327 329)
Income tax expense (12 127 336) (7 115 833) (553 765) (681 346) (38 713) – (4 315 545) (14 058 596) (17 035 358) (21 855 775)
Profit/(loss) for the year 29 093 632 28 677 807 1 305 380 1 692 083 4 711 550 1 857 574 2 275 878 (65 555 204) 37 386 440 (33 327 741)
Continuing operations
Segment assets* 120 003 612 90 013 256 26 105 076 20 282 517 5 286 300 – 34 042 428 54 154 550 185 437 417 164 450 323
Intangible assets 221 872 479 430 – – – – 22 754 195 653 244 626 675 082
Total assets 120 225 485 90 492 686 26 105 076 20 282 517 5 286 300 – 34 065 182 54 350 203 185 682 043 165 125 405
Segment liabilities (35 286 857) (27 632 909) (7 160 215) (4 748 301) (361 008) – (7 781 242) (12 372 175) (50 589 321) (44 753 385)
Discontinued operations
Segment assets* – – – – – – – 57 120 959 – 57 120 959
Intangible assets – – – – – – – – – –
Total assets – – – – – – – 57 120 959 – 57 120 959
Segment liabilities – – – – – – – (6 572 032) – (6 572 032)
Group
Segment assets* 120 003 612 90 013 256 26 105 076 20 282 517 5 286 300 – 34 042 428 111 275 509 185 437 417 221 571 282
Intangible assets 221 872 479 430 – – – – 22 754 195 653 244 626 675 082
Total assets 120 225 485 90 492 686 26 105 076 20 282 517 5 286 300 – 34 065 182 111 471 162 185 682 043 222 246 364
Segment liabilities (35 286 857) (27 632 909) (7 160 215) (4 748 301) (361 008) – (7 781 242) (18 944 208) (50 589 321) (51 325 417)
* Goodwill is not managed as part of segment assets and has therefore been excluded.
PB
T G
RO
UP
• IN
TE
GR
AT
ED
RE
PO
RT
20
19
99

41. Segment report (continued)
Rand 2019 2018
Reconciliation of reportable segment revenue
Total consolidated income for reportable segments 593 230 803 567 636 468
Elimination of discontinued operations (4 816 394) (11 542 901)
Consolidated total income 588 414 409 556 093 567
Reconciliation of profit before taxation
Total consolidated profit before taxation for reportable segments 54 421 798 (11 471 966)
Less impairment of goodwill – (125 599 893)
Less share-based payment expense (32 147) –
Add other operating gains (497 750) –
Add gains/losses on exchange differences 1 152 300 –
Add movement in credit loss allowances 4 752 726 –
Elimination of discontinued operations (9 051 229) 19 721 183
Consolidated profit before taxation 50 745 698 (117 350 675)
Reconciliation of assets
Total assets for reportable segments 151 616 861 110 775 202
Goodwill 135 666 420 135 666 420
Assets for other segments 34 065 182 111 471 162
Elimination of discontinued operations – (57 120 959)
Consolidated total assets 321 348 464 300 791 826
Reconciliation of liabilities
Total liabilities for reportable segment (42 808 079) (32 381 210)
Liabilities for other segments (7 781 242) (18 944 208)
Elimination of discontinued operations – 6 572 032
Consolidated total liabilities (50 589 321) (44 753 385)
SEGMENT REPORT [CONTINUED]for the year ended 31 March 2019
100

ANNUAL GENERAL MEETING
PB
T G
RO
UP
• IN
TE
GR
AT
ED
RE
PO
RT
20
19
101
PB
T G
RO
UP
• IN
TE
GR
AT
ED
RE
PO
RT
20
19

PBT GROUP LIMITED(Incorporated in the Republic of South Africa)(Registration number: 1936/008278/06)JSE share code: PBG ISIN: ZAE000256319(“PBT Group” or “the Company” or “the Group”)
NOTICE IS HEREBY GIVEN that the next Annual General Meeting (AGM) of the shareholders of the Company will be held in the boardroom at 10:00 on Friday, 2 August 2019 at PBT House, 2 Mews Close, Waterford Mews, Century City, Cape Town, to conduct the undermentioned business and for the undermentioned ordinary and special resolutions to be proposed:
Presentation of audited financial statementsThe audited consolidated financial statements of the Company, including the Reports of the Directors, the Audit and Risk Committee and the independent auditor, for the year ended 31 March 2019, will be presented to shareholders as required in terms of section 30(3)(d) of the Companies Act, Act 71 of 2008 (as amended) (Companies Act). The complete set of Audited Consolidated Annual Financial Statements, together with the Directors’ and Independent Auditor’s Reports are set out on pages 32 to 100 of the Company’s Integrated Report for the year ended 31 March 2019 (Integrated Report) and the Audit and Risk Committee Report are set out on pages 28 and 29 thereof.
Ordinary resolutionsTo consider and, if deemed fit, to pass, the undermentioned Ordinary Resolutions Numbers 1 to 7 with or without modification.
In order to be adopted:
• Ordinary Resolutions Numbers 1, 2, 3, 5, 6 and 7 require the support of more than 50% (fifty percent) of the total number of votes exercisable by shareholders present or represented by proxy at the meeting; and
• Ordinary Resolution Number 4 requires the support of at least 75% (seventy-five percent) of the total number of votes exercisable by shareholders present or represented by proxy at the meeting.
1. Ordinary Resolution Number OneTHE REAPPOINTMENT OF THE INDEPENDENT AUDITOR AND DESIGNATED AUDITOR To reappoint, as recommended by the Company’s Audit Committee, the firm BDO Cape Inc as independent auditors and Imtiaaz Hashim as the individual designated auditor, of the Company for the ensuing period terminating on the conclusion of the next AGM of the Company and to authorise the Directors
NOTICE OF ANNUAL GENERAL MEETINGFor the year ended 31 March 2019
to determine the remuneration of the auditors for the past year.
2. Ordinary Resolution Number TwoTHE REAPPOINTMENT OF NON-EXECUTIVE DIRECTORSTo re-elect the following Non-Executive Directors who, in terms of the Company’s Memorandum of Incorporation (MOI), retire by rotation at the AGM, but, being eligible, offer themselves for re-election:
2.1 Herman Steyn.
2.2 Arthur Winkler.
Brief biographies of the aforementioned Non-Executive Directors are included on page 12 of this document.
The appointments numbered 2.1 and 2.2 constitute separate ordinary resolutions and will be considered by separate votes.
3. Ordinary Resolution Number ThreeTHE APPOINTMENT OF THE AUDIT AND RISK COMMITTEE FOR THE ENSUING YEARTo elect the following Directors, who are eligible and offer themselves for election, to the Audit Committee for the ensuing year, as recommended by the Board of Directors of the Company (Board) in accordance with section 94(2) of the Companies Act:
3.1 Arthur Winkler (Chairman) – subject to the passing of Ordinary Resolution Number 2.2.
3.2 Cheree Dyers.
3.3 Tony Taylor.
Brief biographies of the aforementioned Non-Executive Directors are included on page 12 of this document.
The appointments numbered 3.1 to 3.3 constitute separate ordinary resolutions and will be considered by separate votes.
4. Ordinary Resolution Number FourGENERAL AUTHORITY TO ISSUE SECURITIES FOR CASHTo authorise the Directors of the Company, by way of a general authority, to allot and issue for cash any or all of its authorised but unissued ordinary shares and to issue any options/convertible securities that are convertible into an existing class of equity securities in the share capital of the Company as they in their discretion may
102

deem fit, without restriction, subject to the provisions
of the Listings Requirements of the JSE (Listings
Requirements), the Companies Act and the MOI of the
Company, and provided further that:
(a) the approval shall be valid until the date of the
next AGM, provided it shall not extend beyond
15 (fifteen) months from the date of this resolution;
(b) the number of ordinary shares issued for cash shall,
in any one financial year in the aggregate, not exceed
32 384 088 shares, being 30% (thirty percent) of
the Company’s issued shares as at the date of this
notice, excluding treasury shares;
(c) after the Company has issued shares in terms of
this general authority representing, on a cumulative
basis within a financial year, 5% (five percent) or
more of the number of shares in issue prior to that
issue, the Company will publish an announcement
containing full details of the issue, including the
effects of the issue on the net asset value per
share, net tangible asset value per share, earnings
per share, headline earnings per share, and diluted
earnings and headline earnings per share;
(d) in determining the price at which an issue of shares
may be made in terms of this authority, the maximum
discount at which such shares may be issued will be
10% (ten percent) of the weighted average traded
price on the JSE of those shares over the 30 (thirty)
business days prior to the date that the price of the
issue is determined or agreed between the issuer
and the party subscribing for the securities. The JSE
should be consulted for a ruling if the Company’s
shares have not traded in such 30 (thirty)-business-
day period;
(e) any shares issued under this authority during the
period contemplated in paragraph (a) above, must
be deducted from the number in paragraph (b)
above;
(f) in the event of a subdivision or consolidation of
issued shares during the period contemplated in
paragraph (a) above, the existing authority must
be adjusted accordingly to represent the same
allocation ratio;
(g) any such issue will only be made to public
shareholders as defined in the Listings Requirements
and not to related parties; and
(h) the shares, which are the subject of the issue for
cash, will be of a class already in issue, or where
this is not the case, will be limited to such shares or rights that are convertible to a class already in issue.
EXPLANATORY NOTE The reason for this ordinary resolution is, and the effect thereof will be to authorise the Directors to allot and issue, for cash, any of the Company’s unissued ordinary shares, as they in their discretion deem fit, subject to the applicable provisions of the Listings Requirements, the Companies Act, the MOI and this resolution.
As mentioned above, in terms of the Listings Requirements, this ordinary resolution requires the support of at least 75% (seventy-five percent) of the total number of votes exercisable by shareholders present or represented by proxy at the meeting.
5. Ordinary Resolution Number FiveDIRECTORS’ OR GROUP COMPANY SECRETARY’S AUTHORITY TO IMPLEMENT RESOLUTIONSTo authorise each and every Director of the Company to do all such things and sign all documents and take all such actions as they consider necessary to give effect to and implement the ordinary and special resolutions as set out in this notice.
6. Ordinary Resolution Number SixNON-BINDING ADVISORY VOTE ON THE REMUNERATION POLICY OF THE COMPANY AND THE IMPLEMENTATION OF THE REMUNERATION POLICY OF THE COMPANYTo endorse, by way of non-binding votes:
6.1 The Company’s Remuneration Policy detailed on pages 20 and 21 of the Company’s Integrated Report.
6.2 The Company’s Remuneration Implementation Report detailed on pages 20 and 21 of the Company’s Integrated Report.
The ordinary resolutions numbered 6.1 and 6.2 constitute separate ordinary resolutions and will be considered by separate votes.
In accordance with Principle 14 of the King Report on Corporate Governance for South Africa, 2016 (King IV™), the Company’s Remuneration Policy and Remuneration Implementation Report are tabled for consideration by shareholders. These votes enable shareholders to express their views on the remuneration policies adopted by the company and on the implementation thereof.
Ordinary Resolution Numbers 6.1 and 6.2 are of an advisory nature only and failure to pass these resolutions
PB
T G
RO
UP
• IN
TE
GR
AT
ED
RE
PO
RT
20
19
103

will therefore not have any legal consequences relating to existing remuneration arrangements; however, the Board will take the outcome of the votes on these resolutions into consideration when considering amendments to the Company’s Remuneration Policy. Should either of the resolutions, or both, be opposed by 25% (twenty-five percent) or more of the total number of votes exercisable by shareholders present or represented by proxy at the AGM, the Board will issue an invitation, included in the announcement to shareholders advising of the results of the AGM, to be published on SENS on 5 July 2019, to those shareholders who voted against the applicable resolution to engage with the Company at a meeting scheduled for this purpose.
7. Ordinary Resolution Number Seven GENERAL PAYMENTSTo resolve that, in terms of the MOI and subject to the provisions of the Companies Act and the Listings Requirements, the Board shall be entitled, from time to time, to pay by way of a reduction of share premium, capital distributions to shareholders of the Company in lieu of a dividend. Such distributions shall be made pro rata to all shareholders and shall be amounts equal to the amounts which the Board would have declared and paid out of profits of the Company as interim and final dividends in respect of the financial year ending 31 March 2019. This authority shall not extend beyond the date of the AGM following the date of the AGM at which this resolution is being proposed, or 15 (fifteen) months from the date of the resolution, whichever is shorter.
It is the intention of the Company and/or any of its subsidiaries to utilise the general authority to make a general payment to shareholders, if at some future date the cash resources of the Company are in excess of its requirements. In this regard, the Board will take account of, inter alia, appropriate capitalisation structures for the Company as well as the long-term cash needs of the Company and will ensure that any such payments are in the interests of shareholders.
The method by which the Company intends to make general payments to shareholders in terms of a general authority and the date on which such payments will take place has not yet been determined.
Special resolutionsTo consider and if deemed fit, pass, the undermentioned
Special Resolutions Numbers 1 to 3, with or without
modification. In order to be adopted these resolutions
require the support of at least 75% (seventy-five percent)
of the total number of votes exercisable by shareholders
present or represented by proxy at the meeting:
1. Special Resolution Number OneFINANCIAL ASSISTANCETo authorise the Board, in accordance with section 45(2)
and 45(3) of the Companies Act, Act 71 of 2008,
it is hereby resolved that the Board be and is hereby
authorised to provide direct or indirect financial assistance
to a Director or prescribed officer of the Company or
of a related or interrelated company, or to a related or
interrelated company or corporation, or to a member of a
related or interrelated corporation, or to a person related
to any such company, corporation, Director, prescribed
officer or member, subject to subsections (3) and (4) of
the Companies Act and the Listings Requirements; and
resolved further, in accordance with section 44(2) and
44(3) of the Companies Act, that the Board be and is
hereby authorised to provide financial assistance by way
of a loan, guarantee, the provision of security or otherwise
to any person for the purpose of, or in connection with,
the subscription of any option, or any shares, issued or
to be issued by the Company or a related or interrelated
company, or for the purchase of any shares of the
Company or a related or interrelated company, subject
to subsection (3) of the Companies Act and the Listings
Requirements, provided that the Board is satisfied that
immediately after providing the financial assistance in
terms of sections 44 and/or 45 of the Companies Act,
the Company will satisfy the solvency and liquidity tests
contemplated in section 4 of the Companies Act, that the
terms under which the financial assistance is proposed to
be given are fair and reasonable to the Company and that
the conditions or restrictions in respect of the granting of
the financial assistance which may be set out in the MOI
have been satisfied.
2. Special Resolution Number TwoGENERAL AUTHORITY TO REPURCHASE SHARES To authorise the Company (or one of its subsidiaries) to
repurchase or purchase, as the case may be, ordinary
shares issued by the Company on such terms and
conditions and in such amounts as the Directors of
the Company may from time to time determine, but
subject always to the provisions of sections 46 and 48
NOTICE OF ANNUAL GENERAL MEETING [CONTINUED]
104

of the Act, the Listings Requirements and the following limitations:
2.1 that the repurchase of shares be effected through the order book operated by the JSE trading system and be done without any prior understanding or arrangement between the Company and the counterparty (reported trades are prohibited);
2.2 that this authority shall not extend beyond 15 (fifteen) months from the date of this resolution or the date of the next AGM, whichever is the earlier date;
2.3 that authorisation thereto is given by the Company’s MOI;
2.4 that an announcement be made giving such details as may be required in terms of the Listings Requirements when the Company (or a subsidiary or subsidiaries collectively) has cumulatively repurchased 3% (three percent) of the initial number (the number of that class of share in issue at the time that the general authority is granted) of the relevant class of securities and for each 3% (three percent) in aggregate of the initial number of that class acquired thereafter;
2.5 at any one time, the Company (or any subsidiary) may only appoint one agent to effect any repurchase on behalf of the Company or any subsidiary (as the case may be);
2.6 the repurchase of shares by the Company or its subsidiaries will not take place during a prohibited period as defined by the Listings Requirements unless they have in place a repurchase programme where the dates and quantities of securities to be traded during the relevant period are fixed (not subject to any variation), and this programme has been submitted to the JSE in writing. The Company must instruct an independent third party, which makes its investment decisions in relation to the Company’s securities independently of, and uninfluenced by, the Company, prior to commencement of the prohibited period to execute the repurchase programme submitted to the JSE;
2.7 the repurchase of shares shall not, in the aggregate, in any one financial year, exceed 10% (ten percent) of the Company’s issued share capital at the time this authority is given, provided that a subsidiary of the Company (or subsidiaries of the Company collectively) shall not hold in excess of 10% (ten percent) of the number of shares issued by the Company;
2.8 the repurchase of shares may not be made at a price greater than 10% (ten percent) above the
weighted average traded price of the market value of the shares as determined over the 5 (five) business days immediately preceding the date on which the transaction was effected; and
2.9 prior to entering the market to proceed with the repurchase, the Board shall have passed a resolution that it has authorised the repurchase, that the Company and its subsidiaries have passed the solvency and liquidity tests as set out in section 4 of the Act and confirming that, since the tests were performed, there had been no material changes to the financial position of the Group.
The reason for this special resolution is, and the effect thereof will be, to grant, in terms of the provisions of the Act and the Listings Requirements, and subject to the terms and conditions embodied in the said special resolution, a general authority to the Directors to approve the acquisition by the Company of its own shares, or by a subsidiary (or subsidiaries) of the Company of the Company’s shares, which authority shall be used by the Directors at their discretion during the course of the period so authorised.
DISCLOSURES REQUIRED IN TERMS OF THE LISTINGS REQUIREMENTSIn terms of the Listings Requirements, the following disclosures are required with reference to the repurchase of the Company’s shares as set out in Special Resolution Number 2 above:
STATEMENT OF DIRECTORSAs at the date of this report, the Company’s Directors undertake that, after considering the effect of the maximum repurchase permitted, they will not implement any such repurchase unless the provisions of sections 4 and 48 of the Act will be complied with and for a period of 12 (twelve) months after such general repurchase:
(i) the Company and the Group will be able, in the ordinary course of business, to pay its debts;
(ii) the assets of the Company and the Group will be in excess of the liabilities of the Company and the Group, recognised and measured in accordance with International Financial Reporting Standards;
(iii) the share capital and reserves of the Company and the Group will be adequate for ordinary business purposes;
(iv) the working capital resources of the Company and the Group will be adequate for ordinary business purposes; and
(v) the Company and the Group have complied with the applicable provisions of the Act and the Listings Requirements.
PB
T G
RO
UP
• IN
TE
GR
AT
ED
RE
PO
RT
20
19
105

DIRECTORS’ RESPONSIBILITY STATEMENTThe Directors, whose names are given on pages 12 and 13 of this report, collectively and individually, accept full responsibility for the accuracy of the information pertaining to the above special resolution and certify that to the best of their knowledge and belief there are no facts that have been omitted which would make any statement false or misleading, and that all reasonable enquiries to ascertain such facts have been made and that the above special resolution contains all information required by law and the Listings Requirements.
MATERIAL CHANGESOther than the facts and developments reported on in this report, there have been no material changes in the affairs, financial or trading position of the Group since the signature date of this report and the posting date thereof.
The following further disclosures required in terms of the Listings Requirements are set out in accordance with the reference pages in this document of which this notice forms part:
• Major shareholders of the Company (refer to pages 6 and 7 of this report).
• Share capital (refer to note 15 on page 70 of this report).
3. Special Resolution Number ThreeAUTHORITY TO PAY NON-EXECUTIVE DIRECTORS’ FEESThat the Non-Executive Directors’ fees paid for the period ended 31 March 2019 as set out on page 21 of this report, be and are hereby approved.
Further, that the Non-Executive Directors’ fees payable for the period 1 April 2019 to 31 March 2020 be and are hereby approved:
Rand 2020 2019
DirectorTony Taylor (Chairman) 208 800 194 400
Cheree Dyers 174 000 162 000
Herman Steyn 174 000 162 000
Arthur Winkler 174 000 162 000
Additional fees are paid per meeting to Non-Executive Directors for meeting attendances as follows:
Rand 2020 2019
Board meetings 11 500 10 750
Audit and Risk Committee 6 000 5 500
Nominations and Remuneration Committee
6 000 5 500
Social and Ethics Committee
6 000 5 500
The reason for this special resolution is, and the effect thereof will be, to grant the Company the authority to pay fees to Non-Executive Directors for their services as Directors in terms of section 66 of the Companies Act. Furthermore, in terms of the Act and the King IV Report on Governance for South Africa, remuneration payable to Non-Executive Directors should be approved by shareholders in advance or within the previous two years.
To transact such other business (if any) as may be transacted at an annual general meeting ENTITLEMENT TO ATTEND AND VOTE AT THE ANNUAL GENERAL MEETING IN PERSON OR BY PROXY• Equity securities held by a share trust or scheme will
not have their votes at the AGM taken into account for the purposes of resolutions passed in terms of the Listing Requirements.
• Unlisted securities (if applicable) and shares held as treasury shares may not vote.
CERTIFICATED AND DEMATERIALISED SHAREHOLDERS WITH “OWN NAME” REGISTRATION A member entitled to attend and vote at the AGM is entitled to appoint a proxy to attend, speak and vote in his/her place. The proxy need not be a member of the Company. Proxy forms may be presented any time prior to or at the AGM and also at the Company’s registered office, or the Company’s transfer secretaries. Should proxy forms be presented at the Company’s transfer secretaries these must be completed and received at least 48 (forty-eight) hours before the commencement of the AGM (excluding weekends and public holidays). Presentation of suitable identification by the proxy when registering his/her attendance on the day of the AGM will be required.
DEMATERIALISED SHAREHOLDERS, OTHER THAN WITH “OWN NAME” REGISTRATION Shareholders who have already dematerialised their shares other than with “own name” registration, must advise their Central Securities Depository Participant (CSDP) or broker of their voting instructions if they are unable to attend the AGM but wish to be represented thereat. This should be done by the cut-off time stipulated by their CSDP or broker. If, however, such members wish to attend the AGM in person, then they will need to request their CSDP or broker to provide them with the necessary letter of representation in terms of the custody agreement entered into between the dematerialised shareholder and the CSDP or broker.
NOTICE OF ANNUAL GENERAL MEETING [CONTINUED]
106

SHAREHOLDER RIGHTS In terms of section 58 of the Companies Act, shareholders
have rights to be represented by proxy as herewith stated.
1. At any time, a shareholder of the Company may appoint
any individual, including an individual who is not a
shareholder of the Company, as a proxy to:
(a) participate in, and speak and vote at, a shareholders’
meeting on behalf of the shareholder; or
(b) give or withhold written consent on behalf of
the shareholder to a decision contemplated in
section 60.
Provided that the shareholder may appoint more than
one proxy to exercise voting rights attached to different
shares held by the shareholder.
2. A proxy appointment:
(a) must be in writing, dated and signed by the
shareholder; and
(b) remains valid for:
(i) one year after the date on which it was signed;
or
(ii) any longer or shorter period expressly set out in
the appointment, unless it is revoked in a manner
contemplated in subsection (4)(c), or expires
earlier as contemplated in subsection (8)(d).
3. Except to the extent that the Memorandum of
Incorporation of the Company provides otherwise:
(a) a shareholder of the Company may appoint two or more persons concurrently as proxies, and may appoint more than one proxy to exercise voting rights attached to different securities held by the shareholder;
(b) a proxy may delegate the proxy’s authority to act on behalf of the shareholder to another person, subject to any restriction set out in the instrument appointing the proxy; and
(c) a copy of the instrument appointing a proxy must be delivered to the Company, or to any other person on behalf of the Company, before the proxy exercises any rights of the shareholder at a shareholders’ meeting.
4. Irrespective of the form of instrument used to appoint a proxy:
(a) the appointment is suspended at any time and to the extent that the shareholder chooses to act directly and in person in the exercise of any rights as a shareholder;
(b) the appointment is revocable unless the proxy appointment expressly states otherwise; and
(c) if the appointment is revocable, a shareholder may revoke the proxy appointment by:
(i) cancelling it in writing, or making a later inconsistent appointment of a proxy; and
(ii) delivering a copy of the revocation instrument to the proxy, and to the Company.
PARTICIPATION IN THE MEETING The Board has determined the following salient dates in respect of the AGM:
Record date to receive the Notice of the Annual General Meeting Friday, 28 June 2019
Date of posting the Notice of Annual General Meeting Friday, 5 July 2019
Last date to trade to be eligible to vote Tuesday, 23 July 2019
Record date to be eligible to attend, participate and vote at the Annual General Meeting Friday, 26 July 2019
For administrative purposes, preferable date by which forms of proxy for the Annual General Meeting are requested to be lodged, by 10:00 on Wednesday, 31 July 2019
Annual General Meeting at 10:00 Friday, 2 August 2019
Results of Annual General Meeting published on SENS on Friday, 2 August 2019
Meeting participants will be required to provide proof of identification to the reasonable satisfaction of the Chairman of the AGM if they are not known to the Chairman and must accordingly bring a copy of their identity document, passport or driver’s licence to the AGM. If in doubt as to whether any document will be regarded as satisfactory proof of identification, meeting participants should contact the transfer secretaries for guidance.
This Notice of Annual General Meeting includes the attached proxy form.
PB
T G
RO
UP
• IN
TE
GR
AT
ED
RE
PO
RT
20
19
107

5. The revocation of a proxy appointment constitutes a
complete and final cancellation of the proxy’s authority
to act on behalf of the shareholder as of the later of:
(a) the date stated in the revocation instrument, if any;
or
(b) the date on which the revocation instrument was
delivered as required in subsection (4)(c)(ii).
6. If the instrument appointing a proxy or proxies has been
delivered to the Company, as long as that appointment
remains in effect, any notice that is required by this Act
or the Company’s Memorandum of Incorporation to be
delivered by the Company to the shareholder must be
delivered by the Company to:
(a) the shareholder; or
(b) the proxy or proxies, if the shareholder has
(i) directed the Company to do so, in writing; and
(ii) paid any reasonable fee charged by the Company
for doing so.
7. A proxy is entitled to exercise, or abstain from
exercising, any voting right of the shareholder without
direction, except to the extent that the Memorandum of
Incorporation, or the instrument appointing the proxy,
provides otherwise.
8. If the Company issues an invitation to shareholders to
appoint one or more persons named by the Company as
a proxy, or supplies a form of instrument for appointing
a proxy:
(a) the invitation must be sent to every shareholder
which is entitled to notice of the meeting at which
the proxy is intended to be exercised;
(b) the invitation, or form of instrument supplied by the Company for the purpose of appointing a proxy, must:
(i) bear a reasonably prominent summary of the rights established by this section;
(ii) contain adequate blank space, immediately preceding the name or names of any person or persons named in it, to enable a shareholder to write in the name and, if so desired, an alternative name of a proxy chosen by the shareholder; and
(iii) provide adequate space for the shareholder to indicate whether the appointed proxy is to vote in favour of or against any resolution or resolutions to be put at the meeting, or is to abstain from voting;
(c) the Company must not require that the proxy appointment be made irrevocable; and
(d) the proxy appointment remains valid only until the end of the meeting at which it was intended to be used, subject to subsection (5).
9. Subsection (8)(b) and (d) does not apply if the company merely supplies a generally available standard form of proxy appointment on request by a shareholder.
By order of the Board
Bianca PietersCompany Secretary
Cape Town28 June 2018
NOTICE OF ANNUAL GENERAL MEETING [CONTINUED]
108

FOR USE AT THE ANNUAL GENERAL MEETING (AGM) OF THE COMPANY TO BE HELD AT 10:00 ON FRIDAY, 2 AUGUST 2019, AT PBT HOUSE, 2 MEWS CLOSE, WATERFORD MEWS, CENTURY CITY, 7441, AND AT ANY ADJOURNMENT THEREOF
THIS FORM OF PROXY IS ONLY FOR USE BY:• shareholders who hold their shares in certificated form; and• shareholders who hold dematerialised shares with “own name” registration.
Other shareholders must give their voting instructions to their CSDP or broker (see note 8).
Each shareholder entitled to attend and vote at the AGM is entitled to appoint a proxy (who need not be a shareholder of the Company) to attend, participate in and speak and vote in place of that shareholder at the AGM, and at any adjournment thereafter.
Please note the following:• the appointment of your proxy may be suspended at any time to the extent that you choose to act directly and in
person in the exercise of your rights as a shareholder at the AGM;• the appointment of the proxy is revocable; and• you may revoke the proxy appointment by (i) cancelling it in writing, or making a later inconsistent appointment of a
proxy; and (ii) delivering a copy of the revocation instrument to the proxy, and to the Company.
Please note that any shareholder of the Company that is a company may authorise any person to act as its representative at the AGM.
Please also note that section 63(1) of the Act requires that persons wishing to participate in the AGM (including the aforementioned representative) provide satisfactory identification before they may so participate.
I/We (full name in block letters) __________________________________________________________________________
of (please print address) ________________________________________________________________________________
being the registered holder/s of ________________________________________________ ordinary shares hereby appoint
1. _______________________________________________________________________________________ whom failing
2. _______________________________________________________________________________________ whom failing
3. the Chairman of the AGM, as my/our proxy to act for me/us and on my/our behalf at the AGM of the Company to be held on Friday, 2 August 2019 and at any adjournment thereof as follows:
Number of sharesFor Against Abstain
Ordinary Resolution Number 1 Reappointment of the independent auditor and designated auditor of the Company
Ordinary Resolution Number 2.1 Reappointment of Herman Steyn as Non-Executive DirectorOrdinary Resolution Number 2.2 Reappointment of Arthur Winkler as Non-Executive DirectorOrdinary Resolution Number 3.1 Reappointment of Arthur Winkler as Audit and Risk
Committee memberOrdinary Resolution Number 3.2 Reappointment of Cheree Dyers as Audit and Risk
Committee memberOrdinary Resolution Number 3.3 Reappointment of Tony Taylor as Audit and Risk
Committee memberOrdinary Resolution Number 4 General authority to issue securities for cashOrdinary Resolution Number 5 Directors’ or Group Company Secretary’s authority to
implement resolutionsOrdinary Resolution Number 6.1 Endorsement of Remuneration PolicyOrdinary Resolution Number 6.2 Implementation of Remuneration PolicyOrdinary Resolution Number 7 General paymentsSpecial Resolution Number 1 Financial assistanceSpecial Resolution Number 2 General authority to repurchase sharesSpecial Resolution Number 3 Authority to pay Non-Executive Directors’ fees
Insert an “X” in the relevant spaces above according to how you wish your votes to be cast. If you wish to cast your votes in respect of a lesser number of shares than you own in the Company, insert the number of shares held in respect of which you desire to vote (see note 2).
This proxy shall be valid only until the AGM of the shareholders of the Company to be held on Friday, 2 August 2019 and any adjournment thereof.
Signed at ___________________________________________________ on _____________________________ 20______.
Signature____________________________________________________________________________________________(Authority of signatory to be attached if applicable – see note 5)
Assisted by me (where applicable – see note 10) ___________________________ Telephone number _________________
Please also read the notes overleaf.
PBT GROUP LIMITED(Incorporated in the Republic of South Africa)(Registration number: 1936/008278/06)JSE share code: PBG ISIN: ZAE000256319(“PBT Group” or “the Company” or “the Group”)
FORM OF PROXY

1. A shareholder may insert the name of a proxy or the names of two alternative proxies of the shareholder’s choice in the space/s provided with or without deleting “the Chairman of the AGM”. The person whose name appears first on the form of proxy and who is present at the AGM will be entitled to act as proxy to the exclusion of those whose names follow.
2. A shareholder’s instructions to the proxy must be indicated by the insertion of the relevant number of votes exercisable by that shareholder in the appropriate box provided. If there is no clear indication as to the voting instructions to the proxy, the proxy form will be deemed to authorise the proxy to vote or to abstain from voting at the AGM as he/she deems fit in respect of all the shareholder’s votes exercisable thereat.
3. A shareholder or his/her proxy is not obliged to use all the votes exercisable by the shareholder or his/her proxy, but the total of votes cast and in respect of which any abstention is recorded may not exceed the total votes exercisable by the shareholder or his/her proxy.
4. Any deletion, alteration or correction to this form of proxy must be initialled by the signatory/ies, but any such alteration or correction will only be validly made if it is accepted by the Chairman.
5. Documentary evidence establishing the authority of a person signing this form of proxy in the representative capacity must be attached to this form of proxy unless previously recorded by the Company.
6. Forms of proxy may be presented any time prior to or at the AGM and also at the Company’s registered office at PBT House, 2 Mews Close, Waterford Mews,
Century City, Cape Town, or the Company’s transfer secretaries. Should forms of proxy be presented at the Company’s transfer secretaries these must be completed and received by Link Market Services South Africa Proprietary Limited, 19 Ameshoff Street, Braamfontein, 2001 (PO Box 4844, Johannesburg, 2000) by not later than 10:00 on Wednesday, 31 July 2019.
7. The completion and lodging of this form of proxy by certificated members and dematerialised members with “own name” registration will not preclude the shareholder from attending the AGM and speaking and voting in person thereat to the exclusion of any proxy appointed in terms hereof should such shareholder wish to do so.
8. Dematerialised shareholders, other than with “own name” registration, must advise their Central Securities Depository Participant (CSDP) or broker of their voting instructions if they are unable to attend the AGM, but wish to be represented thereat. This should be done by the cut-off time stipulated by their CSDP or broker. If, however, such members wish to attend the AGM in person, then they will need to request their CSDP or broker to provide them with the necessary letter of representation in terms of the custody agreement entered into between the dematerialised shareholder and the CSDP or broker.
9. A form of proxy shall be deemed to include the right to demand or join in demanding a poll.
10. A minor must be assisted by his/her parent or guardian unless the relevant documents establishing his/her legal capacity are produced or have been registered by the Company Secretary.
NOTES TO THE PROXY
Registered office Postal address Transfer secretaries
2 Mews Close PO Box 276 Link Market Services South Africa Proprietary Limited
Waterford Mews Century City 17 Ameshoff Street, Braamfontein, 2001
Century City 7446 PO Box 4844
7441 Tel: 021 551 0937 Johannesburg, 2000
110

AQC Acquiring Consortium
AGM Annual General Meeting
B-BBEE Broad-Based Black Economic Empowerment
BEE Black Economic Empowerment
BOARD the Board of Directors of the Company
CEO Chief Executive Officer
CGU cash-generating unit
COMPANIES ACT South African Companies Act, Act 71 of 2008 (as amended)
CSDP Central Securities Depository Participant
CSI corporate social investment
ECL expected credit losses
FSP Forfeitable Share Plan
IAS International Accounting Standards
ICT information and communication technology
IFRS International Financial Reporting Standards
IFRIC International Financial Reporting Interpretations Committee
IOT Internet of Things
JSE the stock exchange operated by JSE Limited
KING IV King IV Report on Corporate Governance for South Africa, 2016
LISTINGS REQUIREMENTS the Listings Requirements of the JSE
MEA Middle East and Africa
MOI Memorandum of Incorporation
OCI other comprehensive income
PBT GROUP PBT Group Limited
PBTit PBT Insurance Technologies Proprietary Limited
PRESCIENT CAPITAL Prescient Capital Proprietary Limited and its subsidiaries
PRESCIENT HOLDINGS Prescient Holdings Proprietary Limited
SAICA South African Institute of Chartered Accountants
SENS Stock Exchange News Service
SIC Standing Interpretations Committee
TBIS Technique Business Intelligence Software Proprietary Limited
WHT withholding tax
GLO
SS
AR
Y PB
T G
RO
UP
• IN
TE
GR
AT
ED
RE
PO
RT
20
19
111

Country of incorporation South Africa
Nature of business and principal activities
Information management and data analytics services
Directors Tony Taylor (Independent Non-Executive Chairman)Pierre de Wet (Chief Executive Officer)Murray Louw (Financial Director)Cheree Dyers (Independent Non-Executive Director)Herman Steyn (Non-Executive Director)Arthur Winkler (Independent Non-Executive Director)
Audit and Risk Committee
Arthur Winkler (Chairman)Cheree DyersTony Taylor
Remuneration and Nomination Committee
Cheree Dyers (Chairman)Herman SteynTony TaylorArthur Winkler
Social and Ethics Committee
Elizna Read (Chairman)Cheree DyersTony Taylor
Company Secretary Bianca PietersPBT House, 2 Mews Close, Waterford Mews, Century City, 7441, South Africa
Registered office PBT House, 2 Mews Close, Waterford Mews, Century City, 7441, South Africa
Postal address PO Box 276, Century City, 7446, South Africa
Registration number 1936/008278/06
Auditors BDO Cape Incorporated
Sponsor Sasfin Capital (a Member of the Sasfin Group)
Transfer Secretaries Link Market Services South Africa Proprietary LimitedPO Box 4844, Johannesburg, 2000, South Africa19 Ameshoff Street, Braamfontein, 2001, South Africa
JSE share code PBG
ISIN ZAE000256319
Website www.pbtgroup.co.za
GE
NE
RA
L
INF
OR
MA
TIO
N112


www.pbtgroup.co.za