Integrated Performance Report August 2016 - … · Integrated Performance Report August 2016 ......
55
1 Integrated Performance Report August 2016 Executive Summary We continue to experience high levels of activity which are challenging the achievement of the 4 hour A&E target across our patch. As previously reported, we are working hard with our colleagues in Acute hospitals to manage this pressure and achieve improvement. It is great credit to our front line colleagues in providers that this consistent pressure is not resulting in any 12 hour trolley breaches, but nonetheless, all within our system remain committed to achieving the 4 hour target. We continue to achieve encouraging results in containing such activity amongst the older members of our population, but are seeing increased numbers from working age adults and younger people. With regard the achievement of the RTT target, while slightly below the national constitution target, we are ahead of the planned position and firmly on track to deliver the planned recovery of performance in this area. We are also ahead of trajectory on recovery plans for dementia diagnosis and IAPT. Naturally we are closely engaged with colleagues from the RUH regarding their recent CQC report, which notwithstanding the headline assessment, contains a great deal of very good results, not least an assessment of Outstanding for care delivered overall. Elsewhere on the quality agenda, rates of CDiff and MRSA are encouragingly below where we anticipated we would be. Work has continued on the development of the system wide Sustainability and Transformation Plan along with partners from across the system, with Wiltshire taking a lead role in the sphere of Planned Care. The very early direction and areas of focus outlined in our plans have been warmly endorsed by NHSE, as we seek ways of improving outcomes for our population while ensuring both financial sustainability and a resilient, properly resourced workforce. In terms of in year finance, the CCG is reviewing several areas of expenditure in an endeavour to mitigate the risk posed by a central change to the cost to the CCG of Funded Nursing Care, which presents a cost pressure of £3M with no recourse to central mitigation. There has been local political and media interest in changes we have made to the opening hours of the Salisbury Walk in Centre from 1 August 2016. Our GP clinical leaders consider that the changes will offer an improved, better targeted service, thereby making best use of the workforce resources we deploy there. We continue to monitor activity which so far is demonstrating support to A&E during the periods of most need. David Noyes, Director of Planning, Performance & Corporate Services
Transcript of Integrated Performance Report August 2016 - … · Integrated Performance Report August 2016 ......
1
Integrated Performance Report August 2016
Executive Summary
We continue to experience high levels of activity which are challenging the achievement of the 4 hour A&E target across our patch. As previously reported, we are working hard with our colleagues in Acute hospitals to manage this pressure and achieve improvement. It is great credit to our front line colleagues in providers that this consistent pressure is not resulting in any 12 hour trolley breaches, but nonetheless, all within our system remain committed to achieving the 4 hour target. We continue to achieve encouraging results in containing such activity amongst the older members of our population, but are seeing increased numbers from working age adults and younger people. With regard the achievement of the RTT target, while slightly below the national constitution target, we are ahead of the planned position and firmly on track to deliver the planned recovery of performance in this area. We are also ahead of trajectory on recovery plans for dementia diagnosis and IAPT. Naturally we are closely engaged with colleagues from the RUH regarding their recent CQC report, which notwithstanding the headline assessment, contains a great deal of very good results, not least an assessment of Outstanding for care delivered overall. Elsewhere on the quality agenda, rates of CDiff and MRSA are encouragingly below where we anticipated we would be. Work has continued on the development of the system wide Sustainability and Transformation Plan along with partners from across the system, with Wiltshire taking a lead role in the sphere of Planned Care. The very early direction and areas of focus outlined in our plans have been warmly endorsed by NHSE, as we seek ways of improving outcomes for our population while ensuring both financial sustainability and a resilient, properly resourced workforce. In terms of in year finance, the CCG is reviewing several areas of expenditure in an endeavour to mitigate the risk posed by a central change to the cost to the CCG of Funded Nursing Care, which presents a cost pressure of £3M with no recourse to central mitigation. There has been local political and media interest in changes we have made to the opening hours of the Salisbury Walk in Centre from 1 August 2016. Our GP clinical leaders consider that the changes will offer an improved, better targeted service, thereby making best use of the workforce resources we deploy there. We continue to monitor activity which so far is demonstrating support to A&E during the periods of most need. David Noyes, Director of Planning, Performance & Corporate Services
2
Integrated Performance Report Contents
Section
Page
1 Quality Report:
Quality Dashboard 3
Primary Care CQC Inspections 7
Quality Dashboard Glossary 12
2 Finance & Information:
Finance Dashboard 13
Finance Summary 14
Annexes 1 - 7 18
Annex 8: IPR Group Dashboard 26
3 Projects:
Project Dashboard 27
Project Management 29
3
Section 1: Quality Report
Summary of key issues / highlights: Quality Dashboard Provider Quality Dashboard - Patient Safety Provider Quality Dashboard - Patient Experience Provider Quality Dashboard - Clinical Effectiveness Care Quality Commission (CQC) – Primary Care Inspections Commissioning for Quality and Innovation Care Quality Commission Report Published - RUH Quality Dashboard Glossary
Summary of Key Issues: Quality Dashboard (June 2016 data)
Areas of Good Performance Areas of Challenging Performance Additional Information
Safety
Only one case of MRSA has been reported by an acute provider in June. C.Difficile cases remain below threshold year to date, except for the RUH.
Call audits for both the 111 and ambulance services remain below required thresholds. Improvement plans have been agreed. Midwife to birth ratios remain above locally agreed targets for all providers
The CCG is commencing a project to improve Stroke performance. This will include collaboration with all providers, neighbouring commissioners. And the Academic Health Science Network The RUH CQC report has been published, other remain unpublished. The CCG will work with the providers to address identified learning. The CCG is progressing with its’ plan to engage with partner organisations and Care Home providers to embed a quality improvement approach which will lead to improved patient safety within this sector. The RUH CQC report of the March inspection has been published. Please see further information in this report below.
Experience
Experience indicators are maintained above national average levels with the exception of maternity indicators. GP IPSO MORI survey shows a high level of patient satisfaction for April – June 16.
Some staff experience indicators are significantly below thresholds. Mixed Sex Accommodation Breaches are still reported by SFT.
Effectiveness
Despite 4-hour wait pressures in the emergency departments, there have been no patients waiting on trolley for longer than 12 hours post decision to admit.
SFT continue to record higher than expected mortality ratios. Please see the dashboard for further detail Vacancy levels within some providers continue to flag at significantly high rates, though 111 vacancy rate has reduced.
4
Indicator Measure
Data
Fre
quency
Targ
et
/ T
hre
shold
/
Benchm
ark
Month
of
Data
SF
T
RU
H
GW
H
AW
P
Wilt
shire H
ealth a
nd
Care
Virgin
SW
AS
FT
Medviv
o
111 (
Care
UK
)
Prim
ary
Care
and
Com
munity
Comments / Trends Analysis
Patient Safety
Healthcare acquired
infection (HCAI) measure - MRSA
Number of infections = 0
M 0 June 0 0 1 Not Av. Not Av. Not Av. 0 Not Av. 0 1
Community: Three MRSA cases in 4 months linked to one care home. CCG
is w orking w ith Local Authority, Public Health, Acute provider and
neighbouring commissioners to support the care home to address this.
Provider is on ‘enhanced surveillance’ at Quality Surveillance Group and has
been raised at the regional group. A Post Infection Peer Review Visit has
been carried out w ith Public Health. The provider has developed an action
plan to address the f indings from the visit.
Healthcare acquired infection (HCAI)
measure - C.difficile (Post 72 hours)
Number of infections (see
threshold for Provider)
M
Individual
Provider
Targets
June 1 8 1 Not Av. 5
Out of Area Cases:
Community C.Diff: There are 5 cases of community C.Diff - 2 via RUH and
2 via SFT. and 1 out of area case.
TOTAL cases: CCG is running at a total of 14 cases. Current year end
projection on the same rates w ould be 84 cases against a threshold of 103
cases in total.
Healthcare acquired
infection (HCAI) measure - MSSA
No target setM - June 4 1 2 Not Av.
Total: There w ere 8 cases in total, including one from out of area.
Bed Days closed due to infection
outbreak (e.g Noro Virus)
No target set
TBCTo be
determinedJune 0 Not Av. Not Av. Not Av. Not Av.
This data w ill be reported follow ing agreement regarding reporting
parameters and process w ith providers.
Number of Never Events Number of events = 0 M 0 July - - - - - Not Av. Not Av. The Never Event logged to WCCG is for BPAS Portsmouth Theatre -
Surgical/invasive procedure (incorrect contraception)
Number of Serious Incidents reported
for Wiltshire patients.
Number of reported serious
incidentsM n/a July 2 2 - 1 Not Av. Not Av. 2 Not Av. Not Av. Not Av.
The SWASFT June SI is being investigated to check the delay in attendance
is not attributable to the 'Ambulance Response Programme' currently being
piloted by NHSE and Sheffield University. The SIs logged for the CCG are
June (Hillcrest Care Home and Ramsay New hall) and for July (BPAS - Never
Event)
Number of Still Births Ratio per 1000 birthsM n/a June 0.0% Not Av. Not Av.
This is reported as a ratio per 1000 births. The CCG has implmented a CQUIN
scheme to assist providers in rolling out the national Still Birth Care bundle in
2017.
NHS Patient Safety Thermometer -
No HarmsNo Harm (composite measure) - % M 94% June 87.3% 94.3% 92.8% 97.7% Not Av.
The decrease in harm free care at SFT (May 96%) w ill be raised w ith the
Trust, particularly harm from new UTI & Catheters, to identify if this is a
consistent trend.
NHS Patient Safety Thermometer -
Pressure UlcersNew Pressure ulcers -% (no) M 4.30% June 2.6% 3.1% 2.1% 0.0% Not Av.
On target
NHS Patient Safety Thermometer -
Falls
Falls -% (no)M 0.60% June 1.6% 0.6% 0.5% 1.5% Not Av.
On target
NHS Patient Safety Thermometer -
Urinary Tract Infection (UTI) &
Catheter
New UTI & Catheter -% (no)
M 0.70% June 3.4% 0.6% 0.6% Not Av. Not Av.
The CCG w ill request assurance from SFT regarding this indicator during the
next contract meeting.
NHS Patient Safety Thermometer -
Venous Thromboembolism (VTE)
VTE -% (no)M 0.40% June 0.3% 0.6% 0.7% Not Av. Not Av.
The CCG is monitoring this indicator.
World Health Organisation Surgical
Safety Checklist; completed for
100% of procedures
% of surgical procedures that
include safety checklist
completed.
M 100% June Not Av. Not Av. Not Av.
Data for SFT and GWH is reported on a quarterly basis.
Compliance with Call Audits (Health
Professionals)
Proportion of required number of
audits carried out for calls
managed by registerd health
professional (eg. Nurse etc..)M 100% May 54.3% 78.7%
SWASFT - f igures for call audits are still not split to show clinical versus
non clinical results. These f igures are for full A&E audits in May. SWASFT
are developing a Call Audit Framew ork to focus on compliance, licensing
implications and escalation. Care UK 111 Both clinical and non clinical staff
w ho have w orked less than 3 months 100% compliance w ith call audits.
Compliance with Call Audits (non
clinical)
Proportion of required number of
audits carried out for calls
managed by non-clinical staff.
M 100% May 54.3% 86.3%
Care UK 111 - Care UK have been focusing on auditing members of staff
w ho have been in post fot less than 3 months. An action plan has been
agreed to address audit compliace.
Midwife:Birth RatioNumber of births to midwives on
duty (Average)M 1:29 June 1.31 1.33 1.36
The 1:29 ratio is the agreed target w ithin the South West region.
Readmissions within 28 days of
babies to Neonatal Units June Not Av. Not Av. Not Av.
This data w ill be reported w hen submitted by providers
Quality Dashboard; Provider Monitoring

5
Indicator Measure
Data
Fre
quency
Targ
et
/ T
hre
shold
/
Benchm
ark
Month
of
Data
SF
T
RU
H
GW
H
AW
P
Wilt
shire H
ealth a
nd
Care
Virgin
SW
AS
FT
Medviv
o
111 (
Care
UK
)
Prim
ary
Care
and
Com
munity
Comments / Trends Analysis
Quality Dashboard; Provider Monitoring
Patient Experience
Staff Friends and Family Test Score
(Work)
Score => National averageQ 67.00% Q4 15/16 81.0% 67.0% 63.0% 46.0% Not Av. Not Av. 40.0%
Staff Friends and Family Test Score
(Care)
Score => National averageQ 84.00% Q4 15/16 96.0% 83.0% 80.0% 66.0% Not Av. Not Av. 78.0%
Friends and Family Test Score
(Inpatient)
Score => National averageM 95.6% May 98.0% 97.0% 95.0%
On target. June data is published in mid-August
Friends and Family Test Score
(A&E)
Score => National averageM 83.5% May 96.0% 98.0% 91.0%
Average score in the south w est w as 88% June data is published in mid-
August
Friends and Family Test
Score (Maternity)
Score => National averageM 96.0% June Not Av. Not Av. Not Av.
This indicator is discussed in the CCG's Maternity Forum - attended by
providers, public health and the CCG. June data is published in mid-August
Friends and Family Test Score
Outpatients
Score => National averageM 93.0% May 97.0% 97.0% 96.0%
On target. June data is published in mid-August
Friends and Family Test Score
(Ambulance)
Score => National averageM 94.0% May 94.5%
SWASFT results - sample too small w ith only 18 responses. June data is
published in mid-August
Friends and Family Test Score
(Mental Health)
Score => National averageM 88.0% May 90.0%
On target. June data is published in mid-August
Friends and Family Test Score
(Community)
Score => National average
M 97.8% June Not Av. Not Av. Not Av.
WH&C: This provider did not submit data for May 2016. - the contract
started in July 2016.
Virgin: This provider's contract commenced in April 2016. The data is
currently unreported.
111: This indicator is dicsussed and monitored at the contract review
meetings.
June data is published in mid-August
Friends and Family Test Score
(Primary Care))
Score => National AverageM 89.0% April 89.0%
This score is 2% low er than the previous month. This w ill be discussed in
the Primary Care Quality Sub Group. June data is published in mid-August
Ipsos Mori GP Surgey - Overall
Experience
Score = rating by patients in
regard to their 'overall experience'
of the GP practice.
Q 85.0% Q1 16/17 90.0%
This survey is a quarterly data collection, commissioned by NHS England.
On target
Mixed sex accommodation (MSA)
Breaches
Number of breaches = 0
M 0 June 12 - - - -
England Average: Breach rate (per '000 f inished consultant episodes)
average is 0.3 for England, CCG breach rate is 2.8.
6 non-clinical breaches occurred at SFT affecting 50 patients. Of the 50
patients, 29 w ere Wiltshire patients. All of the breaches occurred on
Whiteparish (AMU) at a time of capacity issues at the Trust.
Number of Complaints Received (to
the CCG)
Total number of complaints
receivedM N/A June - - - - - - 1 1 2 -
During June the CCG received 4 complaints that related to Urgent and Out of
Hours services. All complaints are under investigation.
Complaints made to the provider (All
patients)
Number of complaints received
M n/aSee
Comments84 21 107 360
Not yet
available
Not yet
available236 3
GWH- April data
RUH - May data
SFT - Q4 data
AWP - Trust-w ide (across 6 CCG areas) Annual (2015/16)
111 June figure -BANES and Wiltshire combined f igure
SWASFT - data for May trust-w ide (13 commissioners), Highlighted at
contracts meeting only 33.3% of complaints closed w ithin 35 days,
mitigation from SWASFT unprecedented numbers but zero complaints re
opened.
WH&C and Virgin; Both these providers w ill collect this information during
the next data capture period. Their scores w ill then be reported. Q1 data
for 16/17 has not yet been published.
6
Indicator Measure
Data
Fre
quency
Targ
et
/ T
hre
shold
/
Benchm
ark
Month
of
Data
SF
T
RU
H
GW
H
AW
P
Wilt
shire H
ealth a
nd
Care
Virgin
SW
AS
FT
Medviv
o
111 (
Care
UK
)
Prim
ary
Care
and
Com
munity
Comments / Trends Analysis
Effectiveness
Mortality Ratio (HSMR) As Expected M 100April 15 -
March 16 110 103 93
Not yet
available
SFT - have received a CQC mortality alert for COPD and Bronchiectasis.
Analysis has show n no evidence of avoidability,but did highlight learning
points. 3 new diagnosis groups for CUSUM alerts received by SFT. A
w iltshire GP now sits on SFT mortality review groups. SFT are considering
amendments to the process of mortality review s.
Mortality Ratio (SHMI) As Expected Q 100April 15 -
March 16 109 97 93
Not yet
available
GWH - rolling period Oct14 - Sept 15
12 Hr Trolley Breaches in the ED M 0 June - - -
As a result of the joint w orking w ith the CCG follow ing the breaches in
March and April, GWH developed an action plan to precent futher breaches.
This plan is monitored via the contract review process.
VTE Assessment - Percentage who
have had an assessment on
admission
Achieved for at least 95% patients
Q 95% Q4 15/16 Not Av. Not Av. Not Av. 99.0%
VTE Assessment - Percentage at
risk of VTE receiving chemical/
physical thromboprophylaxis
Achieved for 100% patients
M 100% June Not Av. Not Av. Not Av. Not Av.
Fractured Neck of Femur % in theatre within 36 hours M 80% June 90.0% 82.5% Not Av. The CCG w ill monitor compliance w ith this indicator thought Best Practice
Tariff audits.
Staff Turnover Staff turnover rate - % M
Individual
Provider
Targets
June 9.7% 12.5% Not Av. Not Av. Not Av. Not Av. Not Av. see notes
These targets are rated by the providers - there is no set
threshold for this indicator.
Care UK 111 - no percentage, provider w orks in WTE June turnover f igure
is 4WTE, of w hich 3 x non clinical and 1 x clinical.
Sickness Absence
Sickness absence rate against
provider target - % M
Individual
Provider
Targets
June 3.2% 3.8% Not Av. Not Av. Not Av. Not Av. Not Av. 563.0%
Care UK - this is on an increasing trajectory from a 4.03 low in Nov 15.
Care UK have a sickness management plan in place and have revised their
policy and processes regarding sickness and absence management.
Vacancies Vacancy rates -% M
Individual
Provider
Targets
June 6.0% 6.1% Not Av. Not Av. 9.4% Not Av. Not Av. see notes
Care UK111 vacancy rate for June in WTE, clinical vacancy 13.13WTE,
non clinical 18.11WTE
Agency staffing Agency staff - % M
Individual
Provider
Targets
June 2.6% 1.8% Not Av. Not Av. Not Av. Not Av. Not Av. 11.8%
These targets are internally set by providers. The CCG monitors this
information and addressed via the contract meetings.
Appraisal Rate Staff with an annual appraisal - % M 75% June 77.0% 84.8% Not Av. Not Av. 81.4% Not Av. Not Av. Not Av.
These targets are internally set by providers. The CCG monitors this
information and addressed via the contract meetings. SWASFT May f igures
are for clinical staff, non clinical f igure/no patient contact very low at
19.74%. Plan is to focus on managers to make notif ication of appraisal
completion easier.
Mandatory Training ComplianceCompliance with all mandatory
training - %M 85% June 83.0% 86.8% Not Av. Not Av. 86.8% Not Av. Not Av. Not Av.
GWH - no overall %,
111 - average f igure across clinical and non-clinical.SWASFT f igure is for
both clinical and non clinical staff
Stroke Sentinel National Audit
Programme ScoreSSNAP Summary Level Score Q B Q4 15/16
C C ENot Av.
This indicator is the score aw arded based on the provider's performance in
the Stroke Sentinel National Audit. https://w w w .strokeaudit.org/
% of Mothers Breastfeeding at
Discharge
Mothers recorded as Breast
Feeding at discharge - %M >83% May 61.1% 82.1% 78.8%
This measure w as a Quality Improvement target during 15/16. The indicator
supports babies and mothers to develop good feeding practice and
prevents admissions for reasons of 'failure to thrive'. There is a lag in this
data being reported ow ing to the nature of reporting.
CQC Status
Rating awarded by CQC at 'overall'
level.
Ad Hoc Good June
Req
Improv.
2016
Req.
Improv
2016
Req
Improv.
2016
Report
PendingNew Reg New Reg
Report
Pending2013
Not Yet
Insp.
The CQC have carried out recent inspections w ith many Wiltshire providers.
The tw o community providers are new registrations and have not yet been
inspected. 111 has also not received an inspection. The RUH CQC report
w as published on 10th August. The Trust w ere rated as 'Requires'
Improvement but 'Outstanding' in the Caring domain. There w ere no w arning
notices issued. AWP has received a w arning notice for S.136 suites
(pleasec of safety) accross the Trust. The CCG has visited the areas
covered by the notice. SWASFT had CQC visit 6th-10th June, the draft
report is still pending.
This information w ill be available w hen published for Quarter 1 16/17 by
NHS England.
Quality Dashboard; Provider Monitoring

7
Primary Care CQC Inspections
The following Wiltshire Primary Care Practices have received CQC inspections since the CQC introduced their new inspection regime (2015 onwards):-
There are 40 practices remaining to be inspected under the new CQC inspection regime. Of these, 12 are compliant under the
previous system, and 24 have never received an inspection. The CQC is aiming to complete inspection of all practices in England
by the end of 2017.
Practice Name Overall Rating Safe Effective Responsive Well Led Caring
Sixpenny Handley & Broad Chalke GoodRequires
ImprovementGood Good Good Good
Whiteparish SurgeryRequires
Improvement
Requires
Improvement
Requires
Improvement
Requires
Improvement
Requires
ImprovementGood
Lovemead Group Practice Outstanding Good Outstanding Outstanding Outstanding Good
J83013 Box Surgery GoodRequires
ImprovementGood Good Good Good
Pewsey SurgeryRequires
Improvement
Requires
ImprovementGood
Requires
ImprovementGood Good
Avenue Surgery Good Good Good Good Good Good
Tinkers Lane Surgery Good Good Good Good Good Good
Lansdowne Surgery Good Good Good Good Good Good
Malmesbury Medical Partnership Outstanding Good Outstanding Outstanding Outstanding Good
Widbrook Medical Practice Inadequate InadequateRequires
ImprovementInadequate Inadequate Good
Ramsbury Surgery Outstanding Good Good Outstanding Outstanding Good
Southbroom Surgery Good Good Good Good Good Good
St James Surgery GoodRequires
ImprovementGood Good Good Good
Market Lavington Surgery Good Good Good Good Good Good
Beversbrook Medical Centre Requires
ImprovementGood
Requires
ImprovementGood
Requires
ImprovementGood
8
Commissioning for Quality and Innovation (CQUIN)
The Commissioning for Quality and Innovation (CQUIN) framework supports improvements in the quality of services and the
creation of new, improved patterns of care. CQUIN funding enables commissioners to reward excellence by linking a
proportion of providers’ contract income to the achievement of local quality improvement goals’ and, in particular, around the
following quality domains; Effectiveness, Safety, Innovation, Experience. Up to 1.25% of contract value was made available
for the national schemes, with the remaining 1.25% allocated to local schemes where applicable. Local schemes were
agreed with providers based on priorities agreed with the CCG.
The majority of providers performed well across the national and local schemes in 2015/16 demonstrating value of
improvement to patients. A detailed breakdown of CQUIN achievement was presented to the Quality and Clinical
Governance Committee in July.
The tables below set out the achievement of each provider against the CQUIN schemes in 15/16 and detail the schemes
which have been agreed for 16/17. The CCG has worked with providers to agree schemes which are aligned to CCG
priorities and strategy, and which provide incentives across the system in key areas – an example of this being the Frailty
CQUIN. Both Acute and Community providers have been incentivised to develop and embed improvements in this area,
which will lead to the introduction of standardised tools across providers for the assessment and care planning for frail
patients.

9
CQUIN Schemes 15/16
Acu
te s
erv
ices
Co
mm
un
ity
serv
ices
NH
S 1
11 (
Care
UK
)
Men
tal H
ealt
h
Ind
ep
en
den
t
Pro
vid
ers
Ho
sp
ice
Pro
vid
ers
Serv
ices f
or
Ch
ild
ren
Am
bu
lan
ce
Serv
ices
Pati
en
t
Tra
nsp
ort
Acute Kidney Injury (AKI)
Sepsis
Dementia and delirium
Improving Physical Healthcare for Patients with Severe Mental Illness (SMI)
Urgent Emergency Carei) A reduction in the proportion of NHS 111 calls that end in an inappropriate 999 referral
ii) Capture of disposition (and referral) to type 1 and 2 A&E separately from type 3 and 4, thereby improving the quality of the Directory of Services
iii) Proportion of NHS 111 calls that end in an inappropriate type 1 or type 2 A&E referral.
Urgent Emergency CareA reduction in the rate per 100,000 population of ambulance 999 calls that result to a type 1 of type 2 A&E Dept
Urgent Emergency CareReducing the proportion of avoidable emergency admissions to hospital.
Urgent Emergency Carei) Improving recording of diagnosis in A&E ii) Reduction in A&E MH re-attendances.
Falls Prevention and Management
End of Life Care (SFT only)
Patient Experience of Discharge (RUH only)
Reducing Pressure Ulcers
Early Supported Discharge
GP Toolkit to support primary care
Learning from Incidents
Implementation of Early Warning Scores
Improving Transition to Adult Services
Hearing the Voice of the Child (patient experience)
Reducing Strillbirths (RUH only)
Increasing Breastfeeding Rates (RUH contract)
Paediatric Big 6 - recognising and treating common illness in children
Clinical Handovers - from the ambulance services
Enhanced Skills - of paramedics (i.e. wound treatment), to avoid attendance at ED
Frequent Callers - Frequent users of the ambulance service to have a system-wide plan.
Increasing efficiency and releasing time to care for the Community Palliative Care Team Year 2 of a 2 year CQUIN
Specialist Palliative Care Clinical Nurse Specialist (CNS) 7 day working in the Hospital and Community
Improving Patient Experience
Improving Patient Collection Times
Thresholds changed in year at national level
CQUIN thresholds not met
CQUIN thresholds partially met
All milestones evidenced as met

10

11
Care Quality Commission (CQC) Report Published – Royal United Hospital
The Care Quality Commission (CQC) has published its’ report of the inspection carried out at RUH in March 2016. The Trust was rated overall as ‘Requires Improvement’. The CQC has not issued any improvement or warning notices in respect of its’ findings. The overall care at the delivered by the Trust was rated as ‘outstanding’. The CQC assessed nine core services across the Trust against five domains: safe, effective, caring, responsive and well-led. End of life care was rated overall as Outstanding, with surgery, maternity and gynaecology services, services for children and young people and outpatient and diagnostic services each rated overall as Good. Feedback from patients across the Trust was positive. The inspection found that patients and their families are involved as partners in their care and empowered and supported to maximise their independence. The CQC found many areas of good practice across the organisation. Out of the 53 indicators which make up the Trust’s overall rating 36 are rated Good and 3 are rated Outstanding. Whether services are effective and well-led were also rated as Good overall. The CCG participated in a Quality Summit with the Trust, Co-Commissioners, NHS Improvement and the CQC, to discuss the findings of the report. The Trust has already addressed many of the findings and recommendations and will continue to do so through the action plans that will be put in place. The CCG will work with the Trust to support improvements and will monitor progress against the action plans.
12
D ashboar
dD et ailed M easure
Source o f ind icat o r
def init ion
R ef erence
in C ont ractD et ailed def init ion Source
Quality
M ixed Sex Accommodation (M SA)
Breaches Everyone Counts 2013/14 E.B.S.1 The number of breaches of mixed-sex accommodation (M SA) sleeping accommodation
Published on NHS England website:
ht tps:/ /www.england.nhs.uk/stat ist ics/stat ist ical-work-
areas/mixed-sex-accommodation/msa-data/
Quality Number of Never Events QualityQuality
Schedule
Never Events are serious, largely preventable pat ient safety incidents that should not occur if the available preventat ive measures
have been implemented.
Reported as Serious Incidents on the Strategic Execut ive
Information System (STEIS)
Quality
% of all adult inpat ients who have had a
VTE risk assessment QualityQuality
Schedule
Every pat ient admit ted to hospital for medical reasons should have a documented risk assessment to ident ify those at risk of
Venous Thromboembolism (VTE).
Published on NHS England website:
ht tps:/ /www.england.nhs.uk/stat ist ics/stat ist ical-work-areas/vte/
Quality WHO Surgical Safety Checklist
completed for 100% of proceduresQuality
Quality
Schedule
This is a surgical checklist that the surgery team completes with listed tasks before it proceeds with the operat ion. From provider submissions to Contract Review M eetings
Quality Fracture Neck of Femur - % in theatre
within 36 hoursQuality
Quality
Schedule
The best pract ice for Fractured Neck of Femur is the t ime to surgery within 36 hours from arrival in an emergency department, or
t ime of diagnosis if an inpat ient, to the start of anaesthesia.
From provider submissions to Contract Review M eetings
QualityHealthcare acquired infect ion (HCAI)
measure (M RSA)Everyone Counts 2013/14 E.A.S.4 Number of cases of M ethicillin-resistant Staphylococcus aureus (M RSA) bacteraemia
Health Protect ion Agency Healthcare Aquired Infect ions website
https:/ /nww.hpanw.nhs.uk
QualityHealthcare acquired infect ion (HCAI)
measure (c. dif f icile)Everyone Counts 2013/14 E.A.S.5 Number of Clostridium dif f icile infect ions, for pat ients aged 2 or more on the date the specimen was taken
Health Protect ion Agency Healthcare Aquired Infect ions website
https:/ /nww.hpanw.nhs.uk
Quality Friends and family test score Everyone Counts Schedule 6e
The proport ion of people who reported that they were either 'extermely likely' or 'likely' to recommend the service to their f riends
and family, out of the total number of people who responded to the survey. Score is displayed as a percentage.
NHS England website.
ht tp:/ /www.england.nhs.uk/stat ist ics/stat ist ical- work-
areas/friends-and-family-test/ f riends-and- family-test-data/
Quality Pat ient Safety ThermometerNHS Contract (Nat ional
Quality Requirements)
Quality
ScheduleThe number of instances of each type of harm reported in a month. This is a point prevelance audit , captured on one day per month.
Health & Social Care Information Centre.
ht tp:/ /www.hscic.gov.uk/thermometer
Quality ComplaintsQuality
Quality
Schedule
The combined number of formal complaints raised by pat ients and by M P's on behalf of pat ients in the month From provider submissions to Contract Review M eetings
Quality M ortality rat ios
The Department of Health
(Commissioned from the
HSCIC)
Quality
Schedule
The Summary Hospital-level M ortality Indicator (SHM I) is an indicator which reports on mortality at t rust level across the NHS in
England using a standard and transparent methodology. It is produced and published quarterly as an off icial stat ist ic by the Health
and Social Care Information Centre (HSCIC) with the f irst publicat ion in October 2011.
The SHM I is the rat io between the actual number of pat ients who die following hospitalisat ion at the trust and the number that would
be expected to die on the basis of average England f igures, given the characterist ics of the pat ients treated there.
The Hospital Standardised M ortality Rat io (HSM R) is an indicator of healthcare quality that
measures whether the mortality rate at a hospital is higher or lower than you would expect. Like
all stat ist ical indicators, HSM R is not perfect. If a hospital has a high HSM R, it cannot be said
for certain that this ref lects failings in the care provided by the hospital. However, it can be a
warning sign that things are going wrong. HSM R does not measure deaths post discharge.
For SHM I:From the Healtha nd Social Care Information Centre
Website: ht tp:/ /www.hscic.gov.uk/SHM I
For HSM R:
http:/ /www.nhs.uk/NHSEngland/Hospitalmortalityrates/Document
s/090424%20M S(H)%20-
%20NHS%20Choices%20HSM R%20Publicat ion%20-
%20Presentat ion%20-%20Annex%20C.pdf
Quality M aternity Indicators (St illbiths,
M idwife to bith rat io, Breast Feeding
Rates at Discharge)
Better Births Nat ional
M aternity Review:
https:/ /www.england.nhs.uk/
wp-
content/uploads/2016/02/na
t ional-maternity-review-
report .pdf
Quality
Schedule
Following the Nat ional M aternity Review and the result ing Better Births Report , M aternity quality indicators are measured to
ensure cont inuous improvement and consistency across all providers. The CCG measures these indicators via the contract quality
schedule and through the South West Stretgic Clinical Network M aternity Dashboard
http:/ /www.swscn.org.uk/networks/maternity-children/maternity-
group/
Quality Workforce IndicactorsQuality
Quality
Schedule
The CCG monitors a wide range of workforce indicators within in each provider. These indicators are triangulated with other data
and information to form part of an 'early alert ' t rigger to emerging concerns.
Provider submissions to contract review meetings.
Quality Call Audit Indicators
QualityQuality
Schedule
Providers commissioned to deliver services to pat ients via telephone are required to audit a proport ion of the calls that they receive
or make to pat ients. These calls can be made / received by both clinically t rained and non-clinical staff . One of the ways that the CCG
monitors quality of service to pat ients by these providers is to ensure that calls are audited and learning and improvements are
ident if ied to ensure safety and appropraiteness of call handling.
Provider submissions to contract review meetings, and CCG
attendance at Call Reviews.
Quality CQC Status
QualityQuality
Schedule
The providers are required to register with CQC under their contract with the CQC. The CCG works with partner organisat ions,
including the CQC, to share intelligence about providers and to ident ify and address providers in need of support . The CCG
monitors CQC compliance and ensures act ion plans developed following inspect ion results are comprehensive and completed by
providers.
ht tp:/ /www.cqc.org.uk/
Quality Dashboard Glossary: 2016/17

13
Section 2: Finance and Information
FINANCE AND ACCESS DASHBOARD
Target Responsible Director
Where will performance and assurance be sought
RAG status
Delivery of the 1% Surplus Steve Perkins
Finance committee and group performance review
Underlying recurrent surplus Steve Perkins
Finance committee
Running costs within allocation Steve Perkins
Finance committee
Operating within cash limit Steve Perkins
Finance committee
Better payment performance by value
Steve Perkins
Finance committee
Better payment performance by number
Steve Perkins
Finance committee
Non Elective Activity on Plan Jo Cullen Finance committee and group performance review
Non elective QIPP plan delivery
Jo Cullen Finance committee and group performance review
Planned Activity on Target Mark Harris Finance committee and group performance review
Outpatient targets are being delivered
Mark Harris Finance committee and group performance review
Planned care QIPP plan delivery
Mark Harris Finance committee and group performance review
Other activity targets are being delivered
Multiple Finance committee and group performance review
A&E 4 Hour wait (SFT) Jo Cullen Finance committee, group performance review and system resilience group
A&E 4 Hour wait (GWH) Jo Cullen Finance committee, group performance review and system resilience group
A&E 4 Hour wait (RUH) Jo Cullen Finance committee, group performance review and system resilience group
Cancer waiting times Mark Harris Finance committee, group performance review and system resilience group

14
Summary
In line with NHS England (NHSE) planning requirements the CCG is required to
deliver a 1% surplus against its available resources and to hold a 1% uncommitted
headroom (which may only be released in conjunction with NHSE / Treasury
approval).
£'m
B/f surplus from prior year delivery 5.5
Surplus generated in new financial year 0.4
1% surplus in line with NHSE Business Rules 5.9
At month 4 the CCG has three months activity data from Service Level Agreement
Monitoring (SLAMs) from providers. Based on this the CCG is forecasting delivery of
the planned surplus position but will undertake further work to validate this position.
This validation will involve analysis of the reported position against plans to identify
areas of pressure to enable addressing actions to be identified. This reported
position excludes the impact of Funded Nursing Care (FNC) cost pressures, in line
with NHSE guidance, whilst mitigations are developed (discussed below).
A number of risks to the CCG’s financial position have been identified and are being
managed however the CCG has been impacted by a 40% rise in FNC rates,
backdated to the 1st April 2016. This rate change has a forecast impact of £3m to the
CCG in 2016/17. In response to this the CCG is developing potential opportunities
for mitigation with the intention that these are reviewed by the Finance Committee in
September 2016 with the net impact included within the M05 reported position.
At M04 the CCG is reporting that it is operating within its available resources (both
cash and income and expenditure) and has achieved its better payment performance
requirements on a year to date basis.
Resources
At month 4 the CCG has seen no movement in its resources compared with the prior
month:
£'m
M4 M3 Movement
Programme 574.88 574.88 0.00
Running costs 10.46 10.46 0.00
585.34 585.34 0.00
15
Income and expenditure movements
The waterfall graph below shows the planned and forecasted expenditure (in blue)
and identifies pressures (in red) to this position and mitigations (in green) at a
programme level at month 4:
Key financial performance issues
An upward trend arrow indicates a favourable movement, and a downwards trend arrow represents an adverse
movement
Area Commentary Trend RAG
Acute services Non elective activity pressures identified within M3 SLAM positions and reflected in forecasts.
1.32%
Mental health services Forecast underspend is due to the settlement of prior year disputes.
-0.84%
Community services Children’s community services is forecasting a small overspend at M04
0.05%
Continuing care services Continuing care services (including personal health budgets) are reporting a breakeven position at this stage.
0.00%
Funded nursing care
Funded nursing care budgets are reporting a breakeven position as the impact of FNC rate increases has not been included within forecast at M04.
0.00%
570.0
575.0
580.0
585.0M4 Income & Expenditure Forecast Variances £'m
Favourable Variance Adverse variance Planned spend
16
Area Commentary Trend RAG
Other programme services
No material forecast issues identified at month 4.
-3.31%
Prescribing
No material forecast issues identified at month 4 due to the timing of when information will be received from the prescribing monitoring document (PMD). To date only two month's data has been received but with no forecast information.
0.00%
Out of hours and NHS 111
No material forecast issues identified at month 4.
-0.02%
Local Enhanced Services No material forecast issues identified at month 4.
0.00%
Primary care IT No material forecast issues identified at month 4.
0.00%
Reserves Represents release of contingency to offset identified forecast pressures.
-31.19%
Running costs
A forecast underspend against funding allocation is reported to reflect the YTD achievement against the £500k QIPP target.
-1.85%
Financial risks
Risks identified at month 4 include the forecast impact of the FNC rate increase for
which no mitigations were reported at M04 in line with NHSE approval. Potential
opportunities for mitigation are being reviewed for inclusion within the M05 position.
Area
Potential risk /
£'000s Likelihood
%
Residual risk /
£'000s Comment
Risk issues
Acute services 0 Over-performance factored into reported position
Community services 400 20% 80 Risk on community maternity if birth numbers increased and if post consultation tariff prices change
Mental health services 700 40% 280 Out of area placements risk
Continuing care services 318 50% 159 Prior year disputed debtors
Performance issues 0
Prescribing 0
Other programme services 3,000 100% 3,000 Forecast full year impact of FNC rate increase
Running costs 277 100% 277 Property service market rent impacts
4,695
3,796
Mitigations
Balance of contingency
0 National funding for market
rents
-277 Non recurrent measures /
slippage
-519
-796
Net risk position after mitigations
3,000
17
Key access issues
In June 2016 the CCG had 91.7% of patients waiting less than 18 weeks. This is just
below the National standard however; it was above the level planned for. Diagnostic
waiting times saw under-achievement of the National standard of 99% with the main
pressure seen at Great Western Hospital NHS Foundation Trust with MRI and
Audiology having waiting time breaches.
Two cancer access standards were breached in June, both for 2 week referral waits.
Cancer 2 week waits were achieved at the main local trusts with the pressure seen
with patients waiting at tertiary centres. 2 Week Breast Symptoms were breached at
the Royal United Hospital Bath NHS Foundation Trust due to staffing shortages that
are expected to be resolved in the next few months.
There were 7 Mixed Sex Accommodation breaches at Salisbury Hospital NHS
Foundation Trust due to emergency bed pressures.
The A&E 95% under 4 hour continued to be under-achieved at all 3 main acute
providers due to a rise in attendances and back-door bed pressures.
Ambulance Red 8 minute responses at the scene of incidents continue to under-
achieve and are being discussed at contract meetings.
Dementia Diagnosis – Achieved 64.1% against the 66.7% standard. Performance
improved in June and target actions are being taken with specific practice outliers.
Community Services continue to struggle to achieve timely discharge targets.
Most of the key Activity indicators were within planned levels. However, there have
been unplanned increases in Diagnostic test, Cancer referrals. Unplanned care bed
pressures have had an adverse impact on planned RTT clock stop activity which in-
turn has led to an increase in the CCG’s RTT waiting list.
Appendices
- Annex 1 Summary I&E position M4 2016/17 - Annex 2 Summary Statement of Financial Position M4 2016/17 - Annex 3 Cash Position M4 2016/17 - Annex 4 Better Payment Practice Code Performance M4 2016/17 - Annex 5 Movement between budgets and resources M4 2016/17 - Annex 6 Performance against constitution targets M3 2016/17 - Annex 7 Activity monitoring M3 2016/17 - Annex 8 IPR Group Dashboard

18
Annex 1 – Summary Income and expenditure position M4 2016/17
Year to date £'m
Forecast outturn £'m
M4 forecast vs M3
Budget Actual Variance Budget Variance M3 Movement
Acute services (incl ambulances)
NHS providers 89.8 91.1 1.3 269.3 3.9 3.4 0.5
Other providers 8.3 8.2 -0.1 25.0 0.0 -0.5 0.5
Non contracted activity 2.3 2.3 0.0 6.8 0.0 0.0 0.0
100.4 101.5 1.2 301.1 4.0 2.9 1.0
Mental health services
NHS providers 12.3 11.9 -0.4 36.9 -0.4 -0.2 -0.1
Other providers 1.9 1.8 -0.1 5.7 0.0 0.0 0.0
14.2 13.7 -0.5 42.5 -0.4 -0.2 -0.1
Community services
NHS providers 13.5 13.4 -0.1 20.2 0.0 0.0 0.0
Other providers 6.4 6.5 0.0 39.7 0.0 0.0 0.0
20.0 19.9 -0.1 59.9 0.0 0.0 0.0
Other commissioning
Continuing care services 6.3 6.5 0.2 17.8 0.0 0.0 0.0
Funded nursing care 2.5 2.7 0.3 7.4 0.0 0.0 0.0
Local authority and joint services 8.9 8.9 0.0 26.7 0.0 0.0 0.0
Other programme services 3.2 2.9 -0.4 9.7 0.0 0.0 0.0
20.9 21.0 0.1 61.7 0.0 0.0 0.0
Primary care services
Prescribing 25.3 25.2 -0.1 76.0 0.0 0.0 0.0
Out of hours and NHS 111 2.8 2.8 0.0 8.5 0.0 0.0 0.0
Local enhanced services 2.4 2.3 -0.1 7.1 0.0 0.0 0.0
Primary care IT 0.4 0.4 0.0 1.2 0.0 0.0 0.0
30.9 30.7 -0.2 92.8 0.0 0.0 0.0
Programme reserves
Contingency 1.0 0.0 -1.0 2.9 -2.9 -2.9 0.0
Other earmarked reserves 0.8 1.4 0.7 2.3 -0.5 0.4 -0.9
Other allocations 0.0 0.0 0.0 0.0 0.0 0.0 0.0
Headroom funding 0.0 0.0 0.0 5.7 0.0 0.0 0.0
1.7 1.4 -0.3 11.0 -3.4 -2.5 -0.9
Running costs 3.43 3.21 -0.22 10.5 -0.2 -0.2 0.0
Total expenditure 191.5 191.5 0.0 579.5 0.0 0.0 0.0
Less Funding -193.5 -193.5 0.0 -585.3
Planned surplus -2.0 -2.0 0.0 -5.9 -5.9

19
Annex 2 – Summary Statement of Financial Position M4 2016/17
Summary Statement of Financial Position
£'m
Opening position 1st April 2016
Closing position 30th
July 2016
Forecast position at
31st March 2017
Non-Current Assets:
Premises, Plant, Fixtures & Fittings 0.00 0.00 0.00
IM&T 0.31 0.29 0.25
Other 0.03 0.03 0.03
Long-term Receivables 0.00 0.00 0.00
TOTAL Non-Current Assets 0.34 0.32 0.28
Current Assets:
Inventories 0.00 0.00 0.00
Prepayments 0.17 1.77 0.17
Trade and Other Receivables 2.66 2.37 2.66
Cash and Cash Equivalents 0.33 0.03 0.30
TOTAL Current Assets 3.16 4.18 3.13
TOTAL ASSETS 3.50 4.49 3.41
Non-Current Liabilities:
Long-term payables 0.00 0.00 0.00
Provisions 0.00 0.00 0.00
Borrowings 0.00 0.00 0.00
TOTAL Non-Current Liabilities 0.00 0.00 0.00
Current Liabilities:
Trade and Other Payables 29.62 28.18 27.80
Other Liabilities 0.00 0.00 0.00
Provisions 0.07 0.07 0.07
Borrowings 0.00 0.00 0.00
Total Current Liabilities 29.69 28.25 27.87
TOTAL LIABILITIES 29.69 28.25 27.87
ASSETS LESS LIABILITIES (Total Assets Employed) -26.19 -23.76 -24.47
Financed by taxpayers' equity:
General fund 26.19 23.76 24.47
Revaluation reserve 0.00 0.00 0.00
Other reserves 0.00 0.00 0.00
Total taxpayers' equity: 26.19 23.76 24.47
20
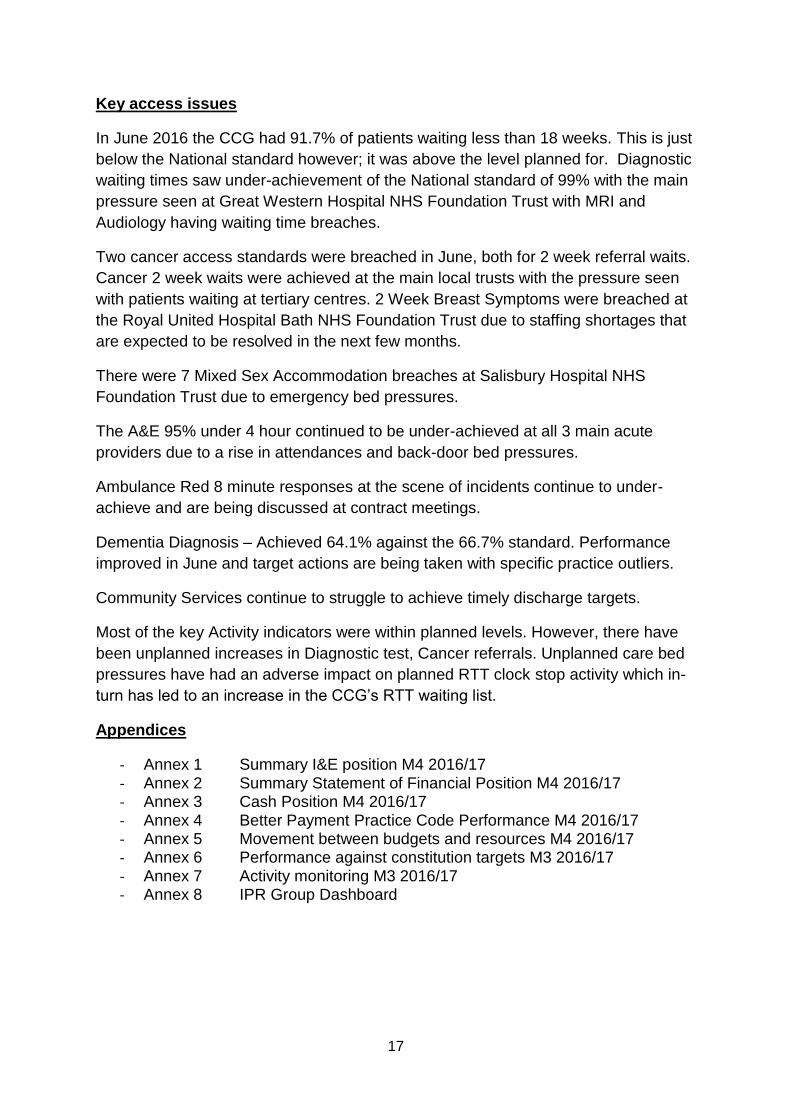
Annex 3 – Cash Position M4 2016/17
£'m
Year to date FOT
Assumed revenue resource limit / £'m 195.11 585.34
Assumed revenue cash limit / £'m 192.72 578.16
Cash drawn down / £'m 173.61 517.82 Cash top sliced for CHC risk pool prescribing and home oxygen / £'m 20.34 60.34
Effective total cash drawn down / £'m 193.96 578.16
Cash drawn down as % of total 33.5% 100.0%
Expected cash draw down as % 33.3% 100.0%
Cash utilised / £'m 194.25 578.19
Balance in account / £'m 0.03 0.30
Balance in account as % of total cash limit 0.01% 0.05%
0
100000
200000
300000
400000
500000
600000
700000
Proportion of Cash Limit Utilised Actual
Cash used YTD Cash Limit
21
Annex 4 – Better Payment Practice Code Performance M4 2016/17
Performance vs 30 days BPP ytd July 2016
In Month YTD
Nos. £'m Nos. £'m
NHS
Total bills paid 317 30.29 1,240 123.55
Total bills paid within time 313 30.23 1,235 123.48
% of bills paid within target 100.0% 100.0% 99.6% 99.9%
Non-NHS
Total bills paid 900 10.24 2,998 34.18
Total bills paid within time 898 10.23 2,983 34.08
% of bills paid within target 99.8% 99.9% 99.5% 99.7%
ALL
Total bills paid 1,217 40.53 4,238 157.73
Total bills paid within time 1,211 40.46 4,218 157.56
% of bills paid within target 99.5% 99.8% 99.5% 99.9%
90.0%
92.0%
94.0%
96.0%
98.0%
100.0%
Performance by value
NHS Non NHS
90.0%
92.0%
94.0%
96.0%
98.0%
100.0%
Performance by volume
NHS Non NHS
22
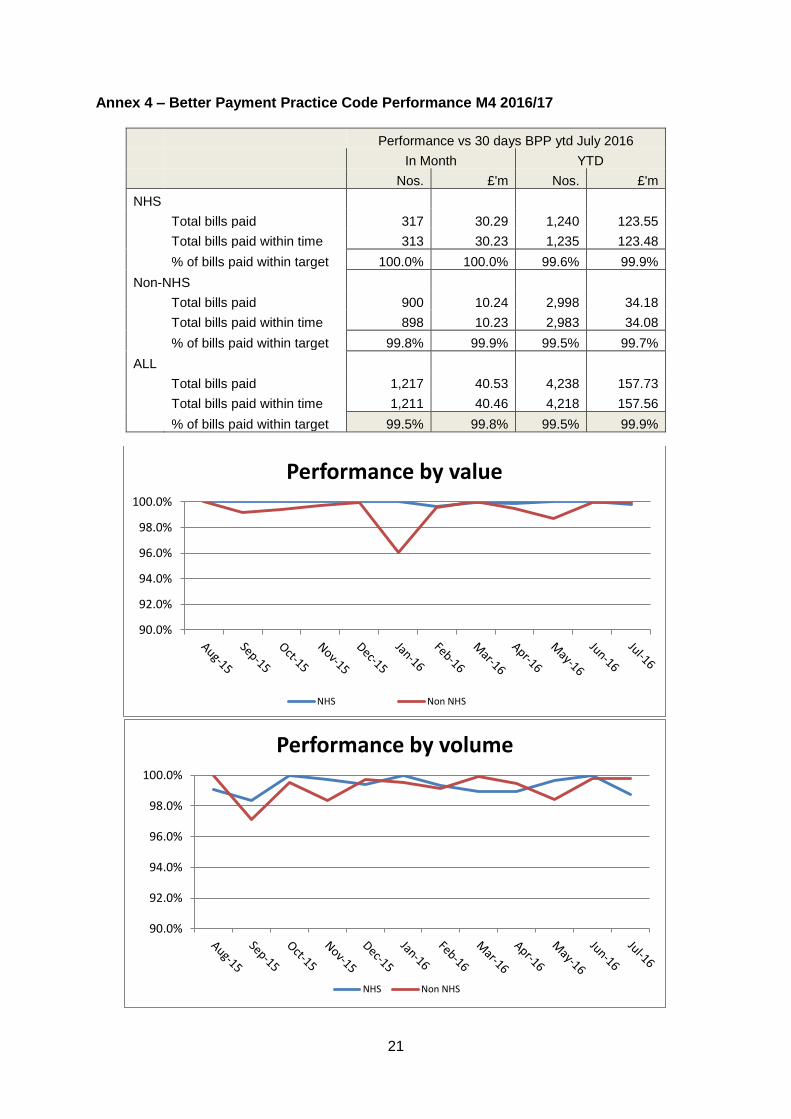
Annex 5 - Movement between budgets and resources M3 vs M4 2016/17
£'m
M3 position M4 position Movement Comment
Acute services (incl ambulances)
NHS providers 269.6 269.3 -0.3 UHB Budget Adjustment
Other providers 25.0 25.0 0.0
Non contracted activity 6.8 6.8 0.0
301.4 301.1 -0.3
Mental health services
NHS providers 36.9 36.9 0.0
Other providers 5.7 5.7 0.0
42.6 42.5 0.0
Community services
NHS providers 50.8 20.2 -30.6 Budget moved from NHS to non NHS to reflect new community services provider Other providers 8.8 39.7 30.9
59.6 59.9 0.3
Other commissioning
Continuing care services 17.8 17.8 0.0
Funded nursing care 7.4 7.4 0.0
Local authority and joint services
26.7 26.7 0.0
Other programme services 9.7 9.7 0.0
61.7 61.7 0.0
Primary care services
Prescribing 76.0 76.0 0.0
Out of hours 8.5 8.5 0.0
Local enhanced services 7.1 7.1 0.0
Primary care IT 1.2 1.2 0.0
92.8 92.8 0.0
Programme reserves
Contingency 2.9 2.9 0.0
Other reserves 2.3 2.3 0.0
Other allocations 0.0 0.0 0.0
Headroom funding 5.7 5.7 0.0
11.0 11.0 0.0
Running costs 10.5 10.5 0.0
Total expenditure 579.5 579.5 0.0
Less Funding -585.3 -585.3 0.0
Planned surplus -5.9 -5.9 0.0

23
Annex 6 – Performance against constitution targets M3 2016/17
NHS WILTSHIRE CCG
Are patient rights under the NHS Constitution being
Indicator
Referral To Treatment waiting times for non-urgent
consultant-led treatmentOrg.
Target Apr-16 May-16 Jun-16 Jul-16 Aug-16 Sep-16 Oct-16 Nov-16 Dec-16 Jan-17 Feb-17 Mar-17 FOT
E.B.3 RTT % Incomplete Pathways within 18 Weeks CCG 92.2% 92% 91.6% 91.5% 91.7% 92.0%
Number of patients waiting more than 52 weeks CCG 106 0 4 2 2 32
Diagnostic test waiting times
E.B.4 Diagnostic Test Waiting Times (%<6 week waits) CCG 99.3% ≥99% 99.1% 99.1% 98.7% 99.0%
Cancer waits – 2 week wait
Maximum two-week wait for first outpatient appointment for
patients referred urgently with suspected cancer by a GPCCG 94.0% ≥93% 92.5% 94.2% 92.5% 93.1%
Maximum two-week wait for first outpatient appointment for
patients referred urgently with breast symptoms (where
cancer was not initially suspected)
CCG 92.0% ≥93% 83.5% 83.3% 76.6% 81.1%
Cancer waits – 31 days
Maximum one month (31-day) wait from diagnosis to first
definitive treatment for all cancersCCG 98.1% ≥96% 98.7% 96.7% 96.1% 97.2%
Maximum 31-day wait for subsequent treatment where that
treatment is surgeryCCG 98.8% ≥94% 98.0% 97.9% 98.4% 98.1%
Maximum 31-day wait for subsequent treatment where that
treatment is an anti-cancer drug regimensCCG 99.4% ≥98% 100.0% 100.0% 100.0% 100.0%
Maximum 31-day wait for subsequent treatment where the
treatment is a course of radiotherapyCCG 98.5% ≥94% 92.9% 97.6% 97.1% 95.9%
Cancer waits – 62 days
Maximum two month (62-day) wait from urgent GP referral to
first definitive treatment for cancerCCG 87.8% ≥85% 90.1% 85.7% 87.3% 87.7%
Maximum 62-day wait from referral from an NHS screening
service to first definitive treatment for all cancersCCG 96.7% ≥90% 100.0% 96.7% 93.5% 96.7%
Maximum 62-day wait for first definitive treatment following a
consultant’s decision to upgrade the priority of the patient (all
cancers)
CCG 91.5% ≥90% No Pts 100.0% 100.0% 92.0%
Mixed Sex Accommodation Breaches
Breaches of Mixed-Sex Accommodation CCG 248 0 17 33 7 228
Mental Health
Care Programme Approach (CPA): The proportion of people
under adult mental illness specialties on CPA who were
followed up within 7 days of discharge from psychiatric in-
patient care during the period.
CCG 98.3% ≥95% 98% 98.3%
PROVIDER BASED INDICATORS
A&E waits
RUH 86.9% 86.9% 87.6% N/avail 87.3%
SFT 94.9% 90.5% 94.1% N/avail 92.3%
GWH 91.2% 87.7% 93.4% N/avail 90.6%
SWIC 100.0% 100.0% 100.0% N/avail 100.0%
Category Red Ambulance Responses
ARP - Red responses on scene within 8 minutes SWAST N/Avail ≥75% 66.8% 69.0% 69.8% 68.4%
ARP - Red T conveying responses on scene within 8 Minutes SWAST N/Avail ≥75% 81.3% 83.1% 84.2% 82.6%
Cancelled Operations
RUH 4 N/avail
SFT 2 N/avail
GWH 8 N/avail
All patients who have operations cancelled, on or after the
day of admission (including the day of surgery), for non-
clinical reasons to be offered another binding date within 28
days.
0
2015/16
2016/17
Patients should be admitted, transferred or discharged within
4 hours of their arrival at an A&E department (A&E and
MIUs)
≥95%

24
NHS WILTSHIRE CCG
Other CCG KPIs 2015/16 Target Apr-16 May-16 Jun-16 Jul-16 Aug-16 Sep-16 Oct-16 Nov-16 Dec-16 Jan-17 Feb-17 Mar-17 FOT
HCAI measure (C.Difficile infections) 128 103 7 7 10 96
Dementia Diagnosis (March 2017 Target) 65% ≥66.7% 64.2% 63.4% 64.1% 67%
IAPT Access Rate (2014/15 target = >15% or average >3.75% per Qtr) 20% ≥15% N/avail
IAPT Recovery Rate (2014/15 Quarter 4 target = >50%) 45% ≥50% N/avail
IAPT <6 Weeks Access 96% ≥75% N/avail N/avail N/avail
IAPT <18 Weeks Access 100% ≥95% N/avail N/avail N/avail
GWH/Wiltshire Health & Care Community Performance
Target Apr-16 May-16 Jun-16 Jul-16 Aug-16 Sep-16 Oct-16 Nov-16 Dec-16 Jan-17 Feb-17 Mar-17 YTD
RTM incomplete Pathways - % waiting under 18 weeks at month end ≥92% 92% 91% 93% 92.0%
Average length of stay - Mean <=20 33.9 32.5 23.4 29.9
Discharged by midday >=50% 35% 50% 44% 43%
Discharged at weekend <=15% 9% 17% 9% 12%
DToCs (% of occupied beds) <=20% 22% 13% 18% 18%
% End of Life patients dying in preferred place ≥75% 87% 87% 92% 89%
Indicator
2016/17
2016/17
25
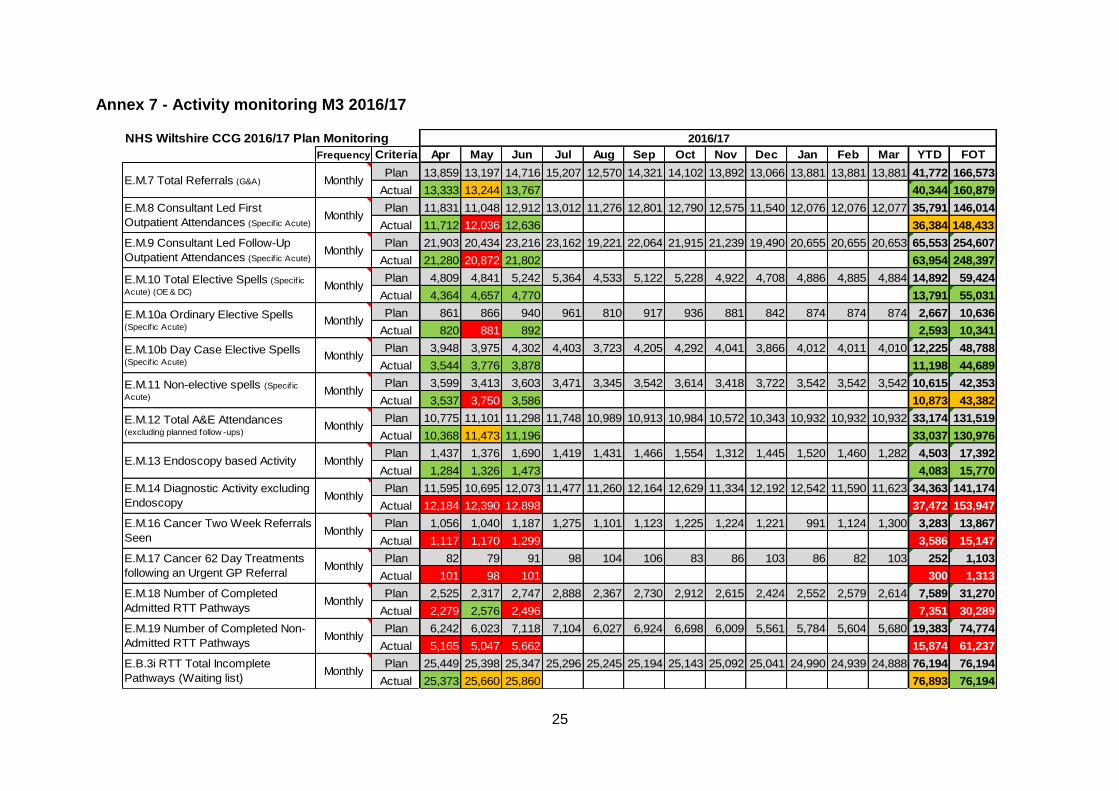
Annex 7 - Activity monitoring M3 2016/17
NHS Wiltshire CCG 2016/17 Plan Monitoring
Frequency Criteria Apr May Jun Jul Aug Sep Oct Nov Dec Jan Feb Mar YTD FOT
Plan 13,859 13,197 14,716 15,207 12,570 14,321 14,102 13,892 13,066 13,881 13,881 13,881 41,772 166,573
Actual 13,333 13,244 13,767 40,344 160,879
Plan 11,831 11,048 12,912 13,012 11,276 12,801 12,790 12,575 11,540 12,076 12,076 12,077 35,791 146,014
Actual 11,712 12,036 12,636 36,384 148,433
Plan 21,903 20,434 23,216 23,162 19,221 22,064 21,915 21,239 19,490 20,655 20,655 20,653 65,553 254,607
Actual 21,280 20,872 21,802 63,954 248,397
Plan 4,809 4,841 5,242 5,364 4,533 5,122 5,228 4,922 4,708 4,886 4,885 4,884 14,892 59,424
Actual 4,364 4,657 4,770 13,791 55,031
Plan 861 866 940 961 810 917 936 881 842 874 874 874 2,667 10,636
Actual 820 881 892 2,593 10,341
Plan 3,948 3,975 4,302 4,403 3,723 4,205 4,292 4,041 3,866 4,012 4,011 4,010 12,225 48,788
Actual 3,544 3,776 3,878 11,198 44,689
Plan 3,599 3,413 3,603 3,471 3,345 3,542 3,614 3,418 3,722 3,542 3,542 3,542 10,615 42,353
Actual 3,537 3,750 3,586 10,873 43,382
Plan 10,775 11,101 11,298 11,748 10,989 10,913 10,984 10,572 10,343 10,932 10,932 10,932 33,174 131,519
Actual 10,368 11,473 11,196 33,037 130,976
Plan 1,437 1,376 1,690 1,419 1,431 1,466 1,554 1,312 1,445 1,520 1,460 1,282 4,503 17,392
Actual 1,284 1,326 1,473 4,083 15,770
Plan 11,595 10,695 12,073 11,477 11,260 12,164 12,629 11,334 12,192 12,542 11,590 11,623 34,363 141,174
Actual 12,184 12,390 12,898 37,472 153,947
Plan 1,056 1,040 1,187 1,275 1,101 1,123 1,225 1,224 1,221 991 1,124 1,300 3,283 13,867
Actual 1,117 1,170 1,299 3,586 15,147
Plan 82 79 91 98 104 106 83 86 103 86 82 103 252 1,103
Actual 101 98 101 300 1,313
Plan 2,525 2,317 2,747 2,888 2,367 2,730 2,912 2,615 2,424 2,552 2,579 2,614 7,589 31,270
Actual 2,279 2,576 2,496 7,351 30,289
Plan 6,242 6,023 7,118 7,104 6,027 6,924 6,698 6,009 5,561 5,784 5,604 5,680 19,383 74,774
Actual 5,165 5,047 5,662 15,874 61,237
Plan 25,449 25,398 25,347 25,296 25,245 25,194 25,143 25,092 25,041 24,990 24,939 24,888 76,194 76,194
Actual 25,373 25,660 25,860 76,893 76,194
E.M.9 Consultant Led Follow-Up
Outpatient Attendances (Specif ic Acute)Monthly
2016/17
E.M.7 Total Referrals (G&A) Monthly
E.M.8 Consultant Led First
Outpatient Attendances (Specif ic Acute)Monthly
E.M.18 Number of Completed
Admitted RTT PathwaysMonthly
E.M.10a Ordinary Elective Spells (Specif ic Acute)
E.M.10b Day Case Elective Spells (Specif ic Acute)
E.M.11 Non-elective spells (Specif ic
Acute)
Monthly
Monthly
Monthly
MonthlyE.B.3i RTT Total Incomplete
Pathways (Waiting list)
E.M.10 Total Elective Spells (Specif ic
Acute) (OE & DC)Monthly
E.M.16 Cancer Two Week Referrals
SeenMonthly
E.M.19 Number of Completed Non-
Admitted RTT PathwaysMonthly
E.M.12 Total A&E Attendances (excluding planned follow -ups)
Monthly
E.M.13 Endoscopy based Activity Monthly
E.M.14 Diagnostic Activity excluding
EndoscopyMonthly
E.M.17 Cancer 62 Day Treatments
following an Urgent GP ReferralMonthly

26
Annex 8 – IPR Group Dashboard
This
month
Last
month
Constitutional Targets (Wiltshire CCG position unless stated)
18 Weeks RTT Incomplete Pathways CCG Total Jun-16 ≥92% 91.0% 91.7% 91.5%
18 Weeks RTT Incomplete Pathways RUH Jun-16 ≥92% 90.9% 90.9% 89.3%
18 Weeks RTT Incomplete Pathways GWH Jun-16 ≥92% 92.0% 92.6% 92.9%
18 Weeks RTT Incomplete Pathways SFT Jun-16 ≥92% 89.7% 91.6% 92.3%
Diagnostic Test within 6 weeks CCG Total Jun-16 ≤1% 0.90% 1.30% 0.90%
Diagnostic Test within 6 weeks RUH Jun-16 ≤1% 1.04% 0.90% 0.60%
Diagnostic Test within 6 weeks GWH Jun-16 ≤1% 1.00% 3.10% 2.30%
Diagnostic Test within 6 weeks SFT Jun-16 ≤1% 0.50% 0.80% 0.20%
52 week wait breaches CCG Total Jun-16 Zero - 2 2
Cancer 2WW CCG Total Jun-16 ≥93% 93.0% 92.5% 94.2%
Cancer 2WW Breast CCG Total Jun-16 ≥93% 95.0% 76.6% 83.3%
Cancer 62 days from urgent GP referral to definitive treatment Jun-16 ≥85% 86.8% 85.2% 85.7%
NON ELECTIVE SPELLS (Specific Acute)
CCG Total M3ytd 10,615 10,873 7,317
GWH M3ytd 2,610 2,521 1,668
RUH M3ytd 3,389 3,634 2,437
SFT M3ytd 3,615 3,756 2,538
ED ATTENDANCES
CCG Total M3ytd 34,363 33,287 21,728
GWH M3ytd 4,744 4,756 3,124
RUH M3ytd 5,246 5,508 3,594
SFT M3ytd 7,793 7,970 5,383
NHS 111
Calls Offered (BaNES & Wiltshire) M3ytd 36,601 25,346
SWAST
Total Incidents (with duplicate calls removed) M4ytd 21,721 16,091
MIU
Total Attendances M4ytd 13,826 10,152
SWIC
Total Attendances M4ytd 8,806 6,635
BDUC
Total Attendances M4ytd 678 521
NHS 111 Performance
Answered <60 secs % M3 ≥95% 91.7% 90.8%
Abandoned >30 secs calls% M3 ≤5% 1.5% 1.7%
Ambulance disposition % M3 ≤10% 11.2% 10.9%
ED Disposition % M3 ≤5% 7.5% 7.0%
Medvivo Performance
OOH Telephone Advice Calls M4ytd 8,677 6,618
OOH PCC Attendances M4ytd 10,786 8,334
OOH Home Visits M4ytd 3,088 2,312
Referrals to Urgent Care at Home M4ytd 84 65
Telecare Mobile Responses M4ytd 836 629
One number ATC calls M4ytd 26,588 20,266
ATC Referrals M4ytd 8,309 6,102
SWAST Performance
Hear and Treat Percentage M4ytd 11.7% 13.3%
See and Treat Percentage M4ytd 35.8% 35.2%
See and ED Conveyance Percentage M4ytd 47.7% 46.2%
High Impact Interventions
Weekend discharges % (80% of Weekday)
GWH M3ytd ≥80% 52% 57%
RUH M3ytd ≥80% 48% 55%
SFT M3ytd ≥80% 42% 47%
GWH Community M3ytd ≥80% 48% 42%
DTOC %
GWH May-16
RUH May-16
SFT May-16
GWH Community May-16
Children's community services:
Non-consultant led services: RTM incomplete Pathways - % waiting under 18 weeks at month end ≥92% ≥92%
% CAMHS T3 new referrals assessed within 12 weeks of referral Jun-16 ≥95% ≥95% 88% 81%
% CAMHS T2 new referrals assessed within 12 weeks of referral Jun-16 100% 100% 64% 67%
Paediatric consultant follow ups seen within 6 weeks of agreed date
Proportion of children over 14 with a transition plan 100%
Children's continuing care: expenditure against ring fenced value within contract
National child measure ment programme- reception children very overweight 4.37%
National child measure ment programme- Year 6 children very overweight 10.17%
CAMHS Transformation Plan:
% referrals to Single Point of Access which don't meet CAMHS service criteria & are provided with an early help response where appropriate 95% New KPI - Data due Q3
% of referrals to CAMHS T2 which are inappropriate 10% 13% 16%
% of children and young people who, at the end of CAMHS treatment, self-report main presenting problem has improved 95% New KPI - Data due Q3
% re-referrals to CAMHS within 12 months tbc New KPI - Data due Q3
No of CAMHS hospital admissions May-16 N/A 2 3
No of CAMHS hospital bed days May-16 N/A 241 157
No of 11 - 18 year olds attending A&E where mental health is the primary or secondary diagnosis tbc New KPI - Data due Q3
AWP
4 week RTA (Referral to Assessment) Jul-16 0 52 49
4 hour wait - emergency crisis assessment Jul-16 ≥95% 79.4% 89.2%
% of admissions gatekept (working adult age) Jul-16 ≥95% 77.1% 86.0%
DTOC for wiltshire wards Jul-16 7.50% 10.59% 10.44%
Timely reviews (CPA for more than 12 months) Jul-16 ≥95% 90.9% 95.2%
18 week RTT Jul-16 ≥95% 92.6% 91.3%
50% of people experiencing first episode of psychosis to access NICE approved care package within <2 wks. (Mandate 6.3) Jun-16 ≥50% 100.0% 60.0%
Learning Disability - Proportion of peple with a learning disability on the GP register receiving an annual health check Jun-16 ≥30.7% 22.49%
Access and waiting time standards for mental health services embedded (Mandate 6.3)
Me
nta
l He
alth
Co
mm
un
ity
Serv
ice
sU
np
lan
ne
d C
are
Not yet available
Annual data
Not yet available
Pla
nn
ed
Car
e
Data
PeriodNHS Wiltshire CCG IPR Group Dashboard Report
PerformanceLocal
Target
YTD
National
Target
YTD
27
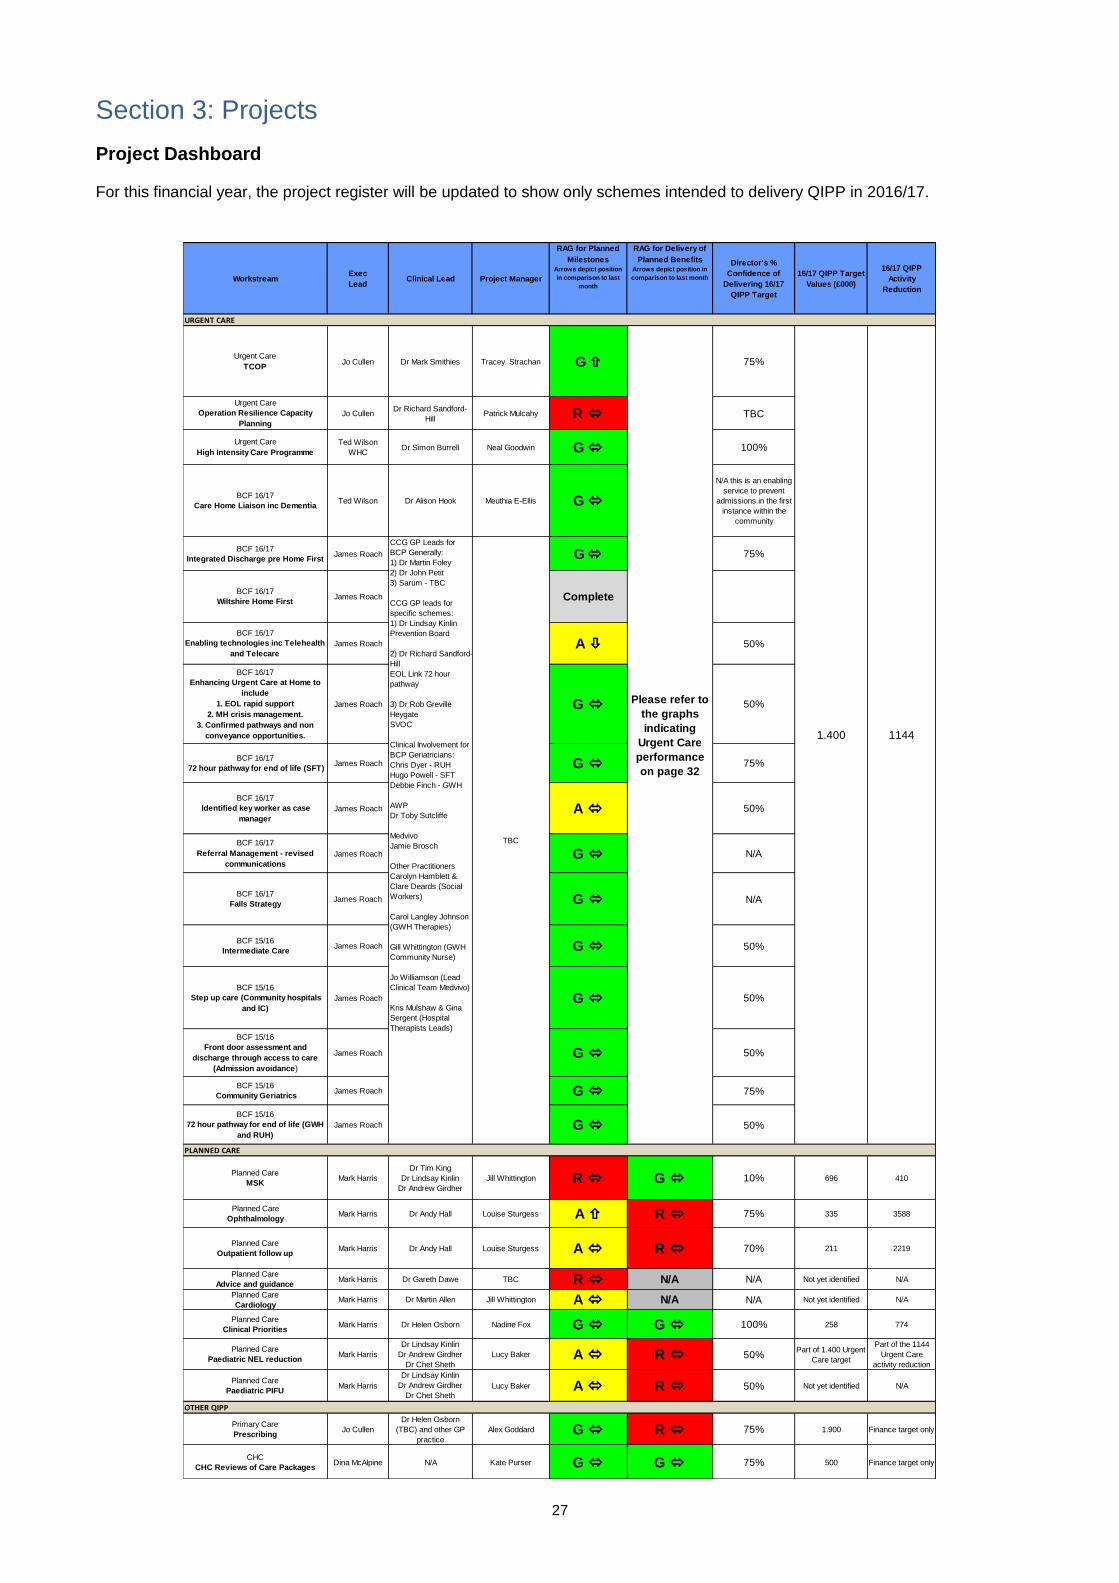
Section 3: Projects
Project Dashboard For this financial year, the project register will be updated to show only schemes intended to delivery QIPP in 2016/17.
WorkstreamExec
LeadClinical Lead Project Manager
RAG for Planned
MilestonesArrows depict position
in comparison to last
month
RAG for Delivery of
Planned BenefitsArrows depict position in
comparison to last month
Director's %
Confidence of
Delivering 16/17
QIPP Target
16/17 QIPP Target
Values (£000)
16/17 QIPP
Activity
Reduction
URGENT CARE
Urgent Care
TCOPJo Cullen Dr Mark Smithies Tracey Strachan G 75%
Urgent Care
Operation Resilience Capacity
Planning
Jo CullenDr Richard Sandford-
HillPatrick Mulcahy R TBC
Urgent Care
High Intensity Care Programme
Ted Wilson
WHCDr Simon Burrell Neal Goodwin G 100%
BCF 16/17
Care Home Liaison inc DementiaTed Wilson Dr Alison Hook Meuthia E-Ellis G
N/A this is an enabling
service to prevent
admissions in the first
instance within the
community
BCF 16/17
Integrated Discharge pre Home FirstJames Roach G 75%
BCF 16/17
Wiltshire Home FirstJames Roach Complete
BCF 16/17
Enabling technologies inc Telehealth
and Telecare
James Roach A 50%
BCF 16/17
Enhancing Urgent Care at Home to
include
1. EOL rapid support
2. MH crisis management.
3. Confirmed pathways and non
conveyance opportunities.
James Roach G 50%
BCF 16/17
72 hour pathway for end of life (SFT)James Roach G 75%
BCF 16/17
Identified key worker as case
manager
James Roach A 50%
BCF 16/17
Referral Management - revised
communications
James Roach G N/A
BCF 16/17
Falls StrategyJames Roach G N/A
BCF 15/16
Intermediate CareJames Roach G 50%
BCF 15/16
Step up care (Community hospitals
and IC)
James Roach G 50%
BCF 15/16
Front door assessment and
discharge through access to care
(Admission avoidance)
James Roach G 50%
BCF 15/16
Community GeriatricsJames Roach G 75%
BCF 15/16
72 hour pathway for end of life (GWH
and RUH)
James Roach G 50%
PLANNED CARE
Planned Care
MSKMark Harris
Dr Tim King
Dr Lindsay Kinlin
Dr Andrew Girdher
Jill Whittington R G 10% 696 410
Planned Care
OphthalmologyMark Harris Dr Andy Hall Louise Sturgess A R 75% 335 3588
Planned Care
Outpatient follow upMark Harris Dr Andy Hall Louise Sturgess A R 70% 211 2219
Planned Care
Advice and guidanceMark Harris Dr Gareth Dawe TBC R N/A N/A Not yet identified N/A
Planned Care
CardiologyMark Harris Dr Martin Allen Jill Whittington A N/A N/A Not yet identified N/A
Planned Care
Clinical Priorities Mark Harris Dr Helen Osborn Nadine Fox G G 100% 258 774
Planned Care
Paediatric NEL reductionMark Harris
Dr Lindsay Kinlin
Dr Andrew Girdher
Dr Chet Sheth
Lucy Baker A R 50%Part of 1.400 Urgent
Care target
Part of the 1144
Urgent Care
activity reduction
Planned Care
Paediatric PIFUMark Harris
Dr Lindsay Kinlin
Dr Andrew Girdher
Dr Chet Sheth
Lucy Baker A R 50% Not yet identified N/A
OTHER QIPP
Primary Care
PrescribingJo Cullen
Dr Helen Osborn
(TBC) and other GP
practice
Alex Goddard G R 75% 1.900 Finance target only
CHC
CHC Reviews of Care PackagesDina McAlpine N/A Kate Purser G G 75% 500 Finance target only
CCG GP Leads for
BCP Generally:
1) Dr Martin Foley
2) Dr John Petit
3) Sarum - TBC
CCG GP leads for
specific schemes:
1) Dr Lindsay Kinlin
Prevention Board
2) Dr Richard Sandford-
Hill
EOL Link 72 hour
pathway
3) Dr Rob Greville
Heygate
SVOC
Clinical Involvement for
BCP Geriatricians:
Chris Dyer - RUH
Hugo Powell - SFT
Debbie Finch - GWH
AWP
Dr Toby Sutcliffe
Medvivo
Jamie Brosch
Other Practitioners
Carolyn Hamblett &
Clare Deards (Social
Workers)
Carol Langley Johnson
(GWH Therapies)
Gill Whittington (GWH
Community Nurse)
Jo Williamson (Lead
Clinical Team Medvivo)
Kris Mulshaw & Gina
Sergent (Hospital
Therapists Leads)
TBC
Please refer to
the graphs
indicating
Urgent Care
performance
on page 32
1.400 1144
28
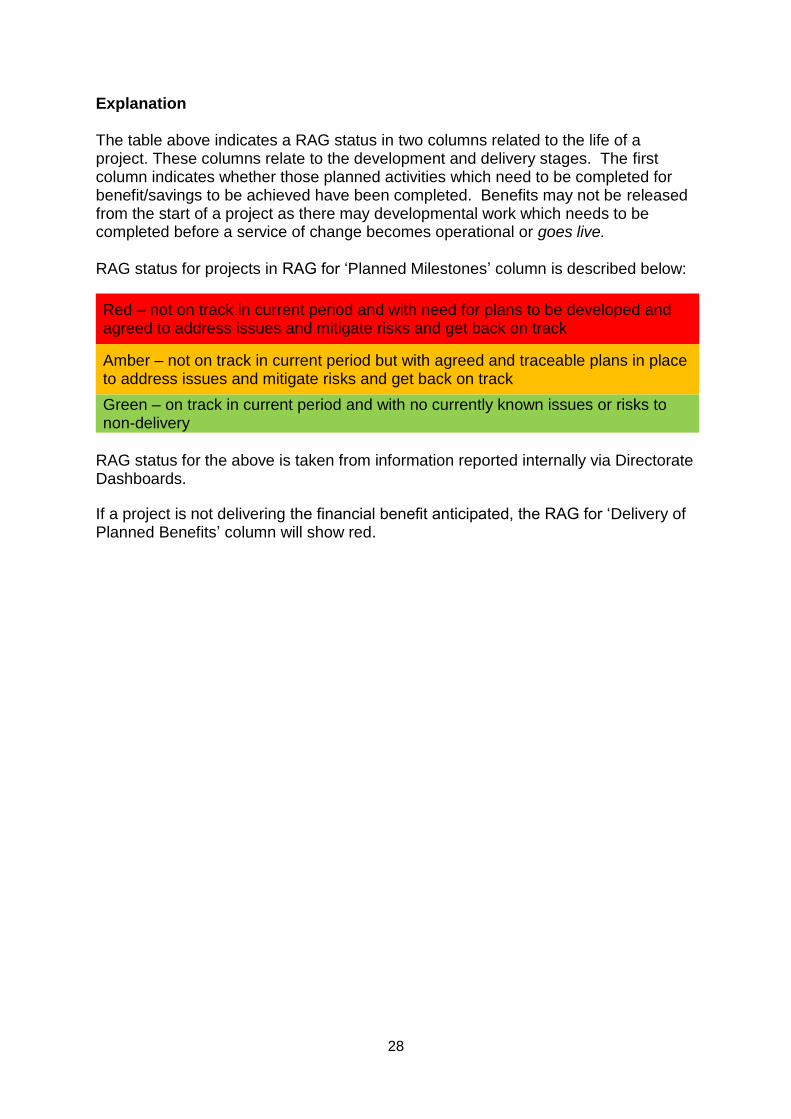
Explanation The table above indicates a RAG status in two columns related to the life of a project. These columns relate to the development and delivery stages. The first column indicates whether those planned activities which need to be completed for benefit/savings to be achieved have been completed. Benefits may not be released from the start of a project as there may developmental work which needs to be completed before a service of change becomes operational or goes live. RAG status for projects in RAG for ‘Planned Milestones’ column is described below:
Red – not on track in current period and with need for plans to be developed and agreed to address issues and mitigate risks and get back on track
Amber – not on track in current period but with agreed and traceable plans in place to address issues and mitigate risks and get back on track
Green – on track in current period and with no currently known issues or risks to non-delivery
RAG status for the above is taken from information reported internally via Directorate Dashboards.
If a project is not delivering the financial benefit anticipated, the RAG for ‘Delivery of Planned Benefits’ column will show red.
29
Programme Management The Programme Management Office (PMO) tracks progress of delivery through meetings with project managers and also the Directorate Dashboards which are reviewed monthly by the Executive Management Team. The PMO also produces status reports for the CCG’s Finance and Performance Committee. A number of mechanisms designed to increase accountability, identified by internal audit and agreed by the CCG’s Audit and Assurance Committee are included in the PMO reporting process and this Integrated Performance Report. Update on the 16/17 QIPP work streams June 2016 performance data is shown in this report. The 16/17 Delivery Plan included the requirement for QIPP savings to be delivered in order to achieve financial balance. QIPP is divided into the following categories: Programme Related Activity, including: Urgent Care – delivered through a combination of the Better Care Fund, Transforming Care for Older People and Operational Resilience Capacity funding streams. Some savings (approximately 75%) will be delivered through schemes which remain in place from 15/16 whilst others are new. Community services transformation will also act as an enabler to deliver the required savings target totalling £1.4m in 16/17. Urgent Care QIPP is monitored using SLAM data. Planned Care – a number of schemes identified to deliver the target. Planned Care QIPP is monitored using SUS data. Other QIPP – delivered through initiatives in Primary Care Prescribing and CHC Reviews. Performance in the other QIPP programmes is monitored using multiple data sources each of which received validation by the Finance department. Non Programme Related Activity – including running costs. The total QIPP target across all areas is £14.2 million. To support the delivery of the improvements and the QIPP savings, the CCG has adjusted its Clinical Executive meeting structure so that on a monthly basis a Transformation Programme Board will meet with relevant leaders including members of the Clinical Executive team. These meetings will alternate their attention between Planned Care and Out of Hospital Care. The System Resilience Groups will also continue. In the remainder of this section, high level indicators of performance are shown along with commentary from directors responsible for programme related activity schemes identified to deliver financial savings. Planned Care will indicate both the financial and activity performance.

30
QIPP Summary
The graph above is not incomplete; it indicates that M3 QIPP schemes cumulatively are not delivering the YTD planned savings of £656,222 for programme related activity. The reason that there is no depiction of this position on the bar chart is because not only is the target not being delivered; but the spend on Urgent Care activity is £809,143 more than the 15/16 baseline. This results in a net underperformance of £1,088,194.
QIPP SCHEMES DRIVEN BY PROGRAMME RELATED ACTIVITY
Planned Care
3
Planned
Reductions
YTD Planned
Reductions
Variance Against
YTD Planned
Reductions
Planned
Savings
YTD Planned
Savings
YTD Actual
Savings on
Baseline
Variance Against
YTD Planned Savings
OPHTHALMOLOGY 3,588 28 -218 £335,070 £22,348 -£13,445 -£35,793
CLINICAL PRIORITIES 774 186 -90 £258,178 £56,963 £78,602 £21,639
OUTPATIENT PIFU 2,219 115 82 £210,885 £12,727 -£35,877 -£48,604
MSK 410 2 -418 £695,867 £1,744 £149,172 £147,428
PLANNED CARE SUBTOTAL 6,991 331 -644 £1,500,000 £93,782 £178,452 £84,669
Urgent Care
Planned
Reductions
YTD Planned
Reductions
Variance Against
YTD Planned
Reductions
Planned
Savings
YTD Planned
Savings
YTD Actual
Savings on
Baseline
Variance Against
YTD Planned Savings
URGENT CARE SUBTOTAL 1,144 286 -861 £1,400,000 £350,000 -£809,143 -£1,159,143
Non Acute Commissioned Services
Planned
Savings
YTD Planned
Savings
YTD Actual
Savings on
Baseline
Variance Against
YTD Planned Savings
PRESCRIBING - - - £1,900,000 £112,500 £98,779 -£13,721
CONTINUED HEALTH CARE - - - £500,000 £99,940 £99,940 £0
NON ACUTE COMMISSIONED SERVICES SUBTOTAL - - - £2,400,000 £212,440 £198,719 -£13,721
Planned
Savings
YTD Planned
Savings
YTD Actual
Savings on
Baseline
Variance Against
YTD Planned Savings
SUMMARY OF QIPP SCHEMES DRIVEN BY PROGRAMME RELATED ACTIVITY £5,300,000 £656,222 -£431,972 -£1,088,194
Finance
Finance
Activity
Activity
Please note that negative variance is shortfall and positive variance is overachievement
Please note that negative variance is shortfall and positive variance is overachievement
Please note that negative variance is shortfall and positive variance is overachievement
Finance
Please note that negative variance is shortfall and positive variance is overachievement
Summary Level QIPP Performance - Month 3 (June)
Please note that negative variance is shortfall and positive variance is overachievement
Finance
£0 £500,000 £1,000,000 £1,500,000 £2,000,000 £2,500,000 £3,000,000 £3,500,000 £4,000,000 £4,500,000 £5,000,000 £5,500,000 £6,000,000
Savings to be Delivered YTD Savings Below Target YTD Savings Above Target YTD Target End of Year Target
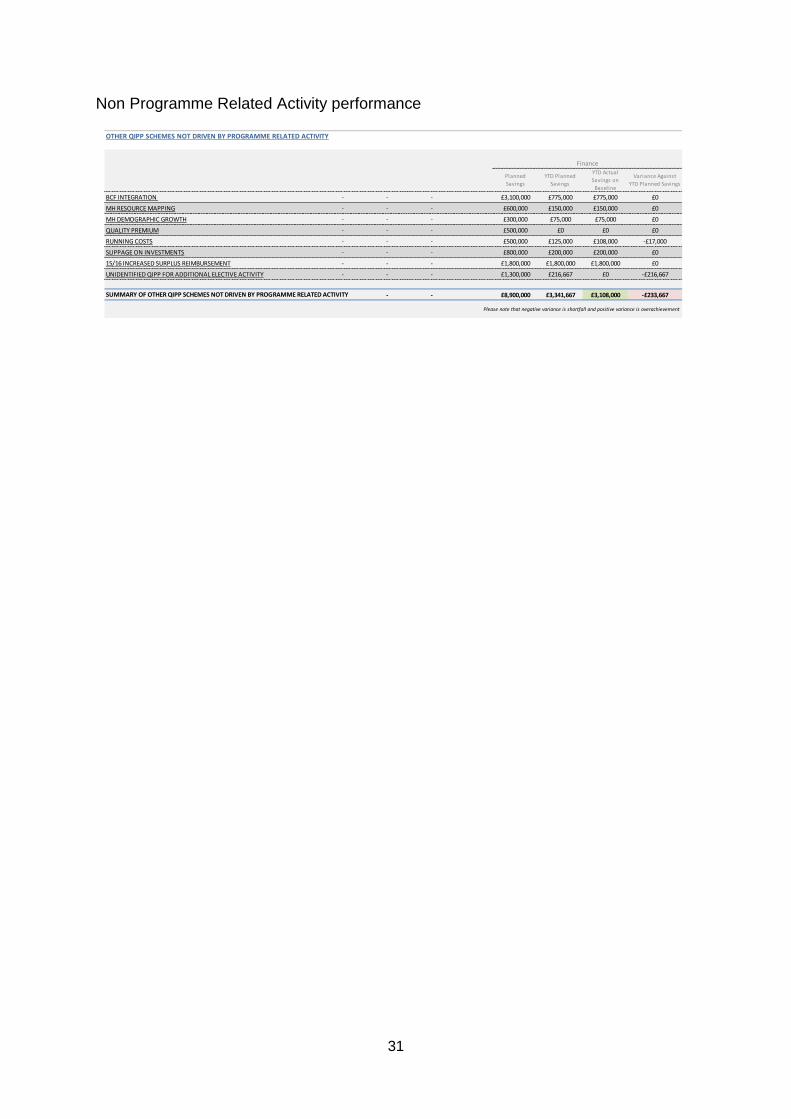
31
Non Programme Related Activity performance
OTHER QIPP SCHEMES NOT DRIVEN BY PROGRAMME RELATED ACTIVITY
Planned
Savings
YTD Planned
Savings
YTD Actual
Savings on
Baseline
Variance Against
YTD Planned Savings
BCF INTEGRATION - - - £3,100,000 £775,000 £775,000 £0
MH RESOURCE MAPPING - - - £600,000 £150,000 £150,000 £0
MH DEMOGRAPHIC GROWTH - - - £300,000 £75,000 £75,000 £0
QUALITY PREMIUM - - - £500,000 £0 £0 £0
RUNNING COSTS - - - £500,000 £125,000 £108,000 -£17,000
SLIPPAGE ON INVESTMENTS - - - £800,000 £200,000 £200,000 £0
15/16 INCREASED SURPLUS REIMBURSEMENT - - - £1,800,000 £1,800,000 £1,800,000 £0
UNIDENTIFIED QIPP FOR ADDITIONAL ELECTIVE ACTIVITY - - - £1,300,000 £216,667 £0 -£216,667
- - £8,900,000 £3,341,667 £3,108,000 -£233,667
Finance
Please note that negative variance is shortfall and positive variance is overachievement
SUMMARY OF OTHER QIPP SCHEMES NOT DRIVEN BY PROGRAMME RELATED ACTIVITY

32
URGENT CARE QIPP
Finance
This section is included to indicate the financial performance of a scheme against target
16/17 Targeted Saving £1,400,000 YTD Targeted Savings £350,000
YTD Savings Achieved £0
YTD Variance on Target -£350,000
-£1,159,143 -£809,143
Apr May Jun Jul Aug Sep Oct Nov Dec Jan Feb Mar YTD Full Year
15/16 Baseline inc Growth £6,255,839 £6,464,978 £6,255,839 £6,464,978 £6,464,978 £6,255,839 £6,464,978 £6,255,839 £6,464,978 £6,464,978 £5,837,562 £6,464,978 £18,976,656 £76,115,764
Planned QIPP Reduction £116,667 £116,667 £116,667 £116,667 £116,667 £116,667 £116,667 £116,667 £116,667 £116,667 £116,667 £116,667 £350,000 £1,400,000
16/17 Plan £6,139,172 £6,348,311 £6,139,172 £6,348,311 £6,348,311 £6,139,172 £6,348,311 £6,139,172 £6,348,311 £6,348,311 £5,720,895 £6,348,311 £18,626,656 £74,715,764
16/17 Actuals £6,589,460 £6,503,534 £6,692,805 £19,785,799
Difference £450,288 £155,222 £553,633 £1,159,143 #
This section is included to indicate whether a scheme is delivering the activity reductions required
16/17 Targeted Reduction 1,144 YTD Targeted Reduction 286
YTD Reduction Achieved 0
YTD Variance on Target -286
-861
Apr May Jun Jul Aug Sep Oct Nov Dec Jan Feb Mar YTD Full Year
15/16 Baseline inc Growth 3,151 3,256 3,151 3,256 3,256 3,151 3,256 3,151 3,256 3,256 2,941 3,256 9,558 38,337
Planned QIPP Reduction 95 95 95 95 95 95 95 95 95 95 95 95 286 1,144
16/17 Plan 3,056 3,161 3,056 3,161 3,161 3,056 3,161 3,056 3,161 3,161 2,846 3,161 9,272 37,193
16/17 Actuals 3,260 3,556 3,317 10,133
Difference 204 395 261 861 #
Urgent Care QIPP Performance - Month 3 (June) Reductions in Non Elective Admissions
QIPP performance in the urgent care work stream. Delivered through a combination of the Better Care fund, Transforming Care for Older People and Operational Resilience Capacity funding streams. Some savings
(approximately 75%) will be delivered through schemes which remain in place from 15/16 whilst others are new. Community services transformation will also act as an enabler to deliver the required savings.
Activity
£0 £100,000 £200,000 £300,000 £400,000 £500,000 £600,000 £700,000 £800,000 £900,000 £1,000,000 £1,100,000 £1,200,000 £1,300,000 £1,400,000 £1,500,000
Savings to be Delivered YTD Savings Below Target YTD Savings Above Target YTD Target End of Year Target
0 200 400 600 800 1,000 1,200
Reduction to be Delivered YTD Reductions Below Target YTD Reductions Above Target YTD Reduction Target End of Year Target

33
Operational Resilience and Capacity Planning (ORCP) – Programme Director: Jo Cullen
Investment has been identified for provider plans to support their operations. The Wiltshire System Resilience Group provides the forum for agreement of these plans and the subsequent resource allocation. Investments now received from 3 acute provider trusts. Monitoring process established via internal Urgent Care dashboard.
GWH Plans received. Status update discussed. GWH reviewing existing plans to make slight adjustment on workforce costs to account for adjusted ORCP allocations. Following review, recruitment process to start for pharmacy element. Existing physiotherapy workforce to be reviewed to bolster current skeleton weekend teams.
RUH Awaiting KPI and status update from RUH.
SFT Plans received. Awaiting KPI and Status update from SFT.
GWH Community Confirming whether new provider will have ORCP allocations from the 3 Acute Trusts.
Medvivo Not contributing to QIPP
Urgent Repeat Medication Service Paper to July SRG identifying system benefit to locating pharmacy resource within OOH provision rather than commissioning directly with pharmacies. Nil savings identified.
Confidence level: TBC% confidence level of delivery of QIPP associated with the programme (based on investment through ORCP funding and other programmes mainly intermediate care, community services and primary care).
Primary Care Developments – Transforming Care of Older People (TCOP) There are schemes covering all 56 practices - majority are locality/town wide with some individual practice schemes due to rural nature eg Whiteparish. Evaluations and actual financial plans now ratified and signed off 2015/16; and plans agreed for 16/17 based on over 75 population via virtual TCOP Panel sign off. A Primary Care Oversight Committee is being established, as per the Primary Care Offer (PCO) Governing Body Paper (approved March 2016) first meeting in October to review progress against plans (with LMC, Healthwatch and NHSE reps). A number of localities have aligned and enhanced TCOP schemes (such as 70-74 year olds) with the Locality Service element from the PCO, and Care Homes develop a more resilient workforce. A Locality Dashboard is being developed to triangulate and present activity and performance data by investment and local issues/challenges. Confidence level: 75% confidence level of delivery of QIPP Associated with programme.
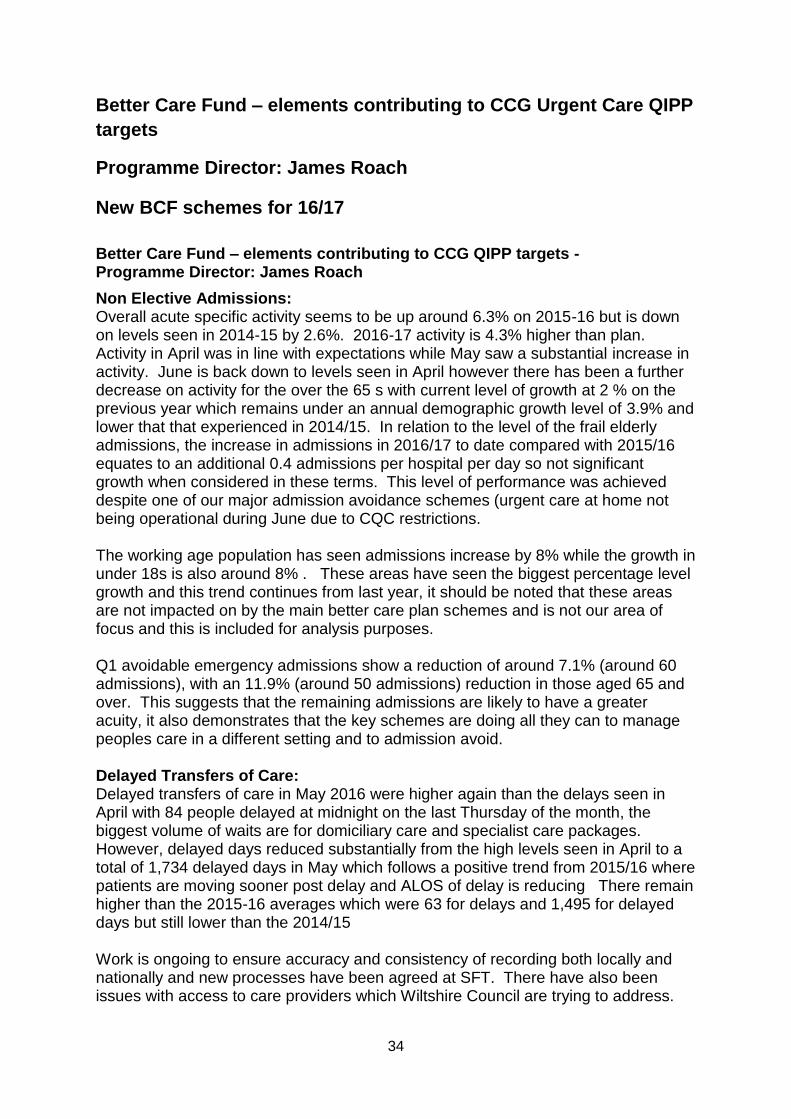
34
Better Care Fund – elements contributing to CCG Urgent Care QIPP
targets
Programme Director: James Roach
New BCF schemes for 16/17
Better Care Fund – elements contributing to CCG QIPP targets - Programme Director: James Roach
Non Elective Admissions: Overall acute specific activity seems to be up around 6.3% on 2015-16 but is down on levels seen in 2014-15 by 2.6%. 2016-17 activity is 4.3% higher than plan. Activity in April was in line with expectations while May saw a substantial increase in activity. June is back down to levels seen in April however there has been a further decrease on activity for the over the 65 s with current level of growth at 2 % on the previous year which remains under an annual demographic growth level of 3.9% and lower that that experienced in 2014/15. In relation to the level of the frail elderly admissions, the increase in admissions in 2016/17 to date compared with 2015/16 equates to an additional 0.4 admissions per hospital per day so not significant growth when considered in these terms. This level of performance was achieved despite one of our major admission avoidance schemes (urgent care at home not being operational during June due to CQC restrictions. The working age population has seen admissions increase by 8% while the growth in under 18s is also around 8% . These areas have seen the biggest percentage level growth and this trend continues from last year, it should be noted that these areas are not impacted on by the main better care plan schemes and is not our area of focus and this is included for analysis purposes. Q1 avoidable emergency admissions show a reduction of around 7.1% (around 60 admissions), with an 11.9% (around 50 admissions) reduction in those aged 65 and over. This suggests that the remaining admissions are likely to have a greater acuity, it also demonstrates that the key schemes are doing all they can to manage peoples care in a different setting and to admission avoid. Delayed Transfers of Care: Delayed transfers of care in May 2016 were higher again than the delays seen in April with 84 people delayed at midnight on the last Thursday of the month, the biggest volume of waits are for domiciliary care and specialist care packages. However, delayed days reduced substantially from the high levels seen in April to a total of 1,734 delayed days in May which follows a positive trend from 2015/16 where patients are moving sooner post delay and ALOS of delay is reducing There remain higher than the 2015-16 averages which were 63 for delays and 1,495 for delayed days but still lower than the 2014/15 Work is ongoing to ensure accuracy and consistency of recording both locally and nationally and new processes have been agreed at SFT. There have also been issues with access to care providers which Wiltshire Council are trying to address.
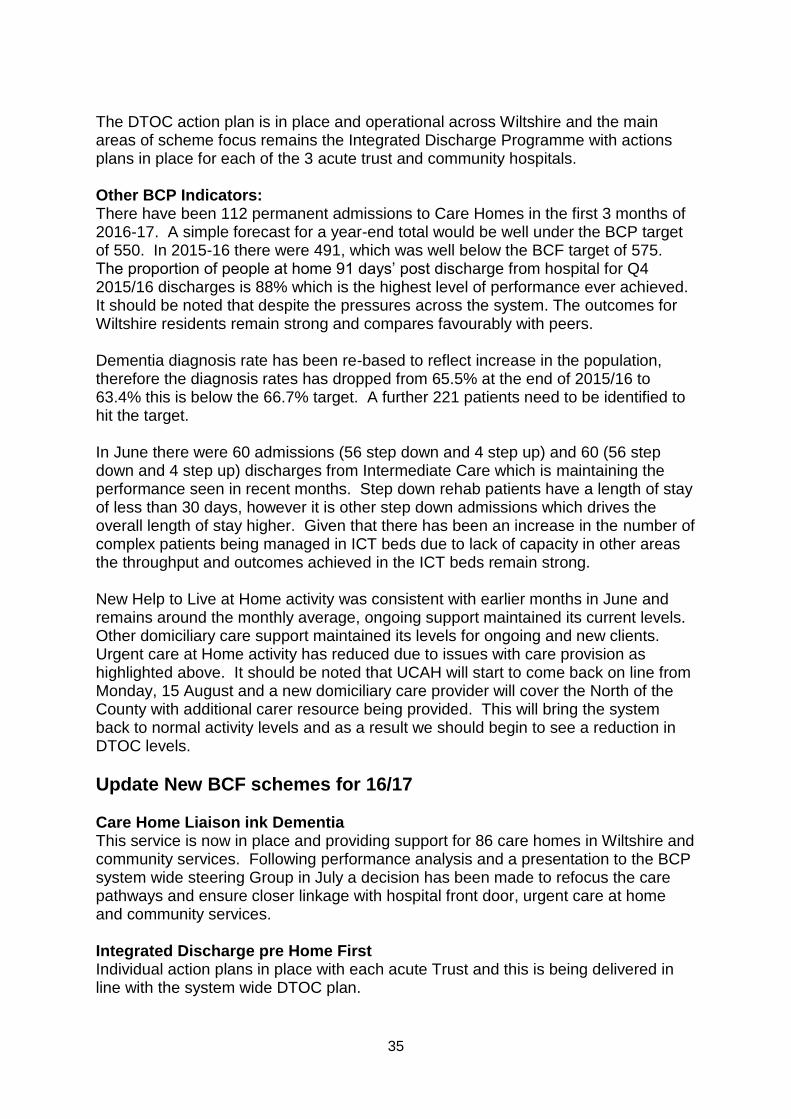
35
The DTOC action plan is in place and operational across Wiltshire and the main areas of scheme focus remains the Integrated Discharge Programme with actions plans in place for each of the 3 acute trust and community hospitals. Other BCP Indicators: There have been 112 permanent admissions to Care Homes in the first 3 months of 2016-17. A simple forecast for a year-end total would be well under the BCP target of 550. In 2015-16 there were 491, which was well below the BCF target of 575. The proportion of people at home 91 days’ post discharge from hospital for Q4 2015/16 discharges is 88% which is the highest level of performance ever achieved. It should be noted that despite the pressures across the system. The outcomes for Wiltshire residents remain strong and compares favourably with peers. Dementia diagnosis rate has been re-based to reflect increase in the population, therefore the diagnosis rates has dropped from 65.5% at the end of 2015/16 to 63.4% this is below the 66.7% target. A further 221 patients need to be identified to hit the target. In June there were 60 admissions (56 step down and 4 step up) and 60 (56 step down and 4 step up) discharges from Intermediate Care which is maintaining the performance seen in recent months. Step down rehab patients have a length of stay of less than 30 days, however it is other step down admissions which drives the overall length of stay higher. Given that there has been an increase in the number of complex patients being managed in ICT beds due to lack of capacity in other areas the throughput and outcomes achieved in the ICT beds remain strong. New Help to Live at Home activity was consistent with earlier months in June and remains around the monthly average, ongoing support maintained its current levels. Other domiciliary care support maintained its levels for ongoing and new clients. Urgent care at Home activity has reduced due to issues with care provision as highlighted above. It should be noted that UCAH will start to come back on line from Monday, 15 August and a new domiciliary care provider will cover the North of the County with additional carer resource being provided. This will bring the system back to normal activity levels and as a result we should begin to see a reduction in DTOC levels.
Update New BCF schemes for 16/17 Care Home Liaison ink Dementia This service is now in place and providing support for 86 care homes in Wiltshire and community services. Following performance analysis and a presentation to the BCP system wide steering Group in July a decision has been made to refocus the care pathways and ensure closer linkage with hospital front door, urgent care at home and community services. Integrated Discharge pre Home First Individual action plans in place with each acute Trust and this is being delivered in line with the system wide DTOC plan.

36
Wiltshire Home First The project at SFT closed at the end of March and this will now transfer to Business as Usual through the integrated discharge programme. Meeting held on Tuesday 7th June to confirm key priorities for SFT and evaluation report was presented at the CCG Governing Body and Joint Commissioning Board. Enabling technologies inc Telehealth and Telecare This area of work is being progressed by the Prevention Board of the BCF and agreed actions in place to increase use of telehealth. This will become a core provision option as part of the integrated discharge programme. Planned action for the next period - utilisation report to be presented at the system wide BCP Steering Group in July. Enhancing Urgent Care at Home to include 1. EOL rapid support 2. MH crisis management. 3. Confirmed pathways and non-conveyance opportunities. Service has consistently been managing a high level of referrals and March and April both saw record numbers of referrals. However, the domiciliary care provider MI home Care is currently subject to a CQC embargo this will create a significant impact on service provision and contingencies are being sought. Service contingencies are now in place but it will take some time before the service is up and running at normal activity levels, this has had a significant impact on system flow and has resulted in a loss of 80 discharges a month which equates to current level of DTOCs across the system 72-hour pathway for end of life (SFT) On track for go live and recruitment completed. Service goes live in August with Monthly updates provided from September. Identified key worker as case manager Where Integrated Teams are in place this is working and key workers play a key part in the discharge and case management of patients. However not all integrated teams are fully operational and we need to establish an overview of service provision so key actions can be prioritised. Planned action for next period - analysis of all 22 integrated teams to be undertaken and discussed at the July BCP Steering Group. Following this it has been decided that an update on Integrated Teams will be provided at the next CCG Governing Body (pubic session) and JCB. Comprehensive service for Dementia patients See care home liaison update above. Referral Management - revised communications Was discussed at WYKDD GP forum and GPs agreed with the suggest direction and aim is to roll this out across Wiltshire in the form of a revised BCP Newsletter.

37
Planned action for next period - revised referral comms and key BCP messages to be sent to all key stakeholders from 1 August 2016. Falls Strategy Scheme being managed by the system wide bone health group and monthly updates are being provided. Evaluation of the Fracture Liaison Service at SFT has been undertaken and it is pleasing to note that the service has exceeded all core KPIS and have provided a strong case for continuation. Fracture liaison services were identified as a key priority through the STP process and further consideration will be given to extending this service to GWH and RUH.
Schemes Continued from the BCF 15/16 Intermediate Care 70 beds continue and service continues to reduce LOS and receive a high level of referrals. Key actions for the next period include:
1. Completing ICT commissioning Strategy for next 2 years in line with Integrated Discharge Plans and
2. Commence focused training plans with each home. Admission Avoidance No commentary provided as key points in each relevant scheme area Step up care (Community hospitals and IC) Monthly reports continue to be provided and system wide definition and patient category for step up has been confirmed. Planned actions for the next period
1. Next quarterly clinical audit to be undertaken. 2. Enhance step up care at home and in CH Beds as part of the integrated
discharge programme. Front door assessment and discharge through access to care (Admission avoidance) Key actions being developed as part of the Integrated Discharge Programme with monthly updated. Urgent Care at Home As detailed above in enhanced urgent care at home section Community Geriatrics Service continues to report outcomes on an ongoing basis. There are concerns in relation to the level of service being provided in SFT and this will need review Planned action for the next period:
1. Undertake clinical audit of community geriatrician service in the South. 2. Agree approach with Sarum GPs for interface with this scheme to improve
coverage and outcomes

38
ICT cohorted beds (step down) Update above in BCF intermediate care. 72-hour pathway for end of life (GWH and RUH) Service continues and monthly reports provided.
Confidence level for delivery of overall BCF work streams – 75% NB. 15/16 BCF schemes indicated on the project register remain as business as usual and commentary is therefore not provided.

39
Higher Intensity Care (HIC) Programme delivered through Wiltshire
Health & Care (WHC)
Programme Director: Ted Wilson Jul 16
Set up project structure
Set up project steering group
Agree focus of soft launch process for Higher Intensity Care at Home
Write JD for specialist Doctor role - COMPLETED
Undertake training needs analysis specific to HIC
Obtain technical expert support from IG to agree process for WHC partners to use SystmOne
Write SOP for ambulatory Care
Write SOP for Higher Intensity Care at home Aug 16
Develop 'bite size' training modules in line with identified gaps in knowledge
Agree SOPs with OIGs Q2 Overall -
Agree medical resource requirements.
Test virtual community beds model in West Wiltshire. Sep 16
Begin Recruitment
Establish use of SystmOne for HIC
Agree fast track pathway for diagnostics with acute trusts
Design and cost estate changes for ambulatory care Warminster Oct 16
Design and cost estate changes for ambulatory care Chippenham Q3 Overall -
Commence MDT / GP facilitation in West and subsequently South
Soft launch of ambulatory support in Warminster. Q4 Overall-
Soft launch of ambulatory support in Savernake and Chippenham.
Roll out of virtual beds in North and South Wiltshire Confidence level – 100%

40
Non – Elective Paediatric developments to support delivery of Urgent Care QIPP
Programme Director: Mark Harris
Awaiting decision regarding BaNES ORCP funding to support paediatrics QIPP scheme at RUH - BaNES have requested additional business case, which is due 12 August. Non-elective paediatrics activity is flat at GWH and SFT but shows significant growth at RUH. HRG level data shared with provider and update is awaited - due week commencing 15 August. Confidence level – 50%
41
PLANNED CARE QIPP Programme Director: Mark Harris
Ophthalmology Delivered through three schemes:
Cataract Procedures;
GOS18 Triage Referrals; and
Community Stable Management. Each of which is shown separately in the information below.
Finance
This section is included to indicate the financial performance of a scheme against target
16/17 Targeted Savings £1,500,000 YTD Targeted Savings £93,782
YTD Savings Achieved £178,452
YTD Variance on Target £84,669
£84,594 -£147,428 £147,427.66
-£84,594 -£147,428 -£147,428
Cataract Procedures£414,392 £84,594 £0 -£147,428 £84,594 Cataract Procedures : £84,594
GOS18 Triage Referrals£133,825 -£2,049 £84,594 -£145,379 -£2,049 GOS18 Triage Referrals : -£2,049
Community Stable £339,079 -£46,753 £84,594 -£100,675 -£46,753 Community Stable : -£46,753
Clinical Priorities £416,105 -£21,639 £84,594 -£125,789 -£21,639 Clinical Priorities : -£21,639
Outpatient PIFU £1,693,103 £48,604 £35,990 -£147,428 48604.30264 Outpatient PIFU : £48,604
MSK £4,804,581 -£147,428 £84,594 £0 -147427.6611 MSK : -£147,428
Apr May Jun Jul Aug Sep Oct Nov Dec Jan Feb Mar YTD Full Year
15/16 Baseline inc Growth £2,623,908 £2,499,172 £2,771,785 £2,880,196 £2,439,396 £2,761,761 £2,958,000 £2,673,029 £2,516,841 £2,652,641 £2,694,437 £2,591,827 £7,894,866 £32,062,993
Planned QIPP Reduction £29,613 £28,023 £36,146 £53,385 £67,215 £99,028 £107,785 £146,093 £167,890 £231,940 £245,514 £287,368 £93,782 £1,500,000
16/17 Plan £2,594,295 £2,471,149 £2,735,639 £2,826,811 £2,372,181 £2,662,732 £2,850,215 £2,526,936 £2,348,951 £2,420,701 £2,448,922 £2,304,459 £7,801,083 £30,562,993
16/17 Actuals £2,557,580 £2,571,203 £2,587,631 £7,716,414
Difference -£36,715 £100,054 -£148,008 -£84,669 #
This section is included to indicate whether a scheme is delivering the activity reductions required
16/17 Targeted Reduction 6,991 YTD Targeted Reduction 331
YTD Reduction Achieved 0
YTD Variance on Target -331
418 -82 418
-418 -82 -418
Cataract Procedures 525 106 312 -418 106 Cataract Procedures : 106
GOS18 Triage Referrals 1,087 117 301 -418 117 GOS18 Triage Referrals : 117
Community Stable 4,390 -5 418 -413 -5 Community Stable : -5
Clinical Priorities 302 90 328 -418 90 Clinical Priorities : 90
Outpatient PIFU 19,221 -82 418 -336 -82 Outpatient PIFU : -82
MSK 5,881 418 0 -418 418 MSK : 418
Apr May Jun Jul Aug Sep Oct Nov Dec Jan Feb Mar YTD Full Year
15/16 Baseline inc Growth 10,604 9,867 11,266 11,544 10,006 11,450 11,558 11,252 10,354 10,530 10,911 10,937 31,737 130,279
Planned QIPP Reduction 95 115 121 304 517 677 807 817 845 877 899 917 331 6,991
16/17 Plan 10,509 9,752 11,145 11,240 9,488 10,773 10,750 10,436 9,509 9,654 10,012 10,020 31,406 123,288
16/17 Actuals 10,561 10,504 10,985 32,050
Difference 52 752 -160 644 #
Planned Care QIPP Performance - Month 3 (June) Reductions in Admissions and Outpatient Attendances
Activity
The below summary includes the combined details of all the individual schemes contributing to the QIPP performance in the planned care work stream.
The detail behind each individual scheme can be found on separate tabs within this report.
£0 £200,000 £400,000 £600,000 £800,000 £1,000,000 £1,200,000 £1,400,000 £1,600,000 £1,800,000
Savings to be… YTD Savings Below…YTD Savings Above Target YTD Target
End of Year Target -£200,000-£150,000-£100,000-£50,000£0£50,000£100,000
Cataract Procedures : £84,594
GOS18 Triage Referrals : -£2,049
Community Stable : -£46,753
Clinical Priorities : -£21,639
Outpatient PIFU : £48,604
MSK : -£147,428
0 1,000 2,000 3,000 4,000 5,000 6,000 7,000 8,000
Reduction to be Delivered YTD Reductions Below TargetYTD Reductions Above Target
YTD Reduction Target -500-400-300-200-1000100200300400500
Cataract Procedures : 106
GOS18 Triage Referrals : 117
Community Stable : -5
Clinical Priorities : 90
Outpatient PIFU : -82
MSK : 418
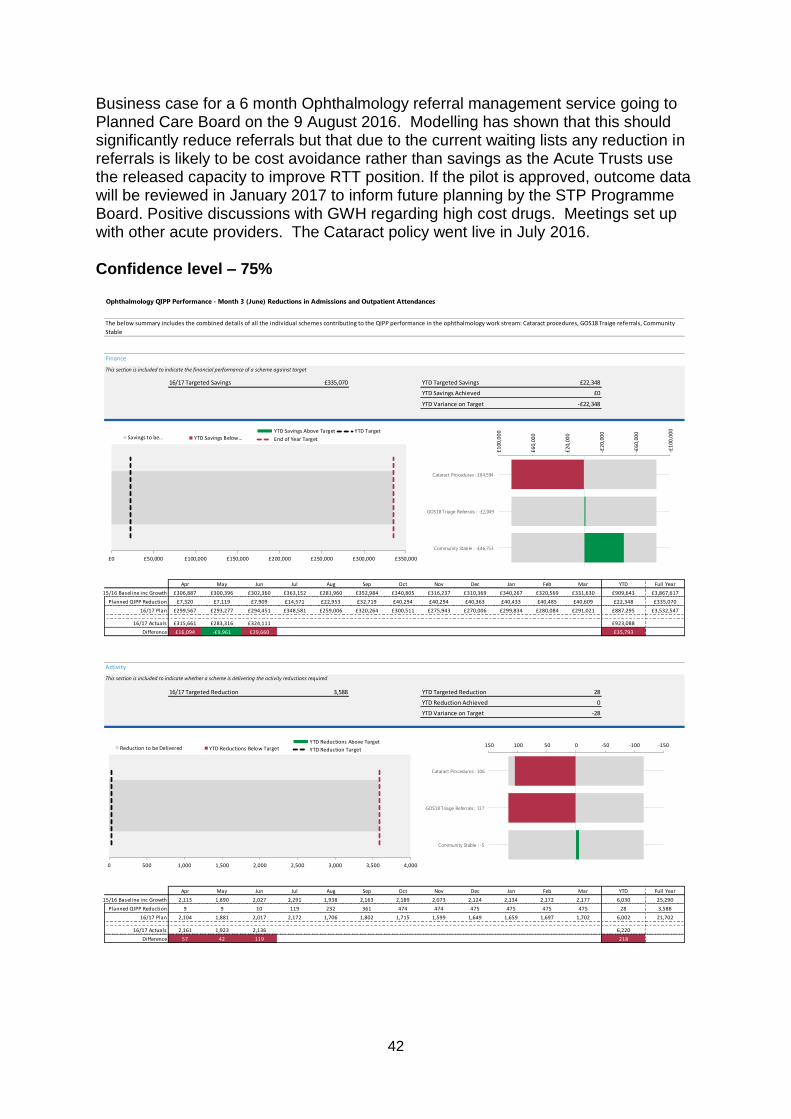
42
Business case for a 6 month Ophthalmology referral management service going to Planned Care Board on the 9 August 2016. Modelling has shown that this should significantly reduce referrals but that due to the current waiting lists any reduction in referrals is likely to be cost avoidance rather than savings as the Acute Trusts use the released capacity to improve RTT position. If the pilot is approved, outcome data will be reviewed in January 2017 to inform future planning by the STP Programme Board. Positive discussions with GWH regarding high cost drugs. Meetings set up with other acute providers. The Cataract policy went live in July 2016. Confidence level – 75%
Finance
This section is included to indicate the financial performance of a scheme against target
16/17 Targeted Savings £335,070 YTD Targeted Savings £22,348
YTD Savings Achieved £0
YTD Variance on Target -£22,348
-£35,793 -£13,445
£84,594 -£46,753 £84,594.46
-£84,594 -£46,753 -£84,594
Cataract Procedures£414,392 £84,594 £0 -£84,594 £84,594 Cataract Procedures : £84,594
GOS18 Triage Referrals£133,825 -£2,049 £84,594 -£82,545 -£2,049 GOS18 Triage Referrals : -£2,049
Community Stable £339,079 -£46,753 £84,594 -£37,842 -£46,753 Community Stable : -£46,753
Apr May Jun Jul Aug Sep Oct Nov Dec Jan Feb Mar YTD Full Year
15/16 Baseline inc Growth £306,887 £300,396 £302,360 £363,152 £281,960 £352,984 £340,805 £316,237 £310,369 £340,267 £320,569 £331,630 £909,643 £3,867,617
Planned QIPP Reduction £7,320 £7,119 £7,909 £14,571 £22,953 £32,719 £40,294 £40,294 £40,363 £40,433 £40,485 £40,609 £22,348 £335,070
16/17 Plan £299,567 £293,277 £294,451 £348,581 £259,006 £320,264 £300,511 £275,943 £270,006 £299,834 £280,084 £291,021 £887,295 £3,532,547
16/17 Actuals £315,661 £283,316 £324,111 £923,088
Difference £16,094 -£9,961 £29,660 £35,793 #
This section is included to indicate whether a scheme is delivering the activity reductions required
16/17 Targeted Reduction 3,588 YTD Targeted Reduction 28
YTD Reduction Achieved 0
YTD Variance on Target -28
-218
117 -5 117
-117 -5 -117
Cataract Procedures 525 106 11 -117 106 Cataract Procedures : 106
GOS18 Triage Referrals 1,087 117 0 -117 117 GOS18 Triage Referrals : 117
Community Stable 4,390 -5 117 -112 -5 Community Stable : -5
Apr May Jun Jul Aug Sep Oct Nov Dec Jan Feb Mar YTD Full Year
15/16 Baseline inc Growth 2,113 1,890 2,027 2,291 1,938 2,163 2,189 2,073 2,124 2,134 2,172 2,177 6,030 25,290
Planned QIPP Reduction 9 9 10 119 232 361 474 474 475 475 475 475 28 3,588
16/17 Plan 2,104 1,881 2,017 2,172 1,706 1,802 1,715 1,599 1,649 1,659 1,697 1,702 6,002 21,702
16/17 Actuals 2,161 1,923 2,136 6,220
Difference 57 42 119 218 #
Ophthalmology QIPP Performance - Month 3 (June) Reductions in Admissions and Outpatient Attendances
The below summary includes the combined details of all the individual schemes contributing to the QIPP performance in the ophthalmology work stream: Cataract procedures, GOS18 Traige referrals, Community
Stable
Activity
£0 £50,000 £100,000 £150,000 £200,000 £250,000 £300,000 £350,000
Savings to be… YTD Savings Below…YTD Savings Above Target YTD Target
End of Year Target
-£1
00,0
00
-£6
0,00
0
-£2
0,00
0
£2
0,00
0
£6
0,00
0
£1
00,0
00
Cataract Procedures : £84,594
GOS18 Triage Referrals : -£2,049
Community Stable : -£46,753
0 500 1,000 1,500 2,000 2,500 3,000 3,500 4,000
Reduction to be Delivered YTD Reductions Below TargetYTD Reductions Above Target
YTD Reduction Target-150-100-50050100150
Cataract Procedures : 106
GOS18 Triage Referrals : 117
Community Stable : -5
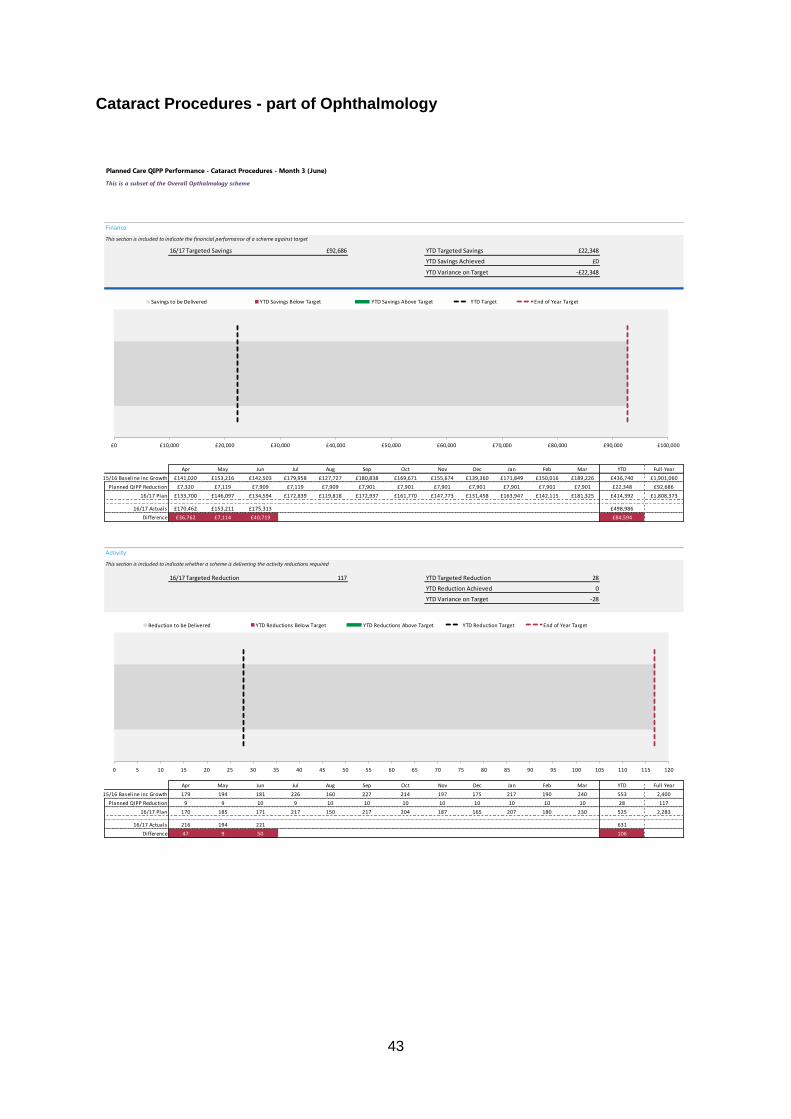
43
Cataract Procedures - part of Ophthalmology
This is a subset of the Overall Opthalmology scheme
Finance
This section is included to indicate the financial performance of a scheme against target
16/17 Targeted Savings £92,686 YTD Targeted Savings £22,348
YTD Savings Achieved £0
YTD Variance on Target -£22,348
-£84,594 -£62,246
Apr May Jun Jul Aug Sep Oct Nov Dec Jan Feb Mar YTD Full Year
15/16 Baseline inc Growth £141,020 £153,216 £142,503 £179,958 £127,727 £180,838 £169,671 £155,674 £139,360 £171,849 £150,016 £189,226 £436,740 £1,901,060
Planned QIPP Reduction £7,320 £7,119 £7,909 £7,119 £7,909 £7,901 £7,901 £7,901 £7,901 £7,901 £7,901 £7,901 £22,348 £92,686
16/17 Plan £133,700 £146,097 £134,594 £172,839 £119,818 £172,937 £161,770 £147,773 £131,458 £163,947 £142,115 £181,325 £414,392 £1,808,373
16/17 Actuals £170,462 £153,211 £175,313 £498,986
Difference £36,762 £7,114 £40,719 £84,594 #
This section is included to indicate whether a scheme is delivering the activity reductions required
16/17 Targeted Reduction 117 YTD Targeted Reduction 28
YTD Reduction Achieved 0
YTD Variance on Target -28
-106
Apr May Jun Jul Aug Sep Oct Nov Dec Jan Feb Mar YTD Full Year
15/16 Baseline inc Growth 179 194 181 226 160 227 214 197 175 217 190 240 553 2,400
Planned QIPP Reduction 9 9 10 9 10 10 10 10 10 10 10 10 28 117
16/17 Plan 170 185 171 217 150 217 204 187 165 207 180 230 525 2,283
16/17 Actuals 216 194 221 631
Difference 47 9 50 106 #
Planned Care QIPP Performance - Cataract Procedures - Month 3 (June)
Activity
£0 £10,000 £20,000 £30,000 £40,000 £50,000 £60,000 £70,000 £80,000 £90,000 £100,000
Savings to be Delivered YTD Savings Below Target YTD Savings Above Target YTD Target End of Year Target
0 5 10 15 20 25 30 35 40 45 50 55 60 65 70 75 80 85 90 95 100 105 110 115 120
Reduction to be Delivered YTD Reductions Below Target YTD Reductions Above Target YTD Reduction Target End of Year Target
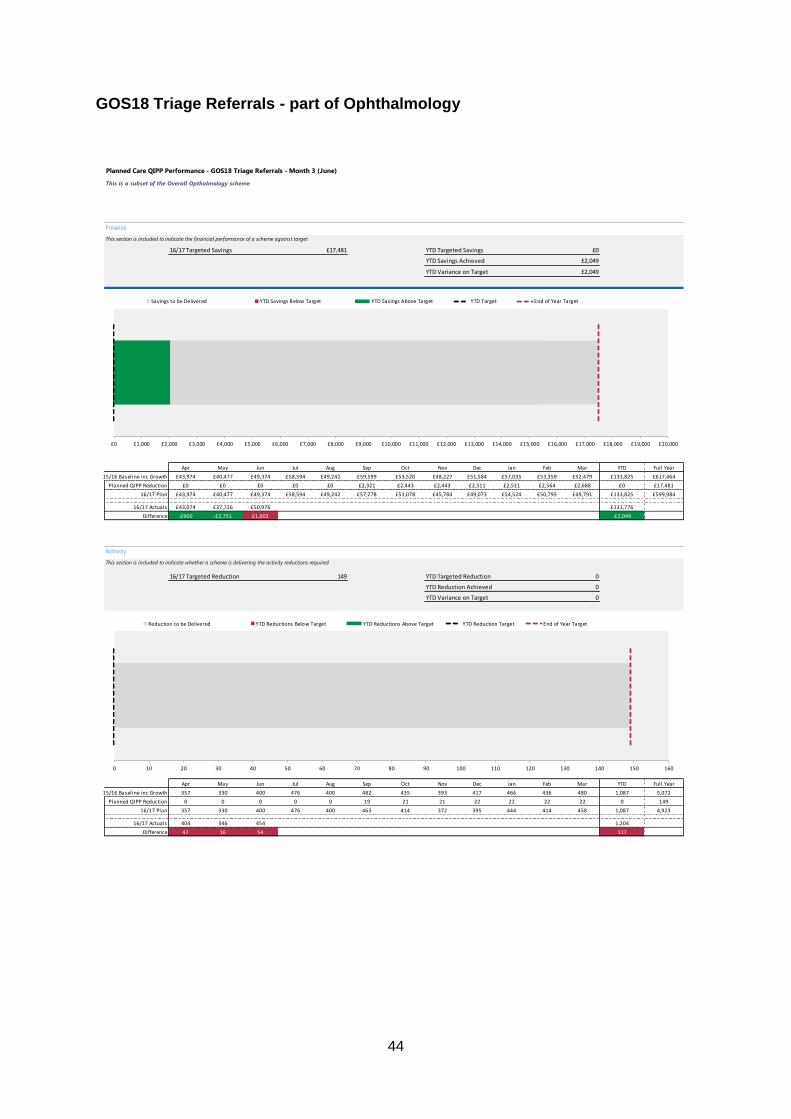
44
GOS18 Triage Referrals - part of Ophthalmology
This is a subset of the Overall Opthalmology scheme
Finance
This section is included to indicate the financial performance of a scheme against target
16/17 Targeted Savings £17,481 YTD Targeted Savings £0
YTD Savings Achieved £2,049
YTD Variance on Target £2,049
£2,049 £2,049
Apr May Jun Jul Aug Sep Oct Nov Dec Jan Feb Mar YTD Full Year
15/16 Baseline inc Growth £43,974 £40,477 £49,374 £58,594 £49,242 £59,599 £53,520 £48,227 £51,584 £57,035 £53,359 £52,479 £133,825 £617,464
Planned QIPP Reduction £0 £0 £0 £0 £0 £2,321 £2,443 £2,443 £2,511 £2,511 £2,564 £2,688 £0 £17,481
16/17 Plan £43,974 £40,477 £49,374 £58,594 £49,242 £57,278 £51,078 £45,784 £49,073 £54,524 £50,795 £49,791 £133,825 £599,984
16/17 Actuals £43,074 £37,726 £50,976 £131,776
Difference -£900 -£2,751 £1,602 -£2,049 #
This section is included to indicate whether a scheme is delivering the activity reductions required
16/17 Targeted Reduction 149 YTD Targeted Reduction 0
YTD Reduction Achieved 0
YTD Variance on Target 0
-117
Apr May Jun Jul Aug Sep Oct Nov Dec Jan Feb Mar YTD Full Year
15/16 Baseline inc Growth 357 330 400 476 400 482 435 393 417 466 436 480 1,087 5,072
Planned QIPP Reduction 0 0 0 0 0 19 21 21 22 22 22 22 0 149
16/17 Plan 357 330 400 476 400 463 414 372 395 444 414 458 1,087 4,923
16/17 Actuals 404 346 454 1,204
Difference 47 16 54 117 #
Activity
Planned Care QIPP Performance - GOS18 Triage Referrals - Month 3 (June)
£0 £1,000 £2,000 £3,000 £4,000 £5,000 £6,000 £7,000 £8,000 £9,000 £10,000 £11,000 £12,000 £13,000 £14,000 £15,000 £16,000 £17,000 £18,000 £19,000 £20,000
Savings to be Delivered YTD Savings Below Target YTD Savings Above Target YTD Target End of Year Target
0 10 20 30 40 50 60 70 80 90 100 110 120 130 140 150 160
Reduction to be Delivered YTD Reductions Below Target YTD Reductions Above Target YTD Reduction Target End of Year Target

45
Community Stable Management - part of Ophthalmology
This is a subset of the Overall Opthalmology scheme
Finance
This section is included to indicate the financial performance of a scheme against target
16/17 Targeted Savings £224,903 YTD Targeted Savings £0
YTD Savings Achieved £46,753
YTD Variance on Target £46,753
£46,753 £46,753
Apr May Jun Jul Aug Sep Oct Nov Dec Jan Feb Mar YTD Full Year
15/16 Baseline £121,893 £106,703 £110,482 £124,600 £104,991 £112,547 £117,613 £112,337 £119,425 £111,383 £117,194 £89,925 £339,079 £1,349,093
Planned QIPP Reduction £0 £0 £0 £7,452 £15,044 £22,497 £29,950 £29,950 £29,950 £30,020 £30,020 £30,020 £0 £224,903
16/17 Plan £121,893 £106,703 £110,482 £117,148 £89,946 £90,050 £87,663 £82,387 £89,475 £81,363 £87,174 £59,905 £339,079 £1,124,190
16/17 Actuals £102,125 £92,379 £97,822 £292,326
Difference -£19,768 -£14,324 -£12,660 -£46,753 #
This section is included to indicate whether a scheme is delivering the activity reductions required
16/17 Targeted Reduction 3,322 YTD Targeted Reduction 0
YTD Reduction Achieved 5
YTD Variance on Target 5
5
Apr May Jun Jul Aug Sep Oct Nov Dec Jan Feb Mar YTD Full Year
15/16 Baseline 1,578 1,366 1,446 1,588 1,378 1,454 1,540 1,483 1,531 1,450 1,546 1,457 4,390 17,817
Planned QIPP Reduction 0 0 0 110 222 332 443 443 443 443 443 443 0 3,322
16/17 Plan 1,578 1,366 1,446 1,478 1,156 1,122 1,097 1,040 1,088 1,007 1,103 1,014 4,390 14,495
16/17 Actuals 1,541 1,383 1,461 4,385
Difference -37 17 15 -5 #
Planned Care QIPP Performance - Community Stable Management - Month 3 (June)
Activity
£0 £25,000 £50,000 £75,000 £100,000 £125,000 £150,000 £175,000 £200,000 £225,000 £250,000
Savings to be Delivered YTD Savings Below Target YTD Savings Above Target YTD Target End of Year Target
0 250 500 750 1,000 1,250 1,500 1,750 2,000 2,250 2,500 2,750 3,000 3,250 3,500
Reduction to be Delivered YTD Reductions Below Target YTD Reductions Above Target YTD Reduction Target End of Year Target

46
Clinical Priorities First audit at RUH completed highlighting some procedures completed without PA
being gained. These are to be reconciled against the challenges. Plans to visit BMI
and Circle Bath. Bunion policy to be developed to include the procedures identified
during the challenge process relating to bunions that are currently excluded from the
policy.
Confidence factor – 100%
After the Quarter 1 close down of reconcilation challenges, the challenge credit will be adjusted against the actuals which will increase any savings achieved.
Finance
This section is included to indicate the financial performance of a scheme against target
16/17 Targeted Savings £258,178 YTD Targeted Savings £56,963
YTD Savings Achieved £78,602
YTD Variance on Target £21,639
£21,639 £78,602
Apr May Jun Jul Aug Sep Oct Nov Dec Jan Feb Mar YTD Full Year
15/16 Baseline inc Growth £165,755 £139,089 £168,224 £178,336 £109,859 £148,960 £148,551 £170,781 £133,776 £121,942 £121,078 £125,040 £473,068 £1,731,391
Planned QIPP Reduction £20,362 £17,044 £19,557 £17,461 £20,754 £24,434 £25,187 £24,914 £24,884 £23,924 £19,574 £20,082 £56,963 £258,178
16/17 Plan £145,393 £122,045 £148,667 £160,875 £89,105 £124,526 £123,364 £145,867 £108,892 £98,018 £101,504 £104,958 £416,105 £1,473,213
16/17 Actuals £121,700 £144,441 £128,325 £394,466
Difference -£23,693 £22,396 -£20,342 -£21,639 #
This section is included to indicate whether a scheme is delivering the activity reductions required
16/17 Targeted Reduction 774 YTD Targeted Reduction 186
YTD Reduction Achieved 96
YTD Variance on Target -90
-90
Apr May Jun Jul Aug Sep Oct Nov Dec Jan Feb Mar YTD Full Year
15/16 Baseline inc Growth 164 144 180 167 128 146 151 162 134 114 104 124 488 1,718
Planned QIPP Reduction 63 60 64 61 65 64 66 65 64 66 68 68 186 774
16/17 Plan 101 84 116 106 63 82 85 97 70 48 36 56 302 944
16/17 Actuals 123 140 129 392
Difference 22 56 13 90 #
Activity
Planned Care QIPP Performance - Clinical Policies - Month 3 (June)
£0 £25,000 £50,000 £75,000 £100,000 £125,000 £150,000 £175,000 £200,000 £225,000 £250,000 £275,000 £300,000
Savings to be Delivered YTD Savings Below Target YTD Savings Above Target YTD Target End of Year Target
0 50 100 150 200 250 300 350 400 450 500 550 600 650 700 750 800
Reduction to be Delivered YTD Reductions Below Target YTD Reductions Above Target YTD Reduction Target End of Year Target
47
Outpatient PIFU– Follow Ups The RUH commenced PIFU in Orthopaedics and Gynaecology in July. SFT commenced PIFU in Gynaecology from July as well as urology which was not due to commence until September. GWH commenced PIFU in Orthopaedics in July. PIFU implementation timetables have been signed up by all of the independents as part of the contract. In terms of delivery, there remains opportunity to recover the position as the majority of specialities implement PIFU from June/July onwards. Confidence level – 70%
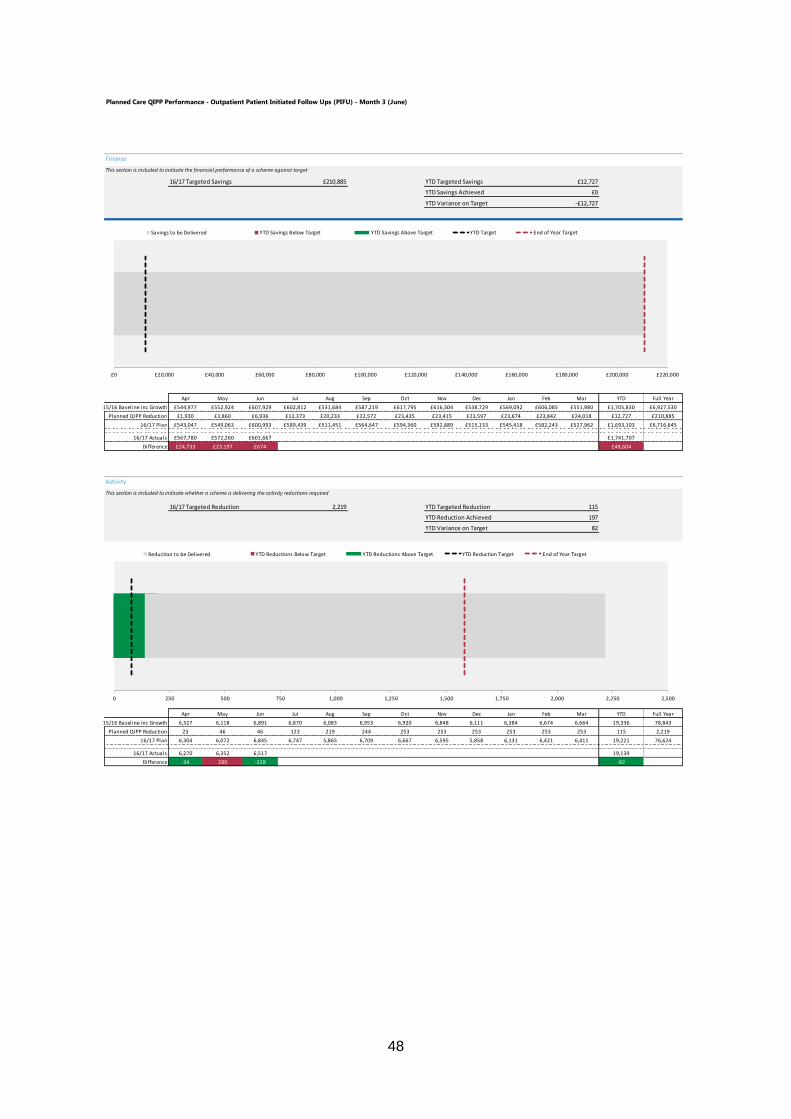
48
Finance
This section is included to indicate the financial performance of a scheme against target
16/17 Targeted Savings £210,885 YTD Targeted Savings £12,727
YTD Savings Achieved £0
YTD Variance on Target -£12,727
-£48,604 -£35,877
Apr May Jun Jul Aug Sep Oct Nov Dec Jan Feb Mar YTD Full Year
15/16 Baseline inc Growth £544,977 £552,924 £607,929 £602,812 £531,684 £587,219 £617,795 £616,304 £538,729 £569,092 £606,085 £551,980 £1,705,830 £6,927,530
Planned QIPP Reduction £1,930 £3,860 £6,936 £13,373 £20,233 £22,572 £23,435 £23,415 £23,597 £23,674 £23,842 £24,018 £12,727 £210,885
16/17 Plan £543,047 £549,063 £600,993 £589,439 £511,451 £564,647 £594,360 £592,889 £515,133 £545,418 £582,243 £527,962 £1,693,103 £6,716,645
16/17 Actuals £567,780 £572,260 £601,667 £1,741,707
Difference £24,733 £23,197 £674 £48,604 #
This section is included to indicate whether a scheme is delivering the activity reductions required
16/17 Targeted Reduction 2,219 YTD Targeted Reduction 115
YTD Reduction Achieved 197
YTD Variance on Target 82
82
Apr May Jun Jul Aug Sep Oct Nov Dec Jan Feb Mar YTD Full Year
15/16 Baseline inc Growth 6,327 6,118 6,891 6,870 6,083 6,953 6,920 6,848 6,111 6,384 6,674 6,664 19,336 78,843
Planned QIPP Reduction 23 46 46 123 219 244 253 253 253 253 253 253 115 2,219
16/17 Plan 6,304 6,072 6,845 6,747 5,865 6,709 6,667 6,595 5,858 6,131 6,421 6,411 19,221 76,624
16/17 Actuals 6,270 6,352 6,517 19,139
Difference -34 280 -328 -82 #
Activity
Planned Care QIPP Performance - Outpatient Patient Initiated Follow Ups (PIFU) - Month 3 (June)
£0 £20,000 £40,000 £60,000 £80,000 £100,000 £120,000 £140,000 £160,000 £180,000 £200,000 £220,000
Savings to be Delivered YTD Savings Below Target YTD Savings Above Target YTD Target End of Year Target
0 250 500 750 1,000 1,250 1,500 1,750 2,000 2,250 2,500
Reduction to be Delivered YTD Reductions Below Target YTD Reductions Above Target YTD Reduction Target End of Year Target

49
MSK Following the meeting held 13 July 2016 with WH&C, detailed resource modelling
has been carried out. However, further analysis is needed by SCWCSU in order to
build a robust business case and evidenced ROI. Update paper to Planned Care
Board 9 August 2016. Risk & confidence level remains until a decision has been
taken and plan fully operative
POLICIES - TKR/THR & Knee Arthroscopy policies are now operative.
Communication to providers and education has started.
CHRONIC PAIN SERVICES: Project approach continuing with work streams was
agreed. Draft proforma developed by GWH for agreement of GPs.
Confidence level – 10%
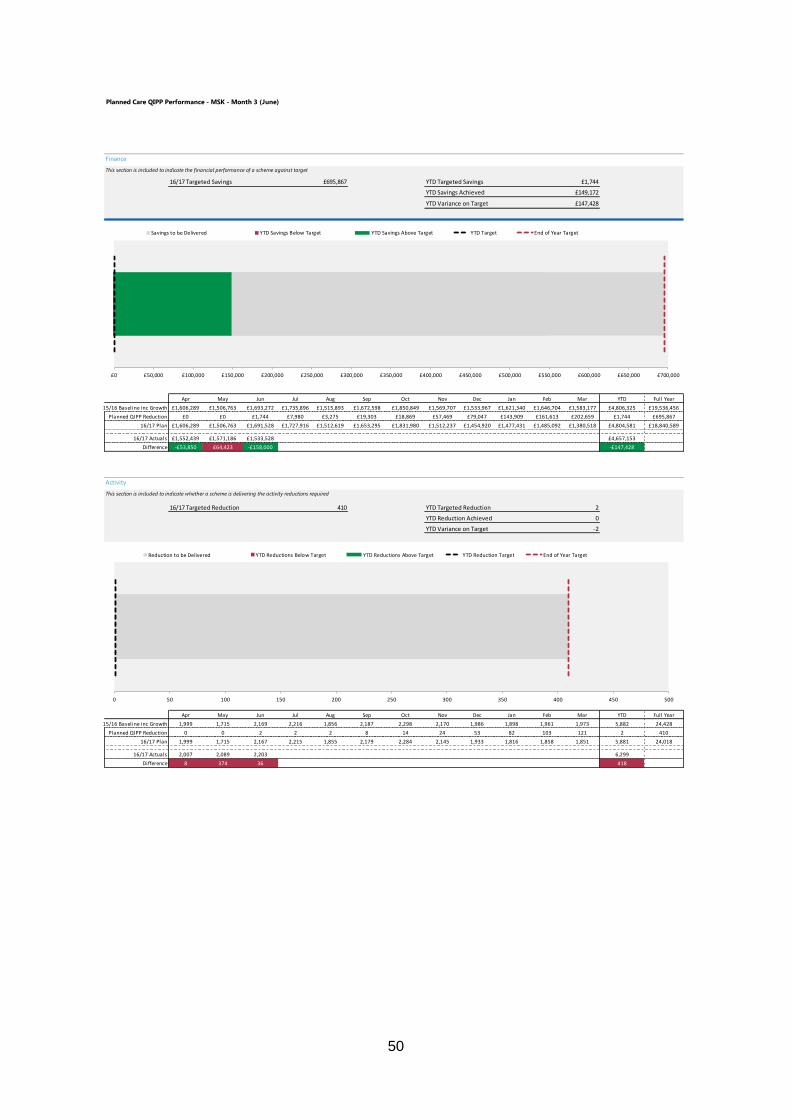
50
Finance
This section is included to indicate the financial performance of a scheme against target
16/17 Targeted Savings £695,867 YTD Targeted Savings £1,744
YTD Savings Achieved £149,172
YTD Variance on Target £147,428
£147,428 £149,172
Apr May Jun Jul Aug Sep Oct Nov Dec Jan Feb Mar YTD Full Year
15/16 Baseline inc Growth £1,606,289 £1,506,763 £1,693,272 £1,735,896 £1,515,893 £1,672,598 £1,850,849 £1,569,707 £1,533,967 £1,621,340 £1,646,704 £1,583,177 £4,806,325 £19,536,456
Planned QIPP Reduction £0 £0 £1,744 £7,980 £3,275 £19,303 £18,869 £57,469 £79,047 £143,909 £161,613 £202,659 £1,744 £695,867
16/17 Plan £1,606,289 £1,506,763 £1,691,528 £1,727,916 £1,512,619 £1,653,295 £1,831,980 £1,512,237 £1,454,920 £1,477,431 £1,485,092 £1,380,518 £4,804,581 £18,840,589
16/17 Actuals £1,552,439 £1,571,186 £1,533,528 £4,657,153
Difference -£53,850 £64,423 -£158,000 -£147,428 #
This section is included to indicate whether a scheme is delivering the activity reductions required
16/17 Targeted Reduction 410 YTD Targeted Reduction 2
YTD Reduction Achieved 0
YTD Variance on Target -2
-418
Apr May Jun Jul Aug Sep Oct Nov Dec Jan Feb Mar YTD Full Year
15/16 Baseline inc Growth 1,999 1,715 2,169 2,216 1,856 2,187 2,298 2,170 1,986 1,898 1,961 1,973 5,882 24,428
Planned QIPP Reduction 0 0 2 2 2 8 14 24 53 82 103 121 2 410
16/17 Plan 1,999 1,715 2,167 2,215 1,855 2,179 2,284 2,145 1,933 1,816 1,858 1,851 5,881 24,018
16/17 Actuals 2,007 2,089 2,203 6,299
Difference 8 374 36 418 #
Activity
Planned Care QIPP Performance - MSK - Month 3 (June)
£0 £50,000 £100,000 £150,000 £200,000 £250,000 £300,000 £350,000 £400,000 £450,000 £500,000 £550,000 £600,000 £650,000 £700,000
Savings to be Delivered YTD Savings Below Target YTD Savings Above Target YTD Target End of Year Target
0 50 100 150 200 250 300 350 400 450 500
Reduction to be Delivered YTD Reductions Below Target YTD Reductions Above Target YTD Reduction Target End of Year Target
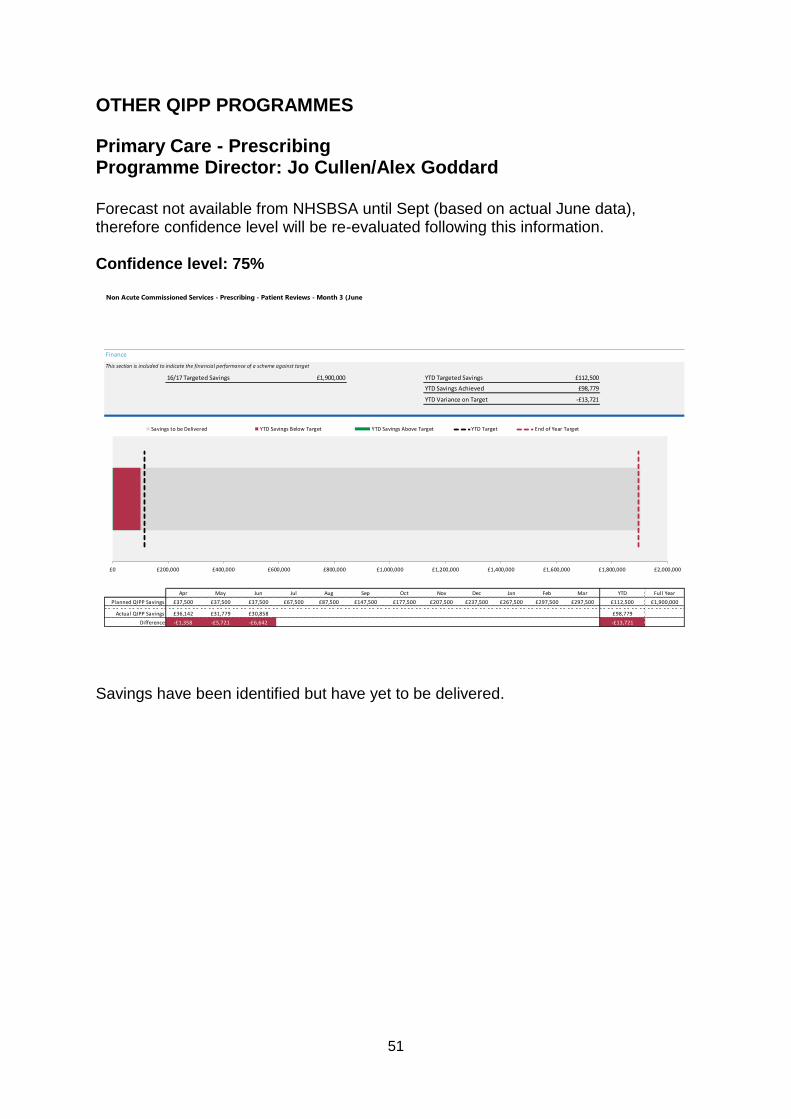
51
OTHER QIPP PROGRAMMES
Primary Care - Prescribing Programme Director: Jo Cullen/Alex Goddard Forecast not available from NHSBSA until Sept (based on actual June data), therefore confidence level will be re-evaluated following this information. Confidence level: 75%
Savings have been identified but have yet to be delivered.
Finance
This section is included to indicate the financial performance of a scheme against target
16/17 Targeted Savings £1,900,000 YTD Targeted Savings £112,500
YTD Savings Achieved £98,779
YTD Variance on Target -£13,721
-£13,721
Apr May Jun Jul Aug Sep Oct Nov Dec Jan Feb Mar YTD Full Year
Planned QIPP Savings £37,500 £37,500 £37,500 £67,500 £87,500 £147,500 £177,500 £207,500 £237,500 £267,500 £297,500 £297,500 £112,500 £1,900,000
Actual QIPP Savings £36,142 £31,779 £30,858 £98,779
Difference -£1,358 -£5,721 -£6,642 -£13,721 #
Non Acute Commissioned Services - Prescribing - Patient Reviews - Month 3 (June
£0 £200,000 £400,000 £600,000 £800,000 £1,000,000 £1,200,000 £1,400,000 £1,600,000 £1,800,000 £2,000,000
Savings to be Delivered YTD Savings Below Target YTD Savings Above Target YTD Target End of Year Target

52
Finance
This section is included to indicate the financial performance of a scheme against target
16/17 Targeted Savings £500,000 YTD Targeted Savings £99,940
YTD Savings Achieved £99,940
YTD Variance on Target £0 £0
Non Acute Commissioned Services - Continued Health Care - Patient Reviews - Month 3 (June
CHC Fast track patients and LD patients Programme Director: Dina McAlpine CHC will operate within budget and continue to review patients as per statutory
requirements. Range of projects also planned to support achievement of QIPP.
Confidence level: TBC%

53
UPDATE ON OTHER PROGRAMMES FROM 15/16
Below is commentary from Programme Directors about selected other programme areas. The following are included for information. There are no QIPP savings identified for delivery through these programmes currently.
Diabetes programme Programme Director: Ted Wilson The Diabetes Programme board has reconvened and met on 28 July 2016. Key work streams were approved and clinical leads identified to support delivery of each work stream. Key achievements in month include: • Scope of programme agreed • Key work streams finalised and include: - Implementation of virtual clinics in North, West and East Wiltshire - Implementation of a diabetes service provision in East Wiltshire - Plan developed to support the reduction in variation of care using the National
Diabetes Audit results - Development of a structured education toolkit - Prescribing - Delivery of the Diabetes summit actions • Primary Care have been encouraged to submit data to the National Diabetes Audit • Contract Variation for the Diabetes consultant to support the virtual clinics in RUH
completed • Sub group identified to develop a structured education tool kit for patients • Draft Diabetes service model in East Wiltshire has been produced Key Issues in month - • Applicants for the Diabetes Nurse post to support the virtual clinics in West and
North Wiltshire are limited • Lack of applicants for the Diabetes Nurse post will delay the implementation of the
virtual clinic in West and North Wiltshire • Model of care in East Wiltshire has not yet been finalised • Any delay in the agreement of the model for East Wiltshire will delay implementation of service • WHC are currently reviewing other opportunities and ways to encourage applicants
to apply for the role • WHC are working in collaboration with Primary Care and the CCG to agree the service model in East Wiltshire. Decision expected by the end of August • WHC service lead is currently responsible for reviewing options of recruitment and a proposed service model for East Wiltshire and is providing regular updates on recruitment to the CCG. Confidence levels: There is 100% confidence in the ability of the Diabetes Programme Board to deliver the early adopter scheme
54
End of Life (EoL) Care Programme Programme Director: Ted Wilson 2016/17 Work streams 2016/17 Work streams, objectives and outcome measures approved by the EoL Programme Board: Education/training, Public Engagement and Refresh Strategy, Compassionate Communities/ Wiltshire Dying Well Community Charter, Workforce, Care at Home, Carers, BCF Integrated Commissioners, Dementia in End of Life Care Progress of work streams subsumed from 2015/16: Education/Training • Wiltshire CCG Competencies mapping tool template approved for 6 month pilot with view to use as a future framework and to monitor EoL care. • EoL pages on Wilts CCG updated for specific target audiences utilizing e-learning modules, PowerPoint presentations and provider details that offer training. • ACP approved for 6 month pilot • TEP, Advance Care Planning and Dementia training, for GP’s, Community Teams and Care Homes confirmed roll out in autumn 2016 • TEP evaluation commenced to support further implementation • Amended TEP patient leaflet in development Care at Home • Bespoke national modelling tool to inform the business case for a new model of care for palliative care at home being utilised. • Working group to meet to develop the commissioning strategy for palliative care at home and the business case Dementia • EoL section of the Dementia Strategy Action Plan is now augmented. • Programme Board agreed that individual Dementia and EoL work streams must be mindful of gaps and synergies. • Dementia specific training being developed through Dementia Delivery Board • Cross group working across respective Board to develop strategy to support information on Dementia and EoL New work streams: * Public Engagement and Refresh Strategy • Engagement activities, led by HealthWatch Wiltshire, confirmed to support development of strategy • Refreshed Strategy in development, to go to EoL Board in September for initial comments Wiltshire Dying Well Community Charter: • Initial working group established • Potential 'community champions' identified and contacted to form wider working group

55
• Scope of work stream / Charter outlined to wider working group with meeting in September for approval to progress. Workforce: • Working group established • Mapping exercise to establish EoL staffing gaps in development Carers: • Working group established • Targeted web pages for information and advice on EoL and bereavement in development BCF Integrated Commissioners • Enhanced Discharge Service pilot rolled out at RUH, supported by Dorothy House • 72hr pathway pilot rolled out at Salisbury Hospice • Ongoing cross fertilisation of work/commissioning pilot EoL services with BCF Director and CCG EoL Lead. Confidence factor of Programme remains at N/A%
Local Digital Roadmap Programme Director: Steve Perkins In March 2016, the process began to allow local health and care systems to produce Local Digital Roadmaps (LDRs) setting out how they plan to achieve the ambition of paper-free at the point of care by 2020. LDRs must be closely linked to, and support the aims of local Sustainability and Transformation Plans (STPs). Current LDR progress:
Wiltshire draft LDR submitted on time for 30 June 2016 deadline to NHS England for review
Feedback received on 3 August 2016 from NHS England
Feedback currently being reviewed and an action plan is being produced to incorporate the required changes and derive an LDR delivery plan, which will include a refresh of Wiltshire CCG’s IM&T strategy in line with both the LDR and STP plans.
A summary of the three STP footprint LDRs (Wiltshire, BaNES and Swindon) has been produced and will be reviewed at the next STP IM&T sub-group meeting (12 August) to identify areas of commonality and allow the STP stakeholders to work collaboratively to achieve them.