Integrated Performance Information (IPI) Project Mike Switzer Workforce Florida, Inc....
22
Integrated Performance Integrated Performance Information (IPI) Information (IPI) Project Project Mike Switzer Workforce Florida, Inc. [email protected] Jay Pfeiffer Florida Department of Education [email protected]
-
Upload
erica-dixon -
Category
Documents
-
view
213 -
download
0
Transcript of Integrated Performance Information (IPI) Project Mike Switzer Workforce Florida, Inc....
Integrated Performance Integrated Performance Information (IPI) ProjectInformation (IPI) Project
Mike SwitzerWorkforce Florida, Inc.
Jay Pfeiffer
Florida Department of Education

IPI ProjectIPI Project
Supported by the Employment and Training Administration of the U.S. Department of Labor
Florida, Michigan, Montana, Oregon, Texas, Washington
National Governors Association Center for Best Practices; Ray Marshall Center, University of Texas
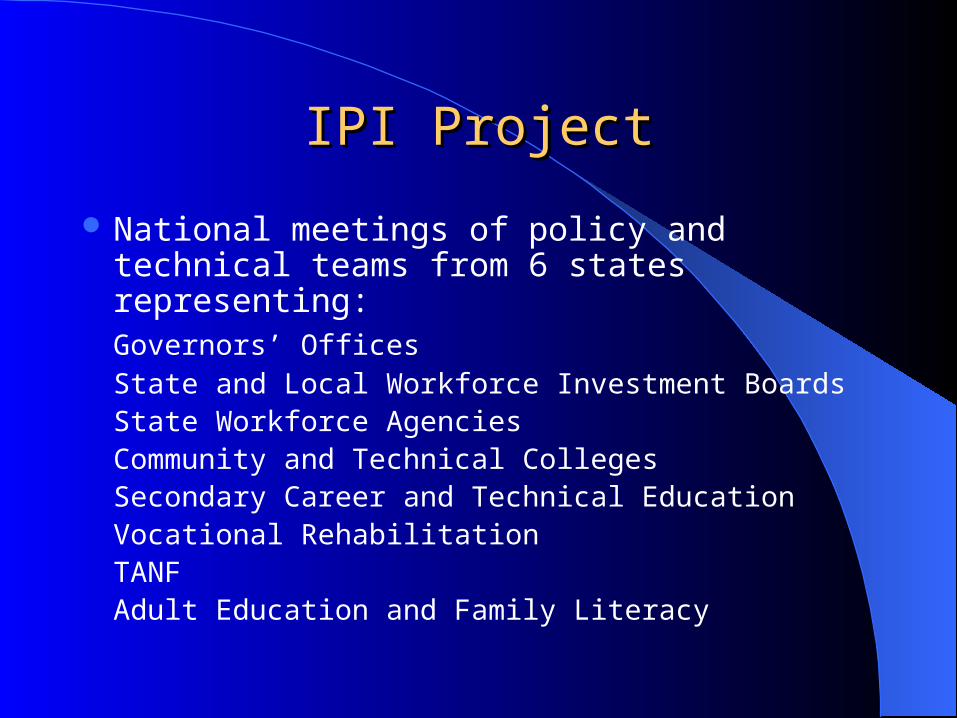
IPI ProjectIPI Project
National meetings of policy and technical teams from 6 states representing:
Governors’ OfficesState and Local Workforce Investment BoardsState Workforce AgenciesCommunity and Technical CollegesSecondary Career and Technical EducationVocational RehabilitationTANFAdult Education and Family Literacy
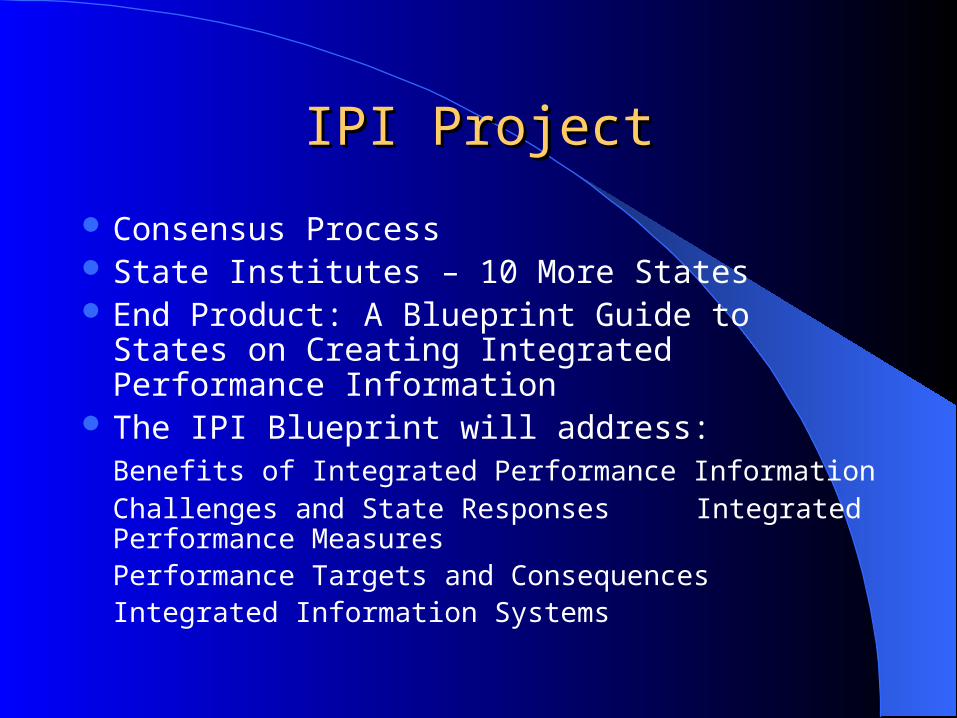
IPI ProjectIPI Project
Consensus Process State Institutes – 10 More States End Product: A Blueprint Guide to States on
Creating Integrated Performance Information The IPI Blueprint will address:
Benefits of Integrated Performance InformationChallenges and State Responses
Integrated Performance MeasuresPerformance Targets and ConsequencesIntegrated Information Systems

The QuestionThe Question
What are the best performance measures for workforce development if the same measures are applied horizontally and vertically within the system, including programs that are funded mostly by the states and programs that are funded mostly by Congress?
Policy not Management Level Measures
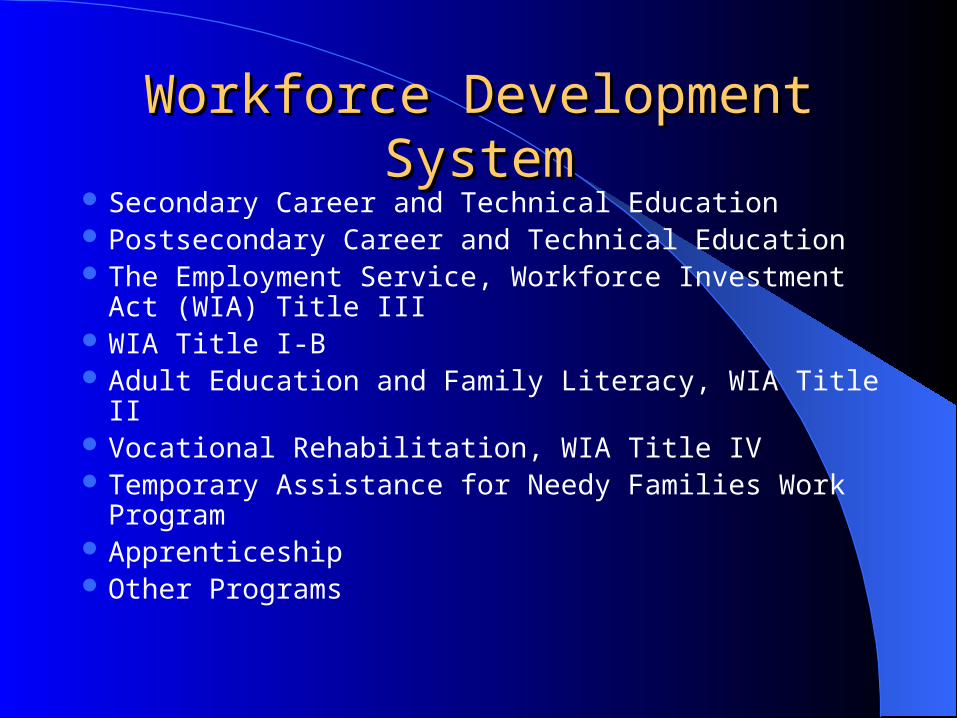
Workforce Development SystemWorkforce Development System Secondary Career and Technical Education Postsecondary Career and Technical Education The Employment Service, Workforce Investment Act
(WIA) Title III WIA Title I-B Adult Education and Family Literacy, WIA Title II Vocational Rehabilitation, WIA Title IV Temporary Assistance for Needy Families Work Program Apprenticeship Other Programs

Benefits of Integrated Benefits of Integrated Performance InformationPerformance Information
Accountability to Policy MakersStrategic Planning and CoordinationEfficiencyResearch

Relation to OMB Common Relation to OMB Common MeasuresMeasures
Builds consistency across state as well as federal workforce programs
States play a leading roleProcess includes cross-section of major
programs
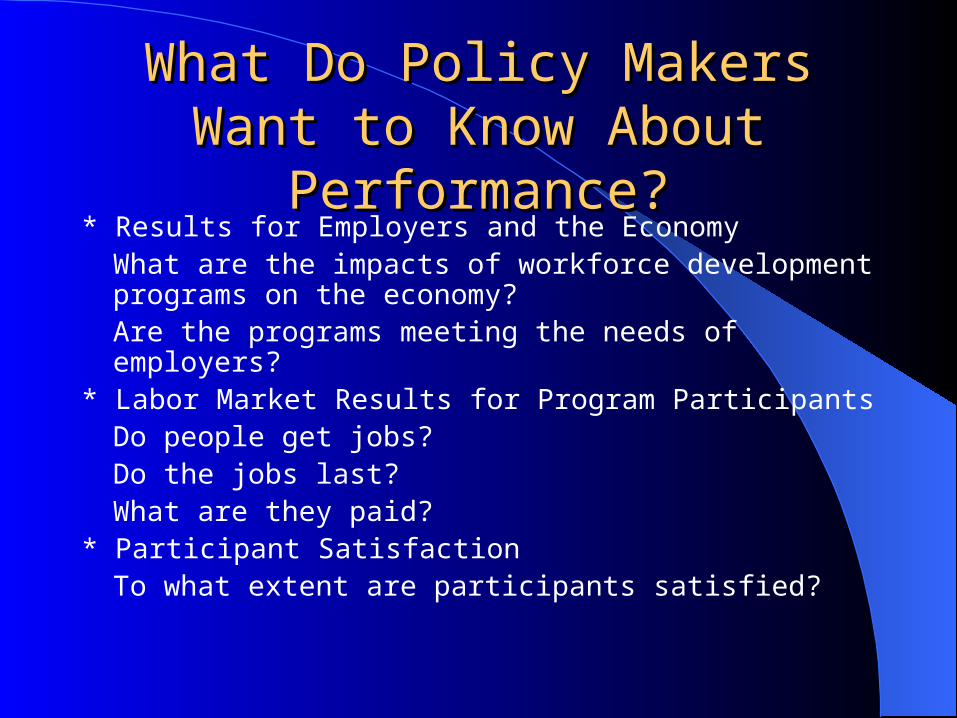
What Do Policy Makers Want to What Do Policy Makers Want to Know About Performance?Know About Performance?
* Results for Employers and the EconomyWhat are the impacts of workforce development programs on the economy?Are the programs meeting the needs of employers?
* Labor Market Results for Program ParticipantsDo people get jobs?Do the jobs last?What are they paid?
* Participant SatisfactionTo what extent are participants satisfied?
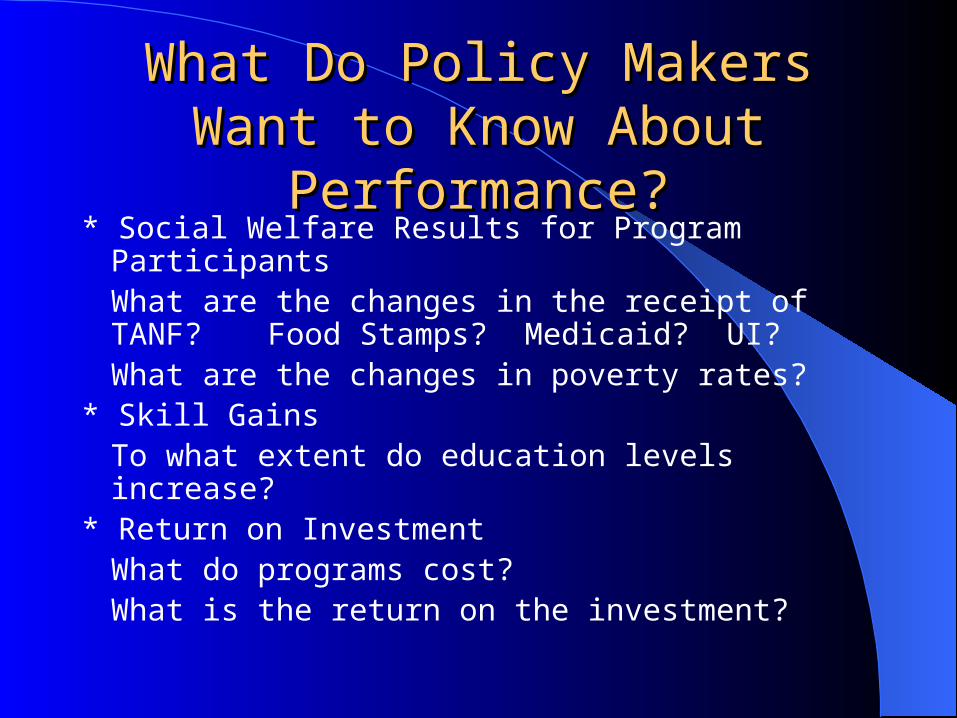
What Do Policy Makers Want to What Do Policy Makers Want to Know About Performance?Know About Performance?
* Social Welfare Results for Program ParticipantsWhat are the changes in the receipt of
TANF? Food Stamps? Medicaid? UI?What are the changes in poverty rates?
* Skill GainsTo what extent do education levels increase?
* Return on InvestmentWhat do programs cost?What is the return on the investment?
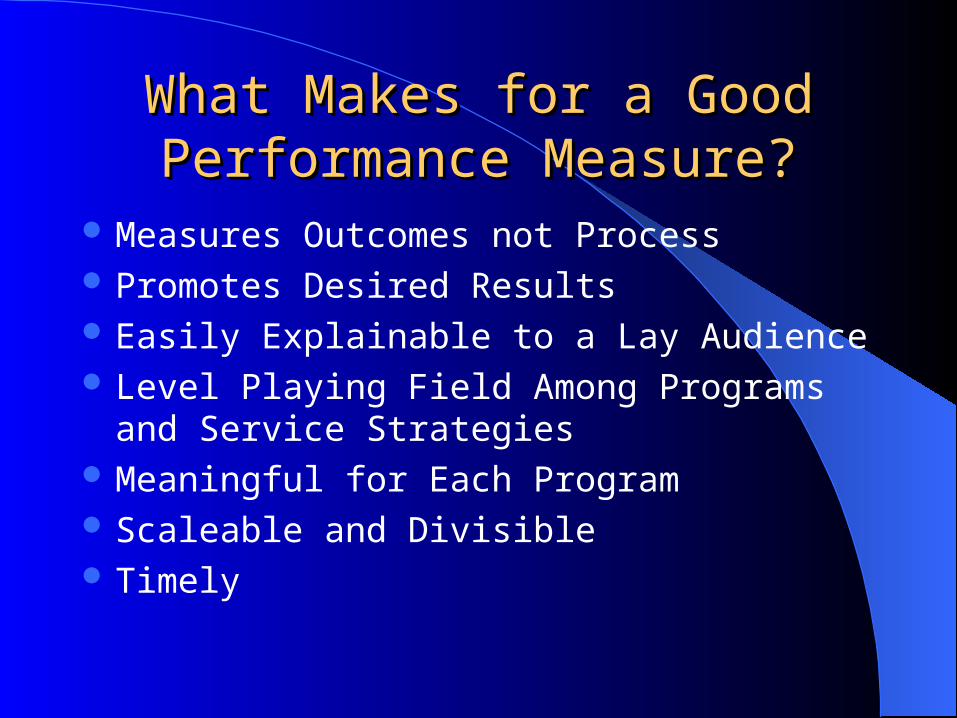
What Makes for a Good What Makes for a Good Performance Measure?Performance Measure?
Measures Outcomes not Process Promotes Desired Results Easily Explainable to a Lay Audience Level Playing Field Among Programs and Service
Strategies Meaningful for Each Program Scaleable and Divisible Timely
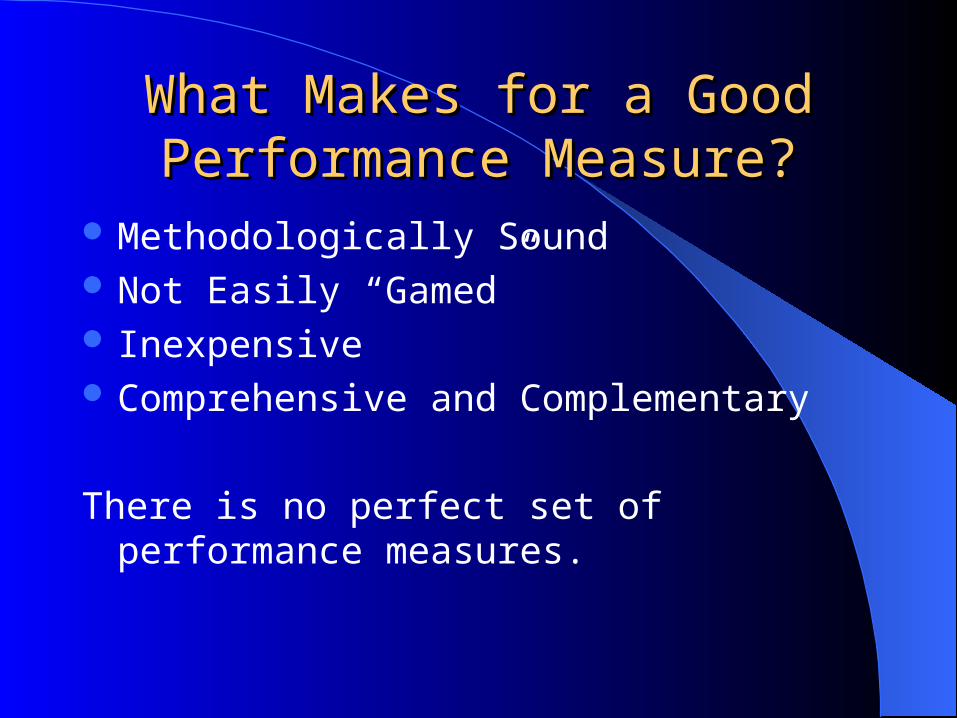
What Makes for a Good What Makes for a Good Performance Measure?Performance Measure?
Methodologically Sound Not Easily “Gamed” Inexpensive Comprehensive and Complementary
There is no perfect set of performance measures.
IPI Draft Performance MeasuresIPI Draft Performance MeasuresLabor Market Results for Program Labor Market Results for Program
ParticipantsParticipants
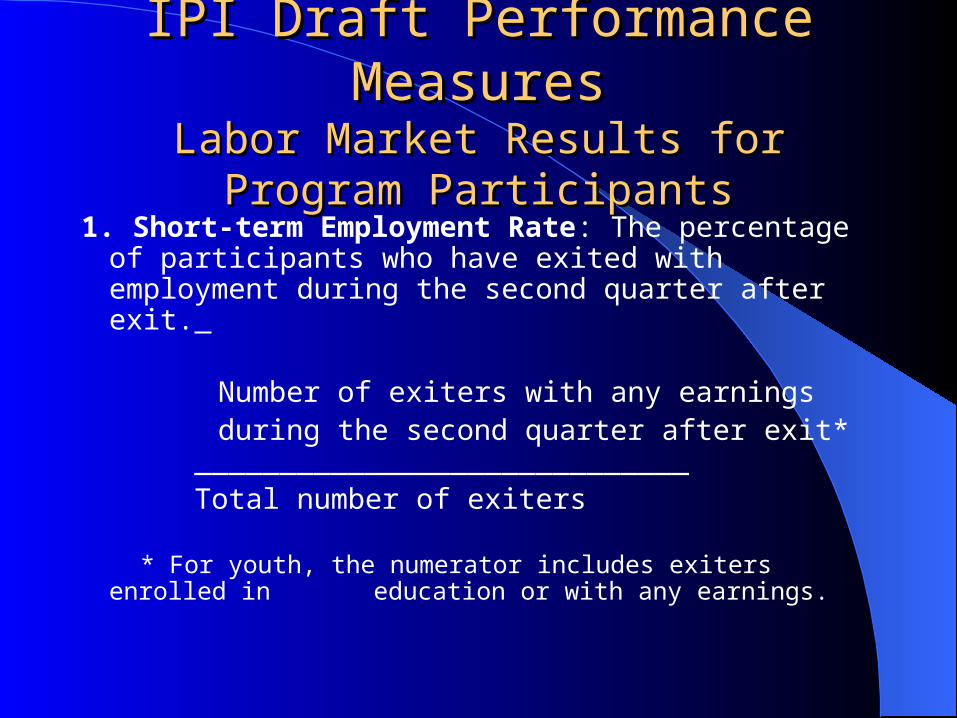
1. Short-term Employment Rate: The percentage of participants who have exited with employment during the second quarter after exit.
Number of exiters with any earnings during the second quarter after exit*
_____________________________ Total number of exiters
* For youth, the numerator includes exiters enrolled in education or with any earnings.

IPI Draft Performance MeasuresIPI Draft Performance MeasuresLabor Market Results for Program Labor Market Results for Program
ParticipantsParticipants
2. Long-term Employment Rate: The percentage of participants who have exited with employment during the fourth quarter after exit.
Number of exiters with any earnings during the fourth quarter after exit*
_____________________________ Total number of exiters
* For youth, the numerator includes exiters enrolled in education or with any earnings.

IPI Draft Performance MeasureIPI Draft Performance MeasureLabor Market Results for Program Labor Market Results for Program
ParticipantsParticipants
3. Earnings Level: Median earnings during the second quarter after exit among all exiters with any earnings. (For youth, individuals enrolled in education should be excluded from the measure.)
Nesting measures: By Subpopulations of Participants, By Service, and by Distribution of Earnings.
IPI Draft Performance MeasuresIPI Draft Performance Measures
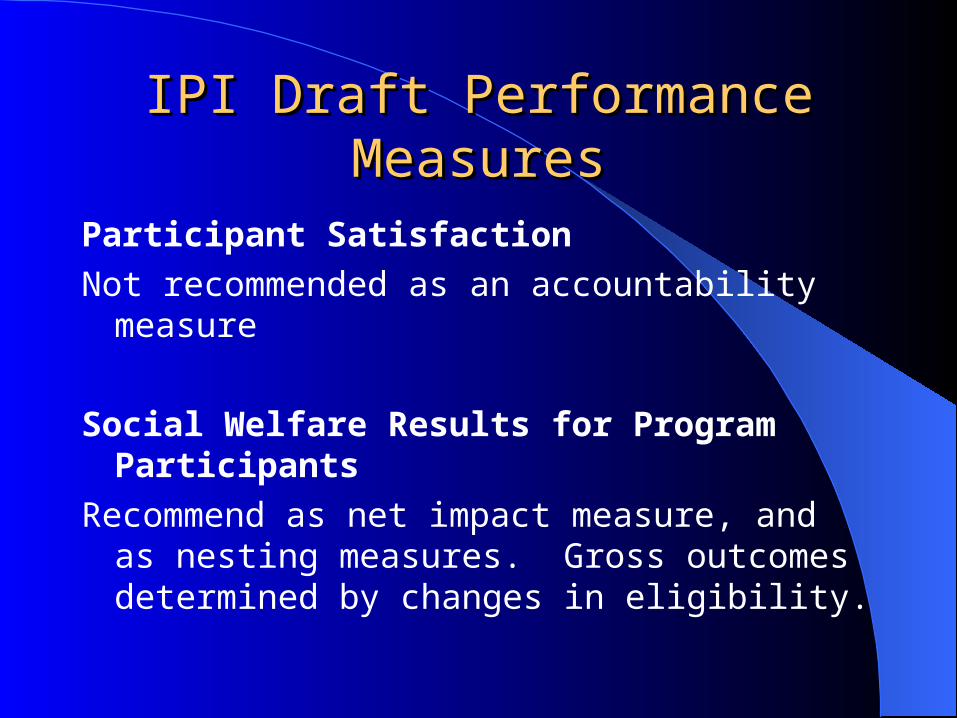
Participant Satisfaction
Not recommended as an accountability measure
Social Welfare Results for Program Participants
Recommend as net impact measure, and as nesting measures. Gross outcomes determined by changes in eligibility.

IPI Draft Performance MeasuresIPI Draft Performance MeasuresSkill GainsSkill Gains
4. Credential Completion Rate: The percentage of exiters who have completed a certificate, degree, diploma, licensure, or other industry-recognized credential within one year of exit.
Number of exiters who have completed a credential within one year of exit _______________________________
Total number of exiters

IPI Draft Performance MeasuresIPI Draft Performance MeasuresResults for Employers and the Economy
5. Repeat Employer Customers: The percentage of employers who are served, directly or indirectly, who return for the same service.
Number of employers who receive the same service again within a year of the initial service quarter _________________________________________ Total number of employers who receive a service during a quarter
Nesting Measures: By Sector, By Service

IPI Draft Performance MeasuresIPI Draft Performance MeasuresResults for Employers and the Economy
6. Employer Market Penetration: The percentage of all employers who benefit from the services.
Number of employers served either directly or indirectly_______________________Total number of employers
Nesting Measures: By Sector, By Service
IPI Draft Performance MeasuresIPI Draft Performance MeasuresReturn on InvestmentReturn on Investment
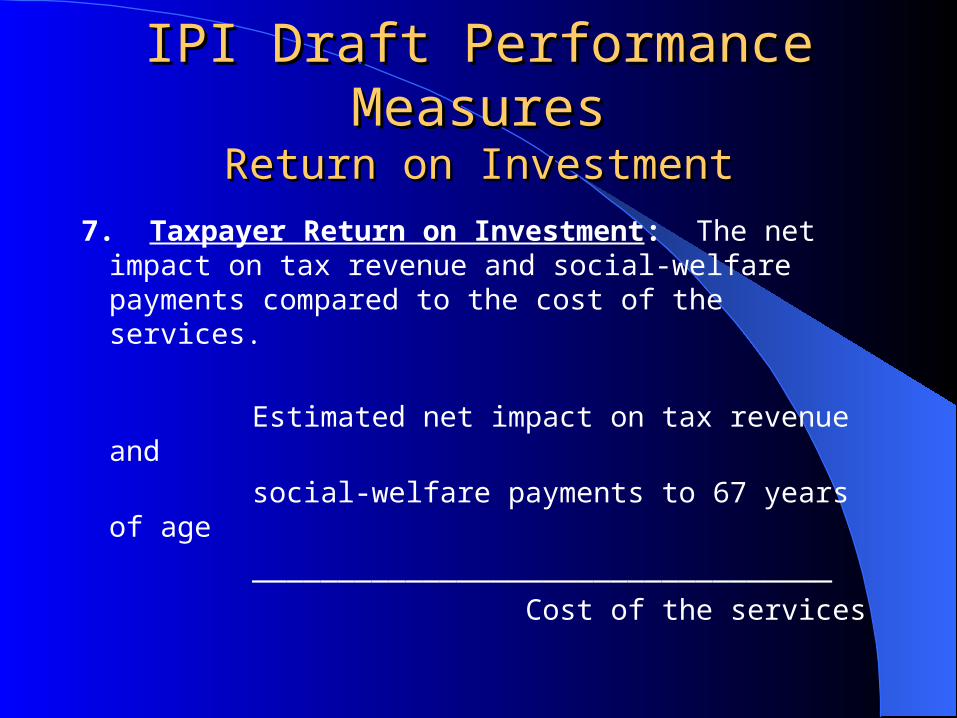
7. Taxpayer Return on Investment: The net impact on tax revenue and social-welfare payments compared to the cost of the services.
Estimated net impact on tax revenue and
social-welfare payments to 67 years of age
__________________________________
Cost of the services

IPI Draft Performance MeasuresIPI Draft Performance MeasuresReturn on InvestmentReturn on Investment
8. Participant Return on Investment: The net impact on participant earnings compared to the cost of the services.
Estimated net impact on participant
earnings to 67 years of age
____________________________
Cost of the services
NEXT STEPSNEXT STEPS
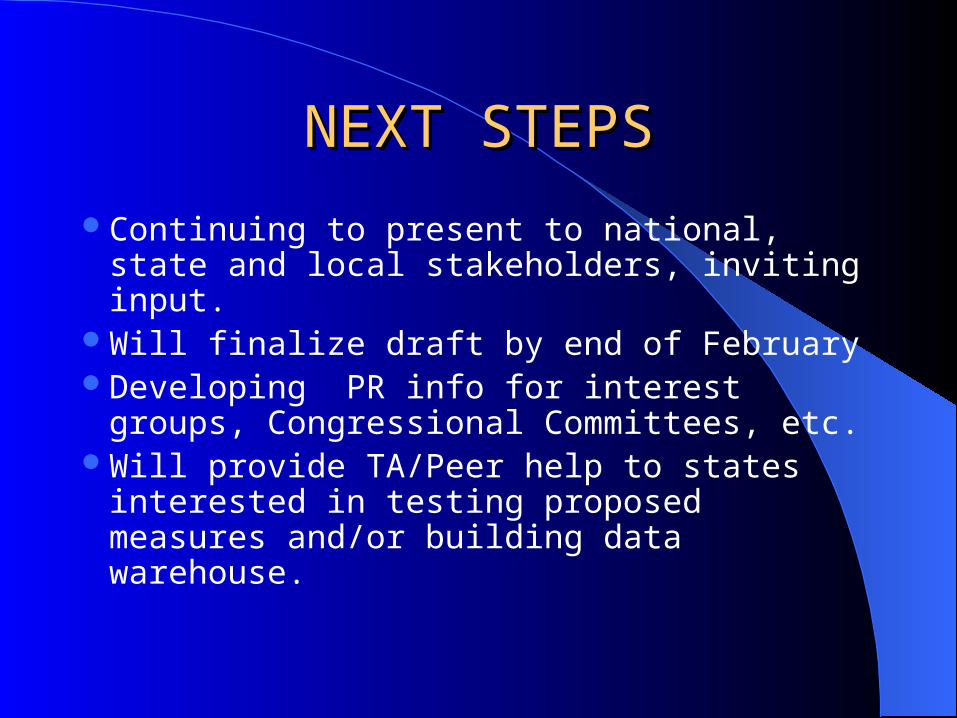
Continuing to present to national, state and local stakeholders, inviting input.
Will finalize draft by end of FebruaryDeveloping PR info for interest groups,
Congressional Committees, etc.Will provide TA/Peer help to states
interested in testing proposed measures and/or building data warehouse.