Integrated Noise Model (INM) Noise Contour Comparison ... · Overview of INM Version 7.0 Noise...
19
-1- FAA-AEE-07-01 Integrated Noise Model (INM) Noise Contour Comparison: Version 7.0 vs. 6.2a FAA AEE-100 Bill He [email protected] FAA AEE-100 Becky Cointin [email protected] DOT Volpe NTSC Eric Boeker [email protected] ATAC Corp Eric Dinges [email protected] DOT Volpe NTSC Chris Roof [email protected] October 2007
Transcript of Integrated Noise Model (INM) Noise Contour Comparison ... · Overview of INM Version 7.0 Noise...
- 1 -
FAA-AEE-07-01
Integrated Noise Model (INM)Noise Contour Comparison: Version 7.0 vs. 6.2a
FAA AEE-100 Bill He [email protected] AEE-100 Becky Cointin [email protected] Volpe NTSC Eric Boeker [email protected] Corp Eric Dinges [email protected] Volpe NTSC Chris Roof [email protected]
October 2007
- 2 -
Table of Contents1. Introduction................................................................................................................. 32. Overview of INM Version 7.0 Noise Modeling Methodology .................................. 3
2.1 General Features of Version 7.0 ............................................................................. 42.2 One Specific INM Modeling Methodology – Lateral Attenuation Adjustment ..... 5
3. INM7.0 Noise Contour Comparison & Studies.......................................................... 73.1 INM Runs for Noise Contour Comparison............................................................. 83.2 Preliminary Results and Examination..................................................................... 9
4. Results and Discussion ............................................................................................. 104.1 Baseline Contour Area Data (C1) ......................................................................... 114.2 Terrain Contour Area Data (C2 &C3) .................................................................. 124.3 Lateral Attenuation Contours (C4 & C5).............................................................. 134.4 Bank Angle Contours (C6 & C7).......................................................................... 144.5 Different Temperature Contours (C8 – C11)........................................................ 144.6 Different Headwind Contours (C12 -- C15) ......................................................... 154.7 All Variables On Contours (C16 & C17) ............................................................. 16
5. Conclusions & Recommendations............................................................................ 18
List of TablesTable 1. Percent by User of the First 200 Users of INM7.0 (May-August, 2007) ............. 4Table 2. INM 7 Features in Comparison to Previous Versions .......................................... 5Table 3. Study Airports and Fleet Mix Information ........................................................... 7Table 4: Sensitivity Test Matrix ......................................................................................... 9Table 5. The Associated Contour Areas for DNL and LAMAX...................................... 10Table 6. Baseline Contour Area Results ........................................................................... 11Table 7. Terrain Contour Area Results ............................................................................. 12Table 8. Lateral Attenuation Results ................................................................................ 13Table 9. Bank Angle Results ............................................................................................ 14Table 10. Different Temperature Results.......................................................................... 14Table 11. Different Headwind Results.............................................................................. 15Table 12. All "Variables On" Results ............................................................................... 16
List of FiguresFigure 1. Illustration of bank angle ε, elevation angle β, depression angle φ, and lateral distance ℓ. ........................................................................................................................... 6Figure 2. Composite Lateral Attenuation Adjustment........................................................ 7Figure 3. Baseline (C1) DNL Contour of Airport "Eastern" ............................................ 10Figure 4. All Variables On (C16) DNL Contour of Airport "LgGA" .............................. 17Figure 5. Baseline vs. All Variables On (C17) DNL Contour of Airport "LgGA", INM 7.0 only ............................................................................................................................. 18
- 3 -
1. Introduction
Version 7.0 of the Integrated Noise Model (INM) was released on April 30, 2007.Relative to the INM 6.x series (INM 6.0, 6.0a, 6.0b, 6.0c, 6.1, 6.2 and 6.2a), version 7.0 is more sophisticated and comprehensive, as well as compliant with recently published global standards such as ECAC Doc 291.
Similar to previous major releases, the new methodologies used in version 7.0 results indifferent noise predictions, as compared with previous versions. Some of the new methodologies are expected to increase noise levels, while others may result in decreases. The degree of the changes depends on many factors such as fleet mix, runway configuration, terrain etc. Therefore, it is not realistic to examine just one individual airport and draw conclusions about INM7.0 noise contour change.
This report provides FAA regional officers and others involved with environmental projects a general sense of noise level changes expected by using version 7.0 based on multiple airport studies. Four airports were investigated using both versions 6.2a and 7.0. The four airports were selected to represent geographic diversity and different airport types, as represented by variations in operations, fleet mix and runway layouts. Through detailed review and analysis of noise results for different cases, the report helpsthe reader to understand the potential range of the noise level changes, some key elements that cause the changes, putting into context the potential change that may be expected at the airport of their particular interest.
The report is organized into four sections. Section 2 provides an overview of the new methodologies implemented in version 7.0, and focuses on several elements that could cause noise contour changes. Section 3 introduces the four airport modeling studies and describes the sensitivity study, including descriptions of the study parameters investigated. It also reviews INM outputs and typical results. Section 4 presents noise contour changes of the modeling studies, and associated discussion and analysis on the results. A summary at the end, Section 5, ties the results together and makes suggestions on how these conclusions should be used.
2. Overview of INM Version 7.0 Noise Modeling Methodology
INM has been the FAA’s standard tool for airport noise assessments since 1978. INM is used domestically and throughout the world. Currently, the INM 6 and 7 series are used by over 1000 organizations in over 65 countries, with the user base increasing every year. About 200 version 7.0 boxes were shipped within three months of its release in April 2007. Table 1 shows percent by user of the first 200 users of INM7.0.
1 European Civil Aviation Conference (ECAC) Doc 29 (3rd Edition) “Report on Standard Method of Computing Noise Contours around Civil Airports Volume 1: Applications Guide; Volume 2: Technical Guide” July 2005

- 4 -
Table 1. Percent by User of the First 200 Users of INM7.0 (May-August, 2007)
Type of User PercentCommercial 62%FAA Regions 10%Education 9%Airliner 8%Other government 6%Other Users 5%
2.1 General Features of Version 7.0
The release of version 7.0 represents a significant step forward in the capability to model potential noise impacts due to aviation sources.
Version 7.0 includes the following new operational and computational features: Improved helicopter noise modeling capabilities based on the Heliport Noise
Model (HNM) Version 2.2 which includes;o Helicopter-specific noise-power-distance (NPD) data and directivity
implementation; ando Expanded helicopter operational modeling functionality.
Compliance with ECAC Doc 29, which includes:o New SAE-AIR-5662 lateral attenuation adjustment algorithms; o Updated thrust reverser implementation; o Bank angle implementation; o Updated flight path segmentation; and o Additional procedural profile step types.
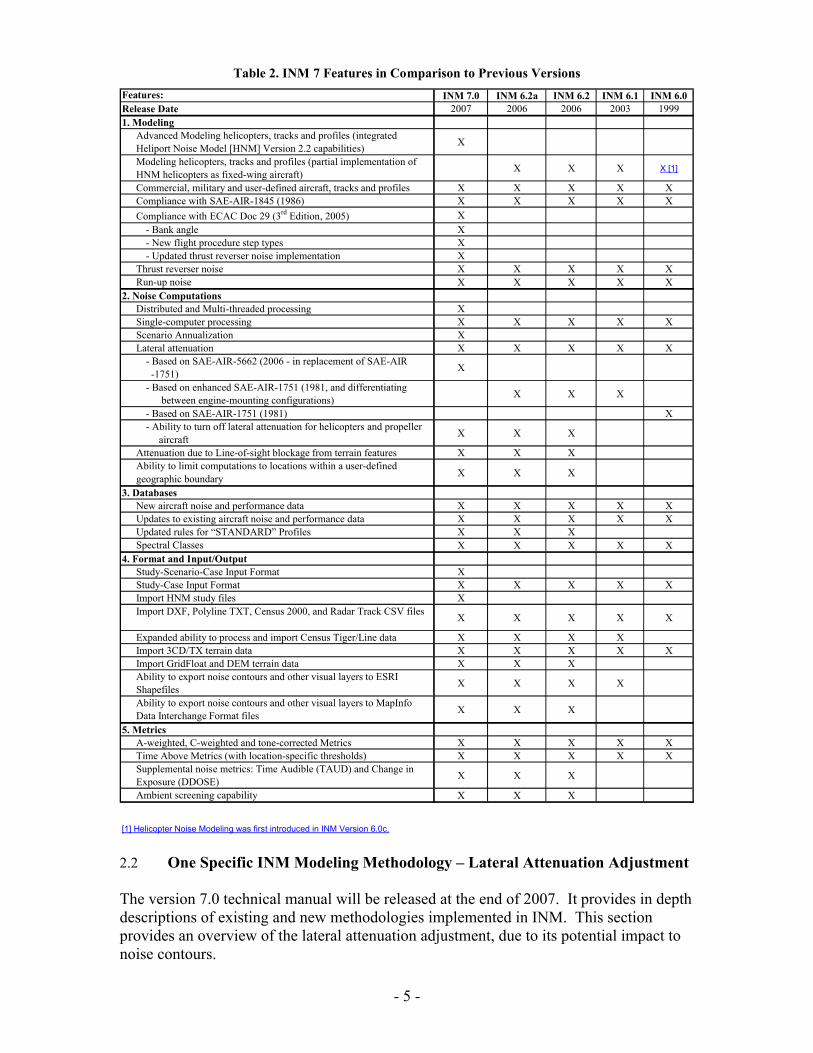
INM 7.0 also includes new software features. The most significant is the Scenario-Case Format, which allows for further categorization of input data within an INM study; and allows for annualization, where a user may adjust noise contributions of individual Cases in a Scenario by a scale factor and an annualization percentage without re-running that Scenario. The new software features improve the software usability and improve the modeling and running efficiency. Table 2 summarizes the new features in INM7.0 in comparison to the previous versions.
- 5 -
Table 2. INM 7 Features in Comparison to Previous Versions
Features: INM 7.0 INM 6.2a INM 6.2 INM 6.1 INM 6.0Release Date 2007 2006 2006 2003 19991. Modeling
Advanced Modeling helicopters, tracks and profiles (integrated Heliport Noise Model [HNM] Version 2.2 capabilities)
X
Modeling helicopters, tracks and profiles (partial implementation of HNM helicopters as fixed-wing aircraft)
X X X X [1]
Commercial, military and user-defined aircraft, tracks and profiles X X X X XCompliance with SAE-AIR-1845 (1986) X X X X X
Compliance with ECAC Doc 29 (3rd Edition, 2005) X
- Bank angle X - New flight procedure step types X - Updated thrust reverser noise implementation X
Thrust reverser noise X X X X XRun-up noise X X X X X
2. Noise ComputationsDistributed and Multi-threaded processing XSingle-computer processing X X X X XScenario Annualization XLateral attenuation X X X X X
- Based on SAE-AIR-5662 (2006 - in replacement of SAE-AIR -1751)
X
- Based on enhanced SAE-AIR-1751 (1981, and differentiating between engine-mounting configurations)
X X X
- Based on SAE-AIR-1751 (1981) X - Ability to turn off lateral attenuation for helicopters and propeller aircraft
X X X
Attenuation due to Line-of-sight blockage from terrain features X X XAbility to limit computations to locations within a user-defined geographic boundary
X X X
3. DatabasesNew aircraft noise and performance data X X X X XUpdates to existing aircraft noise and performance data X X X X XUpdated rules for “STANDARD” Profiles X X XSpectral Classes X X X X X
4. Format and Input/OutputStudy-Scenario-Case Input Format XStudy-Case Input Format X X X X XImport HNM study files XImport DXF, Polyline TXT, Census 2000, and Radar Track CSV files
X X X X X
Expanded ability to process and import Census Tiger/Line data X X X XImport 3CD/TX terrain data X X X X XImport GridFloat and DEM terrain data X X XAbility to export noise contours and other visual layers to ESRI Shapefiles
X X X X
Ability to export noise contours and other visual layers to MapInfo Data Interchange Format files
X X X
5. MetricsA-weighted, C-weighted and tone-corrected Metrics X X X X XTime Above Metrics (with location-specific thresholds) X X X X XSupplemental noise metrics: Time Audible (TAUD) and Change in Exposure (DDOSE)
X X X
Ambient screening capability X X X
[1] Helicopter Noise Modeling was first introduced in INM Version 6.0c.
2.2 One Specific INM Modeling Methodology – Lateral Attenuation Adjustment
The version 7.0 technical manual will be released at the end of 2007. It provides in depth descriptions of existing and new methodologies implemented in INM. This section provides an overview of the lateral attenuation adjustment, due to its potential impact to noise contours.

- 6 -
The difference in level between the sound directly under the aircraft’s flight path and a location to the side of the aircraft at the time of closest approach is termed “lateral attenuation.” The lateral attenuation adjustment takes into account a combination of three elements:
engine installation effect (airplane shielding effect, function of engine type and depression angle φ)
ground-to-ground attenuation (ground reflection effect, function of empirical parameter of lateral distance ℓ )
air-to-ground attenuation (refraction effects, function of empirical parameter of elevation angle β )
Figure 1 displays the lateral attenuation geometry. Note that if the aircraft altitude is known, elevation angle β and lateral distance ℓ are dependent on each other. Similarly,when bank angle ε is known, depression angle φ is linearly related to elevation angle β.
Figure 1. Illustration of bank angle ε, elevation angle β, depression angle φ, and lateral distance ℓ.2
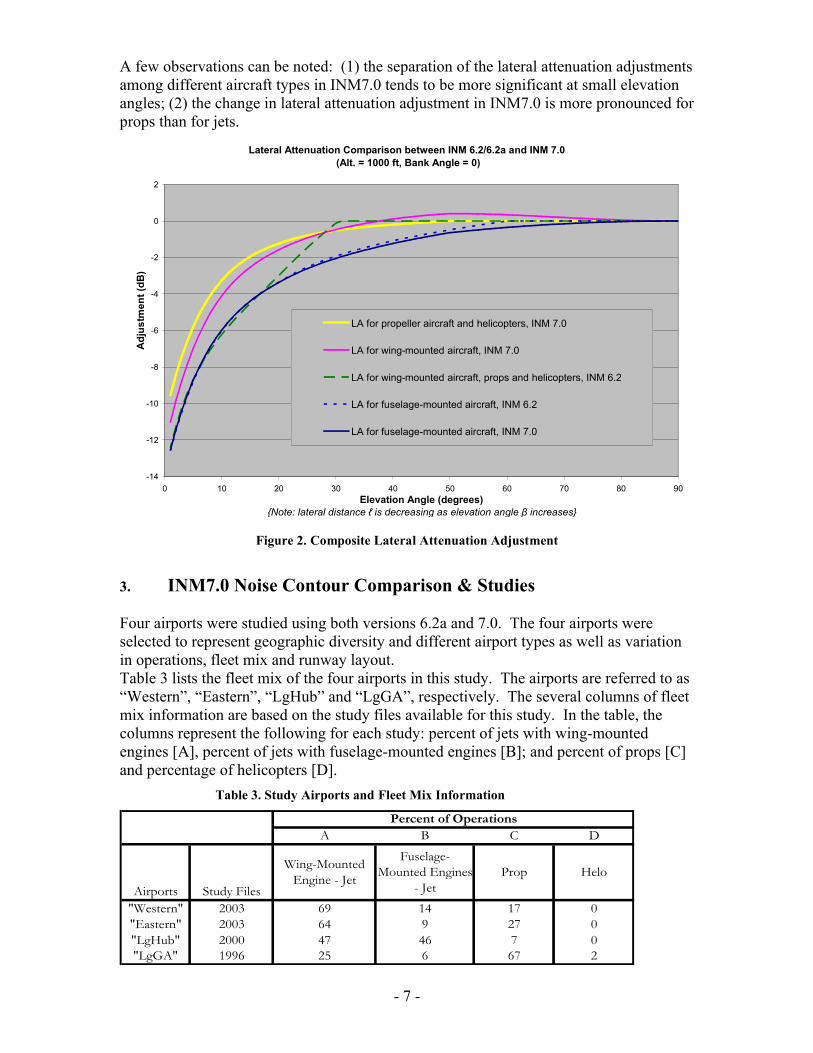
Figure 2 shows an example of the composite lateral attenuation adjustment for both versions 6.2a and 7.0 as a function of elevation angle. In this example the altitude is at 1,000 ft and bank angle is 0. The slant distance decreases as elevation angle increases. Using different combinations of altitudes and bank angles will result in different magnitudes of lateral attenuation adjustments. A negative value means that the lateral attenuation adjustment is to be subtracted from the system noise equation. When all other variables are held constant, a smaller magnitude lateral attenuation adjustmentresults in higher noise levels and correspondingly larger noise contours.
In Figure 2 the dashed and dotted lines are version 6.2a results, representing adjustments corresponding to wing-mounted and fuselage-mounted engines on jet aircraft,respectively. In version 6.2a, the adjustment for props and helicopters were approximated by that of the wing-mounted engine aircraft. In contrast, version 7.0 has three separate lateral attenuation adjustment curves: one for jets with fuselage-mountedengines, with the curve similar to that of version 6.2a; one for jets with wing-mounted engines, with the curve above that of version 6.2a; and one for props and helicopters.
2 Source: SAE-AIR-5662, Method for Predicting Lateral Attenuation of Airplane Noise, 2006.
- 7 -
A few observations can be noted: (1) the separation of the lateral attenuation adjustments among different aircraft types in INM7.0 tends to be more significant at small elevation angles; (2) the change in lateral attenuation adjustment in INM7.0 is more pronounced for props than for jets.
Lateral Attenuation Comparison between INM 6.2/6.2a and INM 7.0 (Alt. = 1000 ft, Bank Angle = 0)
-14
-12
-10
-8
-6
-4
-2
0
2
0 10 20 30 40 50 60 70 80 90Elevation Angle (degrees)
{Note: lateral distance ℓ is decreasing as elevation angle β increases}
Ad
jus
tmen
t (d
B)
LA for propeller aircraft and helicopters, INM 7.0
LA for wing-mounted aircraft, INM 7.0
LA for wing-mounted aircraft, props and helicopters, INM 6.2
LA for fuselage-mounted aircraft, INM 6.2
LA for fuselage-mounted aircraft, INM 7.0
Figure 2. Composite Lateral Attenuation Adjustment
3. INM7.0 Noise Contour Comparison & Studies
Four airports were studied using both versions 6.2a and 7.0. The four airports wereselected to represent geographic diversity and different airport types as well as variation in operations, fleet mix and runway layout. Table 3 lists the fleet mix of the four airports in this study. The airports are referred to as “Western”, “Eastern”, “LgHub” and “LgGA”, respectively. The several columns of fleet mix information are based on the study files available for this study. In the table, the columns represent the following for each study: percent of jets with wing-mounted engines [A], percent of jets with fuselage-mounted engines [B]; and percent of props [C] and percentage of helicopters [D].
Table 3. Study Airports and Fleet Mix Information
A B C D
Airports Study Files
Wing-Mounted Engine - Jet
Fuselage-Mounted Engines
- JetProp Helo
"Western" 2003 69 14 17 0"Eastern" 2003 64 9 27 0"LgHub" 2000 47 46 7 0"LgGA" 1996 25 6 67 2
Percent of Operations
- 8 -
3.1 INM Runs for Noise Contour Comparison
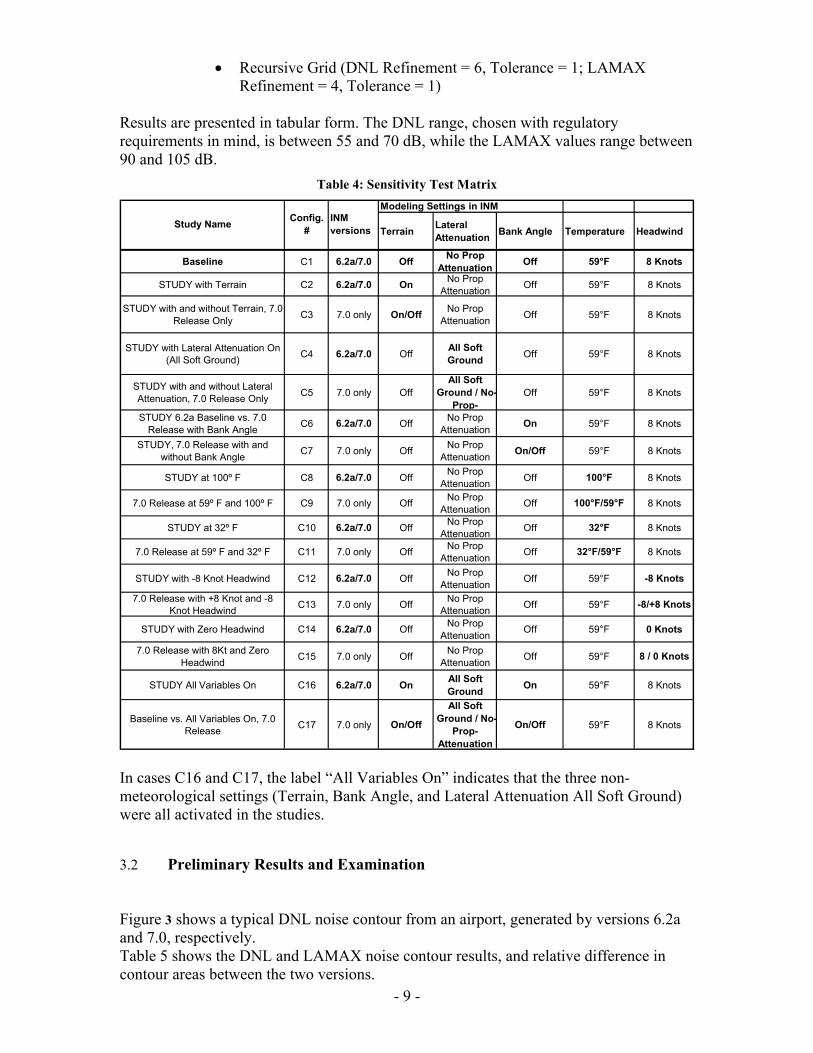
INM runs were conducted to evaluate the DNL and LAMAX metrics in both versions 6.2a and 7.0. Initially, baseline settings were established and the contours and contour areas comparing the two versions were documented for both DNL and LAMAX. Subsequently, the effects of five different INM settings were analyzed on a one-by-one. Three of the variables were chosen to reflect the major changes to the INM software between versions and are listed below:
1. terrain (segmentation, geometry); 2. lateral attenuation (SAE-AIR-5662 implementation in “All Soft Ground”, turning
off attenuation for props and helicopters in “No-Prop-Attenuation”); 3. bank angle (aircraft geometry, aircraft performance, SAE-AIR-5662
implementation)
In addition, two variables that were not directly altered between the versions were chosen. These variables, temperature and headwind, effect aircraft performance and will illustrate the affect of aircraft performance given the above changes between versions.
The results from these studies were plotted as contours and compared. They were compared according to metric, INM version, and status of the variable under consideration, which resulted in the test matrix shown in Table 4. It should be noted that helicopters within the studies were modeled as user-defined fixed wing aircraft in both versions of the model. Though version 7.0 does incorporate HNM 2.2 capabilities, it was determined that the effects of this new capability in version 7.0 will be better explored by single event studies.
The baseline settings were • Terrain = Off• Lateral Attenuation = No Prop Attenuation• Bank Angle = Off• Temperature = 59°F• Headwind = 8 Knots
The Terrain “Off” option assumes a flat surface. No line-of-sight (LOS) blockage is examined in this case.
The “No-Prop-Attenuation” option does not utilize the special lateral attenuation adjustment for props and helicopters, but still applies SAE-AIR-5662 adjustment to jets. In contrast, the “All-Soft-Ground” option applies the SAE-AIR-5662 adjustment to all aircraft types.
The Bank Angle “Off” option deactivates the bank angle methodologies implemented in version 7.0. In general, the effect of bank angle on or off varies from study to study depending on the curvature of the utilized ground tracks.
The temperature and headwind in the baseline case are the standard settings (59 degrees F and 8 knots) in INM. Variation is introduced in other study cases.
During each case study, constant settings were applied to Do Contours = On
- 9 -
Recursive Grid (DNL Refinement = 6, Tolerance = 1; LAMAXRefinement = 4, Tolerance = 1)
Results are presented in tabular form. The DNL range, chosen with regulatory requirements in mind, is between 55 and 70 dB, while the LAMAX values range between 90 and 105 dB.
Table 4: Sensitivity Test Matrix
Modeling Settings in INM
TerrainLateral Attenuation
Bank Angle Temperature Headwind
Baseline C1 6.2a/7.0 OffNo Prop
AttenuationOff 59°F 8 Knots
STUDY with Terrain C2 6.2a/7.0 OnNo Prop
AttenuationOff 59°F 8 Knots
STUDY with and without Terrain, 7.0 Release Only
C3 7.0 only On/OffNo Prop
AttenuationOff 59°F 8 Knots
STUDY with Lateral Attenuation On (All Soft Ground)
C4 6.2a/7.0 OffAll Soft Ground
Off 59°F 8 Knots
STUDY with and without Lateral Attenuation, 7.0 Release Only
C5 7.0 only OffAll Soft
Ground / No-Prop-
Off 59°F 8 Knots
STUDY 6.2a Baseline vs. 7.0 Release with Bank Angle
C6 6.2a/7.0 OffNo Prop
AttenuationOn 59°F 8 Knots
STUDY, 7.0 Release with and without Bank Angle
C7 7.0 only OffNo Prop
AttenuationOn/Off 59°F 8 Knots
STUDY at 100º F C8 6.2a/7.0 OffNo Prop
AttenuationOff 100°F 8 Knots
7.0 Release at 59º F and 100º F C9 7.0 only OffNo Prop
AttenuationOff 100°F/59°F 8 Knots
STUDY at 32º F C10 6.2a/7.0 OffNo Prop
AttenuationOff 32°F 8 Knots
7.0 Release at 59º F and 32º F C11 7.0 only OffNo Prop
AttenuationOff 32°F/59°F 8 Knots
STUDY with -8 Knot Headwind C12 6.2a/7.0 OffNo Prop
AttenuationOff 59°F -8 Knots
7.0 Release with +8 Knot and -8 Knot Headwind
C13 7.0 only OffNo Prop
AttenuationOff 59°F -8/+8 Knots
STUDY with Zero Headwind C14 6.2a/7.0 OffNo Prop
AttenuationOff 59°F 0 Knots
7.0 Release with 8Kt and Zero Headwind
C15 7.0 only OffNo Prop
AttenuationOff 59°F 8 / 0 Knots
STUDY All Variables On C16 6.2a/7.0 OnAll Soft Ground
On 59°F 8 Knots
Baseline vs. All Variables On, 7.0 Release
C17 7.0 only On/Off
All Soft Ground / No-
Prop-Attenuation
On/Off 59°F 8 Knots
Study NameConfig.
#INM versions
In cases C16 and C17, the label “All Variables On” indicates that the three non-meteorological settings (Terrain, Bank Angle, and Lateral Attenuation All Soft Ground) were all activated in the studies.
3.2 Preliminary Results and Examination
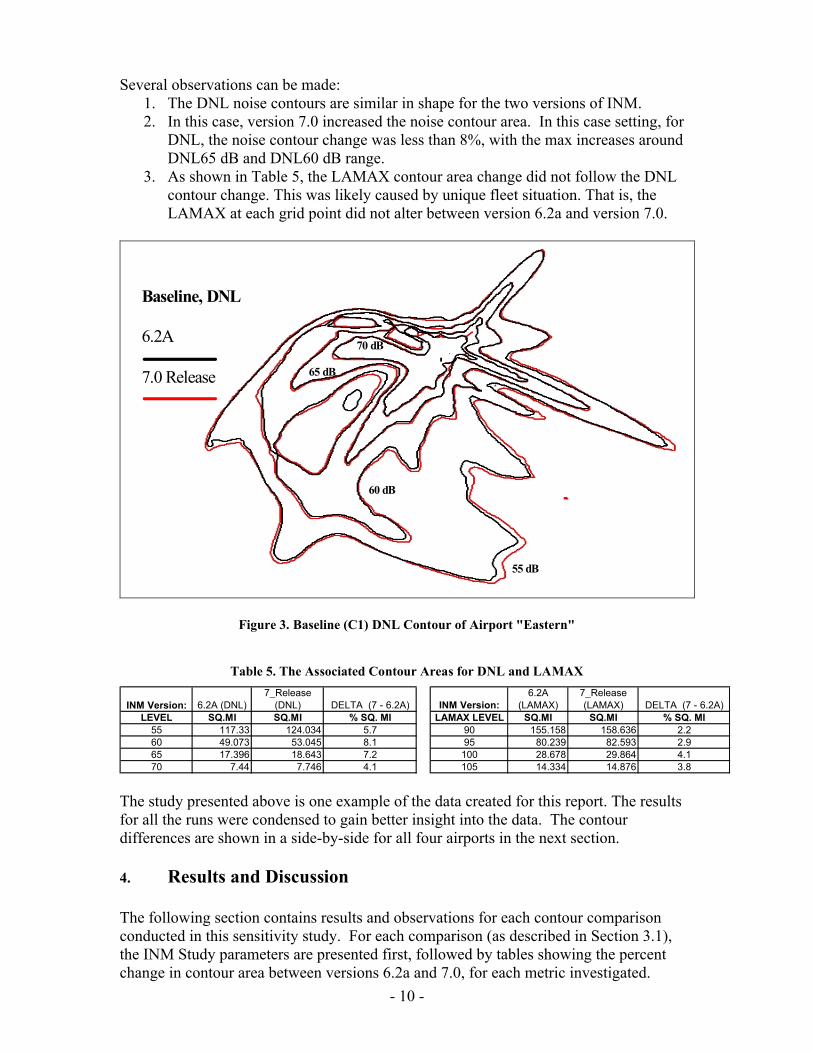
Figure 3 shows a typical DNL noise contour from an airport, generated by versions 6.2a and 7.0, respectively. Table 5 shows the DNL and LAMAX noise contour results, and relative difference in contour areas between the two versions.
- 10 -
Several observations can be made: 1. The DNL noise contours are similar in shape for the two versions of INM. 2. In this case, version 7.0 increased the noise contour area. In this case setting, for
DNL, the noise contour change was less than 8%, with the max increases around DNL65 dB and DNL60 dB range.
3. As shown in Table 5, the LAMAX contour area change did not follow the DNL contour change. This was likely caused by unique fleet situation. That is, the LAMAX at each grid point did not alter between version 6.2a and version 7.0.
Baseline, DNL
6.2A
7.0 Release
55 dB
60 dB
65 dB
70 dB
Figure 3. Baseline (C1) DNL Contour of Airport "Eastern"
Table 5. The Associated Contour Areas for DNL and LAMAX
INM Version: 6.2A (DNL)7_Release
(DNL) DELTA (7 - 6.2A) INM Version:6.2A
(LAMAX)7_Release (LAMAX) DELTA (7 - 6.2A)
LEVEL SQ.MI SQ.MI % SQ. MI LAMAX LEVEL SQ.MI SQ.MI % SQ. MI55 117.33 124.034 5.7 90 155.158 158.636 2.260 49.073 53.045 8.1 95 80.239 82.593 2.965 17.396 18.643 7.2 100 28.678 29.864 4.170 7.44 7.746 4.1 105 14.334 14.876 3.8
The study presented above is one example of the data created for this report. The results for all the runs were condensed to gain better insight into the data. The contour differences are shown in a side-by-side for all four airports in the next section.
4. Results and Discussion
The following section contains results and observations for each contour comparison conducted in this sensitivity study. For each comparison (as described in Section 3.1), the INM Study parameters are presented first, followed by tables showing the percent change in contour area between versions 6.2a and 7.0, for each metric investigated.
- 11 -
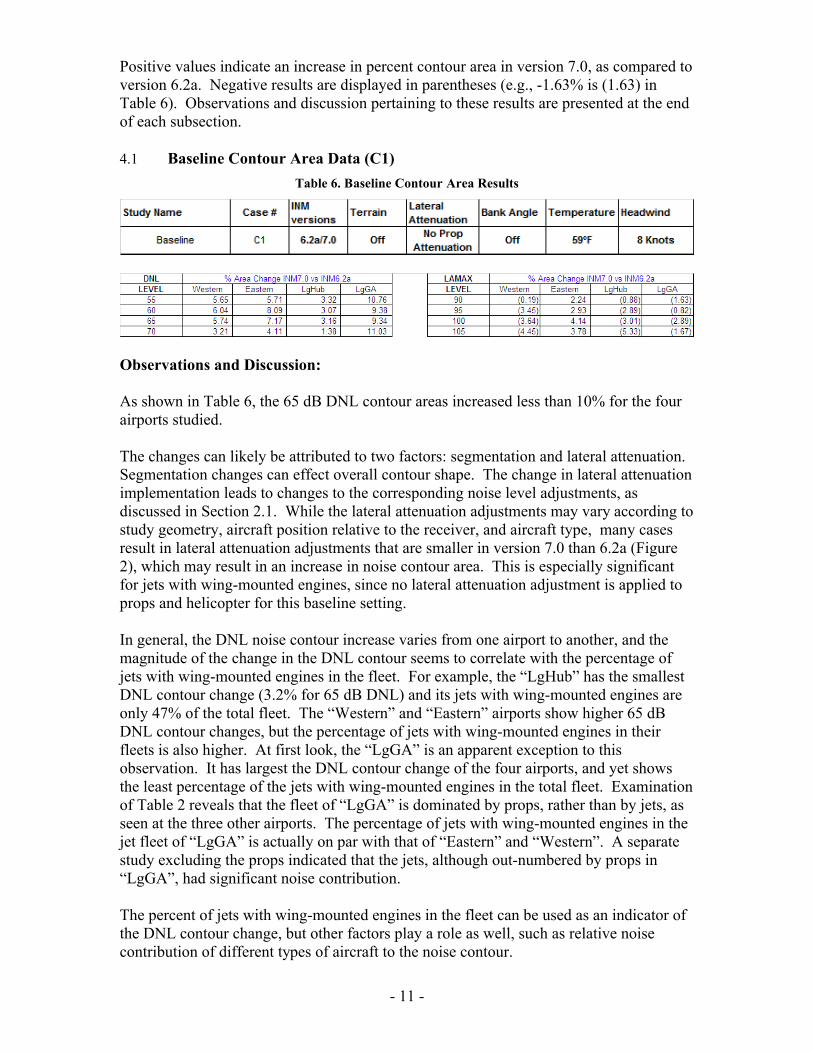
Positive values indicate an increase in percent contour area in version 7.0, as compared to version 6.2a. Negative results are displayed in parentheses (e.g., -1.63% is (1.63) in Table 6). Observations and discussion pertaining to these results are presented at the end of each subsection.
4.1 Baseline Contour Area Data (C1)
Table 6. Baseline Contour Area Results
Observations and Discussion:
As shown in Table 6, the 65 dB DNL contour areas increased less than 10% for the four airports studied.
The changes can likely be attributed to two factors: segmentation and lateral attenuation. Segmentation changes can effect overall contour shape. The change in lateral attenuation implementation leads to changes to the corresponding noise level adjustments, as discussed in Section 2.1. While the lateral attenuation adjustments may vary according tostudy geometry, aircraft position relative to the receiver, and aircraft type, many casesresult in lateral attenuation adjustments that are smaller in version 7.0 than 6.2a (Figure 2), which may result in an increase in noise contour area. This is especially significant for jets with wing-mounted engines, since no lateral attenuation adjustment is applied to props and helicopter for this baseline setting.
In general, the DNL noise contour increase varies from one airport to another, and the magnitude of the change in the DNL contour seems to correlate with the percentage of jets with wing-mounted engines in the fleet. For example, the “LgHub” has the smallest DNL contour change (3.2% for 65 dB DNL) and its jets with wing-mounted engines areonly 47% of the total fleet. The “Western” and “Eastern” airports show higher 65 dB DNL contour changes, but the percentage of jets with wing-mounted engines in theirfleets is also higher. At first look, the “LgGA” is an apparent exception to this observation. It has largest the DNL contour change of the four airports, and yet shows the least percentage of the jets with wing-mounted engines in the total fleet. Examination of Table 2 reveals that the fleet of “LgGA” is dominated by props, rather than by jets, as seen at the three other airports. The percentage of jets with wing-mounted engines in the jet fleet of “LgGA” is actually on par with that of “Eastern” and “Western”. A separate study excluding the props indicated that the jets, although out-numbered by props in “LgGA”, had significant noise contribution.
The percent of jets with wing-mounted engines in the fleet can be used as an indicator of the DNL contour change, but other factors play a role as well, such as relative noise contribution of different types of aircraft to the noise contour.

- 12 -
LAMAX contour area changes show quite a different picture from DNL (See Table 6). Except for “Eastern”, all airports actually show a decrease in the LAMAX contour size in version 7.0. While DNL contour area changes may be related to updates that affect the entire fleet, LAMAX contours are typically dominated by single aircraft. Such is the case for the “Eastern” airport, which is dominated by a prominent jet with wing mounted engines, resulting in consistent trend with DNL due to the lateral attenuation effect discussed previously. The other three airport studies, on the other hand, happen to be dominated by a prominent jet with fuselage mounted engines. The lateral attenuation adjustment in INM7.0 is slightly larger than INM6.2a for jet with fuselage mounted engines, which might cause the slight shrink of LAMAX noise contours in those three airports.
4.2 Terrain Contour Area Data (C2 &C3)
Table 7. Terrain Contour Area Results
Observations and Discussion:
As shown in Table 7, the 65 dB DNL contour increases in version 7.0 with Terrain on, but to a lesser extent than seen in the baseline. This is due to the Line-of-Sight blockage that the Terrain “On” invokes, which, if large enough, could supersede the lateral attenuation adjustment for certain operations. This is because the lateral attenuation adjustment is compared to the line-of-site blockage adjustment, and only the larger of the two is implemented, which results in a non-linear combination of these effects.
The change seen between turning on and off terrain processing in version 7.0 is as expected.

- 13 -
4.3 Lateral Attenuation Contours (C4 & C5)
Table 8. Lateral Attenuation Results
Observations and Discussion:
Table 8 show that the DNL contour increased in version 7.0 by a larger amount than in the baseline setting (Section 3.1) for the “All Soft Ground” conditions, where lateral attenuation was applied to all aircraft in the study (see Figure 2 for lateral attenuation effects).
In general, the new lateral attenuation implementation can result in up to a 3 dB difference between versions 6.2a and 7.0 for propeller aircraft and helicopters, up to a 2.5 dB difference for aircraft with wing-mounted engines, and up to 1 dB difference for aircraft with fuselage-mounted engines. These differences are dependant on slant range distance and elevation angle, as well as aircraft type. The differences in lateral attenuation adjustment (especially the decrease in lateral attenuation for aircraft with wing-mounted engines) are on par with the observed DNL contour area change.
The changes seen in version 7.0 with and without lateral attenuation are as expected. This variable only turned on and off lateral attenuation for propeller aircraft and helicopters in version 7.0, and the small changes in contour area in the “Eastern,” “Western,” and “LgHub” were attributed to the small number of propeller aircraft in thestudies. The “LgGA” airport shows the large increase in DNL because props dominatedthe fleet at that airport.
The LAMAX contours in version 7.0 were barely affected by the turn-on/off of lateral attenuation. For jet dominated airports, there is essentially no difference, which was expected. Even for the “LgGA” airport, the changes were small indicating that jets are likely the dominant maximum noise contribution, even though they are minority of the fleet. This observation was consistent with the reasoning on the DNL contour change in the baseline setting in Section 4.1.
- 14 -
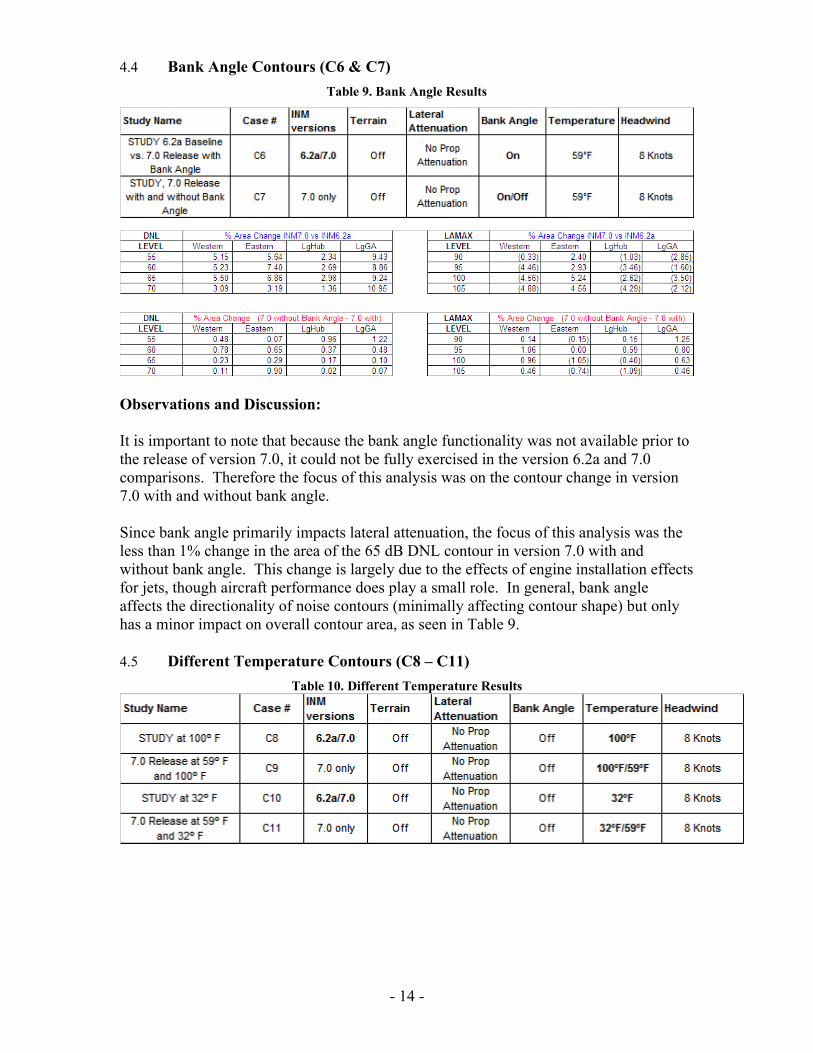
4.4 Bank Angle Contours (C6 & C7)
Table 9. Bank Angle Results
Observations and Discussion:
It is important to note that because the bank angle functionality was not available prior to the release of version 7.0, it could not be fully exercised in the version 6.2a and 7.0 comparisons. Therefore the focus of this analysis was on the contour change in version7.0 with and without bank angle.
Since bank angle primarily impacts lateral attenuation, the focus of this analysis was the less than 1% change in the area of the 65 dB DNL contour in version 7.0 with and without bank angle. This change is largely due to the effects of engine installation effects for jets, though aircraft performance does play a small role. In general, bank angle affects the directionality of noise contours (minimally affecting contour shape) but only has a minor impact on overall contour area, as seen in Table 9.
4.5 Different Temperature Contours (C8 – C11)
Table 10. Different Temperature Results

- 15 -
Table 10. Different Temperature Results (continued)
Observations and Discussion:
The way temperature is handled in INM does not change between version 6.2a and version 7.0. This comparison provides an understanding of how temperature change can affect a study.
Airport temperature affects aircraft performance and noise adjustments (atmospheric absorption and acoustic impedance). Since the temperature-affected noise adjustments were unchanged between version 6.2a and 7.0, the changes observed in this study were related to the indirect effect of temperature on aircraft performance. The area change in the 65 dB DNL contours between version 6.2a and version 7.0 in Table 10 was expected. With the improvements in the modeling methodologies, the contours increased in INM 7.0 regardless of the temperature.
When comparing version 7.0 at the different temperatures, the expected changes in the DNL contours are seen. A higher temperature results in a decrease in thrust which causes a reduction in the climb rate, which may decrease DNL, while a lower temperature causes the opposite effect on thrust and climb rate. This behavior is consistent with previous versions on INM.
4.6 Different Headwind Contours (C12 -- C15)
Table 11. Different Headwind Results

- 16 -
Table 11. Different Headwind Results (continued)
Observations and Discussion:
The methodology of how headwind is handled in INM does not change between version 6.2a and version 7.0. A coding error with the aircraft ground speed reporting was discovered in version 6.2a and subsequently corrected in version 7.0. This comparison provides an understanding of how headwind change can affect a study and verifies the coding error fix.
The results presented in Table 11 verify that the fix has been properly implemented in INM 7.0. In addition, the use of the -8 or 0 KT headwinds in version 7.0 causes an increase in contour size for both DNL and LAMAX compared to an 8 KT headwind. This increase is caused by the performance effects associated with reduced headwind; such asreduced climb angles and increased acceleration distances relative to the ground.
Note: the increase in LAMAX contours at the Eastern airport for version 7.0 when compared to version 6.2a is the result of the Lateral Attenuation adjustment described in Section 4.3. 4.7 All Variables On Contours (C16 & C17)
Table 12. All "Variables On" Results

- 17 -
Observations and Discussion:
Table 12 shows the DNL contour increase between versions 6.2a and 7.0 for the “All Variables On” conditions, similar to the increases seen in the terrain condition comparison in Section 4.1. Figure 4 shows this comparison for the “LgGA” airport study. As illustrated in the figure, though the percent increase in the 70 dB DNL contour is large for the “LgGA” airport, the overall area of the 70 dB DNL contour in both versions is quite. It is also important to note that the percent contour area changes between versions 6.2a and 7.0 for the 65 dB DNL contour for the “All Variables On” conditions were within 10% of those changes shown for the “Baseline” conditions in Table 6, showing similar data trends.
Figure 4. All Variables On (C16) DNL Contour of Airport "LgGA"
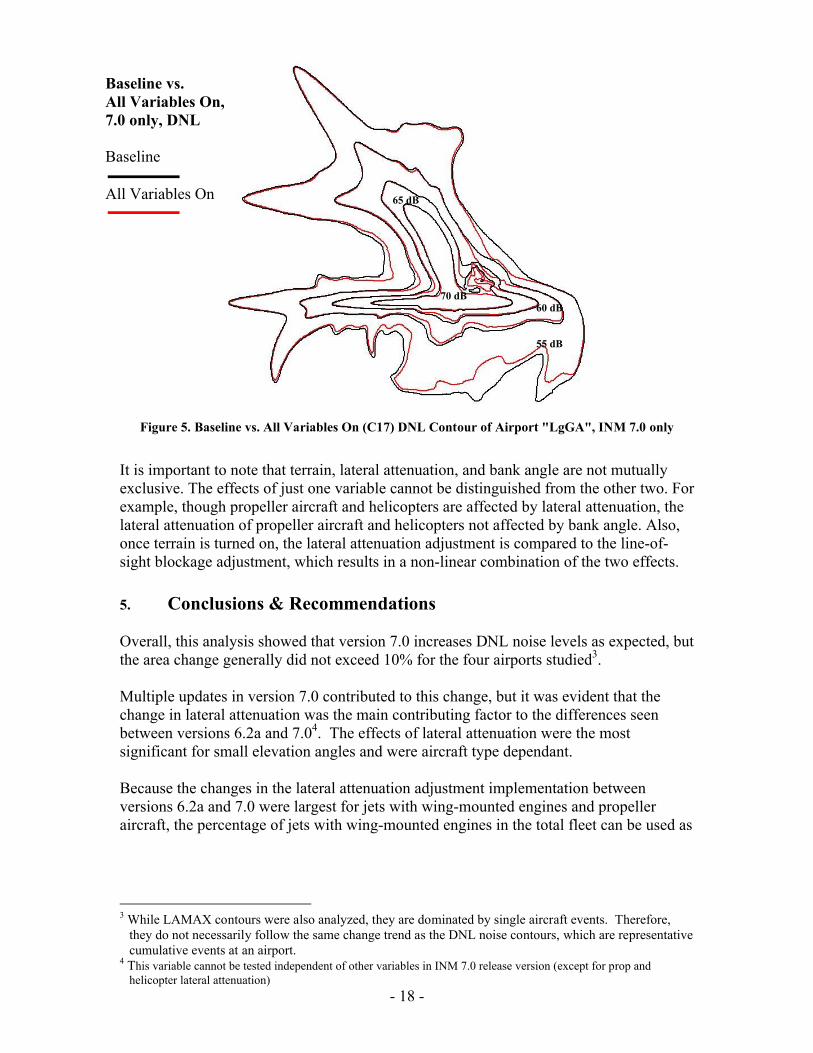
Figure 5 shows the DNL contour increase between the “Baseline” and “All Variables On” conditions for INM 7.0. These differences were on par with those seen for Lateral Attenuation in Table 8 (see Section 4.3), which implies lateral attenuation updates in version 7.0 is the dominate factor in the increase of DNL contours.
All Variables On, DNL
6.2A
7.0 Release
55 dB
60 dB
65 dB
70 dB
- 18 -
Figure 5. Baseline vs. All Variables On (C17) DNL Contour of Airport "LgGA", INM 7.0 only
It is important to note that terrain, lateral attenuation, and bank angle are not mutually exclusive. The effects of just one variable cannot be distinguished from the other two. For example, though propeller aircraft and helicopters are affected by lateral attenuation, the lateral attenuation of propeller aircraft and helicopters not affected by bank angle. Also, once terrain is turned on, the lateral attenuation adjustment is compared to the line-of-sight blockage adjustment, which results in a non-linear combination of the two effects.
5. Conclusions & Recommendations
Overall, this analysis showed that version 7.0 increases DNL noise levels as expected, but the area change generally did not exceed 10% for the four airports studied3.
Multiple updates in version 7.0 contributed to this change, but it was evident that the change in lateral attenuation was the main contributing factor to the differences seen between versions 6.2a and 7.04. The effects of lateral attenuation were the most significant for small elevation angles and were aircraft type dependant.
Because the changes in the lateral attenuation adjustment implementation between versions 6.2a and 7.0 were largest for jets with wing-mounted engines and propeller aircraft, the percentage of jets with wing-mounted engines in the total fleet can be used as
3 While LAMAX contours were also analyzed, they are dominated by single aircraft events. Therefore,
they do not necessarily follow the same change trend as the DNL noise contours, which are representative cumulative events at an airport.
4 This variable cannot be tested independent of other variables in INM 7.0 release version (except for prop and helicopter lateral attenuation)
55 dB
60 dB
65 dB
70 dB
Baseline vs.All Variables On,7.0 only, DNL
Baseline
All Variables On
- 19 -
an indicator of the DNL noise contour change, particularly when the wing-mounted jets contribute significantly to the overall noise5.
Parameters outside of algorithmic changes and updates (such as headwind, temperature and terrain) resulted in contour area changes in version 7.0 that were consistent with those observed in version 6.2a, as expected.
This analysis:(a) Was limited to multiple event studies for the DNL and LAMAX metrics;(b) Showed that both DNL and LAMAX noise contours changed significantly
from one airport to another; and (c) May not represent the noise changes in single event studies;
The trends observed in the four airports studies provide a general sense of noise contour changes in using version 7.0. Good engineering judgment should be used when applying these results to other individual airports, as they may exhibit different trends from the studies in this report.
More studies are being planned to examine the effects of version 7.0 on single events, including helicopters.
5
This indicator was applied to a separate airport study conducted by AEE which has wing-mounted jet accounting for 52% of the fleet. The DNL65 contour area increase is in the range of 1-2% in INM7.0 - consistent with observation in this study.