Integrated Monitoring System Data Tables · Table 4 - Proportion of IMS individuals by age and...
64
Integrated Monitoring System Data Tables Cheshire and Merseyside 2017/18 Mark Whitfield, Howard Reed and Jim McVeigh www.ljmu.ac.uk/phi [email protected] 0151 231 4314 twitter.com/PHI_IMS Public Health Institute, Faculty of Health, Education and Community, Liverpool John Moores University, 3rd Floor Exchange Station, Tithebarn Street, Liverpool, L2 2QP.
Transcript of Integrated Monitoring System Data Tables · Table 4 - Proportion of IMS individuals by age and...

Integrated Monitoring SystemData TablesCheshire and Merseyside 2017/18
Mark Whitfield, Howard Reed and Jim McVeigh
www.ljmu.ac.uk/phi [email protected] 0151 231 4314 twitter.com/PHI_IMS
Public Health Institute, Faculty of Health, Education and Community, Liverpool John Moores University, 3rd Floor Exchange Station, Tithebarn Street, Liverpool, L2 2QP.

78 Integrated Monitoring System Annual Report 2017-18
LIST OF TABLES
Table 1 - All IMS individuals by cohort and local authority, 2017-18 ............................................................................................... 80
Table 2 - All IMS individuals, annual client numbers 2013-14 to 2017-18, ....................................................................................... 80
Table 3 - Number of IMS individuals matching to NDTMS, by age and cohort group ...................................................................... 81
Table 4 - Proportion of IMS individuals by age and cohort group who match to NDTMS ................................................................ 81
Table 5 - Number of IMS individuals matching to NDTMS, by Local Authority and cohort group ................................................... 81
Table 6 - Proportion of IMS individuals by Local Authority and cohort group who match to NDTMS ............................................. 81
Table 7 - Number of IMS individuals matching to CJD, by age and gender ...................................................................................... 82
Table 8 - Proportion of IMS individuals by age and gender who match to CJD ................................................................................ 82
Table 9 - Number of IMS individuals matching to CJD, by Local Authority and cohort group .......................................................... 82
Table 10 - Proportion of IMS individuals by Local Authority and cohort group who match to CJD ................................................. 82
Table 11 - Combined Client Group, IMS, NDTMS & Criminal Justice Datasets 2017-18 ................................................................... 83
Table 12 - Psychoactive drugs cohort by age and gender, 2017-18 ................................................................................................. 84
Table 13 - Psychoactive drugs cohort, percentage split by ethnicity, 2017-18 ................................................................................ 85
Table 14 - Psychoactive drugs cohort by primary substance and local authority, 2017-18 ............................................................. 86
Table 15 - Psychoactive drugs cohort by primary and secondary substance, 2017-18 .................................................................... 87
Table 16 - Psychoactive drugs cohort by accommodation status, 2017-18 ...................................................................................... 88
Table 17 - Psychoactive drugs cohort by employment status, 2017-18 ........................................................................................... 88
Table 18 - Psychoactive drugs cohort by parental status, 2017-18 .................................................................................................. 89
Table 19 - Psychoactive drugs cohort, individuals stating any disability or chronic condition, 2017-18 .......................................... 90
Table 20 - Psychoactive drugs cohort, individuals by local authority of residence and local authority of service provider, 2017-18 .......................................................................................................................................................................................................... 91
Table 21 - Psychoactive drugs cohort, total needle exchange visits and equipment issued, 2017-18 ............................................. 92
Table 22 - Psychoactive drugs cohort, mean averages for needle exchange visits and equipment issued, 2017-18 ....................... 92
Table 23 - Psychoactive drugs cohort, all individuals 2017-18, by year of first presentation........................................................... 93
Table 24 - Psychoactive drugs cohort, new individuals 2017-18, by age and gender....................................................................... 94
Table 25 - Psychoactive drugs cohort, new presentations 2017-18, as a proportion of total individuals, by age group ................. 95
Table 26 - Psychoactive drugs cohort, annual client numbers 2013-14 to 2017-18 ......................................................................... 96
Table 27 - Psychoactive drugs cohort, annual prevalence estimates by local authority, 2013-14 to 2017-18 ................................ 96
Table 28 - Steroid and other IPEDs cohort by age and gender, 2017-18 .......................................................................................... 97
Table 29 - Steroid and other IPEDs cohort, percentage split by ethnicity, 2017-18 ........................................................................ 98
Table 30 - Steroid and other IPEDs cohort by primary substance and local authority, 2017-18 ...................................................... 99
Table 31 - Steroid and other IPEDs cohort by primary and secondary substance, 2017-18 ............................................................. 99
Table 32 - Steroid and other IPEDs cohort by accommodation status, 2017-18 ............................................................................ 100
Table 33 - Steroid and other IPEDs cohort by employment status, 2017-18 .................................................................................. 101
Table 34 - Steroid and other IPEDs cohort by parental status, 2017-18 ......................................................................................... 101
Table 35 - Steroid and other IPEDs cohort, individuals stating any disability or chronic condition, 2017-18 ................................ 102
Table 36 - Steroid and other IPEDs cohort, individuals by local authority of residence and local authority of service provider, 2017-18 ........................................................................................................................................................................................... 103
Table 37 - Steroid and other IPEDs cohort, total needle exchange visits and equipment issued, 2017-18.................................... 104

Integrated Monitoring System Annual Report 2016-17 79
Table 38 - Steroid and other IPEDs cohort, mean averages for needle exchange visits and equipment issued, 2017-18 ............. 104
Table 39 - Steroid and other IPEDs cohort, all individuals 2017-18, by year of first presentation ................................................. 105
Table 40 - Steroid and other IPEDs cohort, new individuals 2017-18, by age and gender ............................................................. 106
Table 41- Steroid and other IPEDs cohort, new individuals 2017-18, as a proportion of total individuals, by age group ............. 107
Table 42 - Steroid and other IPEDs cohort, annual client numbers by local authority, 2013-14 to 2017-18 ................................. 108
Table 43 - Steroid and other IPEDs cohort, annual prevalence estimates by local authority, 2013-14 to 2017-18 ....................... 108
Table 44 - Drugs or alcohol (non-injecting) cohort by age and gender, 2017-18 ........................................................................... 109
Table 45 - Drugs or alcohol (non-injecting) cohort, percentage split by ethnicity, 2017-18 ......................................................... 110
Table 46 - Drugs or alcohol (non-injecting) cohort by primary substance and local authority, 2017-18 ....................................... 111
Table 47 - Drugs or alcohol (non-injecting) cohort by primary and secondary substance, 2017-18 .............................................. 112
Table 48 - Drugs or alcohol (non-injecting) cohort by accommodation status, 2017-18 ............................................................... 113
Table 49 - Drugs or alcohol (non-injecting) cohort by employment status, 2017-18 ..................................................................... 113
Table 50 - Drugs or alcohol (non-injecting) cohort by parental status, 2017-18 ............................................................................ 114
Table 51 - Drugs or alcohol (non-injecting) cohort, individuals stating any disability or chronic condition, 2017-18 .................... 115
Table 52 - Drugs or alcohol (non-injecting) cohort, individuals by local authority of residence and local authority of service provider, 2017-18 ........................................................................................................................................................................... 116
Table 53 - Drugs or alcohol (non-injecting) cohort, annual client numbers by local authority, 2013-14 to 2017-18 ..................... 117
Table 54 - Drugs or alcohol (non-injecting) cohort, annual prevalence estimates by local authority, 2013-14 to 2017-18 .......... 117
Table 55 - Drugs or alcohol (non-injecting) cohort, individuals with no recorded substance, 2017-18 ......................................... 118
Table 56 - Drugs or alcohol (non-injecting) cohort, individuals with no recorded substance, by age and gender, 2017-18 ......... 118
Table 57 - All IMS individuals, interventions delivered, 2017-18 .................................................................................................... 119
Table 58 - All IMS individuals, intervention categories recorded, 2017-18 ................................................................................... 119
Table 59 - All IMS individuals, intervention types recorded, 2017-18 ............................................................................................ 120
Table 60 - All IMS individuals, inward referrals, by referral category, 2017-18 .............................................................................. 121
Table 61 - All IMS individuals, inward referrals, by referral type or organisation, 2017-18 ........................................................... 122
Table 62 - All IMS individuals, onward referrals, by referral category, 2017-18 ............................................................................ 123
Table 63 - All IMS individuals, onward referrals, by referral type or organisation, 2017-18 .......................................................... 124
Table 64 - Wellbeing reviews summary, by substance group, 2017-18 ......................................................................................... 125
Table 65 - Novel Psychoactive Substances (NPS) & 'Club Drugs' 2017-18 ...................................................................................... 126
Table 66 - Number of individuals using agency based NSP service, by cohort group ..................................................................... 127
Table 67 - Proportion of individuals by cohort group who used agency based NSP services ......................................................... 127
Table 68 - Number of new individuals using agency based NSP service, by cohort group ............................................................. 128
Table 69 - Proportion of individuals using agency based NSP services who are new during the 2017-18 year ............................. 128
Table 70 - Number of individuals using pharmacy based NSP service, by cohort group ................................................................ 129
Table 71 - Proportion of individuals by cohort group who used pharmacy based NSP services .................................................... 129
Table 72 - Number of new individuals using pharmacy based NSP service, by cohort group ........................................................ 130
Table 73 - Proportion of individuals using pharmacy based NSP services who are new during the 2017-18 year ........................ 130

80 Integrated Monitoring System Annual Report 2017-18
1. INTEGRATED MONITORING SYSTEM - OVERVIEW
IMS COHORT SUMMARY:
Local Authority PWID: Psychoactive
Drugs PWID: Steroid &
IPEDs BI: Drug
or Alcohol All IMS
Individuals Cheshire East 470 680 0 1,150 Cheshire West & Chester 964 1,169 20 2,153 Halton 113 585 649 1,347 Knowsley 346 363 674 1,383 Liverpool 5,080 2,308 4,369 11,757 Sefton 908 742 76 1,726 St. Helens 1,379 1,177 864 3.420 Warrington 463 801 697 1,961 Wirral 791 991 307 2,089
Cheshire & Merseyside22 10,208 8,700 7,601 26,509
Table 1 - All IMS individuals by cohort and local authority, 2017-18
ANNUAL IMS FIGURES 2013-14 TO 2017-18
All IMS Individuals 2013-14 2014-15 2015-16 2016-17 2017-18
Cheshire East 1,293 1,425 1,374 1,336 1,150 Cheshire West & Chester 1,713 1,954 1,417 2,038 2,153 Halton 608 845 874 1,169 1,347 Knowsley 583 783 1,170 1,553 1,383 Liverpool 10,579 12,658 11,804 10,961 11,757 Sefton 2,234 3,762 3,103 2,625 1,726 St. Helens 2,092 3,744 2,783 2,262 3.420 Warrington 1,531 1,996 1,730 1,605 1,961 Wirral 4,102 4,720 2,570 2,054 2,089
Cheshire & Merseyside 25,760 31,246 26,197 25,024 26,509
Table 2 - All IMS individuals, annual client numbers 2013-14 to 2017-18,
22 Some individuals may have presented in more than one area, therefore this figure will be less than a sum of the separate local authority totals.

Integrated Monitoring System Annual Report 2016-17 81
CROSS MATCHING - IMS, NDTMS, AND CRIMINAL JUSTICE DATASETS
IMS INDIVIDUALS MATCHING TO NDTMS
Age Group PWID: Psycho-active Drugs
PWID: Steroid & IPEDs
BI: Drug or Alcohol All IMS Individuals
0 - 29 106 67 301 474 30 - 39 547 217 646 1,410 40 - 49 1046 59 861 1,966 50 + 435 16 751 1,202 All IMS 2,134 359 2,559 5,052
Table 3 - Number of IMS individuals matching to NDTMS, by age and cohort group
Age Group PWID: Psycho-active Drugs
PWID: Steroid & IPEDs
BI: Drug or Alcohol All IMS Individuals
0 - 29 14.0% 2.4% 14.4% 8.3% 30 - 39 22.6% 5.1% 49.0% 17.6% 40 - 49 21.4% 4.8% 49.7% 25.0% 50 + 20.3% 4.1% 30.6% 24.1% All IMS 20.9% 4.1% 33.7% 19.1%
Table 4 - Proportion of IMS individuals by age and cohort group who match to NDTMS
Local Authority PWID: Psycho-active Drugs
PWID: Steroid & IPEDs
BI: Drug or Alcohol All IMS Individuals
Cheshire East 181 76 0 257 Cheshire West & Chester 258 58 0 316 Halton 71 18 535 624 Knowsley 104 8 539 651 Liverpool 681 59 767 1,507 Sefton 252 26 52 330 St. Helens 298 40 462 800 Warrington 106 29 215 350 Wirral 373 53 37 463
Cheshire & Merseyside 2,134 359 2,559 5,052
Table 5 - Number of IMS individuals matching to NDTMS, by Local Authority and cohort group
Local Authority PWID: Psycho-active Drugs
PWID: Steroid & IPEDs
BI: Drug or Alcohol All IMS Individuals
Cheshire East 38.5% 11.2% - 22.3% Cheshire West & Chester 26.8% 5.0% - 14.7% Halton 62.8% 3.1% 82.4% 46.3% Knowsley 30.1% 2.2% 80.0% 47.1% Liverpool 13.4% 2.6% 17.6% 12.8% Sefton 27.8% 3.5% 68.4% 19.1% St. Helens 21.6% 3.4% 53.5% 23.4% Warrington 22.9% 3.6% 30.8% 17.8%
Wirral 47.2% 5.3% 12.1% 22.2%
Cheshire & Merseyside 20.9% 4.1% 33.7% 19.1%
Table 6 - Proportion of IMS individuals by Local Authority and cohort group who match to NDTMS

82 Integrated Monitoring System Annual Report 2017-18
IMS INDIVIDUALS MATCHING TO CRIMINAL JUSTICE DATA
0 - 18 19 - 29 30 - 39 40 - 49 50 - 59 60+ Total Female 1 12 40 33 11 0 97
Male 2 73 127 171 50 3 426
All IMS 3 85 167 204 61 3 523
Table 7 - Number of IMS individuals matching to CJD, by age and gender
0 - 18 19 - 29 30 - 39 40 - 49 50 - 59 60+ Total Female 0.2% 1.9% 3.0% 2.2% 1.5% 0.0% 1.9%
Male 0.3% 1.9% 1.9% 2.7% 1.7% 0.3% 2.0%
All IMS 0.2% 1.9% 2.1% 2.6% 1.7% 0.2% 2.0%
Table 8 - Proportion of IMS individuals by age and gender who match to CJD
Local Authority PWID: Psycho-active Drugs
PWID: Steroid & IPEDs
BI: Drug or Alcohol All IMS Individuals
Cheshire East ** ** 2
Cheshire West & Chester ** ** 7
Halton ** 4
Knowsley 20 2 64 86
Liverpool 148 11 51 210
Sefton 47 7 3 57
St. Helens 49 5 37 91
Warrington ** ** 2
Wirral 98 13 6 117
Cheshire & Merseyside 320 40 163 523
Table 9 - Number of IMS individuals matching to CJD, by Local Authority and cohort group
Local Authority PWID: Psycho-active Drugs
PWID: Steroid & IPEDs
BI: Drug or Alcohol All IMS Individuals
Cheshire East - - - 0.2%
Cheshire West & Chester - - - 0.3%
Halton - - - 0.3%
Knowsley 5.8% 0.6% 9.5% 6.2%
Liverpool 2.9% 0.5% 1.2% 1.8%
Sefton 5.2% 0.9% 3.9% 3.3%
St. Helens 3.6% 0.4% 4.3% 2.7%
Warrington - - - 0.1%
Wirral 12.4% 1.3% 2.0% 5.6%
Cheshire & Merseyside 3.1% 0.5% 2.1% 2.0%
Table 10 - Proportion of IMS individuals by Local Authority and cohort group who match to CJD

Integrated Monitoring System Annual Report 2016-17 83
COMBINED CLIENT GROUP
Local Authority All IMS individuals
All NDTMS individuals23
All CJD individuals
All IMS Individuals24
Cheshire East 1,150 1,116 2,007 Cheshire West & Chester 2,153 1,524 3,354 Halton 1,347 899 1,618 Knowsley 1,383 1,199 1,845 Liverpool 11,757 5,155 15,195 Sefton 1,726 2,394 3,733 St. Helens 3,420 1,513 4,042 Warrington 1,961 1,259 2,868 Wirral 2,089 3,377 4,886 Cheshire & Merseyside 26,509 18,436 1,760 41,130
Table 11 - Combined Client Group, IMS, NDTMS & Criminal Justice Datasets 2017-18
Figure 77 – Cross matching of IMS, NDTMS & Criminal Justice Datasets
23 NDTMS Monthly ‘Number in Treatment’ YTD figures for 2017-18. Data source: https://www.ndtms.net/Monthly Accessed: 4th February 2019 24 The combined client group is an estimate of the total number of clients based on data matching between IMS and NDTMS (National Drug Treatment Monitoring System), and between IMS and CJD (Criminal Justice Dataset). We are unable to cross match data between NDTMS and CJD.
IMS Only, 20,934
NDTMS Only, 13,384 CJD Only, 1,237
NDTMS & IMS,5,052
NDTMS & IMS, 5,052
CJD & IMS, 523
CJD & IMS, 523
0
5,000
10,000
15,000
20,000
25,000
30,000
IMS DataTotal individuals
26,509
NDTMS DataTotal Individuals
18,436
Criminal Justice DataTotal Individuals
1,760

84 Integrated Monitoring System Annual Report 2017-18
2. NSP CLIENTS - PWID: PSYCHOACTIVE DRUGS
AGE AND GENDER
0 - 1
7
18 -
19
20 -
24
25 -
29
30 -
34
35 -
39
40 -
44
45 -
49
50 -
54
55 -
59
60 -
64
65 +
Tota
l
Cheshire East
Female 0.0% 0.0% 3.4% 7.8% 23.3% 22.4% 24.1% 12.9% 4.3% 1.7% 0.0% 0.0% 116
Male 0.0% 0.0% 0.0% 0.8% 3.1% 6.5% 37.6% 27.7% 16.7% 4.5% 2.3% 0.8% 354
Total 0.0% 0.0% 0.9% 2.6% 8.1% 10.4% 34.3% 24.0% 13.6% 3.8% 1.7% 0.6% 470
Cheshire West & Chester
Female 0.0% 0.0% 3.2% 13.3% 19.0% 17.1% 20.9% 11.4% 8.9% 5.7% 0.6% 0.0% 158
Male 0.0% 0.2% 1.0% 2.9% 5.3% 8.7% 32.4% 26.7% 13.4% 7.8% 1.5% 0.1% 806
Total 0.0% 0.2% 1.3% 4.6% 7.6% 10.1% 30.5% 24.2% 12.7% 7.5% 1.3% 0.1% 964
Halton
Female 0.0% 0.0% 0.0% 8.7% 13.0% 17.4% 30.4% 21.7% 4.3% 0.0% 4.3% 0.0% 23
Male 0.0% 0.0% 2.2% 5.6% 11.1% 18.9% 21.1% 25.6% 8.9% 4.4% 1.1% 1.1% 90
Total 0.0% 0.0% 1.8% 6.2% 11.5% 18.6% 23.0% 24.8% 8.0% 3.5% 1.8% 0.9% 113
Knowsley
Female 0.0% 0.0% 0.0% 10.6% 18.2% 10.6% 19.7% 13.6% 16.7% 0.0% 3.0% 7.6% 66
Male 0.0% 0.0% 0.7% 3.9% 6.1% 8.2% 26.4% 31.4% 14.3% 3.9% 0.7% 4.3% 280
Total 0.0% 0.0% 0.6% 5.2% 8.4% 8.7% 25.1% 28.0% 14.7% 3.2% 1.2% 4.9% 346
Liverpool
Female 0.0% 0.1% 2.7% 7.9% 16.0% 19.9% 18.2% 22.9% 7.0% 2.1% 1.1% 2.1% 1,168
Male 0.0% 0.2% 2.2% 5.9% 9.9% 15.6% 21.7% 21.6% 14.4% 5.4% 1.9% 1.2% 3,912
Total 0.0% 0.1% 2.3% 6.4% 11.3% 16.6% 20.9% 21.9% 12.7% 4.7% 1.7% 1.4% 5,080
Sefton
Female 0.0% 0.0% 1.4% 8.2% 18.5% 21.9% 19.2% 21.2% 7.5% 1.4% 0.7% 0.0% 146
Male 0.0% 0.4% 2.6% 5.6% 9.7% 13.4% 18.0% 25.9% 16.0% 5.2% 1.6% 1.6% 762
Total 0.0% 0.3% 2.4% 6.1% 11.1% 14.8% 18.2% 25.1% 14.6% 4.6% 1.4% 1.3% 908
St. Helens
Female 0.0% 0.0% 3.5% 9.7% 17.3% 19.7% 15.2% 23.9% 7.6% 1.7% 0.7% 0.7% 289
Male 0.0% 0.0% 2.2% 1.7% 4.6% 6.9% 28.4% 35.5% 13.9% 5.0% 1.2% 0.6% 1,090
Total 0.0% 0.0% 2.5% 3.3% 7.3% 9.6% 25.7% 33.1% 12.5% 4.4% 1.1% 0.7% 1,379
Warrington
Female 0.0% 0.0% 2.7% 6.8% 23.0% 21.6% 24.3% 13.5% 8.1% 0.0% 0.0% 0.0% 74
Male 0.0% 0.0% 1.8% 5.4% 13.6% 17.0% 21.6% 29.0% 9.3% 1.0% 0.8% 0.5% 389
Total 0.0% 0.0% 1.9% 5.6% 15.1% 17.7% 22.0% 26.6% 9.1% 0.9% 0.6% 0.4% 463
Wirral
Female 0.0% 0.0% 2.3% 9.2% 7.6% 21.4% 17.6% 18.3% 18.3% 3.1% 1.5% 0.8% 131
Male 0.0% 0.0% 0.5% 3.3% 7.4% 8.9% 23.5% 26.5% 19.1% 6.7% 2.1% 2.0% 660
Total 0.0% 0.0% 0.8% 4.3% 7.5% 11.0% 22.5% 25.2% 19.0% 6.1% 2.0% 1.8% 791
NSP Psych cohort - All individuals
Female 0.0% 0.0% 2.7% 8.5% 16.7% 19.8% 18.6% 20.7% 8.1% 2.2% 1.0% 1.5% 2,120
Male 0.0% 0.1% 1.8% 4.5% 8.1% 12.3% 24.3% 25.9% 14.7% 5.5% 1.6% 1.2% 8,088
Total 0.0% 0.1% 2.0% 5.3% 9.8% 13.9% 23.1% 24.8% 13.3% 4.8% 1.5% 1.3% 10,208
Table 12 - Psychoactive drugs cohort by age and gender, 2017-18
Key: Between 10 and 20% Greater than 20%

Integrated Monitoring System Annual Report 2016-17 85
ETHNICITY
25 C
hesh
ire
East
Ches
hire
Wes
t &
Che
ster
Halto
n
Know
sley
Live
rpoo
l
Seft
on
St. H
elen
s
War
ringt
on
Wirr
al
Psyc
hoac
tive
drug
s co
hort
Al
l ind
ivid
uals
White British 97.3% 100.0% 94.2% 97.0% 92.3% 91.2% 96.8% 92.0% 97.9% 95.1%
White Irish 0.0% 0.0% 1.9% 2.0% 1.5% 2.9% 1.9% 2.3% 0.6% 1.4%
Other White 0.0% 0.0% 0.0% 0.0% 1.1% 2.9% 0.5% 2.3% 0.2% 0.8%
Other White - Polish 0.0% 0.0% 1.0% 0.0% 0.8% 0.0% 0.3% 0.0% 0.3% 0.4%
Other White - Czech 2.7% 0.0% 0.0% 0.0% 0.5% 0.0% 0.0% 0.0% 0.2% 0.2%
Other White - Slovakian
0.0% 0.0% 0.0% 0.0% 0.0% 1.2% 0.0% 0.0% 0.0% 0.1%
White and Black Caribbean
0.0% 0.0% 1.0% 0.0% 0.5% 0.0% 0.0% 0.0% 0.0% 0.2%
White and Black African
0.0% 0.0% 0.0% 0.0% 0.2% 0.6% 0.3% 0.0% 0.2% 0.1%
White and Asian 0.0% 0.0% 0.0% 0.0% 0.0% 0.0% 0.0% 0.0% 0.0% 0.0%
Other Mixed 0.0% 0.0% 0.0% 0.0% 1.1% 0.0% 0.3% 0.0% 0.2% 0.4%
Indian 0.0% 0.0% 0.0% 0.0% 0.2% 0.0% 0.0% 0.0% 0.0% 0.0%
Pakistani 0.0% 0.0% 0.0% 0.0% 0.0% 0.0% 0.0% 0.0% 0.0% 0.0%
Other Asian 0.0% 0.0% 0.0% 0.0% 0.0% 0.0% 0.0% 0.0% 0.0% 0.0%
Caribbean 0.0% 0.0% 0.0% 0.0% 0.2% 0.0% 0.0% 0.0% 0.0% 0.0%
African 0.0% 0.0% 0.0% 0.5% 0.2% 0.0% 0.0% 1.1% 0.0% 0.1%
Other Black 0.0% 0.0% 0.0% 0.5% 0.9% 0.0% 0.0% 0.0% 0.0% 0.3%
Other Black - Somali 0.0% 0.0% 0.0% 0.0% 0.0% 0.0% 0.0% 0.0% 0.0% 0.0%
Chinese 0.0% 0.0% 0.0% 0.0% 0.0% 0.0% 0.0% 0.0% 0.2% 0.0%
Other 0.0% 0.0% 1.9% 0.0% 0.8% 1.2% 0.0% 2.3% 0.2% 0.6%
Other - Gypsy 0.0% 0.0% 0.0% 0.0% 0.0% 0.0% 0.0% 0.0% 0.0% 0.0%
Other - Arab 0.0% 0.0% 0.0% 0.0% 0.0% 0.0% 0.0% 0.0% 0.2% 0.0%
Table 13 - Psychoactive drugs cohort, percentage split by ethnicity, 2017-18 26
Key: Between 0 and 1% Between 1 and 10% Greater than 10%
25 An ethnicity was only recorded for a small number of individuals in both Cheshire East, and Cheshire West & Chester, therefore the percentages for these two areas should be treated with caution 26 Percentage split is calculated as the proportion of only those clients who stated an ethnicity.

86 Integrated Monitoring System Annual Report 2017-18
PRIMARY SUBSTANCE
Ches
hire
Eas
t
Ches
hire
Wes
t &
Che
ster
Halto
n
Know
sley
Live
rpoo
l
Seft
on
St. H
elen
s
War
ringt
on
Wirr
al
NSP
Psy
ch
coho
rt -
All
indi
vidu
als
Amphetamines (excl Ecstasy)
** ** ** 0 10 10 5 7 13 48 1.7% 0.8% 1.0% 0.0% 0.2% 1.4% 1.2% 1.6% 2.1% 0.7%
Benzodiazepines 0 0 0 0 0 ** 0 6 0 9
0.0% 0.0% 0.0% 0.0% 0.0% 0.4% 0.0% 1.4% 0.0% 0.1%
Cocaine (excl Crack) ** ** ** ** 12 12 ** ** 14 46
1.7% 0.8% 3.8% 1.5% 0.3% 1.6% 0.2% 0.5% 2.3% 0.7%
Crack Cocaine ** ** 0 ** 94 43 ** ** ** 147
1.7% 0.6% 0.0% 1.0% 2.2% 5.8% 0.7% 0.7% 0.5% 2.1%
Hallucinogens 0 0 ** 0 0 0 0 0 0 **
0.0% 0.0% 1.0% 0.0% 0.0% 0.0% 0.0% 0.0% 0.0% 0.0%
Heroin 53 345 89 177 3,824 638 375 408 556 6,201
88.3% 96.6% 84.8% 91.2% 87.5% 86.7% 86.8% 92.9% 89.5% 88.3%
Methadone ** ** ** 0 ** 19 7 ** 16 50
3.3% 0.3% 2.9% 0.0% 0.1% 2.6% 1.6% 0.2% 2.6% 0.7%
Other Drugs ** ** ** 11 424 8 31 ** 8 479
1.7% 0.8% 2.9% 5.7% 9.7% 1.1% 7.2% 0.9% 1.3% 6.8%
Other Opiates ** 0 ** 0 ** ** ** 5 5 21
1.7% 0.0% 2.9% 0.0% 0.1% 0.3% 0.9% 1.1% 0.8% 0.3%
Prescription Drugs 0 0 ** ** ** ** 6 ** 6 19
0.0% 0.0% 1.0% 0.5% 0.0% 0.1% 1.4% 0.7% 1.0% 0.3%
Not Stated 27, 28 410 607 8 152 709 172 947 24 170 3,187
87.2% 63.0% 7.1% 43.9% 14.0% 18.9% 68.7% 5.2% 21.5% 31.2% Total Individuals 470 964 113 346 5,080 908 1,379 463 791 10,208
Table 14 - Psychoactive drugs cohort by primary substance and local authority, 2017-18
27 Percentages shown by substance excludes those individuals where the substance was not stated. Percentages shown for ‘Not stated’ is the percentage of all individuals. 28 ‘Not Stated’ these are individuals who do not have a primary substance recorded, but have been imputed as using a psychoactive substance based on their activity recorded within IMS, such as the client characteristics and type of injecting equipment obtained.

Integrated Monitoring System Annual Report 2016-17 87
SECONDARY SUBSTANCE
Secondary Substance 29
Primary Substance
Alco
hol
Amph
etam
ines
(e
xcl E
csta
sy)
Benz
odia
zepi
nes
Cann
abis
Coca
ine
(exc
l Cr
ack)
Crac
k Co
cain
e
Ecst
asy
Hero
in
Met
hado
ne
Nov
el P
sych
oact
ive
Subs
tanc
es
Oth
er D
rugs
Oth
er O
piat
es
Pres
crip
tion
Drug
s
Ster
oids
& P
IEDS
No
Seco
ndar
y Su
bsta
nce
Stat
ed
Tota
l
Amphetamines (excl Ecstasy)
0 0 0 ** ** 0 0 ** ** 0 ** 5 0 ** 30 48 0.0% 0.0% 0.0% 5.6% 16.7% 0.0% 0.0% 11.1% 5.6% 0.0% 16.7% 27.8% 0.0% 5.6% 62.5% 100.0%
Benzo-diazepines
0 0 0 0 0 0 0 0 0 0 0 0 0 0 9 9 0.0% 0.0% 0.0% 0.0% 0.0% 0.0% 0.0% 0.0% 0.0% 0.0% 0.0% 0.0% 0.0% 0.0% 100% 100%
Cocaine (excl Crack)
** ** 0 0 0 ** ** 6 0 0 ** 0 0 7 26 46 10.0% 5.0% 0.0% 0.0% 0.0% 5.0% 10.0% 30.0% 0.0% 0.0% 5.0% 0.0% 0.0% 35.0% 56.5% 100%
Crack Cocaine ** ** ** ** 5 0 0 34 ** 0 ** 0 0 8 90 147
3.5% 3.5% 1.8% 1.8% 8.8% 0.0% 0.0% 59.6% 3.5% 0.0% 3.5% 0.0% 0.0% 14.0% 61.2% 100%
Hallucinogens 0 0 0 0 0 0 0 0 0 0 0 0 0 0 ** **
0.0% 0.0% 0.0% 0.0% 0.0% 0.0% 0.0% 0.0% 0.0% 0.0% 0.0% 0.0% 0.0% 0.0% 100% 100.0%
Heroin 47 13 6 5 34 2,492 0 0 39 ** 73 10 17 88 3,375 6,201
1.7% 0.5% 0.2% 0.2% 1.2% 88.2% 0.0% 0.0% 1.4% 0.1% 2.6% 0.4% 0.6% 3.1% 54.4% 100%
Methadone 0 0 0 ** 0 ** 0 7 0 0 ** 0 0 ** 34 50
0.0% 0.0% 0.0% 18.8% 0.0% 6.3% 0.0% 43.8% 0.0% 0.0% 12.5% 0.0% 0.0% 18.8% 68.0% 100%
Other Drugs 26 0 0 9 0 ** 0 0 0 0 0 0 0 18 424 479
47.3% 0.0% 0.0% 16.4% 0.0% 1.8% 0.0% 0.0% 0.0% 0.0% 0.0% 0.0% 0.0% 32.7% 88.5% 100%
Other Opiates 0 0 0 0 0 0 0 0 0 0 0 0 0 ** 18 21
0.0% 0.0% 0.0% 0.0% 0.0% 0.0% 0.0% 0.0% 0.0% 0.0% 0.0% 0.0% 0.0% 100% 85.7% 100%
Prescription Drugs
0 0 0 0 0 0 0 0 0 0 0 0 0 ** 18 19 0.0% 0.0% 0.0% 0.0% 0.0% 0.0% 0.0% 0.0% 0.0% 0.0% 0.0% 0.0% 0.0% 100% 94.7% 100%
Not Stated - - - - - - - - - - - - - - 3,187 3,187
Total 77 16 7 19 42 2,495 ** 49 42 ** 81 15 17 129 7,212 10,208
2.6% 0.5% 0.2% 0.6% 1.4% 83.4% 0.1% 1.6% 1.4% 0.1% 2.7% 0.5% 0.6% 4.3% 70.7% 100%
Table 15 - Psychoactive drugs cohort by primary and secondary substance, 2017-18
29 Percentages shown by substance excludes those individuals with no secondary substance or where the substance was not stated. Percentages shown for ‘Not Stated’ is the percentage of all individuals.

88 Integrated Monitoring System Annual Report 2017-18
ACCOMMODATION STATUS
Ches
hire
Eas
t
Ches
hire
Wes
t &
Che
ster
Halto
n
Know
sley
Live
rpoo
l
Seft
on
St. H
elen
s
War
ringt
on
Wirr
al
NSP
Psy
ch
coho
rt -
All
indi
vidu
als
NFA - Urgent Housing Problem
** 28 11 8 88 18 78 13 36 236
15.0% 34.6% 12.1% 6.4% 26.3% 12.9% 26.8% 10.9% 15.5% 18.6%
Housing Problem 5 11 9 17 83 16 36 ** 31 183
25.0% 13.6% 9.9% 13.6% 24.9% 11.4% 12.4% 1.7% 13.4% 14.4%
No Housing Problem 12 42 71 100 163 106 177 104 165 848
60.0% 51.9% 78.0% 80.0% 48.8% 75.7% 60.8% 87.4% 71.1% 66.9%
Not Known 30 450 883 22 221 4,746 768 1,088 344 559 8,941
95.7% 91.6% 19.5% 63.9% 93.4% 84.6% 78.9% 74.3% 70.7% 87.6%
Total 470 964 113 346 5,080 908 1,379 463 791 10,208
Table 16 - Psychoactive drugs cohort by accommodation status, 2017-18
EMPLOYMENT STATUS
Ches
hire
Eas
t
Ches
hire
Wes
t &
Che
ster
Halto
n
Know
sley
Live
rpoo
l
Seft
on
St. H
elen
s
War
ringt
on
Wirr
al
NSP
Psy
ch
coho
rt -
All
indi
vidu
als
Regular Employment 0 13 13 10 15 16 16 5 19 94
0.0% 17.1% 14.8% 8.8% 5.3% 13.8% 5.9% 12.2% 9.4% 9.0%
Pupil / Student 0 0 0 0 ** 0 0 0 0 **
0.0% 0.0% 0.0% 0.0% 0.7% 0.0% 0.0% 0.0% 0.0% 0.2%
Long term sick or disabled
** 37 21 41 132 66 111 17 67 444
75.0% 48.7% 23.9% 36.3% 46.8% 56.9% 40.7% 41.5% 33.0% 42.4%
Unemployed and seeking work
** 19 42 53 97 24 117 15 108 404
25.0% 25.0% 47.7% 46.9% 34.4% 20.7% 42.9% 36.6% 53.2% 38.6%
Not receiving benefits
0 ** 8 ** 8 5 15 ** ** 40
0.0% 1.3% 9.1% 2.7% 2.8% 4.3% 5.5% 9.8% 0.5% 3.8%
Other 0 6 ** 6 28 5 14 0 8 64
0.0% 7.9% 4.5% 5.3% 9.9% 4.3% 5.1% 0.0% 3.9% 6.1%
Not Known 31 466 888 25 233 4,798 792 1,106 422 588 9,160
99.1% 92.1% 22.1% 67.3% 94.4% 87.2% 80.2% 91.1% 74.3% 89.7%
Total 470 964 113 346 5,080 908 1,379 463 791 10,208
Table 17 - Psychoactive drugs cohort by employment status, 2017-18
30 Percentages shown by accommodation status excludes those individuals where the accommodation status is not known. Percentages shown for ‘not known’ are the percentage of all individuals. 31 Percentages shown by employment status excludes those individuals where the employment status is not known. Percentages shown for ‘not known’ are the percentage of all individuals.

Integrated Monitoring System Annual Report 2016-17 89
PARENTAL STATUS
Ches
hire
Eas
t
Ches
hire
Wes
t &
Che
ster
Halto
n
Know
sley
Live
rpoo
l
Seft
on
St. H
elen
s
War
ringt
on
Wirr
al
NSP
Psy
ch
coho
rt -
All
indi
vidu
als
All of the children live with client
0 ** 8 ** ** ** 15 ** 5 35
0.0% 3.1% 11.3% 3.5% 0.9% 0.9% 6.1% 6.8% 3.0% 3.9%
Some of the children live with client
0 ** ** 6 ** ** 7 ** ** 18
0.0% 1.6% 1.4% 5.2% 0.9% 0.9% 2.8% 2.3% 1.8% 2.0%
None of the children live with client
** 26 29 33 105 22 84 19 51 322
25.0% 40.6% 40.8% 28.7% 49.8% 19.8% 34.0% 43.2% 30.2% 35.8%
Not a parent of children under 18
** 33 33 69 98 84 141 21 108 511
75.0% 51.6% 46.5% 60.0% 46.4% 75.7% 57.1% 47.7% 63.9% 56.8%
Client declined to answer
0 ** 0 ** ** ** 0 0 ** 14
0.0% 3.1% 0.0% 2.6% 1.9% 2.7% 0.0% 0.0% 1.2% 1.6%
Not Known 32 466 900 42 231 4,869 797 1,132 419 622 9,308
99.1% 93.4% 37.2% 66.8% 95.8% 87.8% 82.1% 90.5% 78.6% 91.2%
Total 470 964 113 346 5,080 908 1,379 463 791 10,208
Table 18 - Psychoactive drugs cohort by parental status, 2017-18
32 Percentages shown by parental status excludes those individuals where the parental status is recorded. Percentages shown for ‘not known’ are the percentage of all individuals.

90 Integrated Monitoring System Annual Report 2017-18
DISABILITIES OR CHRONIC CONDITIONS
Ches
hire
Eas
t
Ches
hire
Wes
t &
Che
ster
Halto
n
Know
sley
Live
rpoo
l
Seft
on
St. H
elen
s
War
ringt
on
Wirr
al
NSP
Psy
ch
coho
rt -
All
indi
vidu
als
Individuals with chronic condition or disability
5 17 5 16 112 41 73 ** 85 310
71.4% 23.9% 29.4% 24.6% 60.9% 44.1% 49.3% 50.0% 47.2% 45.7%
No chronic conditions or disabilities
** 54 12 49 72 52 75 ** 95 368
28.6% 76.1% 70.6% 75.4% 39.1% 55.9% 50.7% 50.0% 52.8% 54.3%
Not Stated 33 463 893 96 281 4,896 815 1,231 455 611 9,530
98.5% 92.6% 85.0% 81.2% 96.4% 89.8% 89.3% 98.3% 77.2% 93.4%
Total 470 964 113 346 5,080 908 1,379 463 791 10,208
Recorded conditions:
Arthritis ** - - ** ** - - - ** 8 Asthma - ** - - ** ** - - ** 9 Cancer ** ** ** ** - - - - ** ** Chronic Fatigue Syndrome (ME)
- - - - - - - - - -
Chronic Pain - - - - ** ** - - ** 5 Chronic Pancreatitis - - - - ** - - - - ** Colitis/Crohn’s Disease - - - - - - - - - - COPD - - ** ** 21 11 ** - 15 45 Dementia - - - - - - - - - - Depression ** 6 - ** 36 ** 34 ** 8 78 Diabetes - - - ** - - - ** ** ** Epilepsy - - ** - ** - ** ** 5 9 General learning diff - - - - - - - - - - Hearing impairment - - - - - ** - - ** ** Heart disease - - - - ** - - - - ** Hypertension/blood pres - - - - ** - - - - ** Kidney disease - - - - - - - - ** ** Liver disease / Cirrhosis - ** - - ** ** - - ** 5 Manual dexterity - - - - - - - - ** ** Mental health ** ** ** ** 19 16 22 - 10 62 Mental ill health - ** - ** 6 ** 13 - ** 23 Mobility issues - - - - 5 - - - 8 12 Multiple Sclerosis (MS) - - - - - - - - - - Neurological & Digestive - - - - - - - - - - Obesity - - - - - - - - - - Other - ** ** ** 7 ** - - 19 30 Parkinson’s - - - - - - - - - - Specific learning diffic - - - - - - ** - - **Speech impairment - - - - - - - - - -Stroke - - - - ** - - - - ** Visual impairment - ** - ** - - - - ** **
Table 19 - Psychoactive drugs cohort, individuals stating any disability or chronic condition, 2017-18
33 Percentages shown is for those clients where a disability or chronic condition record was completed. Percentages shown for ‘not known’ are the percentage of all individuals.

Integrated Monitoring System Annual Report 2016-17 91
LOCAL AUTHORITY OF RESIDENCE
Local Authority of IMS reporting service
Local Authority of residence
Ches
hire
Eas
t
Ches
hire
Wes
t &
Che
ster
Halto
n
Know
sley
Live
rpoo
l
Seft
on
St. H
elen
s
War
ringt
on
Wirr
al
NSP
Psy
ch
coho
rt -
All
indi
vidu
als
Cheshire East 259 ** 0 0 ** 0 0 0 0 261 Cheshire West & Chester 5 367 ** 0 15 ** ** ** ** 381 Halton 0 ** 88 ** 8 0 ** ** 0 95 Knowsley 0 0 ** 171 121 5 8 0 ** 269 Liverpool ** 8 6 34 4,047 31 30 ** 22 4,080 Sefton ** ** ** 7 136 604 ** ** ** 707 St. Helens 0 ** ** 5 26 0 1,112 8 ** 1,126 Warrington 0 0 ** 0 ** 0 29 290 0 318 Wirral 0 ** 0 ** 36 ** ** ** 658 675 Flintshire 0 0 0 0 ** 0 0 0 ** 5 Isle of Man 0 0 0 0 ** 0 0 0 0 ** Manchester 8 0 0 0 0 0 0 0 0 8 Newcastle-under-Lyme 19 0 0 0 0 0 0 0 0 19 Preston 0 0 0 0 ** ** 0 0 0 ** Salford 0 0 0 0 0 0 0 ** 0 ** Staffordshire Moorlands 11 0 0 0 0 0 0 0 0 11 Stockport ** 0 0 0 0 0 0 0 0 ** Stoke-on-Trent ** 0 0 0 0 ** 0 0 0 ** Trafford ** 0 0 0 0 0 0 ** 0 ** West Lancashire ** 0 0 0 5 5 ** 0 0 11 Wigan 0 0 0 0 ** ** 7 ** 0 10 Others ** 0 ** 0 25 ** ** ** ** 35 Not Stated 155 578 9 126 643 253 184 150 98 2,183 Total 470 964 113 346 5,080 908 1,379 463 791 10,208
Table 20 - Psychoactive drugs cohort, individuals by local authority of residence and local authority of service provider, 2017-18

92 Integrated Monitoring System Annual Report 2017-18
NEEDLE AND SYRINGE EXCHANGE TRANSACTIONS
Individuals
Needle and syringe
exchange visits
Total equipment issued out
Needles & syringes
Barrels Other
paraphernalia
Cheshire East 470 3,629 106,556 41,716 192,517
Cheshire West & Chester
964 7,065 156,500 72,858 297,425
Halton 113 394 15,760 5,135 24,187
Knowsley 346 1,168 39,563 12,708 73,250
Liverpool 5,080 19,185 424,704 118,400 893,672
Sefton 908 6,546 85,819 89,735 257,097
St. Helens 1,379 14,230 164,552 102,313 438,190
Warrington 463 1,874 26,249 11,230 52,268
Wirral 791 6,926 127,526 70,278 372,214
NSP Psych cohort All individuals
10,208 61,017 1,147,229 524,373 2,600,820
Table 21 - Psychoactive drugs cohort, total needle exchange visits and equipment issued, 2017-18
Individuals
Average exchange
visits
Average per visit Average per person
Needles & syringes
Barrels Parapher-
nalia Needles & syringes
Barrels Parapher-
nalia
Cheshire East 470 7.7 29.4 11.5 53.0 226.7 88.8 409.6
Cheshire West & Chester
964 7.3 22.2 10.3 42.1 162.3 75.6 308.5
Halton 113 3.5 40.0 13.0 61.4 139.5 45.4 214.0
Knowsley 346 3.4 33.9 10.9 62.7 114.3 36.7 211.7
Liverpool 5,080 3.8 22.1 6.2 46.6 83.6 23.3 175.9
Sefton 908 7.2 13.1 13.7 39.3 94.5 98.8 283.1
St. Helens 1,379 10.3 11.6 7.2 30.8 119.3 74.2 317.8
Warrington 463 4.0 14.0 6.0 27.9 56.7 24.3 112.9
Wirral 791 8.8 18.4 10.1 53.7 161.2 88.8 470.6
NSP Psych cohort All individuals
10,208 6.0 18.80 8.6 42.6 112.4 51.4 254.8
Table 22 - Psychoactive drugs cohort, mean averages for needle exchange visits and equipment issued, 2017-18

Integrated Monitoring System Annual Report 2016-17 93
NSP INDIVIDUALS BY YEAR OF FIRST PRESENTATION
Year of first presentation NSP Psych cohort - All individuals
2017-18 2011 or earlier 2012-13 2013-14 2014-15 2015-16 2016-17 2017-18
Cheshire East 203 15 16 24 32 39 141
470 43.2% 3.2% 3.4% 5.1% 6.8% 8.3% 30.0%
Cheshire West & Chester
289 30 36 59 57 77 416 964
30.0% 3.1% 3.7% 6.1% 5.9% 8.0% 43.2%
Halton 50 ** ** 5 8 12 35
113 44.2% 1.8% 0.9% 4.4% 7.1% 10.6% 31.0%
Knowsley 106 12 23 21 27 23 134
346 30.6% 3.5% 6.6% 6.1% 7.8% 6.6% 38.7%
Liverpool 1,077 114 150 219 343 526 2,651
5,080 21.2% 2.2% 3.0% 4.3% 6.8% 10.4% 52.2%
Sefton 261 30 34 66 93 102 322
908 28.7% 3.3% 3.7% 7.3% 10.2% 11.2% 35.5%
St. Helens 387 56 53 48 64 67 704
1,379 28.1% 4.1% 3.8% 3.5% 4.6% 4.9% 51.1%
Warrington 136 15 16 14 17 28 237
463 29.4% 3.2% 3.5% 3.0% 3.7% 6.0% 51.2%
Wirral 322 30 38 43 70 72 216
791 40.7% 3.8% 4.8% 5.4% 8.8% 9.1% 27.3%
NSP Psych cohort - All individuals
2,664 290 343 477 687 921 4,826 10,208
26.1% 2.8% 3.4% 4.7% 6.7% 9.0% 47.3%
Table 23 - Psychoactive drugs cohort, all individuals 2017-18, by year of first presentation

94 Integrated Monitoring System Annual Report 2017-18
NEW INDIVIDUALS ONLY - BY AGE AND GENDER
0 - 1
7
18 -
19
20 -
24
25 -
29
30 -
34
35 -
39
40 -
44
45 -
49
50 -
54
55 -
59
60 -
64
65 +
Tota
l
Cheshire East
Female 0.0% 0.0% 7.1% 14.3% 23.8% 19.0% 21.4% 7.1% 7.1% 0.0% 0.0% 0.0% 42 Male 0.0% 0.0% 0.0% 0.0% 2.0% 0.0% 43.4% 30.3% 13.1% 7.1% 2.0% 2.0% 99 Total 0.0% 0.0% 2.1% 4.3% 8.5% 5.7% 36.9% 23.4% 11.3% 5.0% 1.4% 1.4% 141
Cheshire West & Chester
Female 0.0% 0.0% 5.6% 21.1% 19.7% 15.5% 18.3% 7.0% 8.5% 2.8% 1.4% 0.0% 71 Male 0.0% 0.6% 0.9% 2.3% 3.2% 7.8% 32.2% 30.4% 13.0% 8.1% 1.2% 0.3% 345 Total 0.0% 0.5% 1.7% 5.5% 6.0% 9.1% 29.8% 26.4% 12.3% 7.2% 1.2% 0.2% 416
Halton
Female 0.0% 0.0% 0.0% 20.0% 40.0% 20.0% 0.0% 20.0% 0.0% 0.0% 0.0% 0.0% 5 Male 0.0% 0.0% 3.3% 10.0% 16.7% 13.3% 16.7% 26.7% 3.3% 6.7% 0.0% 3.3% 30 Total 0.0% 0.0% 2.9% 11.4% 20.0% 14.3% 14.3% 25.7% 2.9% 5.7% 0.0% 2.9% 35
Knowsley
Female 0.0% 0.0% 0.0% 4.5% 18.2% 9.1% 22.7% 13.6% 13.6% 0.0% 9.1% 9.1% 22 Male 0.0% 0.0% 1.8% 5.4% 6.3% 3.6% 30.4% 33.9% 12.5% 3.6% 0.0% 2.7% 112 Total 0.0% 0.0% 1.5% 5.2% 8.2% 4.5% 29.1% 30.6% 12.7% 3.0% 1.5% 3.7% 134
Liverpool
Female 0.0% 0.2% 3.8% 8.8% 17.6% 19.9% 16.4% 19.3% 7.4% 2.6% 1.4% 2.6% 658 Male 0.0% 0.3% 3.1% 6.5% 10.7% 15.0% 22.3% 18.5% 13.6% 6.1% 2.4% 1.6% 1,993 Total 0.0% 0.2% 3.3% 7.1% 12.4% 16.2% 20.8% 18.7% 12.1% 5.2% 2.1% 1.8% 2,651
Sefton
Female 0.0% 0.0% 0.0% 8.0% 20.0% 26.0% 14.0% 18.0% 12.0% 2.0% 0.0% 0.0% 50 Male 0.0% 1.1% 3.7% 6.6% 9.2% 11.4% 18.4% 21.7% 17.6% 4.8% 2.2% 3.3% 272 Total 0.0% 0.9% 3.1% 6.8% 10.9% 13.7% 17.7% 21.1% 16.8% 4.3% 1.9% 2.8% 322
St. Helens
Female 0.0% 0.0% 5.3% 9.9% 15.8% 17.5% 19.3% 22.8% 5.3% 1.8% 1.2% 1.2% 171 Male 0.0% 0.0% 1.3% 0.8% 2.1% 2.3% 31.1% 37.1% 16.9% 6.2% 1.5% 0.8% 533 Total 0.0% 0.0% 2.3% 3.0% 5.4% 6.0% 28.3% 33.7% 14.1% 5.1% 1.4% 0.9% 704
Warrington
Female 0.0% 0.0% 2.3% 6.8% 31.8% 20.5% 20.5% 9.1% 9.1% 0.0% 0.0% 0.0% 44 Male 0.0% 0.0% 2.6% 5.2% 16.6% 15.5% 20.7% 26.9% 9.8% 1.6% 0.5% 0.5% 193 Total 0.0% 0.0% 2.5% 5.5% 19.4% 16.5% 20.7% 23.6% 9.7% 1.3% 0.4% 0.4% 237
Wirral
Female 0.0% 0.0% 5.3% 18.4% 10.5% 21.1% 10.5% 13.2% 5.3% 7.9% 5.3% 2.6% 38 Male 0.0% 0.0% 1.1% 3.9% 5.1% 6.7% 24.2% 27.0% 21.9% 6.7% 2.2% 1.1% 178 Total 0.0% 0.0% 1.9% 6.5% 6.0% 9.3% 21.8% 24.5% 19.0% 6.9% 2.8% 1.4% 216
New Psych Cohort IMS individuals
Female 0.0% 0.1% 4.0% 10.0% 18.3% 19.4% 17.0% 17.9% 7.5% 2.4% 1.5% 2.0% 1,097 Male 0.0% 0.3% 2.4% 4.9% 8.4% 11.1% 24.9% 24.2% 14.5% 6.0% 1.9% 1.4% 3,729 Total 0.0% 0.2% 2.8% 6.1% 10.7% 13.0% 23.1% 22.8% 12.9% 5.2% 1.8% 1.6% 4,826
Table 24 - Psychoactive drugs cohort, new individuals 2017-18, by age and gender
Key: Between 10 and 20% Greater than 20%

Integrated Monitoring System Annual Report 2016-17 95
PROPORTION OF INDIVIDUALS BY AGE GROUP WHO ARE NEW PRESENTATIONS THIS YEAR
0 - 1
7
18 -
19
20 -
24
25 -
29
30 -
34
35 -
39
40 -
44
45 -
49
50 -
54
55 -
59
60 -
64
65 +
Tota
l
Cheshire East
Female - - 75% 67% 37% 31% 32% 20% 60% 0% - - 36%
Male - - - 0% 18% 0% 32% 31% 22% 44% 25% 67% 28%
Total - - 75% 50% 32% 16% 32% 29% 25% 39% 25% 67% 30%
Cheshire West & Chester
Female - - 80% 71% 47% 41% 39% 28% 43% 22% 100% - 45%
Male - 100% 38% 35% 26% 39% 43% 49% 42% 44% 33% 100% 43%
Total - 100% 54% 52% 34% 39% 42% 47% 42% 42% 38% 100% 43%
Halton
Female - - - 50% 67% 25% 0% 20% 0% - 0% - 22%
Male - - 50% 60% 50% 24% 26% 35% 13% 50% 0% 100% 33%
Total - - 50% 57% 54% 24% 19% 32% 11% 50% 0% 100% 31%
Knowsley
Female - - - 14% 33% 29% 38% 33% 27% - 100% 40% 33%
Male - - 100% 55% 41% 17% 46% 43% 35% 36% 0% 25% 40%
Total - - 100% 39% 38% 20% 45% 42% 33% 36% 50% 29% 39%
Liverpool
Female - 100% 78% 63% 62% 56% 51% 48% 60% 68% 69% 71% 56%
Male - 83% 73% 56% 55% 49% 52% 43% 48% 57% 64% 67% 51%
Total - 86% 74% 58% 57% 51% 52% 44% 50% 58% 65% 69% 52%
Sefton
Female - - 0% 33% 37% 41% 25% 29% 55% 50% 0% - 34%
Male - 100% 50% 42% 34% 30% 36% 30% 39% 33% 50% 75% 36%
Total - 100% 45% 40% 35% 33% 35% 30% 41% 33% 46% 75% 35%
St. Helens
Female - - 90% 61% 54% 53% 75% 57% 41% 60% 100% 100% 59%
Male - - 29% 22% 22% 16% 54% 51% 60% 60% 62% 57% 49%
Total - - 47% 46% 38% 32% 56% 52% 57% 60% 67% 67% 51%
Warrington
Female - - 50% 60% 82% 56% 50% 40% 67% - - - 59%
Male - - 71% 48% 60% 45% 48% 46% 53% 75% 33% 50% 50%
Total - - 67% 50% 66% 48% 48% 46% 55% 75% 33% 50% 51%
Wirral
Female - - 67% 58% 40% 29% 17% 21% 8% 75% 100% 100% 29%
Male - - 67% 32% 18% 20% 28% 27% 31% 27% 29% 15% 27%
Total - - 67% 41% 22% 23% 26% 27% 27% 31% 38% 21% 27%
New Psych Cohort IMS individuals
Female - 100% 76% 61% 57% 51% 47% 45% 48% 55% 73% 69% 52%
Male - 91% 63% 51% 48% 42% 47% 43% 45% 50% 54% 55% 46%
Total - 92% 67% 54% 51% 44% 47% 43% 46% 50% 57% 59% 47%
Table 25 - Psychoactive drugs cohort, new presentations 2017-18, as a proportion of total individuals, by age group
Key: 0-20% 20-40% 40-60% 60-80% 80-100%

96 Integrated Monitoring System Annual Report 2017-18
ANNUAL CLIENT NUMBERS
PWID: Psychoactive Drugs
2013-14 2014-15 2015-16 2016-17 2017-18
Cheshire East 485 343 721 511 470
Cheshire West & Chester 744 794 792 862 964
Halton 64 88 80 127 113
Knowsley 285 345 384 300 346
Liverpool 3,998 4,510 5,246 5,080 5,080
Sefton 1,159 1,690 838 957 908
St. Helens 1,360 1,873 1,245 950 1,379
Warrington 930 783 804 578 463
Wirral 1,153 1,318 815 835 791
Cheshire & Merseyside 10,200 11,276 10,679 9,913 10,208
Table 26 - Psychoactive drugs cohort, annual client numbers 2013-14 to 2017-18
PREVALENCE ESTIMATES 34
PWID: Psychoactive Drugs
2013-14 2014-15 2015-16 2016-17 2017-18
Cheshire East 1.33 0.92 1.92 1.35 1.24 Cheshire West & Chester 2.40 2.39 2.37 2.57 2.85 Halton 0.67 0.70 0.63 1.00 0.89 Knowsley 1.86 2.36 2.61 2.03 2.33 Liverpool 7.26 9.50 10.91 10.42 10.33 Sefton 4.04 6.17 3.06 3.48 3.31 St. Helens 6.07 10.57 7.01 5.32 7.69 Warrington 3.30 3.79 3.87 2.77 2.21 Wirral 3.09 4.10 2.53 2.59 2.45 Cheshire & Merseyside 4.21 4.63 4.37 4.03 4.13
Table 27 - Psychoactive drugs cohort, annual prevalence estimates by local authority, 2013-14 to 2017-18
34 Prevalence (per 1,000 population) is based on the ONS mid-year population estimates for each local authority area. https://www.ons.gov.uk/peoplepopulationandcommunity/populationandmigration/populationestimates/datasets/populationestimatesforukenglandandwalesscotlandandnorthernireland

Integrated Monitoring System Annual Report 2016-17 97
3. NSP CLIENTS - PWID: STEROID AND OTHER IPEDS
AGE AND GENDER
0 - 1
7
18 -
19
20 -
24
25 -
29
30 -
34
35 -
39
40 -
44
45 -
49
50 -
54
55 -
59
60 -
64
65 +
Tota
l
Cheshire East Female 0.0% 0.0% 0.0% 0.0% 0.0% 0.0% 0.0% 0.0% 0.0% 0.0% 0.0% 0.0% 0
Male 0.0% 1.0% 13.8% 25.1% 24.7% 27.4% 3.7% 1.9% 1.2% 1.0% 0.1% 0.0% 680 Total 0.0% 1.0% 13.8% 25.1% 24.7% 27.4% 3.7% 1.9% 1.2% 1.0% 0.1% 0.0% 680
Cheshire West & Chester
Female 0.0% 0.0% 7.1% 14.3% 35.7% 7.1% 28.6% 0.0% 7.1% 0.0% 0.0% 0.0% 14 Male 0.3% 1.1% 12.8% 23.0% 25.5% 23.1% 7.5% 4.0% 1.5% 1.0% 0.1% 0.0% 1,155 Total 0.3% 1.1% 12.7% 22.9% 25.6% 22.9% 7.8% 3.9% 1.5% 1.0% 0.1% 0.0% 1,169
Halton Female 0.0% 0.0% 7.7% 23.1% 30.8% 23.1% 7.7% 0.0% 0.0% 7.7% 0.0% 0.0% 13
Male 0.2% 1.6% 8.9% 19.4% 27.4% 16.4% 11.9% 8.0% 4.0% 1.6% 0.5% 0.0% 572 Total 0.2% 1.5% 8.9% 19.5% 27.5% 16.6% 11.8% 7.9% 3.9% 1.7% 0.5% 0.0% 585
Knowsley Female 0.0% 16.7% 0.0% 16.7% 0.0% 50.0% 0.0% 16.7% 0.0% 0.0% 0.0% 0.0% 6
Male 0.3% 1.7% 8.4% 22.7% 24.4% 26.3% 11.5% 3.1% 0.8% 0.6% 0.3% 0.0% 357 Total 0.3% 1.9% 8.3% 22.6% 24.0% 26.7% 11.3% 3.3% 0.8% 0.6% 0.3% 0.0% 363
Liverpool Female 0.0% 6.1% 4.5% 27.3% 13.6% 19.7% 9.1% 6.1% 7.6% 3.0% 1.5% 1.5% 66
Male 0.1% 0.8% 8.3% 19.0% 25.2% 24.5% 8.9% 7.7% 3.1% 1.7% 0.3% 0.3% 2,242 Total 0.1% 1.0% 8.2% 19.2% 24.9% 24.4% 8.9% 7.7% 3.2% 1.7% 0.3% 0.3% 2,308
Sefton Female 0.0% 2.9% 0.0% 20.0% 31.4% 11.4% 14.3% 11.4% 2.9% 2.9% 2.9% 0.0% 35
Male 0.0% 0.4% 6.2% 16.7% 24.6% 23.3% 12.0% 9.3% 3.1% 2.3% 1.1% 0.8% 707 Total 0.0% 0.5% 5.9% 16.8% 24.9% 22.8% 12.1% 9.4% 3.1% 2.3% 1.2% 0.8% 742
St. Helens Female 7.1% 0.0% 7.1% 28.6% 35.7% 14.3% 0.0% 7.1% 0.0% 0.0% 0.0% 0.0% 14
Male 0.3% 1.0% 12.4% 21.0% 25.4% 32.9% 2.9% 2.1% 1.3% 0.3% 0.2% 0.1% 1,163 Total 0.4% 1.0% 12.3% 21.1% 25.5% 32.7% 2.9% 2.2% 1.3% 0.3% 0.2% 0.1% 1,177
Warrington Female 3.4% 0.0% 0.0% 20.7% 24.1% 20.7% 10.3% 13.8% 0.0% 6.9% 0.0% 0.0% 29
Male 0.0% 0.6% 10.0% 21.4% 25.9% 17.5% 9.6% 7.9% 4.9% 1.6% 0.4% 0.3% 772 Total 0.1% 0.6% 9.6% 21.3% 25.8% 17.6% 9.6% 8.1% 4.7% 1.7% 0.4% 0.2% 801
Wirral Female 0.0% 8.3% 20.8% 37.5% 16.7% 4.2% 8.3% 4.2% 0.0% 0.0% 0.0% 0.0% 24
Male 0.0% 0.7% 11.5% 24.2% 23.2% 19.0% 9.1% 7.7% 3.3% 0.8% 0.3% 0.2% 967 Total 0.0% 0.9% 11.7% 24.5% 23.0% 18.7% 9.1% 7.6% 3.2% 0.8% 0.3% 0.2% 991
NSP Steroid cohort - All individuals
Female 1.0% 4.0% 5.5% 24.9% 22.4% 16.4% 10.4% 7.5% 3.5% 3.0% 1.0% 0.5% 201 Male 0.1% 0.9% 10.3% 21.1% 25.2% 23.9% 8.0% 6.0% 2.7% 1.2% 0.3% 0.2% 8,499 Total 0.2% 1.0% 10.2% 21.2% 25.1% 23.7% 8.1% 6.0% 2.7% 1.3% 0.4% 0.2% 8,700
Table 28 - Steroid and other IPEDs cohort by age and gender, 2017-18
Key: Between 10 and 20% Greater than 20%

98 Integrated Monitoring System Annual Report 2017-18
ETHNICITY
Ches
hire
Eas
t
Ches
hire
Wes
t &
Che
ster
Halto
n
Know
sley
Live
rpoo
l
Seft
on
St. H
elen
s
War
ringt
on
Wirr
al
NSP
Ste
roid
co
hort
- Al
l in
divi
dual
s
White British 86.6% 96.5% 97.6% 99.6% 89.9% 97.7% 98.8% 94.7% 97.9% 96.2%
White Irish 0.0% 1.8% 0.8% 0.0% 0.0% 0.0% 0.6% 0.4% 0.4% 0.4%
Other White 6.0% 0.0% 0.8% 0.0% 1.1% 1.1% 0.0% 2.5% 0.6% 1.1%
Other White - Polish 4.0% 0.0% 0.0% 0.0% 1.7% 0.0% 0.0% 0.7% 0.6% 0.7%
Other White - Czech 0.0% 0.0% 0.0% 0.0% 0.0% 0.0% 0.0% 0.0% 0.0% 0.0%
Other White - Slovakian
0.0% 0.0% 0.0% 0.0% 0.3% 0.0% 0.0% 0.0% 0.0% 0.0%
White and Black Caribbean
0.7% 0.0% 0.2% 0.4% 1.1% 0.0% 0.0% 0.4% 0.2% 0.4%
White and Black African
0.0% 0.0% 0.0% 0.0% 0.6% 0.0% 0.3% 0.0% 0.0% 0.1%
White and Asian 0.7% 0.0% 0.0% 0.0% 0.3% 0.0% 0.0% 0.0% 0.0% 0.1%
Other Mixed 0.0% 0.0% 0.4% 0.0% 0.3% 1.1% 0.3% 0.0% 0.0% 0.2%
Indian 0.0% 0.0% 0.2% 0.0% 0.8% 0.0% 0.0% 0.7% 0.0% 0.2%
Pakistani 0.0% 0.0% 0.0% 0.0% 0.0% 0.0% 0.0% 0.0% 0.0% 0.0%
Other Asian 0.0% 0.0% 0.0% 0.0% 0.8% 0.0% 0.0% 0.0% 0.1% 0.1%
Caribbean 0.7% 0.0% 0.0% 0.0% 0.0% 0.0% 0.0% 0.4% 0.0% 0.1%
African 0.0% 0.0% 0.0% 0.0% 0.6% 0.0% 0.0% 0.0% 0.0% 0.1%
Other Black 0.7% 0.0% 0.0% 0.0% 1.7% 0.0% 0.0% 0.0% 0.1% 0.3%
Other Black - Somali 0.0% 0.0% 0.0% 0.0% 0.0% 0.0% 0.0% 0.0% 0.0% 0.0%
Chinese 0.0% 0.0% 0.0% 0.0% 0.0% 0.0% 0.0% 0.0% 0.0% 0.0%
Other 0.7% 1.8% 0.0% 0.0% 0.8% 0.0% 0.0% 0.4% 0.1% 0.2%
Other - Gypsy 0.0% 0.0% 0.0% 0.0% 0.0% 0.0% 0.0% 0.0% 0.0% 0.0%
Other - Arab 0.0% 0.0% 0.0% 0.0% 0.0% 0.0% 0.0% 0.0% 0.0% 0.0%
Table 29 - Steroid and other IPEDs cohort, percentage split by ethnicity, 2017-18 35
Key: Between 0 and 1% Between 1 and 10% Greater than 10%
35 Percentage split is calculated as the proportion of only those clients who stated an ethnicity.

Integrated Monitoring System Annual Report 2016-17 99
PRIMARY SUBSTANCE
Ches
hire
Eas
t
Ches
hire
Wes
t &
Che
ster
Halto
n
Know
sley
Live
rpoo
l
Seft
on
St. H
elen
s
War
ringt
on
Wirr
al
NSP
Ste
roid
co
hort
- Al
l in
divi
dual
s
Steroids & IPEDs 229 696 555 234 1,887 602 334 750 830 6,015
33.7% 59.5% 94.9% 64.5% 81.8% 81.1% 28.4% 93.6% 83.8% 69.1%
Not Stated 36 451 473 30 129 421 140 843 51 161 2,685
66.3% 40.5% 5.1% 35.5% 18.2% 18.9% 71.6% 6.4% 16.2% 30.9%
Total Individuals 680 1,169 585 363 2,308 742 1,177 801 991 8,700
Table 30 - Steroid and other IPEDs cohort by primary substance and local authority, 2017-18
SECONDARY SUBSTANCE
Secondary Substance 37
Primary Substance
Alco
hol
Amph
etam
ines
(exc
l Ec
stas
y)
Benz
odia
zepi
nes
Cann
abis
Coca
ine
(exc
l Cra
ck)
Crac
k Co
cain
e
Hero
in
Oth
er D
rugs
Ster
oids
& P
IEDS
No
Seco
nd S
ubst
ance
or
Non
e St
ated
NSP
Ste
roid
coh
ort -
Al
l ind
ivid
uals
Steroids & IPEDs
35 ** 0 7 6 ** ** 26 346 5,587 6,015
8.2% 0.5% 0.0% 1.6% 1.4% 0.7% 0.7% 6.1% 80.8% 92.9% 100%
Not Stated
- - - - - - - - - 2,685 2,685
- - - - - - - - - 100% 100%
Total 35 ** 0 7 6 ** ** 26 346 8,272 8,700
8.2% 0.5% 0.0% 1.6% 1.4% 0.7% 0.7% 6.1% 80.8% 95.1% 100%
Table 31 - Steroid and other IPEDs cohort by primary and secondary substance, 2017-18
36 ‘Not Stated’ these are individuals who do not have a primary substance recorded, but have been imputed as using a Steroid or IPED based on their activity recorded within IMS, such as the client characteristics and type of injecting equipment obtained. 37 Percentages shown by substance excludes those individuals with no secondary substance or where the substance was not stated. Percentages shown for ‘Not Stated’ is the percentage of all individuals.

100 Integrated Monitoring System Annual Report 2017-18
ACCOMMODATION STATUS
.
Ches
hire
Eas
t
Ches
hire
Wes
t &
Che
ster
Halto
n
Know
sley
Live
rpoo
l
Seft
on
St. H
elen
s
War
ringt
on
Wirr
al
NSP
Ste
roid
co
hort
- Al
l in
divi
dual
s
NFA - Urgent Housing Problem
** 0 ** ** ** ** ** ** ** 13
1.3% 0.0% 0.3% 0.6% 2.2% 1.3% 1.8% 1.1% 0.2% 0.6%
Housing Problem ** 6 7 ** 5 0 9 8 11 48
1.3% 4.1% 1.9% 1.9% 2.7% 0.0% 5.4% 2.9% 1.9% 2.4%
No Housing Problem 75 139 355 155 173 79 156 262 580 1,940
97.4% 95.9% 97.8% 97.5% 95.1% 98.8% 92.9% 96.0% 98.0% 97.0%
*Not Stated 38 (NFA)0 0 0 0 185 17 285 17 ** ** 0 465
See footnote
*Not Stated(Has Address)
- - ** ** ** 338 17 - - ** 338 See footnote
Not Known 39 603 1,024 222 204 2,126 662 1,009 528 399 6,699
88.7% 87.6% 37.9% 56.2% 92.1% 89.2% 85.7% 65.9% 40.3% 77.0% Total 680 1,169 585 363 2,308 742 1,177 801 991 8,700
Table 32 - Steroid and other IPEDs cohort by accommodation status, 2017-18
EMPLOYMENT STATUS
.
Ches
hire
Eas
t
Ches
hire
Wes
t &
Che
ster
Halto
n
Know
sley
Live
rpoo
l
Seft
on
St. H
elen
s
War
ringt
on
Wirr
al
NSP
Ste
roid
co
hort
- Al
l in
divi
dual
s
Regular Employment
7 121 299 125 104 50 89 50 429 1249
100.0% 90.3% 86.7% 83.3% 85.2% 92.6% 89.0% 94.3% 83.8% 86.3%
Pupil / Student 0 ** ** 0 0 0 0 ** ** 11
0.0% 0.7% 1.2% 0.0% 0.0% 0.0% 0.0% 3.8% 0.8% 0.8%
Long term sick or disabled
0 ** ** ** ** 0 ** ** 10 20
0.0% 0.7% 0.6% 0.7% 1.6% 0.0% 4.0% 1.9% 2.0% 1.4%
Unemployed and seeking work
0 9 38 21 11 ** 7 0 63 147
0.0% 6.7% 11.0% 14.0% 9.0% 3.7% 7.0% 0.0% 12.3% 10.2%
Not receiving benefits
0 ** 0 ** ** 0 0 0 0 5
0.0% 1.5% 0.0% 0.7% 1.6% 0.0% 0.0% 0.0% 0.0% 0.3%
Other 0 0 ** ** ** ** 0 0 6 15
0.0% 0.0% 0.6% 1.3% 2.5% 3.7% 0.0% 0.0% 1.2% 1.0%
Not Known 40 673 1,035 240 213 2,186 688 1,077 748 479 7,253
38 The majority of pharmacy NSP do not state client accommodation status. These figures are derived from where either ‘NFA’ or a postcode of residence is recorded. They should be treated with caution where used to interfere the client’s accommodation status, and for this reason they are excluded from total percentages shown for Liverpool and Sefton LAs. 39 Percentages shown by accommodation status excludes those individuals where the accommodation status is not known. Percentages shown for ‘not known’ are the percentage of all individuals. 40 Percentages shown by employment status excludes those individuals where the employment status is not known. Percentages shown for ‘not known’ are the percentage of all individuals.

Integrated Monitoring System Annual Report 2016-17 101
99.0% 88.5% 41.0% 58.7% 94.7% 92.7% 91.5% 93.4% 48.3% 83.4%
Total 680 1,169 585 363 2,308 742 1,177 801 991 8,700
Table 33 - Steroid and other IPEDs cohort by employment status, 2017-18
PARENTAL STATUS
Ches
hire
Eas
t
Ches
hire
Wes
t &
Che
ster
Halto
n
Know
sley
Live
rpoo
l
Seft
on
St. H
elen
s
War
ringt
on
Wirr
al
NSP
Ste
roid
co
hort
- Al
l in
divi
dual
s
All of the children live with client
** 29 27 28 25 14 16 11 92 237
14.3% 24.2% 16.6% 21.9% 30.5% 28.6% 22.5% 20.8% 19.7% 21.3%
Some of the children live with client
0 ** ** ** 5 ** 5 ** 37 55
0.0% 2.5% 0.6% 1.6% 6.1% 6.1% 7.0% 1.9% 7.9% 4.9%
None of the children live with client
0 16 22 13 10 ** ** ** 92 161
0.0% 13.3% 13.5% 10.2% 12.2% 6.1% 5.6% 5.7% 19.7% 14.5%
Not a parent of children under 18
6 61 99 83 30 22 43 35 238 601
85.7% 50.8% 60.7% 64.8% 36.6% 44.9% 60.6% 66.0% 51.1% 54.0%
Client declined to answer
0 11 14 ** 12 7 ** ** 7 58
0.0% 9.2% 8.6% 1.6% 14.6% 14.3% 4.2% 5.7% 1.5% 5.2%
Not Known 41 673 1,049 422 235 2,226 693 1,106 748 525 7,588
99.0% 89.7% 72.1% 64.7% 96.4% 93.4% 94.0% 93.4% 53.0% 87.2%
Total 680 1,169 585 363 2,308 742 1,177 801 991 8,700
Table 34 - Steroid and other IPEDs cohort by parental status, 2017-18
41 Percentages shown by parental status excludes those individuals where the parental status is recorded. Percentages shown for ‘not known’ are the percentage of all individuals.

102 Integrated Monitoring System Annual Report 2017-18
DISABILITIES OR CHRONIC CONDITIONS
Ches
hire
Eas
t
Ches
hire
Wes
t &
Che
ster
Halto
n
Know
sley
Live
rpoo
l
Seft
on
St. H
elen
s
War
ringt
on
Wirr
al
NSP
Ste
roid
co
hort
- Al
l in
divi
dual
s
Individuals with chronic condition or disability
5 5 8 ** 9 8 5 0 51 89 22.7% 4.0% 5.4% 0.8% 8.3% 13.6% 6.5% 0.0% 10.6% 7.6%
No chronic conditions or disabilities
17 119 139 124 100 51 72 46 431 1,075 77.3% 96.0% 94.6% 99.2% 91.7% 86.4% 93.5% 100.0% 89.4% 92.4%
Not Stated 42 658 1,045 438 238 2,199 683 1,100 755 509 7,536
96.8% 89.4% 74.9% 65.6% 95.3% 92.0% 93.5% 94.3% 51.4% 86.6% Total 680 1,169 585 363 2,308 742 1,177 801 991 8,700
Recorded conditions: Arthritis - ** ** - - ** - - 7 13 Asthma ** - - - ** - - - ** 6 Cancer ** - - - - - ** - ** ** Chronic Fatigue Syndrome (ME)
- ** - - - - - - - **
Chronic Pain - - - - ** ** - - - ** Chronic Pancreatitis - - - - - - - - - - Colitis/Crohn’s Disease ** ** - - - - - - - ** COPD - - - - - ** - - - ** Dementia - - - - - - - - - - Depression - - ** - ** - ** - ** 7 Diabetes - - ** ** - - - - ** 5 Epilepsy - - - - - - - - ** ** General learning difficul - - - - - - - - - - Hearing impairment - - - - - - - - 5 5 Heart disease - - - - - - - - - - Hypertension/blood pres - - - - ** - - - - ** Kidney disease - - - - - - - - - - Liver disease / Cirrhosis - - - - - - - - - - Manual dexterity - - - - - - - - - - Mental health - - ** - ** - ** - 6 9 Mental ill health - - - - ** ** - - ** ** Mobility issues - - ** - ** - - - ** ** Multiple Sclerosis (MS) - - - - - - - - - - Neurological & Digestive - - - - - - - - - - Obesity - - - - - - - - - - Other - ** - - ** ** ** - 17 24 Parkinson’s - - - - - - - - - - Specific learning difficulti - - - - - - - - ** ** Speech impairment - - - - - - - - - - Stroke - - - - - - - - - - Visual impairment - - ** - - - - - - **
Table 35 - Steroid and other IPEDs cohort, individuals stating any disability or chronic condition, 2017-18
42 Percentages shown is for those clients where a disability or chronic condition record was completed. Percentages shown for ‘not known’ are the percentage of all individuals

Integrated Monitoring System Annual Report 2016-17 103
LOCAL AUTHORITY OF RESIDENCE
Local Authority of service provider
Local Authority of residence
Ches
hire
Eas
t
Ches
hire
Wes
t &
Che
ster
Halto
n
Know
sley
Live
rpoo
l
Seft
on
St. H
elen
s
War
ringt
on
Wirr
al
Tota
l:
Cheshire East 309 ** ** 0 0 0 0 ** ** 314 Cheshire West & Chester 8 555 ** 0 8 0 ** 13 23 597 Halton 0 ** 491 ** ** ** ** 8 0 505 Knowsley 0 0 5 209 120 10 15 ** ** 350 Liverpool ** ** 26 20 1,751 31 11 ** 9 1,834 Sefton 0 ** ** 5 120 365 ** ** ** 484 St. Helens ** 0 5 ** 13 ** 827 57 ** 895 Warrington ** ** 7 0 5 ** 38 519 ** 565 Wirral 0 11 ** 0 24 ** ** 0 788 817 Flintshire 0 6 0 0 ** ** 0 0 ** 11 Isle of Man 0 0 0 0 ** 0 0 0 0 ** Manchester 5 0 0 ** ** ** 0 ** 0 10 Newcastle-under-Lyme 30 ** 0 0 0 0 0 0 0 31 Preston 0 0 0 0 0 ** 0 0 0 ** Salford 0 0 0 ** ** 0 0 5 0 8 Staffordshire Moorlands 14 0 0 0 0 0 0 0 0 14 Stockport ** 0 0 0 0 0 0 0 0 ** Stoke-on-Trent 0 0 0 0 0 0 0 0 0 0 Trafford 0 0 0 0 0 0 ** ** 0 ** West Lancashire 0 0 0 0 ** 27 11 ** 0 43 Wigan 0 ** 0 ** 0 ** 6 6 0 15 Others ** ** ** 0 11 ** ** 7 ** 32 Not Stated 306 580 43 121 243 296 256 171 160 2,166 Total 680 1,169 585 363 2,308 742 1,177 801 991 8,700
Table 36 - Steroid and other IPEDs cohort, individuals by local authority of residence and local authority of service provider, 2017-18

104 Integrated Monitoring System Annual Report 2017-18
NEEDLE AND SYRINGE EXCHANGE TRANSACTIONS
Individuals Needle and
syringe exchange visits
Total equipment issued out Needles & syringes
Barrels Other
paraphernalia
Cheshire East 680 2,721 78,877 30,929 105,413 Cheshire West & Chester 1,169 2,370 76,497 36,443 60,127
Halton 585 915 50,758 22,867 19,783
Knowsley 363 573 21,825 8,989 20,857
Liverpool 2,308 3,621 121,575 48,907 96,413
Sefton 742 1,422 49,170 27,629 33,551
St. Helens 1,177 2,266 56,763 28,590 63,327
Warrington 801 1,395 60,887 23,748 59,344
Wirral 991 1,976 86,539 40,083 66,933 NSP Steroid cohort - All individuals
8,700 17,259 602,891 268,185 525,748
Table 37 - Steroid and other IPEDs cohort, total needle exchange visits and equipment issued, 2017-18
Individuals Average
exchange visits
Average per visit Average per person Needles &
syringes Barrels
Parapher-nalia
Needles & syringes
Barrels Parapher-
nalia
Cheshire East 680 4.00 29.0 11.4 38.7 116.0 45.5 155.0 Cheshire West & Chester
1,169 2.03 32.3 15.4 25.4 65.4 31.2 51.4
Halton 585 1.56 55.5 25.0 21.6 86.8 39.1 33.8
Knowsley 363 1.58 38.1 15.7 36.4 60.1 24.8 57.5
Liverpool 2,308 1.57 33.6 13.5 26.6 52.7 21.2 41.8
Sefton 742 1.92 34.6 19.4 23.6 66.3 37.2 45.2
St. Helens 1,177 1.93 25.0 12.6 27.9 48.2 24.3 53.8
Warrington 801 1.74 43.6 17.0 42.5 76.0 29.6 74.1
Wirral 991 1.99 43.8 20.3 33.9 87.3 40.4 67.5 NSP Steroid cohort - All individuals
8,700 1.98 34.93 15.5 30.5 69.3 30.8 60.4
Table 38 - Steroid and other IPEDs cohort, mean averages for needle exchange visits and equipment issued, 2017-18

Integrated Monitoring System Annual Report 2016-17 105
NSP INDIVIDUALS BY YEAR OF FIRST PRESENTATION
Year of first presentation NSP Steroid cohort - All individuals
2017-18 2011 or
earlier 2012-13 2013-14 2014-15 2015-16 2016-17 2017-18
Cheshire East 189 47 37 51 36 65 255
680 27.8% 6.9% 5.4% 7.5% 5.3% 9.6% 37.5%
Cheshire West & Chester
241 63 67 93 75 112 518 1,169
20.6% 5.4% 5.7% 8.0% 6.4% 9.6% 44.3%
Halton 175 43 29 46 45 40 207
585 29.9% 7.4% 5.0% 7.9% 7.7% 6.8% 35.4%
Knowsley 91 20 19 27 33 26 147
363 25.1% 5.5% 5.2% 7.4% 9.1% 7.2% 40.5%
Liverpool 504 85 84 122 132 188 1,193
2,308 21.8% 3.7% 3.6% 5.3% 5.7% 8.1% 51.7%
Sefton 192 25 25 45 58 74 323
742 25.9% 3.4% 3.4% 6.1% 7.8% 10.0% 43.5%
St. Helens 249 53 70 49 48 87 621
1,177 21.2% 4.5% 5.9% 4.2% 4.1% 7.4% 52.8%
Warrington 238 35 37 32 33 51 375
801 29.7% 4.4% 4.6% 4.0% 4.1% 6.4% 46.8%
Wirral 373 71 69 59 55 75 289
991 37.6% 7.2% 7.0% 6.0% 5.5% 7.6% 29.2%
NSP Steroid cohort - All individuals
2,199 428 429 515 506 706 3,917 8,700
25.3% 4.9% 4.9% 5.9% 5.8% 8.1% 45.0%
Table 39 - Steroid and other IPEDs cohort, all individuals 2017-18, by year of first presentation

106 Integrated Monitoring System Annual Report 2017-18
NEW INDIVIDUALS ONLY - BY AGE AND GENDER
0 - 1
7
18 -
19
20 -
24
25 -
29
30 -
34
35 -
39
40 -
44
45 -
49
50 -
54
55 -
59
60 -
64
65 +
Tota
l
Cheshire East
Female 0.0% 0.0% 0.0% 0.0% 0.0% 0.0% 0.0% 0.0% 0.0% 0.0% 0.0% 0.0% 0
Male 0.0% 0.8% 23.1% 25.1% 24.7% 24.3% 1.2% 0.4% 0.0% 0.0% 0.4% 0.0% 255
Total 0.0% 0.8% 23.1% 25.1% 24.7% 24.3% 1.2% 0.4% 0.0% 0.0% 0.4% 0.0% 255
Cheshire West & Chester
Female 0.0% 0.0% 12.5% 12.5% 50.0% 0.0% 12.5% 0.0% 12.5% 0.0% 0.0% 0.0% 8
Male 0.6% 2.2% 18.4% 24.1% 23.1% 20.4% 5.5% 3.1% 2.0% 0.6% 0.0% 0.0% 510
Total 0.6% 2.1% 18.3% 23.9% 23.6% 20.1% 5.6% 3.1% 2.1% 0.6% 0.0% 0.0% 518
Halton
Female 0.0% 0.0% 14.3% 28.6% 28.6% 14.3% 14.3% 0.0% 0.0% 0.0% 0.0% 0.0% 7
Male 0.5% 4.0% 14.5% 22.0% 20.0% 16.0% 12.5% 5.5% 3.0% 1.5% 0.5% 0.0% 200
Total 0.5% 3.9% 14.5% 22.2% 20.3% 15.9% 12.6% 5.3% 2.9% 1.4% 0.5% 0.0% 207
Knowsley
Female 0.0% 20.0% 0.0% 0.0% 0.0% 60.0% 0.0% 20.0% 0.0% 0.0% 0.0% 0.0% 5
Male 0.7% 4.2% 10.6% 26.1% 20.4% 26.1% 8.5% 2.1% 0.7% 0.0% 0.7% 0.0% 142
Total 0.7% 4.8% 10.2% 25.2% 19.7% 27.2% 8.2% 2.7% 0.7% 0.0% 0.7% 0.0% 147
Liverpool
Female 0.0% 8.3% 6.3% 29.2% 10.4% 20.8% 2.1% 8.3% 10.4% 0.0% 2.1% 2.1% 48
Male 0.2% 1.6% 10.7% 19.3% 25.1% 23.7% 7.2% 7.2% 2.4% 2.0% 0.3% 0.4% 1,145
Total 0.2% 1.8% 10.5% 19.7% 24.5% 23.6% 7.0% 7.2% 2.8% 1.9% 0.4% 0.5% 1,193
Sefton
Female 0.0% 0.0% 0.0% 24.1% 27.6% 13.8% 13.8% 10.3% 3.4% 3.4% 3.4% 0.0% 29
Male 0.0% 1.0% 10.9% 18.7% 23.1% 21.1% 11.2% 7.1% 3.4% 1.4% 1.7% 0.3% 294
Total 0.0% 0.9% 9.9% 19.2% 23.5% 20.4% 11.5% 7.4% 3.4% 1.5% 1.9% 0.3% 323
St. Helens
Female 10.0% 0.0% 10.0% 30.0% 30.0% 10.0% 0.0% 10.0% 0.0% 0.0% 0.0% 0.0% 10
Male 0.7% 1.6% 15.5% 18.7% 26.4% 34.2% 1.6% 0.8% 0.5% 0.0% 0.0% 0.0% 611
Total 0.8% 1.6% 15.5% 18.8% 26.4% 33.8% 1.6% 1.0% 0.5% 0.0% 0.0% 0.0% 621
Warrington
Female 4.0% 0.0% 0.0% 16.0% 28.0% 20.0% 8.0% 16.0% 0.0% 8.0% 0.0% 0.0% 25
Male 0.0% 1.4% 15.1% 24.6% 21.1% 15.1% 8.9% 4.9% 6.9% 1.4% 0.3% 0.3% 350
Total 0.3% 1.3% 14.1% 24.0% 21.6% 15.5% 8.8% 5.6% 6.4% 1.9% 0.3% 0.3% 375
Wirral
Female 0.0% 14.3% 21.4% 35.7% 14.3% 7.1% 7.1% 0.0% 0.0% 0.0% 0.0% 0.0% 14
Male 0.0% 1.8% 20.0% 28.4% 15.6% 17.8% 6.9% 6.9% 2.5% 0.0% 0.0% 0.0% 275
Total 0.0% 2.4% 20.1% 28.7% 15.6% 17.3% 6.9% 6.6% 2.4% 0.0% 0.0% 0.0% 289
New NSP Steroid cohort individuals
Female 1.4% 4.8% 6.2% 24.7% 21.2% 17.1% 6.8% 8.9% 4.8% 2.1% 1.4% 0.7% 146
Male 0.3% 1.8% 14.6% 21.7% 23.4% 23.2% 6.4% 4.6% 2.4% 1.0% 0.3% 0.2% 3,771
Total 0.3% 1.9% 14.3% 21.9% 23.3% 23.0% 6.5% 4.8% 2.5% 1.0% 0.4% 0.2% 3,917
Table 40 - Steroid and other IPEDs cohort, new individuals 2017-18, by age and gender
Key: Between 10 and 20% Greater than 20%

Integrated Monitoring System Annual Report 2016-17 107
PROPORTION OF INDIVIDUALS BY AGE GROUP WHO ARE NEW PRESENTATIONS THIS YEAR
0 - 1
7
18 -
19
20 -
24
25 -
29
30 -
34
35 -
39
40 -
44
45 -
49
50 -
54
55 -
59
60 -
64
65 +
Tota
l
Cheshire East
Female - - - - - - - - - - - - -
Male - 29% 63% 37% 38% 33% 12% 8% 0% 0% 100% - 38%
Total - 29% 63% 37% 38% 33% 12% 8% 0% 0% 100% - 38%
Cheshire West & Chester
Female - - 100% 50% 80% 0% 25% - 100% - - - 57%
Male 75% 85% 64% 46% 40% 39% 32% 35% 59% 25% 0% - 44%
Total 75% 85% 64% 46% 41% 39% 32% 35% 61% 25% 0% - 44%
Halton
Female - - 100% 67% 50% 33% 100% - - 0% - - 54%
Male 100% 89% 57% 40% 25% 34% 37% 24% 26% 33% 33% - 35%
Total 100% 89% 58% 40% 26% 34% 38% 24% 26% 30% 33% - 35%
Knowsley
Female - 100% - 0% - 100% - 100% - - - - 83%
Male 100% 100% 50% 46% 33% 39% 29% 27% 33% 0% 100% - 40%
Total 100% 100% 50% 45% 33% 41% 29% 33% 33% 0% 100% - 40%
Liverpool
Female - 100% 100% 78% 56% 77% 17% 100% 100% 0% 100% 100% 73%
Male 100% 95% 65% 52% 51% 49% 41% 47% 40% 62% 57% 83% 51%
Total 100% 96% 66% 53% 51% 50% 40% 49% 44% 59% 63% 86% 52%
Sefton
Female - 0% - 100% 73% 100% 80% 75% 100% 100% 100% - 83%
Male - 100% 73% 47% 39% 38% 39% 32% 45% 25% 63% 17% 42%
Total - 75% 73% 50% 41% 39% 41% 34% 48% 29% 67% 17% 44%
St. Helens
Female 100% - 100% 75% 60% 50% - 100% - - - - 71%
Male 100% 83% 66% 47% 55% 55% 29% 20% 20% 0% 0% 0% 53%
Total 100% 83% 66% 47% 55% 55% 29% 23% 20% 0% 0% 0% 53%
Warrington
Female 100% - - 67% 100% 83% 67% 100% - 100% - - 86%
Male - 100% 69% 52% 37% 39% 42% 28% 63% 42% 33% 50% 45%
Total 100% 100% 69% 53% 39% 41% 43% 32% 63% 50% 33% 50% 47%
Wirral
Female - 100% 60% 56% 50% 100% 50% 0% - - - - 58%
Male - 71% 50% 33% 19% 27% 22% 26% 22% 0% 0% 0% 28%
Total - 78% 50% 34% 20% 27% 22% 25% 22% 0% 0% 0% 29%
New NSP Steroid cohort individuals
Female 100% 88% 82% 72% 69% 76% 48% 87% 100% 50% 100% 100% 73%
Male 92% 84% 63% 46% 41% 43% 36% 35% 39% 36% 45% 41% 44%
Total 93% 84% 63% 46% 42% 44% 36% 36% 41% 37% 48% 44% 45%
Table 41- Steroid and other IPEDs cohort, new individuals 2017-18, as a proportion of total individuals, by age group
Key: 0-20% 20-40% 40-60% 60-80% 80-100%

108 Integrated Monitoring System Annual Report 2017-18
ANNUAL CLIENT NUMBERS
PWID: Steroid & IPEDs 2013-14 2014-15 2015-16 2016-17 2017-18
Cheshire East 798 1,082 653 825 680
Cheshire West & Chester 920 1,160 625 1,174 1,169
Halton 524 726 626 539 585
Knowsley 297 359 337 427 363
Liverpool 2,149 3,901 2,506 2,940 2,308
Sefton 701 997 583 595 742
St. Helens 1,023 1,871 1,127 922 1,177
Warrington 853 1,213 774 775 801
Wirral 1,048 1,263 890 943 991
Cheshire & Merseyside 7,993 12,395 8,009 9,022 8,700
Table 42 - Steroid and other IPEDs cohort, annual client numbers by local authority, 2013-14 to 2017-18
PREVALENCE ESTIMATES 43
PWID: Steroid & IPEDs 2013-14 2014-15 2015-16 2016-17 2017-18 Cheshire East 2.14 2.89 1.74 2.19 1.79 Cheshire West & Chester 2.78 3.49 1.87 3.50 3.46 Halton 4.16 5.75 4.95 4.25 4.58 Knowsley 2.03 2.45 2.29 2.89 2.44 Liverpool 4.56 8.25 5.24 6.07 4.70 Sefton 2.57 3.64 2.13 2.17 2.70 St. Helens 5.81 10.56 6.35 5.17 6.56 Warrington 4.16 5.88 3.73 3.71 3.82 Wirral 3.27 3.94 2.77 2.94 3.07 Cheshire & Merseyside 3.30 5.10 3.28 3.68 3.52
Table 43 - Steroid and other IPEDs cohort, annual prevalence estimates by local authority, 2013-14 to 2017-18
43 Prevalence (per 1,000 population) is based on the ONS mid-year population estimates for each local authority area. https://www.ons.gov.uk/peoplepopulationandcommunity/populationandmigration/populationestimates/datasets/populationestimatesforukenglandandwalesscotlandandnorthernireland

Integrated Monitoring System Annual Report 2016-17 109
4. BRIEF INTERVENTION: DRUGS OR ALCOHOL (NON-INJECTING CLIENTS)
AGE AND GENDER
0 - 1
7
18 -
19
20 -
24
25 -
29
30 -
34
35 -
39
40 -
44
45 -
49
50 -
54
55 -
59
60 -
64
65 +
Tota
l
Cheshire East Female - - - - - - - - - - - - 0
Male - - - - - - - - - - - - 0 Total - - - - - - - - - - - - 0
Cheshire West & Chester
Female 0.0% 0.0% 0.0% 0.0% 50.0% 0.0% 50.0% 0.0% 0.0% 0.0% 0.0% 0.0% ** Male 0.0% 0.0% 11.1% 33.3% 11.1% 11.1% 11.1% 5.6% 11.1% 5.6% 0.0% 0.0% 18 Total 0.0% 0.0% 10.0% 30.0% 15.0% 10.0% 15.0% 5.0% 10.0% 5.0% 0.0% 0.0% 20
Halton Female 0.0% 1.4% 6.1% 8.9% 12.1% 11.7% 12.1% 16.8% 14.5% 7.0% 4.7% 4.7% 214
Male 0.0% 1.1% 5.3% 8.5% 14.9% 14.9% 12.9% 13.3% 13.8% 6.9% 5.3% 3.0% 435 Total 0.0% 1.2% 5.5% 8.6% 14.0% 13.9% 12.6% 14.5% 14.0% 6.9% 5.1% 3.5% 649
Knowsley Female 0.0% 1.4% 2.8% 10.6% 12.0% 18.9% 15.7% 15.2% 10.6% 7.4% 3.2% 2.3% 217
Male 0.2% 0.7% 7.0% 9.8% 13.3% 9.8% 13.1% 18.2% 13.1% 8.8% 4.2% 1.8% 457 Total 0.1% 0.9% 5.6% 10.1% 12.9% 12.8% 13.9% 17.2% 12.3% 8.3% 3.9% 1.9% 674
Liverpool Female 26.0% 4.0% 4.9% 3.9% 5.2% 7.5% 8.9% 9.9% 8.8% 7.5% 5.4% 8.1% 1,644
Male 18.8% 3.6% 3.5% 3.6% 5.8% 7.1% 9.2% 11.3% 9.7% 9.0% 6.2% 12.3% 2,725 Total 21.5% 3.8% 4.1% 3.7% 5.6% 7.3% 9.1% 10.7% 9.3% 8.4% 5.9% 10.7% 4,369
Sefton Female 21.2% 6.1% 6.1% 3.0% 9.1% 21.2% 6.1% 9.1% 6.1% 6.1% 3.0% 3.0% 33
Male 4.7% 0.0% 4.7% 4.7% 2.3% 16.3% 18.6% 20.9% 20.9% 4.7% 2.3% 0.0% 43 Total 11.8% 2.6% 5.3% 3.9% 5.3% 18.4% 13.2% 15.8% 14.5% 5.3% 2.6% 1.3% 76
St. Helens Female 0.3% 0.0% 7.5% 4.1% 14.2% 12.9% 11.3% 17.3% 10.4% 6.0% 7.9% 8.2% 318
Male 0.0% 0.7% 6.0% 8.6% 10.4% 10.8% 17.8% 15.0% 11.7% 9.5% 5.1% 4.2% 546 Total 0.1% 0.5% 6.6% 6.9% 11.8% 11.6% 15.4% 15.9% 11.2% 8.2% 6.1% 5.7% 864
Warrington Female 14.8% 1.1% 3.1% 5.4% 7.4% 7.1% 9.1% 9.4% 12.3% 11.7% 6.8% 11.7% 351
Male 9.2% 2.0% 5.8% 11.0% 9.2% 11.0% 11.0% 10.4% 9.2% 8.1% 5.8% 7.2% 346 Total 12.1% 1.6% 4.4% 8.2% 8.3% 9.0% 10.0% 9.9% 10.8% 9.9% 6.3% 9.5% 697
Wirral Female 54.2% 1.7% 5.1% 1.7% 8.5% 6.8% 5.1% 8.5% 5.1% 1.7% 0.0% 1.7% 59
Male 15.3% 4.0% 4.4% 9.7% 14.1% 11.3% 7.3% 12.5% 6.5% 5.2% 5.2% 4.4% 248 Total 22.8% 3.6% 4.6% 8.1% 13.0% 10.4% 6.8% 11.7% 6.2% 4.6% 4.2% 3.9% 307
Brief Interv cohort - All individuals
Female 18.5% 2.7% 5.0% 4.9% 7.6% 9.4% 9.8% 11.6% 9.8% 7.6% 5.5% 7.7% 2,816 Male 12.2% 2.7% 4.5% 6.1% 8.5% 9.0% 11.0% 12.6% 10.4% 8.5% 5.7% 8.7% 4,785 Total 14.5% 2.7% 4.7% 5.7% 8.2% 9.2% 10.6% 12.2% 10.2% 8.2% 5.6% 8.3% 7,601
Table 44 - Drugs or alcohol (non-injecting) cohort by age and gender, 2017-18
Key: Between 10 and 20% Greater than 20%

110 Integrated Monitoring System Annual Report 2017-18
ETHNICITY
Ches
hire
Eas
t
Ches
hire
Wes
t &
Che
ster
Halto
n
Know
sley
Live
rpoo
l
Seft
on
St. H
elen
s
War
ringt
on
Wirr
al
Brie
f Int
erv
coho
rt -
All
indi
vidu
als
White British - 100.0% 95.4% 98.2% 89.9% 93.4% 97.1% 95.1% 98.7% 93.5%
White Irish - 0.0% 1.0% 0.1% 1.0% 1.3% 1.1% 0.9% 0.0% 0.8%
Other White - 0.0% 2.9% 0.6% 1.3% 1.3% 1.3% 1.9% 1.0% 1.4%
Other White - Polish - 0.0% 0.0% 0.0% 0.5% 0.0% 0.1% 0.4% 0.0% 0.3%
Other White - Czech - 0.0% 0.0% 0.0% 0.2% 0.0% 0.1% 0.0% 0.0% 0.1%
Other White - Slovakian
- 0.0% 0.0% 0.0% 0.1% 0.0% 0.0% 0.0% 0.0% 0.1%
White and Black Caribbean
- 0.0% 0.0% 0.0% 1.6% 0.0% 0.1% 0.1% 0.0% 0.8%
White and Black African
- 0.0% 0.0% 0.1% 0.7% 1.3% 0.0% 0.0% 0.3% 0.4%
White and Asian - 0.0% 0.0% 0.0% 0.2% 0.0% 0.0% 0.0% 0.0% 0.1%
Other Mixed - 0.0% 0.0% 0.1% 1.3% 0.0% 0.0% 0.9% 0.0% 0.7%
Indian - 0.0% 0.0% 0.1% 0.1% 0.0% 0.0% 0.3% 0.0% 0.1%
Pakistani - 0.0% 0.0% 0.0% 0.1% 0.0% 0.0% 0.0% 0.0% 0.1%
Other Asian - 0.0% 0.2% 0.0% 0.1% 0.0% 0.0% 0.1% 0.0% 0.1%
Caribbean - 0.0% 0.2% 0.0% 0.0% 0.0% 0.0% 0.0% 0.0% 0.0%
African - 0.0% 0.3% 0.1% 0.3% 0.0% 0.0% 0.0% 0.0% 0.2%
Other Black - 0.0% 0.2% 0.0% 1.4% 1.3% 0.1% 0.0% 0.0% 0.7%
Other Black - Somali - 0.0% 0.0% 0.0% 0.1% 0.0% 0.0% 0.0% 0.0% 0.1%
Chinese - 0.0% 0.0% 0.0% 0.1% 1.3% 0.0% 0.0% 0.0% 0.1%
Other - 0.0% 0.0% 0.4% 0.5% 0.0% 0.1% 0.3% 0.0% 0.3%
Other - Gypsy - 0.0% 0.0% 0.0% 0.0% 0.0% 0.0% 0.0% 0.0% 0.0%
Other - Arab - 0.0% 0.0% 0.0% 0.2% 0.0% 0.0% 0.0% 0.0% 0.1%
Table 45 - Drugs or alcohol (non-injecting) cohort, percentage split by ethnicity, 2017-18 44
Key: Between 0 and 1% Between 1 and 10% Greater than 10%
44 Percentage split is calculated as the proportion of only those clients who stated an ethnicity.

Integrated Monitoring System Annual Report 2016-17 111
PRIMARY SUBSTANCE
Ches
hire
Eas
t
Ches
hire
Wes
t &
Che
ster
Halto
n
Know
sley
Live
rpoo
l
Seft
on
St. H
elen
s
War
ringt
on
Wirr
al
Brie
f Int
erv
coho
rt -
All
indi
vidu
als
Alcohol - 0 344 297 2,737 32 298 225 49 3,939 - 0.0% 54.1% 44.1% 69.2% 46.4% 41.4% 59.1% 43.8% 60.6%
Amphetamines (excl Ecstasy)
- 0 7 8 13 ** 6 ** 0 35 - 0.0% 1.1% 1.2% 0.3% 1.4% 0.8% 0.5% 0.0% 0.5%
Anti-depressants - 0 0 0 ** 0 0 0 0 ** - 0.0% 0.0% 0.0% 0.1% 0.0% 0.0% 0.0% 0.0% 0.0%
Barbiturates - 0 0 0 ** 0 0 0 0 ** - 0.0% 0.0% 0.0% 0.0% 0.0% 0.0% 0.0% 0.0% 0.0%
Benzodiazepines - 0 0 ** 7 0 ** ** 0 13 - 0.0% 0.0% 0.1% 0.2% 0.0% 0.4% 0.5% 0.0% 0.2%
Cannabis - 0 43 75 225 9 40 50 39 479 - 0.0% 6.8% 11.1% 5.7% 13.0% 5.6% 13.1% 34.8% 7.4%
Cocaine (excl Crack) - 0 31 101 107 6 13 36 5 294 - 0.0% 4.9% 15.0% 2.7% 8.7% 1.8% 9.4% 4.5% 4.5%
Crack Cocaine - 0 10 5 20 ** 12 5 0 55 - 0.0% 1.6% 0.7% 0.5% 4.3% 1.7% 1.3% 0.0% 0.8%
Ecstasy - 0 ** 0 19 ** 0 0 ** 24 - 0.0% 0.2% 0.0% 0.5% 1.4% 0.0% 0.0% 2.7% 0.4%
Hallucinogens - 0 0 ** ** 0 0 0 0 6 - 0.0% 0.0% 0.3% 0.1% 0.0% 0.0% 0.0% 0.0% 0.1%
Heroin - ** 154 146 74 7 208 45 ** 637 - 37.5% 24.2% 21.7% 1.9% 10.1% 28.9% 11.8% 2.7% 9.8%
Methadone - 0 20 13 ** 0 23 ** 0 62 - 0.0% 3.1% 1.9% 0.1% 0.0% 3.2% 0.8% 0.0% 1.0%
Novel Psychoactive Substances
- 0 ** 0 ** 0 0 ** 0 7 - 0.0% 0.2% 0.0% 0.1% 0.0% 0.0% 1.0% 0.0% 0.1%
Other Drugs - 0 0 ** ** 0 5 ** 0 13 - 0.0% 0.0% 0.3% 0.1% 0.0% 0.7% 0.5% 0.0% 0.2%
Other Opiates - 0 13 18 ** 0 ** 6 0 43 - 0.0% 2.0% 2.7% 0.1% 0.0% 0.6% 1.6% 0.0% 0.7%
Prescription Drugs - 0 9 6 ** 0 ** 0 ** 22 - 0.0% 1.4% 0.9% 0.1% 0.0% 0.3% 0.0% 0.9% 0.3%
Solvents - 0 0 0 ** 0 0 0 0 ** - 0.0% 0.0% 0.0% 0.1% 0.0% 0.0% 0.0% 0.0% 0.0%
Steroids & IPEDS - 5 ** 0 ** 0 ** ** 5 20 - 62.5% 0.5% 0.0% 0.1% 0.0% 0.3% 0.3% 4.5% 0.3%
No Substance - 0 0 0 727 10 104 0 7 848 - 0.0% 0.0% 0.0% 18.4% 14.5% 14.4% 0.0% 6.3% 13.0%
Effected by some-one else’s use 45
- 0 0 0 0 0 87 95 0 182 - 0.0% 0.0% 0.0% 0.0% 0.0% 10.1% 13.6% 0.0% 2.4%
Not Stated 46 - 12 13 0 411 7 57 221 195 916 - 60.0% 2.0% 0.0% 9.4% 9.2% 6.6% 31.7% 63.5% 12.1%
Total Individuals 0 20 649 674 4,369 76 864 697 307 7,601 Table 46 - Drugs or alcohol (non-injecting) cohort by primary substance and local authority, 2017-18
45 Individuals receiving interventions and support related to the substance use of others, such as family members or close friends. 46 Percentages shown by substance excludes those individuals effected by some-one else’s use and those where the substance was not stated. Percentages shown for ‘some-one else’s use’ and ‘not stated’ is the percentage of all individuals.

112 Integrated Monitoring System Annual Report 2017-18
SECONDARY SUBSTANCE
Secondary Substance 47
Primary Substance
Alco
hol
Amph
etam
ines
(exc
l Be
nzo-
diaz
epin
es
Cann
abis
Coca
ine
(exc
l Cr
ack)
Crac
k Co
cain
e
Ecst
asy
Hero
in
Met
hado
ne
Oth
er D
rugs
48 Pr
escr
iptio
n Dr
ugs
Not
Sta
ted
Tota
l
Alcohol 0 5 ** 45 83 14 ** 12 5 16 ** 3,751 3,939
0.0% 2.7% 1.1% 23.9% 44.1% 7.4% 1.1% 6.4% 2.7% 8.5% 2.1% 95.2% Amphetamines (excl Ecstasy)
5 0 ** ** ** 0 0 0 0 ** 0 23 35 41.7% 0.0% 8.3% 16.7% 16.7% 0.0% 0.0% 0.0% 0.0% 16.7% 0.0% 65.7%
Anti-depressants 0 0 ** 0 0 0 0 0 0 0 0 ** **
0.0% 0.0% 100% 0.0% 0.0% 0.0% 0.0% 0.0% 0.0% 0.0% 0.0% 66.7%
Barbiturates 0 0 0 0 0 0 0 0 0 0 0 ** **
0.0% 0.0% 0.0% 0.0% 0.0% 0.0% 0.0% 0.0% 0.0% 0.0% 0.0% 100%
Benzodiazepines ** 0 0 0 0 0 0 0 0 ** 0 9 13
50.0% 0.0% 0.0% 0.0% 0.0% 0.0% 0.0% 0.0% 0.0% 50.0% 0.0% 69.2%
Cannabis 20 0 ** 0 11 0 ** 0 0 ** 0 441 479
52.6% 0.0% 7.9% 0.0% 28.9% 0.0% 2.6% 0.0% 0.0% 7.9% 0.0% 92.1%
Cocaine (excl Crack) 44 ** 0 18 0 ** ** ** 0 5 0 219 294
58.7% 4.0% 0.0% 24.0% 0.0% 1.3% 2.7% 2.7% 0.0% 6.7% 0.0% 74.5%
Crack Cocaine 5 ** 0 5 ** 0 0 10 0 0 ** 32 55
21.7% 4.3% 0.0% 21.7% 4.3% 0.0% 0.0% 43.5% 0.0% 0.0% 4.3% 58.2%
Ecstasy ** 0 0 0 ** ** 0 0 0 0 0 21 24
33.3% 0.0% 0.0% 0.0% 33.3% 33.3% 0.0% 0.0% 0.0% 0.0% 0.0% 87.5%
Hallucinogens 0 0 0 0 0 0 0 0 0 0 0 6 6
0.0% 0.0% 0.0% 0.0% 0.0% 0.0% 0.0% 0.0% 0.0% 0.0% 0.0% 100%
Heroin 13 0 ** ** ** 34 0 0 ** 0 ** 580 637
22.8% 0.0% 1.8% 3.5% 7.0% 59.6% 0.0% 0.0% 3.5% 0.0% 1.8% 91.1%
Methadone ** 0 ** 0 0 0 0 ** 0 0 0 56 62
16.7% 0.0% 16.7% 0.0% 0.0% 0.0% 0.0% 66.7% 0.0% 0.0% 0.0% 90.3% Novel Psychoactive Substances
0 0 0 0 0 0 0 0 0 0 0 7 7 0.0% 0.0% 0.0% 0.0% 0.0% 0.0% 0.0% 0.0% 0.0% 0.0% 0.0% 100%
Other Drugs 0 0 0 0 0 0 0 0 0 ** 0 12 13
0.0% 0.0% 0.0% 0.0% 0.0% 0.0% 0.0% 0.0% 0.0% 100% 0.0% 92.3%
Other Opiates 0 0 ** 0 0 0 0 0 0 ** 0 41 43
0.0% 0.0% 50.0% 0.0% 0.0% 0.0% 0.0% 0.0% 0.0% 50.0% 0.0% 95.3%
Prescription Drugs 0 0 0 0 0 0 0 0 0 ** 0 20 22
0.0% 0.0% 0.0% 0.0% 0.0% 0.0% 0.0% 0.0% 0.0% 100% 0.0% 90.9%
Solvents 0 0 0 0 0 0 0 0 0 0 0 ** **
0.0% 0.0% 0.0% 0.0% 0.0% 0.0% 0.0% 0.0% 0.0% 0.0% 0.0% 100%
Steroids & PIED 0 0 0 0 0 0 0 0 0 0 0 20 20
0.0% 0.0% 0.0% 0.0% 0.0% 0.0% 0.0% 0.0% 0.0% 0.0% 0.0% 100%
No Substance - - - - - - - - - - - 848 848 - - - - - - - - - - - 100%
Someone else - - - - - - - - - - - 182 182 - - - - - - - - - - - 100%
Not Stated - - - - - - - - - - - 916 916 - - - - - - - - - - - 100%
Total 91 9 10 72 102 50 5 28 7 32 6 7,189 7,601
22.1% 2.2% 2.4% 17.5% 24.8% 12.1% 1.2% 6.8% 1.7% 7.8% 1.5% 94.6% 100% Table 47 - Drugs or alcohol (non-injecting) cohort by primary and secondary substance, 2017-18
47 Percentages shown by substance excludes those individuals where the substance was not stated. Percentages shown for ‘Not Stated’ is the percentage of all individuals. 48 The figures shown for the secondary substance ‘Other Drugs’ includes substances within the following drug groups; anti-depressants, hallucinogens, novel psychoactive substances (NPS), other opiates, solvents, steroids & IPEDs, and other drugs.
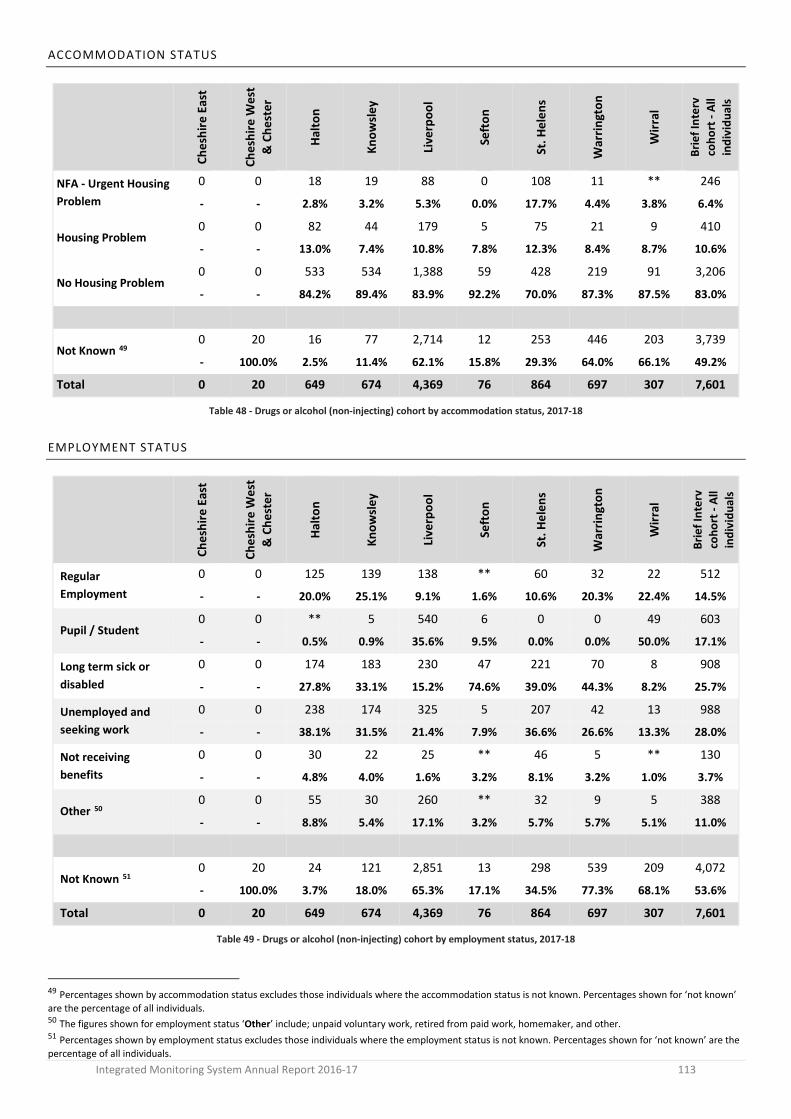
Integrated Monitoring System Annual Report 2016-17 113
ACCOMMODATION STATUS
Ches
hire
Eas
t
Ches
hire
Wes
t &
Che
ster
Halto
n
Know
sley
Live
rpoo
l
Seft
on
St. H
elen
s
War
ringt
on
Wirr
al
Brie
f Int
erv
coho
rt -
All
indi
vidu
als
NFA - Urgent Housing Problem
0 0 18 19 88 0 108 11 ** 246
- - 2.8% 3.2% 5.3% 0.0% 17.7% 4.4% 3.8% 6.4%
Housing Problem 0 0 82 44 179 5 75 21 9 410
- - 13.0% 7.4% 10.8% 7.8% 12.3% 8.4% 8.7% 10.6%
No Housing Problem 0 0 533 534 1,388 59 428 219 91 3,206
- - 84.2% 89.4% 83.9% 92.2% 70.0% 87.3% 87.5% 83.0%
Not Known 49 0 20 16 77 2,714 12 253 446 203 3,739
- 100.0% 2.5% 11.4% 62.1% 15.8% 29.3% 64.0% 66.1% 49.2%
Total 0 20 649 674 4,369 76 864 697 307 7,601
Table 48 - Drugs or alcohol (non-injecting) cohort by accommodation status, 2017-18
EMPLOYMENT STATUS
Ches
hire
Eas
t
Ches
hire
Wes
t &
Che
ster
Halto
n
Know
sley
Live
rpoo
l
Seft
on
St. H
elen
s
War
ringt
on
Wirr
al
Brie
f Int
erv
coho
rt -
All
indi
vidu
als
Regular Employment
0 0 125 139 138 ** 60 32 22 512
- - 20.0% 25.1% 9.1% 1.6% 10.6% 20.3% 22.4% 14.5%
Pupil / Student 0 0 ** 5 540 6 0 0 49 603
- - 0.5% 0.9% 35.6% 9.5% 0.0% 0.0% 50.0% 17.1%
Long term sick or disabled
0 0 174 183 230 47 221 70 8 908
- - 27.8% 33.1% 15.2% 74.6% 39.0% 44.3% 8.2% 25.7%
Unemployed and seeking work
0 0 238 174 325 5 207 42 13 988
- - 38.1% 31.5% 21.4% 7.9% 36.6% 26.6% 13.3% 28.0%
Not receiving benefits
0 0 30 22 25 ** 46 5 ** 130
- - 4.8% 4.0% 1.6% 3.2% 8.1% 3.2% 1.0% 3.7%
Other 50 0 0 55 30 260 ** 32 9 5 388
- - 8.8% 5.4% 17.1% 3.2% 5.7% 5.7% 5.1% 11.0%
Not Known 51 0 20 24 121 2,851 13 298 539 209 4,072
- 100.0% 3.7% 18.0% 65.3% 17.1% 34.5% 77.3% 68.1% 53.6%
Total 0 20 649 674 4,369 76 864 697 307 7,601
Table 49 - Drugs or alcohol (non-injecting) cohort by employment status, 2017-18
49 Percentages shown by accommodation status excludes those individuals where the accommodation status is not known. Percentages shown for ‘not known’ are the percentage of all individuals. 50 The figures shown for employment status ‘Other’ include; unpaid voluntary work, retired from paid work, homemaker, and other. 51 Percentages shown by employment status excludes those individuals where the employment status is not known. Percentages shown for ‘not known’ are the percentage of all individuals.

114 Integrated Monitoring System Annual Report 2017-18
PARENTAL STATUS
Ches
hire
Eas
t
Ches
hire
Wes
t &
Che
ster
Halto
n
Know
sley
Live
rpoo
l
Seft
on
St. H
elen
s
War
ringt
on
Wirr
al
Brie
f Int
erv
coho
rt -
All
indi
vidu
als
All of the children live with client
0 0 106 94 54 ** 80 48 11 392
- - 16.8% 14.3% 4.6% 6.8% 11.8% 12.7% 10.8% 10.8%
Some of the children live with client
0 0 22 25 15 ** 16 ** ** 83
- - 3.5% 3.8% 1.3% 3.4% 2.4% 0.5% 2.9% 2.3%
None of the children live with client
0 0 167 167 235 18 170 103 7 853
- - 26.4% 25.4% 20.1% 30.5% 25.1% 27.2% 6.9% 23.5%
Not a parent of children under 18
0 0 336 372 844 35 409 225 80 2,271
- - 53.2% 56.5% 72.0% 59.3% 60.5% 59.4% 78.4% 62.6%
Client declined to answer
0 0 ** 0 24 0 ** ** ** 28
- - 0.2% 0.0% 2.0% 0.0% 0.1% 0.3% 1.0% 0.8%
Not Known 52 0 20 17 16 3,197 17 188 318 205 3,974
- 100.0% 2.6% 2.4% 73.2% 22.4% 21.8% 45.6% 66.8% 52.3%
Total 0 20 649 674 4,369 76 864 697 307 7,601
Table 50 - Drugs or alcohol (non-injecting) cohort by parental status, 2017-18
52 Percentages shown by parental status excludes those individuals where the parental status is not known. Percentages shown for ‘not known’ are the percentage of all individuals.

Integrated Monitoring System Annual Report 2016-17 115
DISABILITIES OR CHRONIC CONDITIONS
Ches
hire
Eas
t
Ches
hire
Wes
t &
Che
ster
Halto
n
Know
sley
Live
rpoo
l
Seft
on
St. H
elen
s
War
ringt
on
Wirr
al
Brie
f Int
erv
coho
rt -
All
indi
vidu
als
Individuals with chronic condition or disability
0 0 ** ** 333 47 164 0 10 545
- - 100.0% 100.0% 37.5% 81.0% 75.2% - 20.8% 45.3%
No chronic conditions or disabilities
0 0 0 0 556 11 54 0 38 657
- - 0.0% 0.0% 62.5% 19.0% 24.8% - 79.2% 54.7%
Not Stated 53 0 20 648 671 3,480 18 646 697 259 6,399
- 100.0% 99.8% 99.6% 79.7% 23.7% 74.8% 100.0% 84.4% 84.2%
Total 0 20 649 674 4,369 76 864 697 307 7,601
Recorded conditions: Arthritis - - - - ** - 10 - - 12Asthma - - - - 8 ** ** - - 11Cancer - - - - - - - - ** ** Chronic Fatigue Syndrome (ME)
- - - - ** - - - - **
Chronic Pain - - - - 7 ** ** - - 13Chronic Pancreatitis - - - - - - - - - -Colitis/Crohn’s Disease - - - - ** - - - - ** COPD - - - - 14 ** ** - ** 20 Dementia - - - - ** - - - - ** Depression - - ** ** 98 6 59 - - 161Diabetes - - - - 5 - - - - 5Epilepsy - - - - 5 ** ** - ** 9 General learning difficul - - - - ** ** ** - - **Hearing impairment - - - - ** - - - - **Heart disease - - - ** 5 ** - - - 7Hypertension/blood pres - - - - ** - ** - - **Kidney disease - - - - - - - - - -Liver disease / Cirrhosis - - - - 18 ** - - - 19 Manual dexterity - - - - - - ** - - **Mental health - - - - 76 ** 50 - - 128Mental ill health - - - ** 40 23 21 - - 82Mobility issues - - - - 13 ** ** - - 15Multiple Sclerosis (MS) - - - - ** - - - - **Neurological & Digestive - - - - ** - - - - **Obesity - - - - ** - - - - **Other - - - - 12 - 6 - ** 22Parkinson’s - - - - ** - - - - **Specific learning difficul - - - - 6 - ** - ** 11Speech impairment - - - - ** - - - - **Stroke - - - - ** ** - - - **Visual impairment - - - - ** - ** - - **
Table 51 - Drugs or alcohol (non-injecting) cohort, individuals stating any disability or chronic condition, 2017-18
53 Percentages shown is for those clients where a disability or chronic condition record was completed. Percentages shown for ‘not known’ are the percentage of all individuals.

116 Integrated Monitoring System Annual Report 2017-18
LOCAL AUTHORITY OF RESIDENCE
Local Authority of service provider
Local Authority of residence
Ches
hire
Eas
t
Ches
hire
Wes
t &
Che
ster
Halto
n
Know
sley
Live
rpoo
l
Seft
on
St. H
elen
s
War
ringt
on
Wirr
al
Tota
l
Cheshire East 0 0 0 0 ** 0 0 0 0 ** Cheshire West & Chester 0 ** ** 0 6 0 0 ** 0 11 Halton 0 0 615 0 7 0 ** ** 0 621 Knowsley 0 0 ** 605 102 0 7 0 0 682 Liverpool 0 0 0 37 1,601 ** ** ** 0 1,639 Sefton 0 0 0 ** 234 64 0 ** 0 292 St. Helens 0 0 0 12 8 0 631 0 0 650 Warrington 0 0 0 0 ** 0 ** 347 0 352 Wirral 0 0 0 0 35 0 0 0 85 120 Flintshire 0 0 0 0 0 0 0 0 0 0 Isle of Man 0 0 0 0 0 0 0 0 0 0 Manchester 0 0 0 0 0 0 0 0 0 0 Newcastle-under-Lyme 0 0 0 0 0 0 0 0 0 0 Preston 0 0 0 0 ** 0 0 0 0 ** Salford 0 0 0 0 0 0 0 0 0 0 Staffordshire Moorlands 0 0 0 0 0 0 0 0 0 0 Stockport 0 0 0 0 0 0 0 0 0 0 Stoke-on-Trent 0 0 0 0 ** 0 0 0 0 ** Trafford 0 0 0 0 0 0 0 0 0 0 West Lancashire 0 0 0 0 5 0 0 0 0 5 Wigan 0 0 0 0 0 0 ** ** 0 ** Others 0 0 0 0 10 0 0 0 0 10 Not Stated 0 18 31 17 2,353 8 220 343 222 3,212 Total 0 20 649 674 4,369 76 864 697 307 7,601
Table 52 - Drugs or alcohol (non-injecting) cohort, individuals by local authority of residence and local authority of service provider, 2017-18
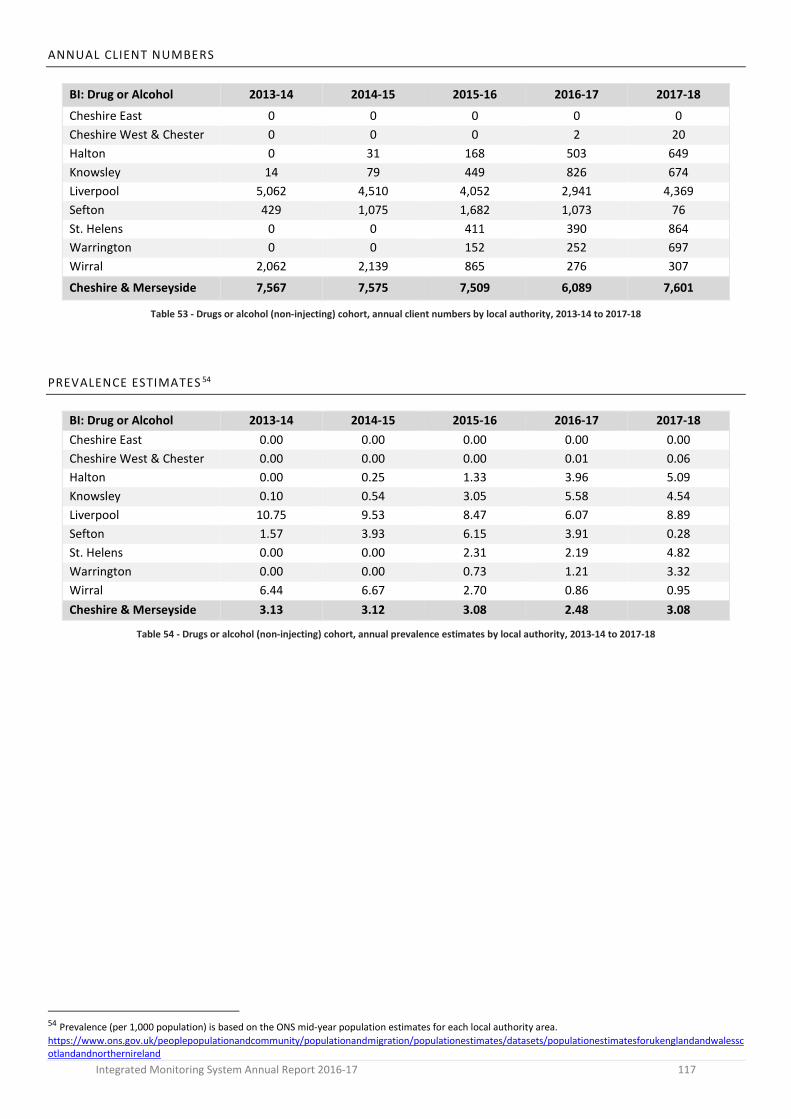
Integrated Monitoring System Annual Report 2016-17 117
ANNUAL CLIENT NUMBERS
BI: Drug or Alcohol 2013-14 2014-15 2015-16 2016-17 2017-18
Cheshire East 0 0 0 0 0 Cheshire West & Chester 0 0 0 2 20 Halton 0 31 168 503 649 Knowsley 14 79 449 826 674 Liverpool 5,062 4,510 4,052 2,941 4,369 Sefton 429 1,075 1,682 1,073 76 St. Helens 0 0 411 390 864 Warrington 0 0 152 252 697 Wirral 2,062 2,139 865 276 307
Cheshire & Merseyside 7,567 7,575 7,509 6,089 7,601
Table 53 - Drugs or alcohol (non-injecting) cohort, annual client numbers by local authority, 2013-14 to 2017-18
PREVALENCE ESTIMATES 54
BI: Drug or Alcohol 2013-14 2014-15 2015-16 2016-17 2017-18 Cheshire East 0.00 0.00 0.00 0.00 0.00 Cheshire West & Chester 0.00 0.00 0.00 0.01 0.06 Halton 0.00 0.25 1.33 3.96 5.09 Knowsley 0.10 0.54 3.05 5.58 4.54 Liverpool 10.75 9.53 8.47 6.07 8.89 Sefton 1.57 3.93 6.15 3.91 0.28 St. Helens 0.00 0.00 2.31 2.19 4.82 Warrington 0.00 0.00 0.73 1.21 3.32 Wirral 6.44 6.67 2.70 0.86 0.95 Cheshire & Merseyside 3.13 3.12 3.08 2.48 3.08
Table 54 - Drugs or alcohol (non-injecting) cohort, annual prevalence estimates by local authority, 2013-14 to 2017-18
54 Prevalence (per 1,000 population) is based on the ONS mid-year population estimates for each local authority area. https://www.ons.gov.uk/peoplepopulationandcommunity/populationandmigration/populationestimates/datasets/populationestimatesforukenglandandwalesscotlandandnorthernireland

118 Integrated Monitoring System Annual Report 2017-18
AFFECTED OTHERS - SUPPORT SERVICES FOR FAMILY OR FRIENDS AFFECTED BY SUBSTANCE USE
Not
stated No substance
used Someone else’s
use Total Individuals
Cheshire East 0 0 0 0 Cheshire West & Chester 12 0 0 12 Halton 13 0 0 13 Knowsley 0 0 0 0 Liverpool 411 727 0 1,138 Sefton 7 10 0 17 St. Helens 57 104 87 248 Warrington 221 0 95 316 Wirral 195 7 0 202
All IMS individuals 916 848 182
1,946 47.1% 43.6% 9.4%
Table 55 - Drugs or alcohol (non-injecting) cohort, individuals with no recorded substance, 2017-18
0 - 17
18 - 19
20 - 24
25 - 29
30 - 34
35 - 39
40 - 44
45 - 49
50 - 54
55 - 59
60 - 64 65 + Total
Not stated
Female 113 32 33 14 13 19 23 17 27 20 15 48
374 12.3% 3.5% 3.6% 1.5% 1.4% 2.1% 2.5% 1.9% 2.9% 2.2% 1.6% 5.2%
Male 219 32 28 28 40 32 23 36 25 26 22 31
542 23.9% 3.5% 3.1% 3.1% 4.4% 3.5% 2.5% 3.9% 2.7% 2.8% 2.4% 3.4%
Total 332 64 61 42 53 51 46 53 52 46 37 79
916 36.2% 7.0% 6.7% 4.6% 5.8% 5.6% 5.0% 5.8% 5.7% 5.0% 4.0% 8.6%
No substance
Female 309 20 36 9 10 9 7 9 ** ** 9 **
426 36.4% 2.4% 4.2% 1.1% 1.2% 1.1% 0.8% 1.1% 0.2% 0.4% 1.1% 0.4%
Male 218 31 48 11 20 19 12 23 12 16 ** 9
422 25.7% 3.7% 5.7% 1.3% 2.4% 2.2% 1.4% 2.7% 1.4% 1.9% 0.4% 1.1%
Total 527 51 84 20 30 28 19 32 14 19 12 12
848 62.1% 6.0% 9.9% 2.4% 3.5% 3.3% 2.2% 3.8% 1.7% 2.2% 1.4% 1.4%
Someone else’s use
Female 10 0 ** ** 10 9 9 16 22 17 15 28
142 5.5% 0.0% 2.2% 1.1% 5.5% 4.9% 4.9% 8.8% 12.1% 9.3% 8.2% 15.4%
Male ** 0 0 ** 0 0 ** ** ** 8 5 14
40 1.6% 0.0% 0.0% 1.1% 0.0% 0.0% 1.1% 2.2% 1.1% 4.4% 2.7% 7.7%
Total 13 0 ** ** 10 9 11 20 24 25 20 42
182 7.1% 0.0% 2.2% 2.2% 5.5% 4.9% 6.0% 11.0% 13.2% 13.7% 11.0% 23.1%
Table 56 - Drugs or alcohol (non-injecting) cohort, individuals with no recorded substance, by age and gender, 2017-18

Integrated Monitoring System Annual Report 2016-17 119
5. INTEGRATED MONITORING SYSTEM - ACTIVITY (ALL CLIENTS)
INTERVENTIONS
Ches
hire
Eas
t
Ches
hire
Wes
t &
Che
ster
Halto
n
Know
sley
Live
rpoo
l
Seft
on
St. H
elen
s
War
ringt
on
Wirr
al
All I
MS
Number of individuals 7 1,034 1,206 895 4,832 441 1,380 986 716 11,393
Interventions delivered 55 7 2,205 1,942 1,332 15,393 850 8,661 3,625 1,012 35,027
Average of interventions per person
1.0 2.1 1.6 1.5 3.2 1.9 6.3 3.7 1.4 3.1
Table 57 - All IMS individuals, interventions delivered, 2017-18
Intervention categories
Ches
hire
Eas
t
Ches
hire
Wes
t &
Che
ster
Halto
n
Know
sley
Live
rpoo
l
Seft
on
St. H
elen
s
War
ringt
on
Wirr
al
All I
MS
Brief Intervention 7 683 1,708 1,226 13,395 784 7,895 2,254 972 28,924
Advice & Information 1,566 309 146 2,312 80 801 1,569 48 6,831
Table 58 - All IMS individuals, intervention categories recorded, 2017-18 56
55 In this report the total of interventions delivered has been counted as a maximum of one intervention per individual per day, therefore these figures may not be directly comparable with previous reports. 56 Where both intervention categories are recorded for a client on the same date these will be counted once in Table 56 but separately in Table 57.

120 Integrated Monitoring System Annual Report 2017-18
Intervention types Ch
eshi
re E
ast
Ches
hire
Wes
t &
Che
ster
Halto
n
Know
sley
Live
rpoo
l
Seft
on
St. H
elen
s
War
ringt
on
Wirr
al
All I
MS
Alcohol brief intervention - - - 3 3,352 - - 3 130 3,488
Anabolic steroid advice - 702 169 4 132 24 51 4 250 1,336
Assessment, review, or 1 to 1 counselling
- - - - 1,181 3 240 1,398 82 2,904
Basic needs & personal care - - - - - - 7,142 - - 7,142
BBV screening, or advice - 4 - 6 3 16 6 - 3 38
Benefits, debt or financial advice
- - - - 47 1 75 - - 123
Creative session, or other activities
- - - 19 7,445 2 1 1 2 7,470
Detox and rehabilitation - - 1 3 535 - 1 - 1 541
Drug & alcohol advice - - - - 1,075 5 - 6 24 1,110
Education, training, or employment support
- 11 178 33 650 2 360 41 226 1,501
Family support - 2 54 41 89 - 140 27 8 361
GP, dentist, or other health access
- - - - 132 - 42 - - 174
Group session - - - - 213 - 3 159 - 375
Harm reduction advice: general
7 1,161 171 224 982 700 222 249 395 4,111
Harm reduction: safer drug use or injecting advice
- 579 608 137 32 453 205 300 403 2,717
Health and wellbeing - - 14 13 381 6 143 336 1 894
Housing support - - 54 17 25 4 335 15 8 458
Mental health - - 11 26 37 9 67 5 2 157
Mutual aid, or peer support - - 805 628 260 - 608 163 62 2,526
Other intervention - 6 381 444 1,983 5 974 749 101 4,643
Other support and advice - 35 12 34 924 8 754 1,278 9 3,054
Outreach activity - general - 1 3 - 2,022 - 1 19 11 2,057
Recovery support, and relapse prevention
- - 259 100 1,971 57 520 109 2 3,018
Safeguarding interventions - - - - - - 15 4 - 19
Sexual health - 9 1 6 136 10 3 - 132 297
Smoking cessation - - 1 4 - - 7 - - 12
Transferred or treatment completed
- - - - - - 56 151 - 207
Volunteering, or work experience
- - 1 5 40 - 14 - 1 61
Total count of all intervention types
7 2,510 2,723 1,747 23,647 1,305 11,985 5,017 1,853 50,794
Table 59 - All IMS individuals, intervention types recorded, 2017-18
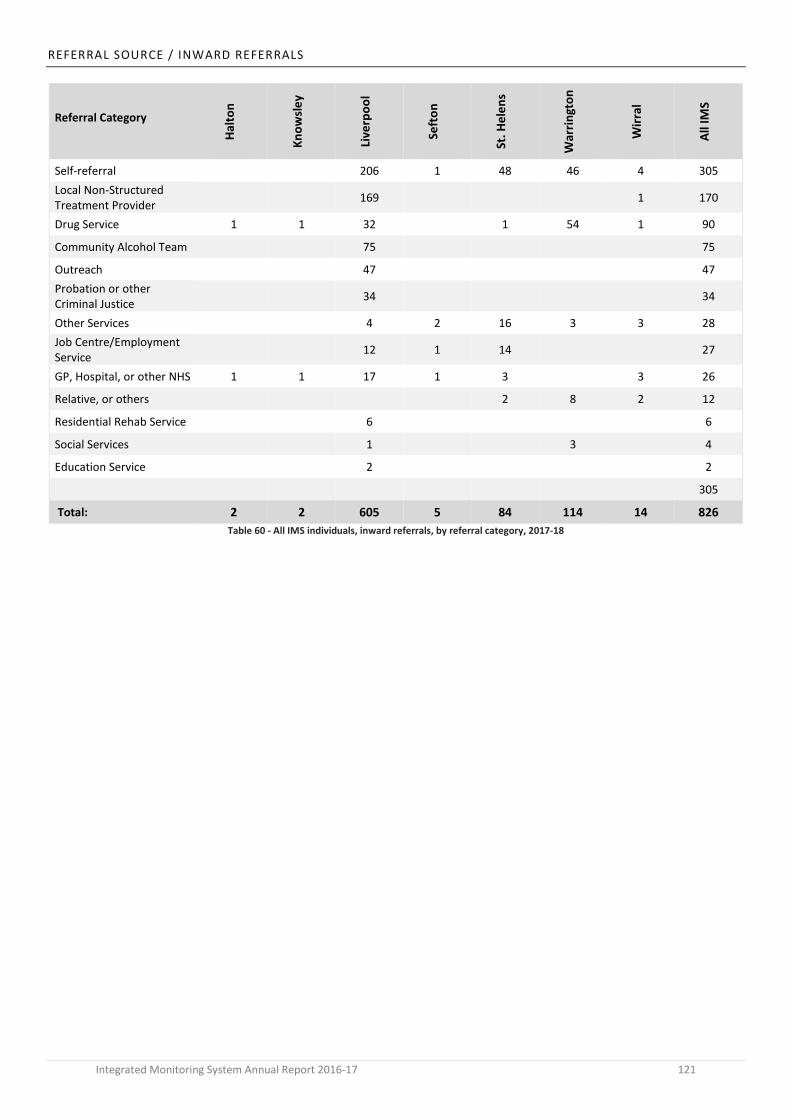
Integrated Monitoring System Annual Report 2016-17 121
REFERRAL SOURCE / INWARD REFERRALS
Referral Category
Halto
n
Know
sley
Live
rpoo
l
Seft
on
St. H
elen
s
War
ringt
on
Wirr
al
All I
MS
Self-referral 206 1 48 46 4 305 Local Non-Structured Treatment Provider 169 1 170
Drug Service 1 1 32 1 54 1 90
Community Alcohol Team 75 75
Outreach 47 47 Probation or other Criminal Justice 34 34
Other Services 4 2 16 3 3 28 Job Centre/Employment Service 12 1 14 27
GP, Hospital, or other NHS 1 1 17 1 3 3 26
Relative, or others 2 8 2 12
Residential Rehab Service 6 6
Social Services 1 3 4
Education Service 2 2
305
Total: 2 2 605 5 84 114 14 826 Table 60 - All IMS individuals, inward referrals, by referral category, 2017-18

122 Integrated Monitoring System Annual Report 2017-18
Referral Type or Organisation Ha
lton
Know
sley
Live
rpoo
l
Seft
on
St. H
elen
s
War
ringt
on
Wirr
al
All I
MS
Addaction 60 1 61
A-PASS 4 4
Bridge House 8 8
Brink of Change 83 83
Brownlow Group Practice 3 3
CGL (Change Grow Live) 1 1 9 1 12
Genie In The Gutter 2 2
Health Service 1 1 2
Hope Centre 14 14
Job Centre Plus 7 7 Liverpool Community Alcohol Service LCAS 75 75
Merseyside Probation Trust 26 26
NHS Services 1 1 7 1 3 2 15
Park View Project 5 5
Sexual Health Clinic 6 6
SHARP 70 70
Spider Project 1 1
St. Helens Carers Centre 1 1
Transforming Choice 1 1
Windsor Clinic 6 6
Young Addaction 4 4
Other Services 228 4 65 114 9 420
Total: 2 2 605 5 84 114 14 826
Table 61 - All IMS individuals, inward referrals, by referral type or organisation, 2017-18

Integrated Monitoring System Annual Report 2016-17 123
ONWARD REFERRALS
Referral Category
Halto
n
Know
sley
Live
rpoo
l
Seft
on
St. H
elen
s
War
ringt
on
Wirr
al
All I
MS
Local Non-Structured Treatment Provider 270 270
GP, Hospital, or other NHS 14 96 7 1 118
Other Services 34 24 4 6 68
Community Alcohol Team 60 60
Drug Service 4 15 3 22
Veteran Support Services 15 15
Residential Rehab Service 14 14 Housing or Homeless Service 1 1 8 2 12
Education Service 6 4 10
Welfare Advice Agency 7 7 Job Centre/Employment Service 3 3 6
Psychological Services 1 1 1 3
Social Services 1 2 3
Total: 15 6 508 50 1 7 21 608
Table 62 - All IMS individuals, onward referrals, by referral category, 2017-18

124 Integrated Monitoring System Annual Report 2017-18
Referral Type or Organisation
Halto
n
Know
sley
Live
rpoo
l
Seft
on
St. H
elen
s
War
ringt
on
Wirr
al
All I
MS
Addaction 9 9
A-PASS 50 50
Bridge House 3 3
Brink of Change 107 107
Brook Place 5 5
Brownlow Group Practice 7 7
CGL (Change Grow Live) 4 1 5
Citizens Advice Bureau 5 5
Dental Practitioner 8 8
Food Bank 19 19
Genie In The Gutter 11 11
Health Service 1 2 3
Housing Support 1 1 2 4
Job Centre Plus 3 3
Joining Forces (Age UK) 5 5
Liverpool Community Alcohol Service LCAS
60 60
Merseycare 3 3
New Start 7 7
NHS Services 13 72 5 1 91
Optician 7 7
Park View Project 1 1
Potential 4 Skills 3 3
Sexual Health Clinic 1 1 2
SHARP 89 89
The Brink 7 7
Transforming Choice 13 13
Veterans UK 10 10
Voluntary Sector 9 1 10
Waves of Hope 1 1
Whitechapel 8 8
Windsor Clinic 5 5
Other Services 1 23 10 1 6 6 47
Total: 15 6 508 50 1 7 21 608
Table 63 - All IMS individuals, onward referrals, by referral type or organisation, 2017-18

Integrated Monitoring System Annual Report 2016-17 125
WELLBEING
Substance Group Low Wellbeing
Medium Wellbeing
High Wellbeing
Total WB Reviews
Alcohol 89 282 73 444
Amphetamines (excl Ecstasy) ** 7 ** 13
Anti-depressants ** **
Barbiturates ** **
Benzodiazepines ** ** 4
Cannabis 15 46 22 83
Cocaine (excl Crack) 29 57 17 103
Crack Cocaine 7 14 ** 23
Ecstasy ** **
Hallucinogens ** ** **
Heroin 62 120 33 215
Methadone ** 5 ** 7
No Substance 15 63 30 108
Novel Psychoactive Substances ** **
Other Drugs ** 5 7
Other Opiates ** ** ** 6
Prescription Drugs ** ** **
Someone else 12 94 28 134
Steroids & PIEDS ** 16 48 66
Not Stated 25 109 90 224
Totals: 269 830 349 1,448
Table 64 - Wellbeing reviews summary, by substance group, 2017-18

126 Integrated Monitoring System Annual Report 2017-18
6. NOVEL PSYCHOACTIVE SUBSTANCES (NPS) & CLUB DRUGS
NPS & 'Club Drugs' Count by Age Group Totals:
0 - 19 20 - 29 30 - 39 40 - 49 50-59 60+ NPS - effects different, or not stated - 8 14 16 2 - 40 NPS - predominantly cannabis 3 5 7 3 1 - 19 NPS - predominantly stimulant - - 1 - 1 - 2 GHB/GBL - 8 5 4 - 4 21 Ketamine 3 9 4 1 1 1 19 Lysergide (LSD) - 2 - - - - 2 MDMA (Ecstasy) 19 12 4 2 1 - 38 Mephedrone - 2 7 3 2 4 18 Methamphetamine - 3 4 4 2 4 17 Volatile Nitrate / Amyl Nitrate (Poppers) - - - 1 - 1 2 Drug – not otherwise specified - 1 - 1 - - 2
Totals: 25 50 46 35 10 14 180
Table 65 - Novel Psychoactive Substances (NPS) & 'Club Drugs' 2017-18

Integrated Monitoring System Annual Report 2016-17 127
APPENDIXES
A. AGENCY BASED NSP SERVICES
A.1. NSP AGENCY ONLY - ALL INDIVIDUALS BY COHORT
Local Authority PWID: Psychoactive Drugs
PWID: Steroid & IPEDs All NSP Individuals
Cheshire East 108 420 528
Cheshire West & Chester 521 920 1,441
Halton 107 578 685
Knowsley 133 198 331
Liverpool 394 249 643
Sefton 179 120 299
St. Helens 434 389 823
Warrington 59 227 286
Wirral 394 811 1,205
Cheshire & Merseyside 2,267 3,885 6,152
Table 66 - Number of individuals using agency based NSP service, by cohort group
Local Authority PWID: Psychoactive Drugs
PWID: Steroid & IPEDs All NSP Individuals
Cheshire East 23.0% 61.8% 45.9%
Cheshire West & Chester 54.0% 78.7% 67.6%
Halton 94.7% 98.8% 98.1%
Knowsley 38.4% 54.5% 46.7%
Liverpool 7.8% 10.8% 8.7%
Sefton 19.7% 16.2% 18.1%
St. Helens 31.5% 33.1% 32.2%
Warrington 12.7% 28.3% 22.6%
Wirral 49.8% 81.8% 67.6%
Cheshire & Merseyside 22.2% 44.7% 32.5%
Table 67 - Proportion of individuals by cohort group who used agency based NSP services

128 Integrated Monitoring System Annual Report 2017-18
A.2. NSP AGENCY ONLY - NEW INDIVIDUALS BY COHORT 57
Local Authority PWID: Psychoactive Drugs PWID: Steroid & IPEDs All NSP Individuals
Cheshire East 27 151 178
Cheshire West & Chester 174 359 533
Halton 31 203 234
Knowsley 34 74 108
Liverpool 86 116 202
Sefton 38 27 65
St. Helens 91 108 199
Warrington 8 70 78
Wirral 105 209 314
Cheshire & Merseyside 592 1,316 1,908
Table 68 - Number of new individuals using agency based NSP service, by cohort group
Local Authority PWID: Psychoactive Drugs PWID: Steroid & IPEDs All NSP Individuals
Cheshire East 25.0% 36.0% 33.7%
Cheshire West & Chester 33.4% 39.0% 37.0%
Halton 29.0% 35.1% 34.2%
Knowsley 25.6% 37.4% 32.6%
Liverpool 21.8% 46.6% 31.4%
Sefton 21.2% 22.5% 21.7%
St. Helens 21.0% 27.8% 24.2%
Warrington 13.6% 30.8% 27.3%
Wirral 26.6% 25.8% 26.1%
Cheshire & Merseyside 26.1% 33.9% 31.0%
Table 69 - Proportion of individuals using agency based NSP services who are new during the 2017-18 year
57 “New individuals” are those individuals who are first recorded within IMS as accessing any NSP service provider during the year.

Integrated Monitoring System Annual Report 2016-17 129
B. PHARMACY BASED NSP SERVICES
B.1. NSP PHARMACY ONLY - ALL INDIVIDUALS BY COHORT
Local Authority PWID: Psychoactive Drugs PWID: Steroid & IPEDs All NSP Individuals
Cheshire East 402 270 672
Cheshire West & Chester 589 270 859
Halton 8 10 18
Knowsley 258 169 427
Liverpool 4,889 2,070 6,959
Sefton 804 628 1,432
St. Helens 1,225 838 2,063
Warrington 449 586 1,035
Wirral 504 192 696
Cheshire & Merseyside 8,946 4,990 13,936
Table 70 - Number of individuals using pharmacy based NSP service, by cohort group
Local Authority PWID: Psychoactive Drugs PWID: Steroid & IPEDs All NSP Individuals
Cheshire East 85.5% 39.7% 58.4%
Cheshire West & Chester 61.1% 23.1% 40.3%
Halton 7.1% 1.7% 2.6%
Knowsley 74.6% 46.6% 60.2%
Liverpool 96.2% 89.7% 94.2%
Sefton 88.5% 84.6% 86.8%
St. Helens 88.8% 71.2% 80.7%
Warrington 97.0% 73.2% 81.9%
Wirral 63.7% 19.4% 39.1%
Cheshire & Merseyside 87.6% 57.4% 73.7%
Table 71 - Proportion of individuals by cohort group who used pharmacy based NSP services

130 Integrated Monitoring System Annual Report 2017-18
B.2. NSP PHARMACY ONLY - NEW INDIVIDUALS BY COHORT 58
Local Authority PWID: Psychoactive Drugs PWID: Steroid & IPEDs All NSP Individuals
Cheshire East 114 104 218
Cheshire West & Chester 249 162 411
Halton 5 5 10
Knowsley 106 75 181
Liverpool 2,582 1,079 3,661
Sefton 287 298 585
St. Helens 633 519 1,152
Warrington 236 309 545
Wirral 114 82 196
Cheshire & Merseyside 4,308 2,627 6,935
Table 72 - Number of new individuals using pharmacy based NSP service, by cohort group
Local Authority PWID: Psychoactive Drugs PWID: Steroid & IPEDs All NSP Individuals
Cheshire East 28.4% 38.5% 32.4%
Cheshire West & Chester 42.3% 60.0% 47.8%
Halton 62.5% 50.0% 55.6%
Knowsley 41.1% 44.4% 42.4%
Liverpool 52.8% 52.1% 52.6%
Sefton 35.7% 47.5% 40.9%
St. Helens 51.7% 61.9% 55.8%
Warrington 52.6% 52.7% 52.7%
Wirral 22.6% 42.7% 28.2%
Cheshire & Merseyside 48.2% 52.6% 49.8%
Table 73 - Proportion of individuals using pharmacy based NSP services who are new during the 2017-18 year
58 “New individuals” are those individuals who are first recorded within IMS as accessing any NSP service provider during the year.

Integrated Monitoring System Annual Report 2016-17 131
C. DETAILED BREAKDOWN BY SERVICE
C.1. DETAIL BY SERVICE PROVIDER - IMS ALL INDIVIDUALS
Total by gender Total by client cohort group
IMS Code IMS service name Total
Clients 2017-18
Male Female PWID: Drugs
PWID: Steroids
BI: Drug or
Alcohol CHE30029 Catherine House, Crewe 465 448 17 91 374 - CHE30030 Barnabas Centre, Macclesfield 63 62 *** 17 46 -
Cheshire East - Agencies 528 510 18 108 420 -
CHE50022 Boots - Nantwich 6 6 - *** *** - CHE50175 Clear Pharmacy - Crewe 134 106 28 100 34 - CHE50340 Andrews Pharmacy - Macclesfield 18 17 *** 10 8 - CHE50632 Rowlands - Middlewich 29 22 7 22 7 - CHE50803 Boots - Sandbach 25 21 *** 15 10 - CHE50805 Mannings Chemist, Knutsford 13 11 *** 10 *** - CHE50816 Well (224193) - Park Lane, Maccle 70 60 10 45 25 - CHE50822 Well (223032) - Sunderland St, Macclesf 127 109 18 92 35 - CHE50840 Assan Pharmacy Ltd T/A Cohens Chemist 121 105 16 73 48 - CHE50849 The Weston Pharmacy (R H Swinn Ltd) 25 24 *** 13 12 - CHE50874 Lloyds - Lawton Road, Stoke 41 36 5 22 19 - CHE50878 Lloyds - Congleton 100 85 15 46 54 - CHE50883 AJ Hodgson T/A London Road pharmacy 24 18 6 18 6 - CHE56610 Boots - Grand Junction, Crewe 61 58 *** 26 35 - CHE57006 Salus Pharmacy - Congleton 30 24 6 13 17 -
Cheshire East - Pharmacies 672 568 104 402 270 -
CHE Cheshire East Local Authority 1,150 1,034 116 470 680 -
Total by gender Total by client cohort group
IMS Code IMS service name Total
Clients 2017-18
Male Female PWID: Drugs
PWID: Steroids
BI: Drug or
Alcohol CHW30027 Aqua House, Chester 773 725 48 325 438 10 CHW30028 Unity House, Ellesmere Port 568 535 33 165 402 *** CHW30045 Old Council House, Northwich 221 202 19 85 136 - CHW10088 Foundation Enterprises NW 19 18 *** 8 *** 9
Cheshire West and Chester - Agencies 1,461 1,364 97 521 920 20
CHW50016 Boots - Foregate St, Chester 310 279 31 220 90 - CHW50258 Pondas Chemist, Winsford 26 21 5 20 6 - CHW50377 Swettenham Chemist - Blacon 125 105 20 103 22 - CHW50462 Well (228547) - Northwich 8 6 *** *** *** - CHW50628 Lloyds - Weaverham, Northwich 13 12 *** 12 *** - CHW50801 Lloyds - Old Chester Rd, Ellesmere 43 32 11 31 12 - CHW50833 Well (228520) - Fountains Health 66 53 13 53 13 - CHW50875 Lloyds - Middlewich Road, Northwich 7 6 *** *** *** - CHW50879 Lloyds - Sainsbury’s Northwich 31 23 8 25 6 - CHW53023 L Rowland & Co (Retail) Ltd - Ellesmere 82 63 19 63 19 - CHW53043 Superdrug - Northgate St, Chester 340 322 18 226 114 - CHW53064 Well (228534) - Ellesmere Port 23 15 8 17 6 -
Cheshire West and Chester - Pharmacies 859 754 105 589 270 -
CHW Cheshire West and Chester LA 2,153 1,979 174 964 1,169 20

132 Integrated Monitoring System Annual Report 2017-18
Total by gender Total by client cohort group
IMS Code IMS service name Total
Clients 2017-18
Male Female PWID: Drugs
PWID: Steroids
BI: Drug or
Alcohol HAL10031 Halton Integrated Recovery Service - CGL 699 472 227 61 6 632 HAL30031 Aston Dane SES, Halton - CGL 456 435 21 64 389 *** HAL30053 Runcorn High Street SES, Halton - CGL 247 239 8 27 219 *** HAL20031 Widnes Vikings - Golden Generation 13 8 5 - - 13
Halton - Agencies 1,334 1,085 249 107 578 649
HAL40201 Boots Widnes *** *** - *** *** - HAL40202 Cooke's Pharmacy Widnes *** *** *** *** *** - HAL40203 Castlefields Medical Centre - - - - - - HAL40204 Lloyds Old Town Runcorn 13 12 *** 5 8 -
Halton - Pharmacies 18 16 *** 8 10 -
HAL Halton Local Authority 1,347 1,097 250 113 585 649
Total by gender Total by client cohort group
IMS Code IMS service name Total
Clients 2017-18
Male Female PWID: Drugs
PWID: Steroids
BI: Drug or
Alcohol KNW10041 Knowsley Integrated Rec Service 744 513 231 68 *** 674 KNW30051 Kirkby SES, Knowsley - CGL 125 108 17 71 54 - KNW30052 Huyton SES, Knowsley - CGL 174 169 5 24 150 -
Knowsley - Agencies 1,005 758 247 133 198 674
KNW53302 Boots Cables Retail Park 28 19 9 19 9 - KNW53303 Boots - The Halewood centre 67 57 10 48 19 - KNW53308 J. H. Davey's Chemist *** *** - - *** - KNW53315 Newtown Pharmacy, Kirkby 156 144 12 80 76 - KNW53323 Rowlands (Prev GF O'Brien) Kirkby 127 118 9 79 48 - KNW53327 A.E. Sedem (Woolfall Pharmacy) 6 6 - *** *** - KNW53328 Sedem Pharmacy, Huyton 6 5 *** 6 - - KNW53329 Stockbridge Pharmacy *** *** *** *** *** - KNW53334 Tops Pharmacy, Kirkby 34 29 5 21 13 - KNW54001 Kingsway Pharmacy - Huyton 15 14 *** 12 *** KNW54002 J. H. Davey's Chemist (Dinas Lane) *** - *** *** ***
Knowsley - Pharmacies 427 380 47 258 169 -
KNW Knowsley Local Authority 1,383 1,094 289 346 363 674
Total by gender Total by client cohort group
IMS Code IMS service name Total
Clients 2017-18
Male Female PWID: Drugs
PWID: Steroids
BI: Drug or
Alcohol LIV10002 Armistead City 5 5 - *** - *** LIV10003 Community Voice 40 32 8 *** - 37 LIV10005 Armistead Street 170 6 164 119 *** 48 LIV10009 Action on Addiction - SHARP 439 237 202 14 - 425 LIV10014 Aintree Hospital 1,403 920 483 21 *** 1,379 LIV10018 Brownlow Practice 171 125 46 29 - 142 LIV10020 Royal Liverpool Hospital LCAS 909 620 289 31 5 873 LIV10050 Young Addaction Liverpool 1,239 663 576 - *** 1,238 LIV10071 North ARC - Addaction Recovery Centre 349 324 25 72 184 93 LIV10072 Central ARC - Addaction Recovery Centre 166 150 16 69 56 41 LIV10073 South ARC - Addaction Recovery Centre *** *** - - - *** LIV10076 Addaction COAST 66 66 - 10 - 56 LIV10081 Addaction Pre Treatment 72 51 21 *** *** 68 LIV10085 Addaction Outreach 169 124 45 84 *** 84 LIV10084 Addaction REST Centre 60 42 18 19 - 41 LIV10060 Transforming Choice 81 56 25 10 *** 70 LIV10091 Red Umbrella Project 7 - 7 - - 7

Integrated Monitoring System Annual Report 2016-17 133
LIV20079 WHISC - Womens Health Info & Support Cen *** - *** - - ***
LIV30044 Armistead Pump *** *** *** - - - Liverpool - Agencies 5,012 3,194 1,818 394 249 4,369
LIV58343 Day Lewis Plc - Belle Vale Pharmacy 78 77 *** 40 38 - LIV58350 Boots - Long Lane 27 19 8 18 9 - LIV58351 Boots - Boaler St 540 431 109 423 117 - LIV58353 Boots - London Rd 2,756 2,333 423 1,676 1,080 - LIV58394 Lloyds - Prospect Point 1,938 1,630 308 1,623 315 - LIV58398 Lloyds - Tuebrook 507 421 86 437 70 - LIV58403 Lloyds - Muirhead Ave East 120 107 13 55 65 - LIV58406 Lloyds - Townsend Lane 482 402 80 459 23 - LIV58409 Lloyds - Old Swan 363 294 69 254 109 - LIV58415 Melwood Pharmacy 23 20 *** 16 7 - LIV58416 Norman Pharmacy 731 541 190 660 71 - LIV58421 Rowlands - Speke Health Centre 91 78 13 27 64 - LIV58422 Rowlands - Somerfield, Garston 171 163 8 17 154 - LIV58437 Rowlands - Lodge Lane 76 75 *** 65 11 - LIV58574 Riverside Pharmacy 45 41 *** 43 *** - LIV59001 Rowlands - Garston 48 44 *** 10 38 - LIV59002 Boots - Fazakerley 9 7 *** 9 - - LIV59003 Greencross Pharmacy (Breck Rd) *** *** *** *** *** -
Liverpool - Pharmacies 6,959 5,837 1,122 4,889 2,070 -
LIV Liverpool Local Authority 11,757 8,879 2,878 5,080 2,308 4,369
Total by gender Total by client cohort group
IMS Code IMS service name Total
Clients 2017-18
Male Female PWID: Drugs
PWID: Steroids
BI: Drug or
Alcohol SEF10056 Independence Initiative 64 45 19 5 - 59 SEF10077 Ambition Sefton, Southport - MerseyCare 229 207 22 114 115 - SEF10078 Ambition Sefton, Bootle - MerseyCare 70 56 14 65 5 - SEF10090 Addaction YP & Families Sefton 14 *** 11 - - 14 SEF20021 Mobile Craft 4 U *** - *** - - ***
Sefton Agencies 375 306 69 179 120 76
SEF55000 Aintree Pharmacy 48 44 *** 15 33 - SEF55708 M L Davey Chemist, Litherland 52 45 7 33 19 - SEF56448 Bispham Road Pharmacy 81 78 *** 25 56 - SEF56452 Boots - South Rd, Waterloo 77 72 5 46 31 - SEF56453 Boots - Liverpool Rd, Crosby 16 14 *** 7 9 - SEF56456 Cohens - Marian Square, Netherton 92 74 18 68 24 - SEF56460 Haddens Pharmacy - Litherland Rd, Bootle 174 160 14 132 42 - SEF56462 Lloyds - Knowsley Rd 74 69 5 58 16 - SEF56464 Lloyds - North Park 15 12 *** 5 10 - SEF56466 Netherton Park Pharmacy 24 23 *** 10 14 - SEF56499 Higgins Pharmacy - Crosby Road North 78 68 10 26 52 - SEF56504 Lloyds - Crosby Rd North 53 47 6 19 34 - SEF56507 Rowlands - Upper Aughton Rd 9 7 *** *** 7 - SEF56520 Superdrug - Eastbank Street, Southport 294 242 52 230 64 - SEF56526 Boots - Seaforth 424 389 35 191 233 -
Sefton Pharmacies 1,432 1,274 158 804 628 -
SEF Sefton Local Authority 1,726 1,512 214 908 742 76

134 Integrated Monitoring System Annual Report 2017-18
Total by gender Total by client cohort group
IMS Code IMS service name Total
Clients 2017-18
Male Female PWID: Drugs
PWID: Steroids
BI: Drug or
Alcohol SHL10061 Hope House 333 272 61 128 6 199 SHL10062 Hope Centre (Breathe) 66 33 33 - - 66 SHL10063 Footsteps, St Helens 118 25 93 - - 118 SHL10092 GP Alcohol Clinic Referrals (CGL) *** *** - - - *** SHL10083 St Helens Integrated Recovery Service 678 477 201 177 *** 498 SHL30083 St Helens SES - CGL 701 659 42 317 382 ***
St Helens Agencies 1,687 1,291 396 434 389 864
SHL40119 Lloyds - Duke Street, St Helens 242 210 32 184 58 - SHL40122 Lloyds - Junction Lane, Sutton Oak 250 210 40 154 96 - SHL40141 Rowlands - Thatto Heath 14 13 *** 12 *** - SHL40143 St Helens Millennium Centre 1760 1526 234 1,058 702 -
St Helens Pharmacies 2,063 1,784 279 1,225 838 -
SHL St. Helens Local Authority 3,420 2,799 621 1,379 1,177 864
Total by gender Total by client cohort group
IMS Code IMS service name Total
Clients 2017-18
Male Female PWID: Drugs
PWID: Steroids
BI: Drug or
Alcohol WAR10066 Footsteps, Warrington 204 59 145 - - 204 WAR10069 Footsteps, CGL Partnership 113 26 87 - - 113 WAR10039 Pathways to Recovery - Warrington (CGL) 419 294 125 38 *** 379 WAR30039 Pathways SES, Warrington - CGL 255 242 13 30 225 -
Warrington Agencies 982 613 369 59 227 696
WAR40070 Well Pharmacy - Fearnhead Cross 131 118 13 58 73 - WAR40071 Rowlands - Thelwall Lane 317 302 15 68 249 - WAR40072 Well Pharmacy - The Baths 466 413 53 279 187 - WAR40073 Lloyds - Earl Street, Warrington 201 184 17 105 95 ***
Warrington Pharmacies 1,036 948 88 449 586 ***
WAR Warrington Local Authority 1,961 1,507 454 463 801 697
Total by gender Total by client cohort group
IMS Code IMS service name Total
Clients 2017-18
Male Female PWID: Drugs
PWID: Steroids
BI: Drug or
Alcohol WIR10019 Response, Wirral 75 42 33 - - 75 WIR10086 Wirral Military Community Services 176 168 8 *** - 175 WIR10059 Wirral Integrated Recovery Service 37 22 15 *** - 36 WIR30057 Birkenhead SES, Wirral - CGL 1,017 943 74 322 677 18 WIR30058 Moreton SES, Wirral - CGL 106 105 *** 16 90 - WIR30067 Wallasey SES, Wirral - CGL 142 134 8 73 66 ***
Wirral Agencies 1,512 1,373 139 394 811 307
WIR50076 Rowlands (Branch: 1368) - Market St 97 85 12 92 5 - WIR50077 Lee's Pharmacy - Wood Church 17 13 *** 8 9 - WIR50079 Rowlands (Branch: 1284) - Moreton 19 18 *** 15 *** - WIR50080 Old Chester Pharmacy, Rockferry 63 50 13 62 *** - WIR50087 Wilsons Chemist, West Kirby *** *** - *** - - WIR50088 Boots (Branch: 5169 - Rockferry) 65 63 *** 48 17 - WIR50090 Victoria Pharmacy, New Brighton 33 27 6 30 *** - WIR50097 Egremont Pharmacy, Wallasey 27 26 *** 24 *** - WIR50105 Lloyds - (Branch: 6705) Arrowe Park 22 21 *** 18 *** - WIR50106 Boots (Branch: 5989 - Bidston) 32 31 *** 24 8 - WIR50108 Wyn Ellis and Son, Poulton Rd, Wallasey 34 29 5 30 *** - WIR50135 Claughton Pharmacy, Park Rd Nth, Birken 69 60 9 58 11 - WIR50153 MedicX Pharmacy, St Caths, Tranmere 323 285 38 194 129 -
Wirral Pharmacies 696 611 85 504 192 -
WIR Wirral Local Authority 2,089 1,875 214 791 991 307

Integrated Monitoring System Annual Report 2016-17 135
C.2. DETAIL BY SERVICE PROVIDER - IMS ALL ACTIVITY
IMS Code IMS service name Brief Interventions
Onward Referrals
Wellbeing Reviews
Syringe Exchange
Transactions
Syringe Exchange Returns
CHE30029 Catherine House, Crewe - - - 940 289 CHE30030 Barnabas Centre, Macclesfield 7 - - 89 8
Cheshire East - Agencies 7 - - 1,029 297
CHE50022 Boots - Nantwich - - - 7 *** CHE50175 Clear Pharmacy - Crewe - - - 403 171 CHE50340 Andrews Pharmacy - Macclesfield - - - 196 53 CHE50632 Rowlands - Middlewich - - - 387 288 CHE50803 Boots - Sandbach - - - 62 17 CHE50805 Mannings Chemist, Knutsford - - - 94 38 CHE50816 Well (224193) - Park Lane, Maccle - - - 245 59 CHE50822 Well (223032) - Sunderland St, Macclesf - - - 1,087 30 CHE50840 Assan Pharmacy Ltd T/A Cohens Chemist - - - 1,228 613 CHE50849 The Weston Pharmacy (R H Swinn Ltd) - - - 202 52 CHE50874 Lloyds - Lawton Road, Stoke - - - 599 125 CHE50878 Lloyds - Congleton - - - 265 89 CHE50883 AJ Hodgson T/A London Road pharmacy - - - 295 63 CHE56610 Boots - Grand Junction, Crewe - - - 179 21 CHE57006 Salus Pharmacy - Congleton - - - 147 110
Cheshire East - Pharmacies - - - 5,396 1,732
CHE Cheshire East Local Authority 7 - - 6,425 2,029
IMS Code IMS service name Brief Interventions
Onward Referrals
Wellbeing Reviews
Syringe Exchange
Transactions
Syringe Exchange Returns
CHW30027 Aqua House, Chester 1,367 - - 2,084 735 CHW30028 Unity House, Ellesmere Port 818 - - 1,405 554 CHW30045 Old Council House, Northwich 290 - - 513 76 CHW10088 Foundation Enterprises NW 35 - - - -
2,510 - - 4,002 1,365 Cheshire West and Chester - Agencies - - - - -
CHW50016 Boots - Foregate St, Chester - - - 1,280 669 CHW50258 Pondas Chemist, Winsford - - - 317 74 CHW50377 Swettenham Chemist - Blacon - - - 1,437 924 CHW50462 Well (228547) - Northwich - - - 10 *** CHW50628 Lloyds - Weaverham, Northwich - - - 125 52 CHW50801 Lloyds - Old Chester Rd, Ellesmere - - - 156 116 CHW50833 Well (228520) - Fountains Health - - - 156 79 CHW50875 Lloyds - Middlewich Road, Northwich - - - 14 *** CHW50879 Lloyds - Sainsburys Northwich - - - 253 92 CHW53023 L Rowland & Co (Retail) Ltd - Ellesmere - - - 198 124 CHW53043 Superdrug - Northgate St, Chester - - - 1,485 760 CHW53064 Well (228534) - Ellesmere Port - - - 76 37
Cheshire West and Chester - Pharmacies - - - 5,507 2,934
CHW Cheshire West and Chester LA 2,510 - - 9,509 4,299

136 Integrated Monitoring System Annual Report 2017-18
IMS Code IMS service name Brief Interventions
Onward Referrals
Wellbeing Reviews
Syringe Exchange
Transactions
Syringe Exchange Returns
HAL10031 Halton Integrated Recovery Service - CGL 1,663 - 90 - - HAL30031 Aston Dane SES, Halton - CGL 745 *** - 880 207 HAL30053 Runcorn High Street SES, Halton - CGL 315 16 - 396 103 HAL20031 Widnes Vikings - Golden Generation - - 13 - -
Halton - Agencies 2,723 17 103 1,276 310
HAL40201 Boots Widnes - - - *** - HAL40202 Cooke's Pharmacy Widnes - - - *** - HAL40203 Castlefields Medical Centre - - - - - HAL40204 Lloyds Old Town Runcorn - - - 19 ***
Halton - Pharmacies - - - 26 ***
HAL Halton Local Authority 2,723 17 103 1,302 313
IMS Code IMS service name Brief Interventions
Onward Referrals
Wellbeing Reviews
Syringe Exchange
Transactions
Syringe Exchange Returns
KNW10041 Knowsley Integrated Rec Service 1,295 - 126 - - KNW30051 Kirkby SES, Knowsley - CGL 335 *** - 455 75 KNW30052 Huyton SES, Knowsley - CGL 111 *** - 240 35
Knowsley - Agencies 1,741 *** 126 695 110
KNW53302 Boots Cables Retail Park - - - 100 75 KNW53303 Boots - The Halewood centre - - - 153 134 KNW53308 J. H. Davey's Chemist - - - *** *** KNW53315 Newtown Pharmacy, Kirkby - - - 297 149 KNW53323 Rowlands (Prev GF O'Brien) Kirkby *** *** - 272 215 KNW53327 A.E. Sedem (Woolfall Pharmacy) *** - - 8 6 KNW53328 Sedem Pharmacy, Huyton - - - 33 33 KNW53329 Stockbridge Pharmacy - - - 12 9 KNW53334 Tops Pharmacy, Kirkby - - - 130 49 KNW54001 Kingsway Pharmacy - Huyton - - - 35 27 KNW54002 J. H. Davey's Chemist (Dinas Lane) - - - *** -
Knowsley - Pharmacies *** *** - 1,043 698
KNW Knowsley Local Authority 1,747 8 126 1,738 808
IMS Code IMS service name Brief Interventions
Onward Referrals
Wellbeing Reviews
Syringe Exchange
Transactions
Syringe Exchange Returns
LIV10002 Armistead City 4 1 0 0 0 LIV10003 Community Voice 112 - 36 - - LIV10005 Armistead Street 964 9 *** 573 *** LIV10009 Action on Addiction - SHARP 8,639 798 341 - - LIV10014 Aintree Hospital 1,812 19 - - - LIV10018 Brownlow Practice 803 86 - - - LIV10020 Royal Liverpool Hospital LCAS 1,566 9 - - - LIV10050 Young Addaction Liverpool 1,490 8 *** - - LIV10071 North ARC - Addaction Recovery Centre 671 28 71 438 141 LIV10072 Central ARC - Addaction Recovery Centre 491 18 26 240 63 LIV10073 South ARC - Addaction Recovery Centre *** - *** - - LIV10076 Addaction COAST 139 11 11 - - LIV10081 Addaction Pre Treatment 185 40 33 - - LIV10085 Addaction Outreach 435 - 71 196 95 LIV10084 Addaction REST Centre 275 60 - *** *** LIV10060 Transforming Choice 6,037 21 - - - LIV10091 Red Umbrella Project 10 - - - -
LIV20079 WHISC - Womens Health Info & Support Cen 13 5 *** - -
LIV30044 Armistead Pump - - - *** - Liverpool - Agencies 23,647 1,113 597 1,452 301

Integrated Monitoring System Annual Report 2016-17 137
IMS Code IMS service name Brief Interventions
Onward Referrals
Wellbeing Reviews
Syringe Exchange
Transactions
Syringe Exchange Returns
LIV58343 Day Lewis Plc - Belle Vale Pharmacy - - - 246 15 LIV58350 Boots - Long Lane - - - 56 *** LIV58351 Boots - Boaler St - - - 1,014 230 LIV58353 Boots - London Rd - - - 9,405 1,943 LIV58394 Lloyds - Prospect Point - - - 4,066 906 LIV58398 Lloyds - Tuebrook - - - 1,417 405 LIV58403 Lloyds - Muirhead Ave East - - - 253 86 LIV58406 Lloyds - Townsend Lane - - - 1,052 217 LIV58409 Lloyds - Old Swan - - - 744 235 LIV58415 Melwood Pharmacy - - - 126 27 LIV58416 Norman Pharmacy - - - 2,147 680 LIV58421 Rowlands - Speke Health Centre - - - 277 211 LIV58422 Rowlands - Somerfield, Garston - - - 373 67 LIV58437 Rowlands - Lodge Lane - - - 106 8 LIV58574 Riverside Pharmacy - - - 348 101 LIV59001 Rowlands - Garston - - - 71 13 LIV59002 Boots - Fazakerley - - - 21 - LIV59003 Greencross Pharmacy (Breck Rd) - - - *** ***
Liverpool - Pharmacies - - - 21,725 5,148
LIV Liverpool Local Authority 23,647 1,113 597 23,177 5,449
IMS Code IMS service name Brief Interventions
Onward Referrals
Wellbeing Reviews
Syringe Exchange
Transactions
Syringe Exchange Returns
SEF10056 Independence Initiative 56 53 58 - - SEF10077 Ambition Sefton, Southport - MerseyCare 344 - 42 985 80 SEF10078 Ambition Sefton, Bootle - MerseyCare 556 *** 60 268 79 SEF10090 Addaction YP & Families Sefton 14 - - - - SEF20021 Mobile Craft 4 U - - 12 - -
Sefton Agencies 970 55 172 1,253 159
SEF55000 Aintree Pharmacy 34 - - 154 94 SEF55708 M L Davey Chemist, Litherland 17 - - 859 118 SEF56448 Bispham Road Pharmacy - - - 133 - SEF56452 Boots - South Rd, Waterloo 15 - - 384 *** SEF56453 Boots - Liverpool Rd, Crosby - - - 67 6 SEF56456 Cohens - Marian Square, Netherton 8 - - 576 60 SEF56460 Haddens Pharmacy - Litherland Rd, Bootle 122 - - 726 *** SEF56462 Lloyds - Knowsley Rd *** - - 128 *** SEF56464 Lloyds - North Park *** - - 18 13 SEF56466 Netherton Park Pharmacy *** - - 41 - SEF56499 Higgins Pharmacy - Crosby Road North - - - 157 - SEF56504 Lloyds - Crosby Rd North 34 - - 66 *** SEF56507 Rowlands - Upper Aughton Rd 5 - - 10 - SEF56520 Superdrug - Eastbank Street, Southport 87 - - 2,432 137 SEF56526 Boots - Seaforth 9 - - 1,008 18
Sefton Pharmacies 335 - - 6,759 455
SEF Sefton Local Authority 1,305 55 172 8,012 614

138 Integrated Monitoring System Annual Report 2017-18
IMS Code IMS service name Brief Interventions
Onward Referrals
Wellbeing Reviews
Syringe Exchange
Transactions
Syringe Exchange Returns
SHL10061 Hope House 8,594 - 200 - - SHL10062 Hope Centre (Breathe) 59 58 55 - - SHL10063 Footsteps, St Helens 562 25 140 - - SHL10092 GP Alcohol Clinic Referrals (CGL) - *** - - - SHL10083 St Helens Integrated Recovery Service 1,913 - - - - SHL30083 St Helens SES - CGL 857 - - 2,409 123
St Helens Agencies 11,985 85 395 2,409 123
SHL40119 Lloyds - Duke Street, St Helens - - - 1,271 448 SHL40122 Lloyds - Junction Lane, Sutton Oak - - - 1,109 32 SHL40141 Rowlands - Thatto Heath - - - 59 9 SHL40143 St Helens Millennium Centre - - - 12,081 3,049
St Helens Pharmacies - - - 14,520 3,538
SHL St. Helens Local Authority 11,985 85 395 16,929 3,661
IMS Code IMS service name Brief Interventions
Onward Referrals
Wellbeing Reviews
Syringe Exchange
Transactions
Syringe Exchange Returns
WAR10066 Footsteps, Warrington 2,498 64 253 - - WAR10069 Footsteps, CGL Partnership 1,309 57 164 - - WAR10039 Pathways to Recovery - Warrington (CGL) 656 - - - - WAR30039 Pathways SES, Warrington - CGL 122 - - 348 90
Warrington Agencies 4,585 121 417 348 90
WAR40070 Well Pharmacy - Fearnhead Cross 31 - - 263 51 WAR40071 Rowlands - Thelwall Lane 86 - - 696 166 WAR40072 Well Pharmacy - The Baths 227 - - 1,526 252 WAR40073 Lloyds - Earl Street, Warrington 88 - - 435 277
Warrington Pharmacies 432 - - 2,920 746
WAR Warrington Local Authority 5,017 121 417 3,268 836
IMS Code IMS service name Brief Interventions
Onward Referrals
Wellbeing Reviews
Syringe Exchange
Transactions
Syringe Exchange Returns
WIR10019 Response, Wirral 199 - - - - WIR10086 Wirral Military Community Services 238 28 *** - - WIR10059 Wirral Integrated Recovery Service 39 - 16 - - WIR30057 Birkenhead SES, Wirral - CGL 1,145 7 - 2,785 786 WIR30058 Moreton SES, Wirral - CGL 99 - - 250 80 WIR30067 Wallasey SES, Wirral - CGL 133 - - 265 82
Wirral Agencies 1,853 35 17 3,300 948
WIR50076 Rowlands (Branch: 1368) - Market St - - - 550 237 WIR50077 Lee's Pharmacy - Wood Church - - - 131 12 WIR50079 Rowlands (Branch: 1284) - Moreton - - - 50 34 WIR50080 Old Chester Pharmacy, Rockferry - - - 916 278 WIR50087 Wilsons Chemist, West Kirby - - - 8 *** WIR50088 Boots (Branch: 5169 - Rockferry) - - - 162 106 WIR50090 Victoria Pharmacy, New Brighton - - - 322 148 WIR50097 Egremont Pharmacy, Wallasey - - - 71 18 WIR50105 Lloyds - (Branch: 6705) Arrowe Park - - - 220 154 WIR50106 Boots (Branch: 5989 - Bidston) - - - 143 91 WIR50108 Wyn Ellis and Son, Poulton Rd, Wallasey - - - 503 459 WIR50135 Claughton Pharmacy, Park Rd Nth, Birken - - - 489 426 WIR50153 MedicX Pharmacy, St Caths, Tranmere - - - 2,039 1,267
Wirral Pharmacies - - - 5,604 3,234
WIR Wirral Local Authority 1,853 35 17 8,904 4,182

Integrated Monitoring System Annual Report 2016-17 139