Integrated Math I: A Common Core Program - Carnegie · PDF fileIntegrated Math I: A Common...
26
Integrated Math I: A Common Core Program 1 1 Quantities and Relationships Chapter Lesson Title Key Math Objective CCSS Key Terms 1.1 A Picture is Worth a Thousand Words Understanding Quantities and Their Relationships • Understand quantities and their relationships with each other. • Identify the independent and dependent quantities for a problem situation. • Match a graph with an appropriate problem situation. • Label the independent and dependent quantities on a graph. • Review and analyze graphs. • Describe similarities and differences among graphs. N.Q.2 F.LE.1.b Dependent quantity Independent quantity 1.2 A Sort of Sorts Analyzing and Sorting Graphs • Review and analyze graphs. • Determine similarities and differences among various graphs. • Sort graphs by their similarities and rationalize the differences between the groups of graphs. • Use the Vertical Line Test to determine if the graph of a relation is a function. F.IF.1 F.IF.5 Relation Domain Range Function Vertical Line Test Discrete graph Continuous graph 1.3 There Are Many Ways to Represent Functions Recognizing Algebraic and Graphical Representations of Functions • Write equations using function notation. • Recognize multiple representations of functions. • Determine and recognize characteristics of functions. • Determine and recognize characteristics of function families. F.IF.5 F.IF.9 A.REI.10 F.IF.1 F.IF.2 F.IF.7.a Function notation Increasing function Decreasing function Constant function Function family Linear functions Exponential functions Absolute minumum Absolute maximum Quadratic functions Linear absolute value functions Linear piecewise functions This chapter introduces students to the concept of functions. Lessons provide opportunities for students to explore functions, including linear, exponential,quadratic,linear absolute value functions,and linear piecewise functions through problem situations, graphs, and equations. Students will classify each function family using graphs, equations, and graphing calculators. Each function family is then defined and students will create graphic organizers that represent the graphical behavior and examples of each. Modules Worked Examples Peer Analysis Talk the Talk Technology Integrated Math I: A Common Core Program
Transcript of Integrated Math I: A Common Core Program - Carnegie · PDF fileIntegrated Math I: A Common...

Integrated Math I: A Common Core Program 1
1 Quantities and Relationships
Chapter Lesson Title Key Math Objective CCSS Key Terms
1.1
A Picture is Worth a Thousand Words
Understanding Quantities and Their Relationships
• Understand quantities and their relationships with each other.• Identify the independent and dependent quantities for a problem situation.• Match a graph with an appropriate problem situation.• Label the independent and dependent quantities on a graph.• Review and analyze graphs.• Describe similarities and differences among graphs.
N.Q.2F.LE.1.b
�Dependent quantity�Independent quantity �
1.2A Sort of Sorts
Analyzing and Sorting Graphs
• Review and analyze graphs.• Determine similarities and differences among various graphs.• Sort graphs by their similarities and rationalize the differences between the groups of graphs.• Use the Vertical Line Test to determine if the graph of a relation is a function.
F.IF.1F.IF.5
�Relation�Domain�Range�Function�Vertical Line Test�Discrete graph�Continuous graph
�
1.3
There Are Many Ways to Represent Functions
Recognizing Algebraic and Graphical Representations of Functions
• Write equations using function notation.• Recognize multiple representations of functions.• Determine and recognize characteristics of functions.• Determine and recognize characteristics of function families.
F.IF.5F.IF.9
A.REI.10F.IF.1F.IF.2
F.IF.7.a
�Function notation�Increasing function�Decreasing function�Constant function�Function family�Linear functions�Exponential functions�Absolute minumum�Absolute maximum�Quadratic functions�Linear absolute value functions�Linear piecewise functions
� �
This chapter introduces students to the concept of functions. Lessons provide opportunities for students to explore functions, including linear, exponential,quadratic,linear absolute value functions,and linear piecewise functions through problem situations, graphs, and equations. Students will classify each function family using graphs, equations, and graphing calculators. Each function family is then defined and students will create graphic organizers that represent the graphical behavior and examples of each.
Mod
ules
Wor
ked
Exam
ples
Peer
Ana
lysi
s
Talk
the
Talk
Tech
nolo
gy
Integrated Math I: A Common Core Program

Integrated Math I: A Common Core Program 2
Integrated Math I: A Common Core Program
1.4
Function Families for 200, Alex …
Recognizing Functions by Characteristics
�Recognizing similar characteristics among function families.�Recognize different characteristics among function families.�Determine function types given certain characteristics.
F.IF.1F.IF.4
F.IF.7.aF.IF.9
F.LE.1.bF.LE.2
A.CED.2
N/A � �
Integrated Math I: A Common Core Program 3
Integrated Math I: A Common Core Program
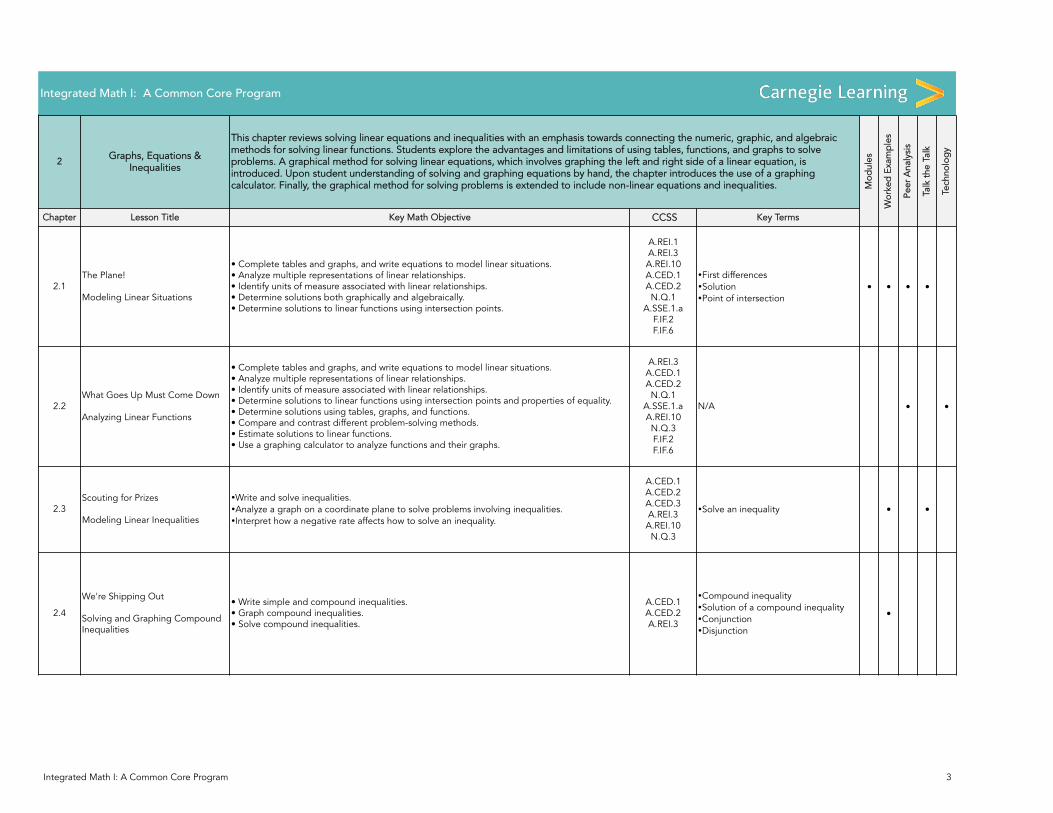
2 Graphs, Equations & Inequalities
Chapter Lesson Title Key Math Objective CCSS Key Terms
2.1The Plane!
Modeling Linear Situations
• Complete tables and graphs, and write equations to model linear situations.• Analyze multiple representations of linear relationships.• Identify units of measure associated with linear relationships.• Determine solutions both graphically and algebraically.• Determine solutions to linear functions using intersection points.
A.REI.1A.REI.3A.REI.10A.CED.1A.CED.2N.Q.1
A.SSE.1.aF.IF.2F.IF.6
�First differences�Solution�Point of intersection
� � � �
2.2What Goes Up Must Come Down
Analyzing Linear Functions
• Complete tables and graphs, and write equations to model linear situations.• Analyze multiple representations of linear relationships.• Identify units of measure associated with linear relationships.• Determine solutions to linear functions using intersection points and properties of equality.• Determine solutions using tables, graphs, and functions.• Compare and contrast different problem-solving methods.• Estimate solutions to linear functions.• Use a graphing calculator to analyze functions and their graphs.
A.REI.3A.CED.1A.CED.2N.Q.1
A.SSE.1.aA.REI.10N.Q.3F.IF.2F.IF.6
N/A � �
2.3Scouting for Prizes
Modeling Linear Inequalities
�Write and solve inequalities.�Analyze a graph on a coordinate plane to solve problems involving inequalities.�Interpret how a negative rate affects how to solve an inequality.
A.CED.1A.CED.2A.CED.3A.REI.3
A.REI.10N.Q.3
�Solve an inequality � �
2.4
We're Shipping Out
Solving and Graphing Compound Inequalities
• Write simple and compound inequalities.• Graph compound inequalities.• Solve compound inequalities.
A.CED.1A.CED.2A.REI.3
�Compound inequality�Solution of a compound inequality�Conjunction�Disjunction
�
This chapter reviews solving linear equations and inequalities with an emphasis towards connecting the numeric, graphic, and algebraic methods for solving linear functions. Students explore the advantages and limitations of using tables, functions, and graphs to solve problems. A graphical method for solving linear equations, which involves graphing the left and right side of a linear equation, is introduced. Upon student understanding of solving and graphing equations by hand, the chapter introduces the use of a graphing calculator. Finally, the graphical method for solving problems is extended to include non-linear equations and inequalities. M
odul
es
Wor
ked
Exam
ples
Peer
Ana
lysi
s
Talk
the
Talk
Tech
nolo
gy

Integrated Math I: A Common Core Program 4
Integrated Math I: A Common Core Program
2.5
Play Ball!
Absolute Value Equations and Inequalities
• Understand and solve absolute values.• Solve linear absolute value equations.• Solve and graph linear absolute value inequalities on number lines.• Graph linear absolute values and use the graph to determine solutions.
A.CED.1A.CED.2A.CED.3A.REI.3A.REI.10
�Opposites�Absolute value�Linear absolute value equation�Linear absolute value inequality�Equivalent compound inequality
� � � � �
2.6
Choose Wisely!
Understanding Non-Linear Graphs and Inequalities
• Identify the appropriate function to represent a problem situation.• Determine solutions to linear functions using intersection points.• Determine solutions to non-linear functions using intersection points.• Describe advantages and disadvantages of using technology different methods to solve functions with and without technology.
N.Q.1N.Q.2
A.CED.2A.CED.3A.REI.10
F.IF.2F.LE.1.bF.LE.1.c
N/A �
Integrated Math I: A Common Core Program 5
Integrated Math I: A Common Core Program
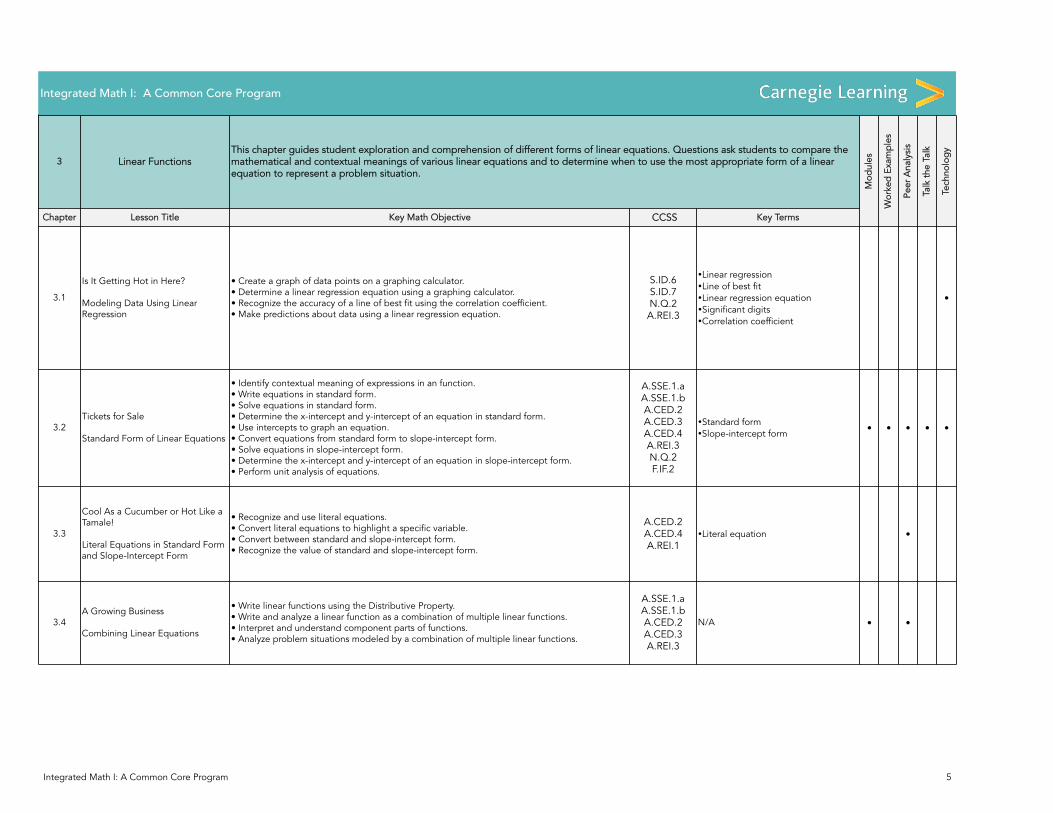
3 Linear Functions
Chapter Lesson Title Key Math Objective CCSS Key Terms
3.1
Is It Getting Hot in Here?
Modeling Data Using Linear Regression
• Create a graph of data points on a graphing calculator.• Determine a linear regression equation using a graphing calculator.• Recognize the accuracy of a line of best fit using the correlation coefficient.• Make predictions about data using a linear regression equation.
S.ID.6S.ID.7N.Q.2A.REI.3
�Linear regression�Line of best fit�Linear regression equation�Significant digits�Correlation coefficient
�
3.2Tickets for Sale
Standard Form of Linear Equations
• Identify contextual meaning of expressions in an function.• Write equations in standard form.• Solve equations in standard form.• Determine the x-intercept and y-intercept of an equation in standard form.• Use intercepts to graph an equation.• Convert equations from standard form to slope-intercept form.• Solve equations in slope-intercept form.• Determine the x-intercept and y-intercept of an equation in slope-intercept form.• Perform unit analysis of equations.
A.SSE.1.aA.SSE.1.bA.CED.2A.CED.3A.CED.4A.REI.3N.Q.2F.IF.2
�Standard form�Slope-intercept form � � � � �
3.3
Cool As a Cucumber or Hot Like a Tamale!
Literal Equations in Standard Form and Slope-Intercept Form
• Recognize and use literal equations.• Convert literal equations to highlight a specific variable.• Convert between standard and slope-intercept form.• Recognize the value of standard and slope-intercept form.
A.CED.2A.CED.4A.REI.1
�Literal equation �
3.4A Growing Business
Combining Linear Equations
• Write linear functions using the Distributive Property.• Write and analyze a linear function as a combination of multiple linear functions.• Interpret and understand component parts of functions.• Analyze problem situations modeled by a combination of multiple linear functions.
A.SSE.1.aA.SSE.1.bA.CED.2A.CED.3A.REI.3
N/A � �
Tech
nolo
gyThis chapter guides student exploration and comprehension of different forms of linear equations. Questions ask students to compare the mathematical and contextual meanings of various linear equations and to determine when to use the most appropriate form of a linear equation to represent a problem situation.
Mod
ules
Wor
ked
Exam
ples
Peer
Ana
lysi
s
Talk
the
Talk
Integrated Math I: A Common Core Program 6
Integrated Math I: A Common Core Program
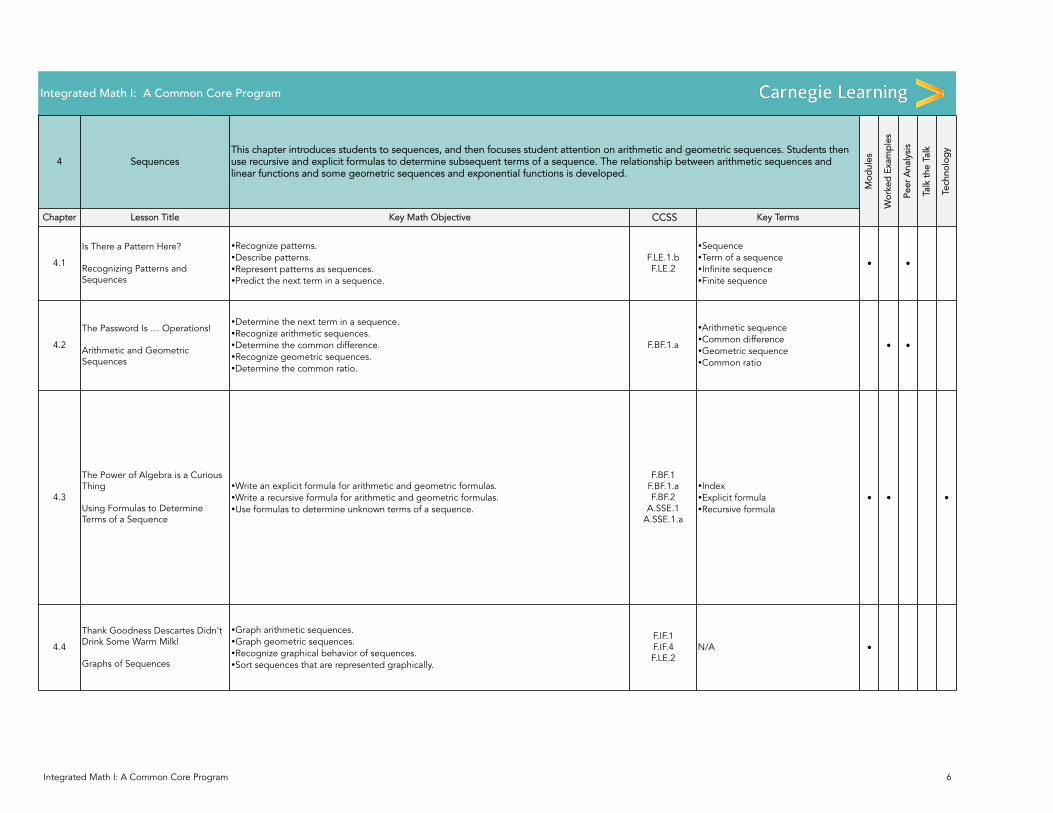
4 Sequences
Chapter Lesson Title Key Math Objective CCSS Key Terms
4.1
Is There a Pattern Here?
Recognizing Patterns and Sequences
�Recognize patterns.�Describe patterns.�Represent patterns as sequences.�Predict the next term in a sequence.
F.LE.1.bF.LE.2
�Sequence�Term of a sequence�Infinite sequence�Finite sequence
� �
4.2
The Password Is … Operations!
Arithmetic and Geometric Sequences
�Determine the next term in a sequence.�Recognize arithmetic sequences.�Determine the common difference.�Recognize geometric sequences.�Determine the common ratio.
F.BF.1.a
�Arithmetic sequence�Common difference�Geometric sequence�Common ratio
� �
4.3
The Power of Algebra is a Curious Thing
Using Formulas to Determine Terms of a Sequence
�Write an explicit formula for arithmetic and geometric formulas.�Write a recursive formula for arithmetic and geometric formulas.�Use formulas to determine unknown terms of a sequence.
F.BF.1F.BF.1.aF.BF.2
A.SSE.1A.SSE.1.a
�Index�Explicit formula�Recursive formula
� � �
4.4
Thank Goodness Descartes Didn't Drink Some Warm Milk!
Graphs of Sequences
�Graph arithmetic sequences.�Graph geometric sequences.�Recognize graphical behavior of sequences.�Sort sequences that are represented graphically.
F.IF.1F.IF.4F.LE.2
N/A �
Talk
the
Talk
Tech
nolo
gyThis chapter introduces students to sequences, and then focuses student attention on arithmetic and geometric sequences. Students then use recursive and explicit formulas to determine subsequent terms of a sequence. The relationship between arithmetic sequences and linear functions and some geometric sequences and exponential functions is developed.
Mod
ules
Wor
ked
Exam
ples
Peer
Ana
lysi
s

Integrated Math I: A Common Core Program 7
Integrated Math I: A Common Core Program
4.5Well, Maybe It IS a Function!
Sequences and Functions
• Write an arithmetic sequence as a linear function.• Make the connection between the graph of an arithmetic sequence, and the graph of a linear function.• Write a geometric sequence as an exponential function.• Make the connection between the graph of a geometric sequence, and the graph of an exponential function.• Contrast an exponential function and a geometric sequence with a negative common ratio.
F.IF.1F.IF.2F.IF.3F.BF.1F.BF.2F.LE.1
F.LE.1.aF.LE.1.bF.LE.1.cF.LE.2F.LE.5
N/A � � � �

Integrated Math I: A Common Core Program 8
Integrated Math I: A Common Core Program
5 Exponential Functions
Chapter Lesson Title Key Math Objective CCSS Key Terms
5.1
Go for the Curve!
Comparing Linear and Exponential Functions
• Construct and identify linear and exponential functions from sequences.• Compare graphs, tables, and equations of linear and exponential functions.• Construct a linear function from an arithmetic sequence.• Construct an exponential function from a geometric sequence.• Compare formulas for simple interest and compound interest.
A.SSE.1.a A.SSE.1.bA.CED.1
F.IF.3F.IF.6
F.IF.7.eF.BF.1.aF.BF.2
F.LE.1.a F.LE.1.bF.LE.1.cF.LE.2F.LE.3F.LE.5
�Simple interest�Compound interest � � �
5.2Downtown and Uptown
Graphs of Exponential Functions
• Solve exponential functions using the intersection of graphs.• Analyze asymptotes of exponential functions and their meanings in context.• Identify the domain and range of exponential functions.• Analyze and graph decreasing exponential functions.• Compare graphs of linear and exponential functions through intercepts, asymptotes, and end behavior.
A.SSE.1.a A.SSE.1.bA.CED.1 A.REI.11
F.IF.4F.IF.7.eF.LE.5F.LE.2
�Horizontal asymptote �
Peer
Ana
lysi
s
Talk
the
Talk
This chapter examines the graphical behavior of exponential functions, including intercepts, domain and range, intervals of increase or decrease, and asymptotes. Students also explore the transformations of exponential functions. The chapter then introduces students to the relationship between rational exponents and radical form. Students will learn the strategy to use common bases to solve simple exponential equations algebraically.
Mod
ules
Wor
ked
Exam
ples
Tech
nolo
gy

Integrated Math I: A Common Core Program 9
Integrated Math I: A Common Core Program
5.3
Let the Transformations Begin!
Translations of Linear and Exponential Functions
�Translate linear and exponential functions vertically.�Translate linear and exponential functions horizontally.
F.BF.3A.REI.10
F.LE.2
�Basic function�Transformation�Vertical translation�Coordinate notation�Horizontal translation�Argument of a function
� � �
5.4
Take Some Time to Reflect
Reflections of Linear and Exponential Functions
• Reflect linear and exponential functions vertically.• Reflect linear and exponential functions horizontally.• Determine characteristics of graphs after transformations.
F.IF.4A.REI.10
F.LE.2
�Reflection�Line of reflection � �
5.5Radical! Because It's Cliché!
Properties of Rational Exponents
• Simplify expressions with negative exponents.• Simplify expressions with rational exponents.• Write negative powers as positive powers.• Write rational powers using radicals.• Find the nth root of a number.• Write an expression in radical form.
N.RN.1N.RN.2
�Cube root�Index�nth root�Radicand�Rational exponent
�

Integrated Math I: A Common Core Program 10
Integrated Math I: A Common Core Program
5.6Checkmate!
Solving Exponential Functions
• Use multiple representations to model exponential functions.• Understand the properties of exponent expressions with positive and negative exponents.• Solve exponential functions graphically and algebraically using common bases and properties of exponents.• Investigate increasing and decreasing exponential functions.• Model inequalities in exponential situations.• Use technology to graph, analyze, and solve exponential functions.
A.REI.3 A.CED.1A.CED.2N.Q.2
A.REI.10 A.REI.11N.RN.2F.LE.2
N/A � �
Integrated Math I: A Common Core Program 11
Integrated Math I: A Common Core Program
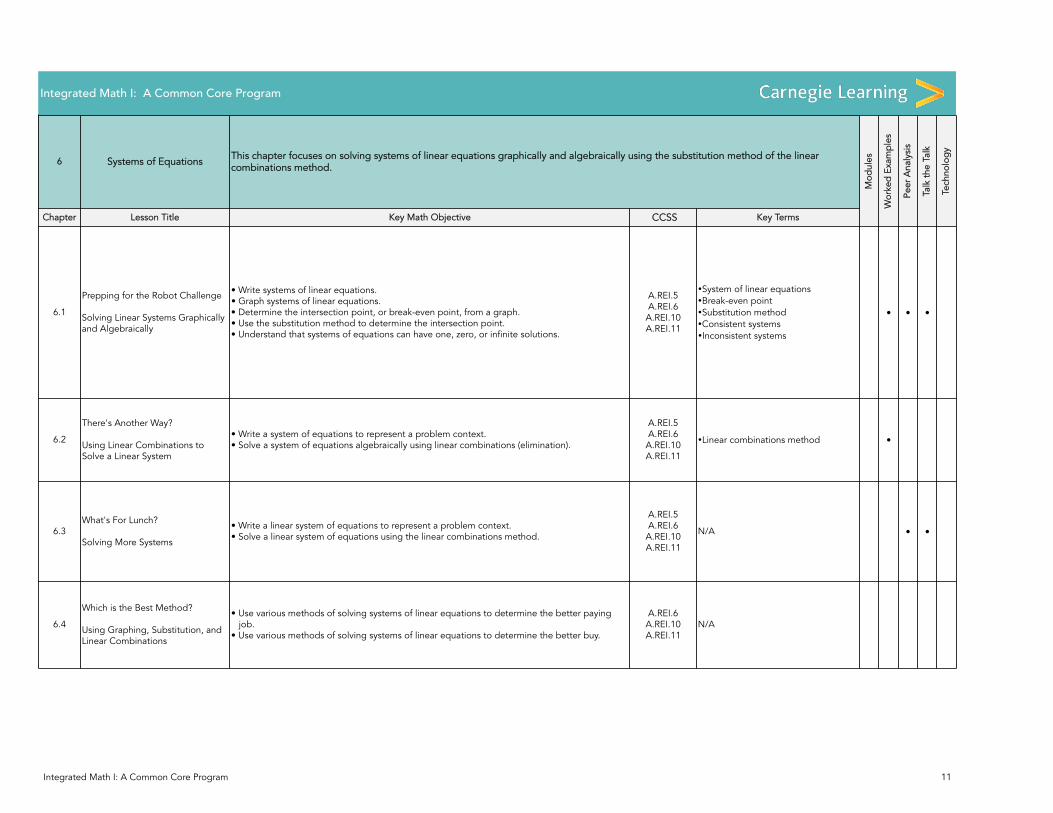
6 Systems of Equations
Chapter Lesson Title Key Math Objective CCSS Key Terms
6.1
Prepping for the Robot Challenge
Solving Linear Systems Graphically and Algebraically
• Write systems of linear equations.• Graph systems of linear equations.• Determine the intersection point, or break-even point, from a graph.• Use the substitution method to determine the intersection point.• Understand that systems of equations can have one, zero, or infinite solutions.
A.REI.5A.REI.6
A.REI.10 A.REI.11
�System of linear equations�Break-even point�Substitution method�Consistent systems�Inconsistent systems
� � �
6.2
There's Another Way?
Using Linear Combinations to Solve a Linear System
• Write a system of equations to represent a problem context.• Solve a system of equations algebraically using linear combinations (elimination).
A.REI.5A.REI.6
A.REI.10 A.REI.11
�Linear combinations method �
6.3What's For Lunch?
Solving More Systems
• Write a linear system of equations to represent a problem context.• Solve a linear system of equations using the linear combinations method.
A.REI.5A.REI.6
A.REI.10 A.REI.11
N/A � �
6.4
Which is the Best Method?
Using Graphing, Substitution, and Linear Combinations
• Use various methods of solving systems of linear equations to determine the better paying job.• Use various methods of solving systems of linear equations to determine the better buy.
A.REI.6 A.REI.10 A.REI.11
N/A
Talk
the
Talk
Tech
nolo
gyThis chapter focuses on solving systems of linear equations graphically and algebraically using the substitution method of the linear combinations method.
Mod
ules
Wor
ked
Exam
ples
Peer
Ana
lysi
s

Integrated Math I: A Common Core Program 12
Integrated Math I: A Common Core Program
7 Systems of Inequalities
Chapter Lesson Title Key Math Objective CCSS Key Terms
7.1The Playoffs
Graphing Inequalities
�Write an inequality in two variables.�Graph an inequality in two variables.�Determine which type of line on a graph represents a given inequality.�Interpret the solutions of inequalities mathematically and contextually.
A.REI.12A.CED.3 �Half-plane
7.2Working the System
Sustems of Linear Inequalities
• Write and graph systems of linear inequalities.• Determine solutions to systems of linear inequalities.• Algebraically prove solutions and non-solutions of systems of linear inequalities.• Graph systems of linear inequalities using a graphing calculator.
A.REI.12A.CED.3
• Constraints• Solution of a system of linear inequalities
� �
7.3
Our Biggest Sale of the Season!
Systems with More Than Two Linear Inequalities
�Solve systems of linear inequalities.�Mazimize linear expressions on a region in the coordinate plane.
A.REI.12A.CED.3
N/A �
7.4 Take It to the Max … or Min
• Write systems of inequalities with more than two inequalities.• Determine constraints from a problem situation.• Graph systems of linear inequalities and determine the solution set.• Identify the maximum and minimum values of a linear expression.
A.REI.12A.CED.3 �Linear programming � �
Peer
Ana
lysi
s
Talk
the
Talk
Tech
nolo
gy
Wor
ked
Exam
ples
Mod
ules
Integrated Math I: A Common Core Program 13
Integrated Math I: A Common Core Program
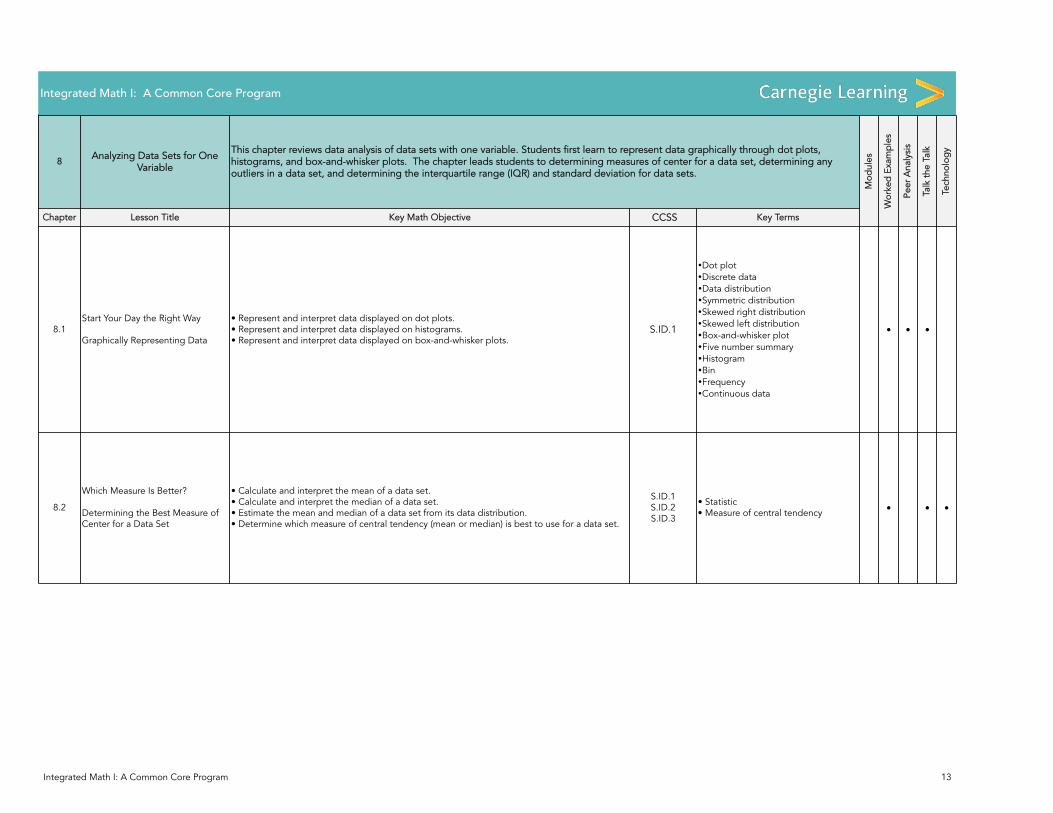
8 Analyzing Data Sets for One Variable
Chapter Lesson Title Key Math Objective CCSS Key Terms
8.1Start Your Day the Right Way
Graphically Representing Data
• Represent and interpret data displayed on dot plots.• Represent and interpret data displayed on histograms.• Represent and interpret data displayed on box-and-whisker plots.
S.ID.1
�Dot plot�Discrete data�Data distribution�Symmetric distribution�Skewed right distribution�Skewed left distribution�Box-and-whisker plot�Five number summary�Histogram�Bin�Frequency�Continuous data
� � �
8.2
Which Measure Is Better?
Determining the Best Measure of Center for a Data Set
• Calculate and interpret the mean of a data set.• Calculate and interpret the median of a data set.• Estimate the mean and median of a data set from its data distribution.• Determine which measure of central tendency (mean or median) is best to use for a data set.
S.ID.1S.ID.2S.ID.3
• Statistic• Measure of central tendency � � �
Talk
the
Talk
Tech
nolo
gyThis chapter reviews data analysis of data sets with one variable. Students first learn to represent data graphically through dot plots, histograms, and box-and-whisker plots. The chapter leads students to determining measures of center for a data set, determining any outliers in a data set, and determining the interquartile range (IQR) and standard deviation for data sets.
Mod
ules
Wor
ked
Exam
ples
Peer
Ana
lysi
s

Integrated Math I: A Common Core Program 14
Integrated Math I: A Common Core Program
8.3
You Are Too Far Away!
Calculating IQR and Identifying Outliers
�Calculate and interpret the interquartile range (IQR) of a data set.�Determine if a data set contains outliers.
S.ID.1S.ID.2S.ID.3
�Interquartile range (IQR)�Outlier�Lower fence�Upper fence
� � �
8.4
Whose Scores Are Better?
Calculating and Interpreting Standard Deviation
• Calculate and interpret the standard deviation of a data set.• Compare the standard deviation of data sets.
S.ID.1S.ID.2S.ID.3
�Standard deviation�Normal distribution � � � �
8.5Putting the Pieces Together
Analyzing and Interpreting Data
�Analyze and interpret data graphically and numerically.�Determine which measure of central tendency and spread is most appropriate to describe a data set.
S.ID.1S.ID.2S.ID.3
�Stem-and-leaf plot�Side-by-side stem-and-leaf plot � �

Integrated Math I: A Common Core Program 15
Integrated Math I: A Common Core Program
9 Correlation and Residuals
Chapter Lesson Title Key Math Objective CCSS Key Terms
9.1Like a Glove
Least Squares Regression
• Determine and interpret the least squares regression equation for a data set using a formula.• Use interpolation to make predictions about data.• Use extrapolation to make predictions about data.
S.ID.6.aS.ID.6.cS.ID.7
�Interpolation�Extrapolation�Least squares regression line
� � �
9.2Gotta Keep It Correlatin'
Correlation
�Determine the correlation coefficient using a formula.�Interpret the correlation coefficient for a set of data.
S.ID.6.aS.ID.6.cS.ID.7S.ID.8
N/A � �
9.3The Residual Effect
Creating Residual Plots
�Create residual plots.�Analyze the shapes of residual plots.
S.ID.6.aS.ID.6.bS.ID.7S.ID.8
�Residual�Residual plot � �
9.4
To Fit or Not To Fit? That Is The Question!
Using Residual Plots
• Use scatter plots and correlation coefficients to determine whether a linear regression is a good fit for data.• Use residual plots to help determine whether a linear regression is the best fit for data.
S.ID.6.aS.ID.6.bS.ID.7S.ID.8
N/A � �
This chapter introduces the method of least squares to determine a linear regression line of a data set. The chapter then progresses to provide opportunities to determine the correlation coefficient of a data set by both pencil-and paper and by using a graphing calculator. Then the chapter exposes students to residuals of a data set in which they will make determinations about which function type might be represent a data set. Finally, the chapter introduces students to causation and correlation.
Mod
ules
Wor
ked
Exam
ples
Peer
Ana
lysi
s
Talk
the
Talk
Tech
nolo
gy

Integrated Math I: A Common Core Program 16
Integrated Math I: A Common Core Program
9.5Who Are You? Who? Who?
Causation vs. Correlation
• Understand the difference between correlation and causation.• Understand necessary conditions.• Understand sufficient conditions.
S.ID.9
• Causation• Necessary condition• Sufficient condition• Common response• Confounding variable
�

Integrated Math I: A Common Core Program 17
Integrated Math I: A Common Core Program
10 Analyzing Data Sets for Two Categotical Variables
Chapter Lesson Title Key Math Objective CCSS Key Terms
10.1
Could You Participate in Our Survey?
Interpreting Frequency Distributions
• Construct and interpret frequency and frequency marginal distributions displayed in two-way tables for two-variable categorical data.• Create and interpret graphs of frequency distributions displayed in two-way tables.
S.ID.5
• Categorical data• Two-way frequency table• Frequency distribution• Joint frequency• Frequency marginal distribution
�
10.2It's So Hot Outside!
Relative Frequency Distribution
• Construct and interpret relative frequency distribution and relative frequency marginal distributions displayed in two-way tables for categorical data.• Analyze and use relative frequency marginal distributions to make decisions for a problem situation.
S.ID.5• Relative frequency distribution• Relative frewuency marginal distribution
�
10.3
She Blinded Me with Science!
Relative Frequency Conditional Distribution
�Construct and interpret relative frequency conditional distributions displayed in two-way tables for categorical data. S.ID.5 • Relative frequency conditional
distribution �
10.4Oh! Switch the Station!
Drawing Conclusions from Data
�Analyze different categorical data.�Use categorical data to make decisions.
S.ID.5 N/A
This chapter introduces categorical data as opposed to numerical data students have encountered in the previous two chapters. Students learn how to organize data from a data table, determine the relative frequency distributions of a data set, determine the relative frequency conditional distribution, and finally to analyze categorical data to problemsolve and make decisions.
Mod
ules
Wor
ked
Exam
ples
Peer
Ana
lysi
s
Talk
the
Talk
Tech
nolo
gy

Integrated Math I: A Common Core Program 18
Integrated Math I: A Common Core Program
11 Mathematical Modeling
Chapter Lesson Title Key Math Objective CCSS Key Terms
11.1Let's Take a Little Trip
Every Graph Tells a Story
• Identify a linear piecewise function.• Interpret the graph of a linear piecewise function.• Determine intervals of increase and decrease for a linear piecewise function.• Determine values from a graph of a linear piecewise function.• Physically model the graphs of linear piecewise functions using technology.
F.IF.4F.IF.5 N/A �
11.2
Whodunit? The Function Family Line-Up
Modeling Data with Curves of Best Fit
• Model data from a scatter plot.• Identify the function family to which a function belongs.• Identify graphical behavior of a function.• Use a model to predict values.• Interpret parts of a graph.
F.IF.4F.IF.5
F.LE.1.bN/A
11.3
People, Tea, and Carbon Dioxide
Modeling Using Exponential Functions
�Write exponential models from data sets.�Use models to solve problems.
F.IF.4F.IF.5F.IF.7F.BF.1F.BF.4F.LE.1F.LE.2
N/A �
11.4
BAC is BAD News
Choosing the Best Function to Model Data
• Determine the type of regression equation that best fits a graph.• Use a function to model a problem situation.• Interpret characteristics of a function in terms of a problem situation.• Analyze results to write a report.
F.IF.4F.IF.5F.IF.7F.BF.1F.BF.4F.LE.1F.LE.2
N/A � �
This chapter presents opportunities to model real-world data using linear and exponential functions. The focus builds student decision-making to determine the appropriate function or functions for a given data set.
Mod
ules
Wor
ked
Exam
ples
Peer
Ana
lysi
s
Talk
the
Talk
Tech
nolo
gy

Integrated Math I: A Common Core Program 19
Integrated Math I: A Common Core Program
12 Geometry on the Coordinate Plane
Chapter Lesson Title Key Math Objective CCSS Key Terms
12.1
Let's Move!
Translating and Constructin Line Segments
• Determine the distance between two points.• Use the Pythagorean Theorem to derive the Distance Formula.• Apply the Distance Formula on the coordinate plane.• Translate a line segment on the coordinate plane.• Copy or duplicate a line segment by construction.
G.CO.1G.CO.2G.CO.4G.CO.5G.CO.6G.CO.12G.CO.13G.GPE.7
• Distance Formula• Transformation• Rigid motion• Translation• Image• Pre-image• Arc• Congruent line segments• Congruent
CONSTRUCTIONS:• Copying a line segment• Duplicating a line segment
� � �
12.2Treasure Hunt
Midpoints and Bisectors
• Determine the midpoint of a line segment on a coordinate plane.• Use the Midpoint Formula.• Apply the Midpoint Formula on the coordinate plane.• Bisect a line segment using patty paper.• Bisect a line segment by construction.• Locate the midpoint of a line segment.
G.CO.12G.GPE.6G.GPE.7
• Midpoint• Midpoint Formula• Segment bisector
CONSTRUCTIONS:• Bisecting a line segment
� � �
12.3
It's All About Angles
Translating and Constructing Angles and Angle Bisectors
• Translate an angle on the coordinate plane.• Copy or duplicate an angle by construction.• Bisect an angle by construction.
G.CO.1G.CO.2G.CO.4G.CO.5G.CO.6G.CO.12
• Angle• Angle bisector
CONSTRUCTIONS:• Copying an angle• Duplicating an angle• Bisecting an angle
� � �
12.4
Did You Find a Parking Space?
Parallel and Perpendicular Lines on the Coordinate Plane
• Determine whether lines are parallel.• Identify and write the equations of lines parallel to given lines.• Determine whether lines are perpendicular.• Identify and write the equations of lines perpendicular to given lines.• Identify and write the equations of horizontal and vertical lines.• Calculate the distance between a line and a point not on the line.
G.CO.1G.GPE.4G.GPE.5G.GPE.5G.GPE.7
�Point-slope form
This chapter uses distance, midpoint, and slope to examine segments and lines in the coordinate plane. Patty paper and constructions are used to duplicate segments and angles, bisect segments and angles, construct parallel and perpendicular lines, and construct triangles and quadrilaterals.
Mod
ules
Wor
ked
Exam
ples
Peer
Ana
lysi
s
Talk
the
Talk
Tech
nolo
gy

Integrated Math I: A Common Core Program 20
Integrated Math I: A Common Core Program
12.5
Making Copies--Just as Perfect as the Original!
Constructing Perpendicular Lines, Parallel Lines, and Polygons
• Construct a perpendicular line to a given line through a point on the line.• Construct a perpendicular line to a given line through a point not on the line.• Construct a parallel line to a given line through a point not on the line.• Construct an equilateral triangle given the length of one side of the triangle.• Construct an isosceles triangle given the length of one side of the triangle.• Construct a square given the perimeter (as the length of a given line segment).• Construct a rectangle that is not a square given the perimeter (as the length of a givenline segment).
G.CO.12G.CO.13 N/A � �

Integrated Math I: A Common Core Program 21
Integrated Math I: A Common Core Program
13 Congruence Through Transformations
Chapter Lesson Title Key Math Objective CCSS Key Terms
13.1
Slide, Flip, Turn: The Latest Dance Craze?
Translating, Rotating, and Reflecting Geometric Figures
• Translate geometric figures on a coordinate plane.• Rotate geometric figures on a coordinate plane.• Reflect geometric figures on a coordinate plane.
G.CO.2G.CO.4G.CO.5
• Rotation• Point of rotation• Angle of rotation• Reflection• Line of reflection
� � � �
13.2All the Same to You
Congruent Triangles
• Identify corresponding sides and corresponding angles of congruent triangles.• Explore the relationship between corresponding sides of congruent triangles.• Explore the relationship between corresponding angles of congruent triangles.• Write statements of triangle congruence.• Identify and use rigid motion to create new images.
G.CO.6G.CO.7G.CO.8
• Congruent angles• Corresponding sides• Corresponding angles
� �
13.3Side-Side-Side
SSS Congruence Theorem
• Explore the Side-Side-Side Congruence Theorem through constructions.• Explore the Side-Side-Side Congruence Theorem on the coordinate plane.
G.CO.6G.CO.7G.CO.8G.CO.12
• Theorem• Postulate• Side-Side-Side Congruence Theorem
�
13.4Side-Angle-Side
SAS Congruence Theorem
• Explore Side-Angle-Side Congruence Theorem using constructions.• Explore Side-Angle-Side Congruence Theorem on the coordinate plane.
G.CO.6G.CO.7G.CO.8G.CO.12
• Side-Angle-Side Congruence Theorem• Included angle
� �
13.5
You Shouldn't Make Assumptions
Angle-Side-Angle Congruence Theorem
• Explore the Angle-Side-Angle Congruence Theorem using constructions.• Explore the Angle-Side-Angle Congruence Theorem on the coordinate plane.
G.CO.6G.CO.7G.CO.8G.CO.12
• Angle-Side-Angle Congruence Theorem• Included side
�
Mod
ules
Wor
ked
Exam
ples
Peer
Ana
lysi
s
Talk
the
Talk
Tech
nolo
gyThis chapter addresses transformations of figures on the coordinate plane, focusing on similarity and congruence, and the effects of transformation on coordinates. The chapter leads student exploration of the conditions for triangle congruence and opportunities for constructions of congruent triangles under the stated conditions are provided.

Integrated Math I: A Common Core Program 22
Integrated Math I: A Common Core Program
13.6
Ahhhhh … We're Sorry We Didn't Include You!
Angle-Angle-Side Congruence Theorem
• Explore Angle-Angle-Side Congruence Theorem using constructions.• Explore Angle-Angle-Side Congruence Theorem on the coordinate plane.
G.CO.6G.CO.7G.CO.8
• Angle-Angle-Side Congruence Theorem• Non-included side
�
Integrated Math I: A Common Core Program 23
Integrated Math I: A Common Core Program
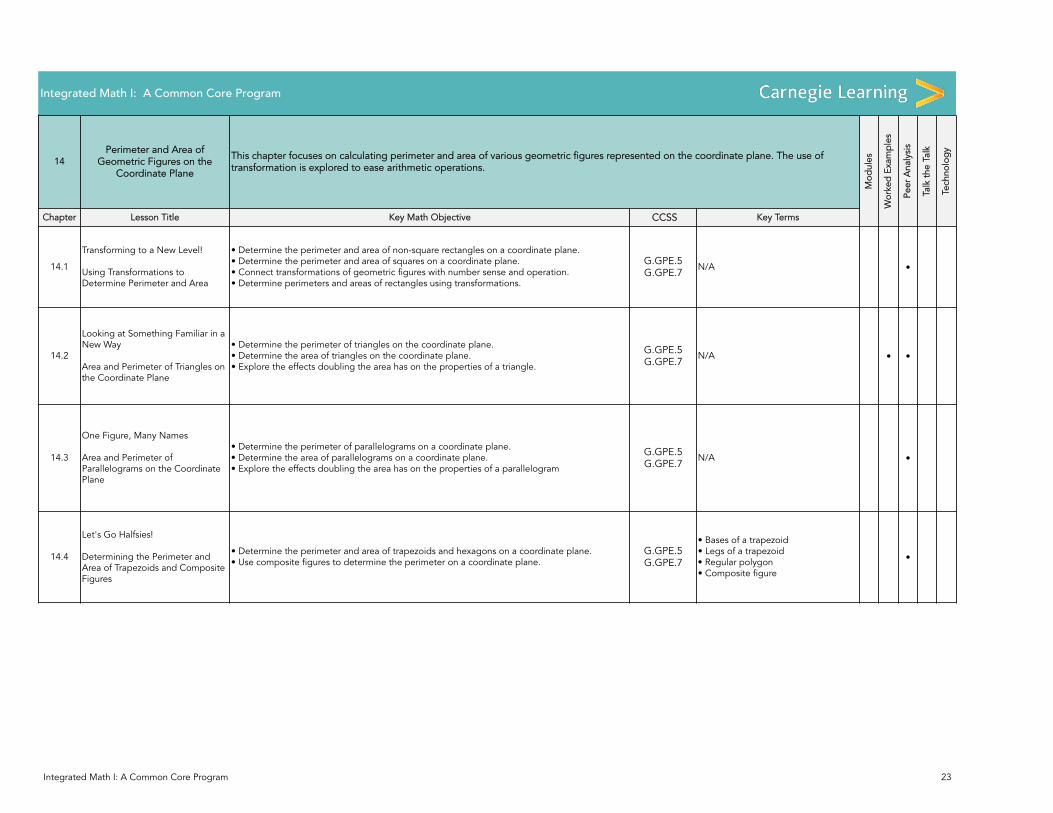
14Perimeter and Area of
Geometric Figures on the Coordinate Plane
Chapter Lesson Title Key Math Objective CCSS Key Terms
14.1
Transforming to a New Level!
Using Transformations to Determine Perimeter and Area
• Determine the perimeter and area of non-square rectangles on a coordinate plane.• Determine the perimeter and area of squares on a coordinate plane.• Connect transformations of geometric figures with number sense and operation.• Determine perimeters and areas of rectangles using transformations.
G.GPE.5G.GPE.7 N/A �
14.2
Looking at Something Familiar in a New Way
Area and Perimeter of Triangles on the Coordinate Plane
• Determine the perimeter of triangles on the coordinate plane.• Determine the area of triangles on the coordinate plane.• Explore the effects doubling the area has on the properties of a triangle.
G.GPE.5G.GPE.7
N/A � �
14.3
One Figure, Many Names
Area and Perimeter of Parallelograms on the Coordinate Plane
• Determine the perimeter of parallelograms on a coordinate plane.• Determine the area of parallelograms on a coordinate plane.• Explore the effects doubling the area has on the properties of a parallelogram
G.GPE.5G.GPE.7
N/A �
14.4
Let's Go Halfsies!
Determining the Perimeter and Area of Trapezoids and Composite Figures
• Determine the perimeter and area of trapezoids and hexagons on a coordinate plane.• Use composite figures to determine the perimeter on a coordinate plane.
G.GPE.5G.GPE.7
• Bases of a trapezoid• Legs of a trapezoid• Regular polygon• Composite figure
�
This chapter focuses on calculating perimeter and area of various geometric figures represented on the coordinate plane. The use of transformation is explored to ease arithmetic operations.
Mod
ules
Wor
ked
Exam
ples
Peer
Ana
lysi
s
Talk
the
Talk
Tech
nolo
gy

Integrated Math I: A Common Core Program 24
Integrated Math I: A Common Core Program
15 Connecting Algebra and Geometry with Polygons
Chapter Lesson Title Key Math Objective CCSS Key Terms
15.1
Name That Triangle!
Classifying Triangles on the Coordinate Plane
• Determine the coordinates of a third vertex of a triangle, given the coordinates of two vertices and a description of the triangle.• Classify a triangle given the locations of its vertices on a coordinate plane.
G.GPE.4 N/A �
15.2
Name that Quadrilateral!
Classifying Quadrilaterals on the Coordinate Plane
• Determine the coordinates of a fourth vertex, given the coordinates of three vertices of a quadrilateral and a description of the quadrilateral.• Classify a quadrilateral given the locations of its vertices on a coordinate plane.
G.GPE.4G.GPE.5
N/A
15.3Is That Point on the Circle?
Determining Points on a Circle
• Determine if a point lies on a circle on the coordinate plane given the circle’s center at the origin, the radius of the circle, and the coordinates of the point.• Determine if a point lies on a circle on the coordinate plane given the circle’s center not at the origin, the radius of the circle, and the coordinates of the point.• Transform a circle about the coordinate plane and determine if a point lies on a circle’s image given the pre-image’s center, radius, and the coordinates of the point.
G.GPE.4 N/A
15.4
Name That Point on the Circle
Circles and Points on the Coordinate Plane
• Determine the coordinates of a point that lies on a circle given the location of the center point and the radius of the circle.• Use the Pythagorean Theorem to determine the coordinates of a point.
G.GPE.4 N/A � �
Wor
ked
Exam
ples
Peer
Ana
lysi
s
Talk
the
Talk
Tech
nolo
gyThis chapter focuses on using slope and distance to classify triangles and quadrilaterals on the coordinate plane. Given a subset of vertices and a set of conditions, the remaining possible vertices are determined.
Mod
ules

Integrated Math I: A Common Core Program 25
Integrated Math I: A Common Core Program
16 Logic
Chapter Lesson Title Key Math Objective CCSS Key Terms
16.1A Little Dash of Logic
Two Methods of Logical Reasoning
• Define inductive reasoning and deductive reasoning.• Identify methods of reasoning.• Compare and contrast methods of reasoning.• Identify why a conclusion may be false.
F.IF.4F.IF.5F.IF.7F.BF.1F.BF.4F.LE.1F.LE.2
�Induction�Deduction � �
16.2
What's Your Conclusion?
Understanding Conditional Statements, Arguments, and Truth Tables
• Define a conditional statement.• Identify the hypothesis and conclusion of a conditional statement.• Explore the truth value of conditional statements.• Use a truth table.
F.IF.4F.IF.5F.IF.7F.BF.1F.BF.4F.LE.1F.LE.2
• Conditional statement• Propositional form• Propositional variables• Hypothesis• Conclusion• Truth value• Truth table• Converse• Inverse• Contrapositive• Logically equivalent• Biconditional statement
�
Mod
ules
Wor
ked
Exam
ples
Peer
Ana
lysi
s
Talk
the
Talk
Tech
nolo
gy

Integrated Math I: A Common Core Program 26
Integrated Math I: A Common Core Program
16.3
Proofs Aren't Just for Geometry
Introduction to Direct and Indirect Proof with the Properties of Numbers
• Use the commutative, associative, identity, and inverse properties for addition and multiplication.• Use the distributive property.• Use direct proof to prove a theorem.• Use indirect proof to prove a theorem
F.IF.4F.IF.5F.IF.7F.BF.1F.BF.4F.LE.1F.LE.2
• Proof by contradiction �
16.4
Your Oldest Likes Spinach?
Using Logic to Solve Problems, Part 1
• Solve problems using logic.• Solve logic problems using grids.
F.IF.4F.IF.5F.IF.7F.BF.1F.BF.4F.LE.1F.LE.2
N/A �
16.5
Shoes and Math Scores?
Using Logic to Solve Problems, Part 2
• Solve problems using logic.• Solve logic problems using grids.
F.IF.4F.IF.5F.IF.7F.BF.1F.BF.4F.LE.1F.LE.2
N/A �