Integrated Math 3 Module 5 Honors Modeling with Functions...
22
1 Integrated Math 3 Module 5 Honors Modeling with Functions Ready, Set, Go! Homework Solutions Adapted from The Mathematics Vision Project: Scott Hendrickson, Joleigh Honey, Barbara Kuehl, Travis Lemon, Janet Sutorius © 2014 Mathematics Vision Project | MVP In partnership with the Utah State Office of Education Licensed under the Creative Commons Attribution-NonCommercial-ShareAlike 3.0 Unported license.
Transcript of Integrated Math 3 Module 5 Honors Modeling with Functions...

1
Integrated Math 3 Module 5 Honors
Modeling with Functions Ready, Set, Go! Homework
Solutions
Adapted from
The Mathematics Vision Project:
Scott Hendrickson, Joleigh Honey, Barbara Kuehl,
Travis Lemon, Janet Sutorius
© 2014 Mathematics Vision Project | MVP In partnership with the Utah State Office of Education
Licensed under the Creative Commons Attribution-NonCommercial-ShareAlike 3.0 Unported license.
2
Name Modeling with Functions 5.1H
Ready, Set, Go!
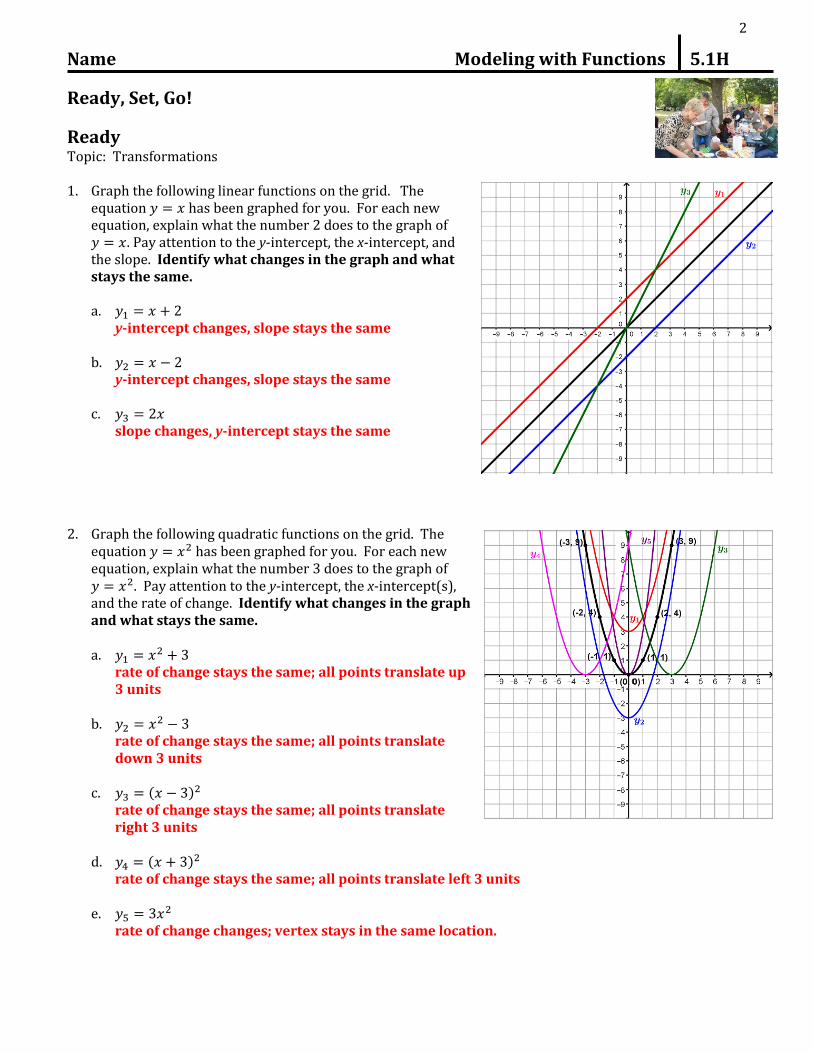
Ready Topic: Transformations 1. Graph the following linear functions on the grid. The
equation has been graphed for you. For each new equation, explain what the number 2 does to the graph of . Pay attention to the y-intercept, the x-intercept, and the slope. Identify what changes in the graph and what stays the same.
a.
y-intercept changes, slope stays the same b.
y-intercept changes, slope stays the same c.
slope changes, y-intercept stays the same 2. Graph the following quadratic functions on the grid. The
equation has been graphed for you. For each new equation, explain what the number 3 does to the graph of . Pay attention to the y-intercept, the x-intercept(s), and the rate of change. Identify what changes in the graph and what stays the same.
a.
rate of change stays the same; all points translate up 3 units
b.
rate of change stays the same; all points translate down 3 units
c. ( )
rate of change stays the same; all points translate right 3 units
d. ( )
rate of change stays the same; all points translate left 3 units
e.
rate of change changes; vertex stays in the same location.
3
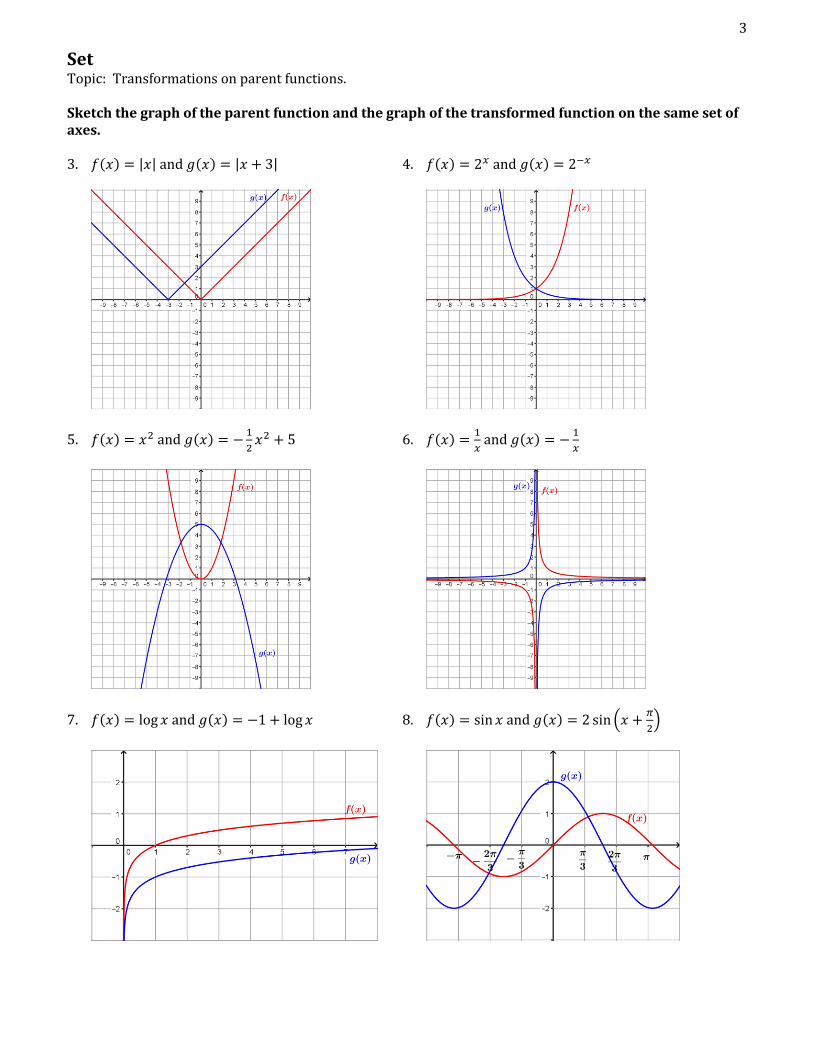
Set Topic: Transformations on parent functions. Sketch the graph of the parent function and the graph of the transformed function on the same set of axes. 3. ( ) | | and ( ) | | 4. ( ) and ( )
5. ( ) and ( )
6. ( )
and ( )
7. ( ) and ( ) 8. ( ) and ( ) (
)

4
Go Topic: Evaluating functions Find the function values: ( ) ( ) ( ) ( ) Indicate if the function is undefined for a given value of x. 9. ( ) | | 10. ( ) | | 11. ( ) | | ( ) ( ) ( ) ( ) ( ) ( ) ( ) ( ) ( ) ( ) ( ) ( ) 12. ( ) 13. ( ) 14. ( ) ( )
( )
( ) ( ) ( ) ( )
( )
( ) ( ) ( ) ( ) ( ) ( )
15. ( )
16. ( )
( ) 17. ( )
( )
( ) ( ) ( )
( ) ( ) ( )
( ) ( ) ( )
( ) ( )
( )
18. ( ) 19. ( ) ( )
20. ( ) ( ) ( ) ( ) ( ) ( ) ( ) ( ) ( ) ( ) ( ) ( ) ( )

5
Name Modeling with Functions 5.2H
Ready, Set, Go!
Ready Topic: Function boundaries. 1. The black solid curve in the graph at the right shows the
graph of ( ) .
Write the equation of the dashed line labeled ( ).
( )
Write the equation of the dotted line labeled ( ).
( ) List everything you notice about these three graphs.
( ) touches all the maximum points on ( ) and ( ) touches all the minimum points on ( ).
2. The black solid curve in the graph at the right shows the graph
of ( ) .
Write the equation of the dashed line labeled ( ).
( )
Sketch the graph of ( ) ( ) on the same grid. What is the equation of ( ) ( )?
Would the line also be a boundary line for your sketch of ( ) ( )? Explain.
Yes it would be a boundary line because it would hit all the minimum points.

6
3. The black solid curve in the graph at the right shows the graph of ( ) .
Write the equation of the dashed line labeled ( ).
( )
Sketch the graph of ( ) ( ) on the same grid. What is the equation of ( ) ( )?
Would the line also be a boundary line for your sketch of ( ) ( )? Explain.
Yes it would be a boundary line because it hits all the maximum points. How does the graph of ( ) ( ) differ from the graph of ( ) ( ) from question 2?
The graphs are reflections over the x-axis.
Set Topic: Combining functions 4. ( ) ( ) ( ) ( ) ( )
Some values for ( ) and ( ) are given. Fill in the values for ( ). Then graph ( ) with a smooth curve.
( ) ( ) ( )
0
1
0
0 0 0 0
1.57 1 2.57
3.14 0 3.14
4.71 3.71
6.28 0 6.28

7
5. ( ) ( )
Now graph ( ) ( ) ( ) or ( )
( ) ( ) ( )
0 0
1
0 0
1.57
0 0 0 0
1.57 1 1.57
3.14 0 0
4.71
6.28 0 0

8
Match the equations with the appropriate graph. Describe the features of the graph that helped you match the equations. 6. ( ) | |
Key features: F; always positive & without the absolute value function, it is a parabola with a vertex at ( ).
7. ( ) Key features: B; Sine curve following the line
8. ( ) | | Key features: C; sine curve that is always positive.
9. ( ) ( ) Key features: A; y-intercept is 10.
10. ( ) Key features: D; amplitude in the middle of the graph is 2.
11. ( ) ( ) | | Key features: E; contains the line left of the y-axis.
a.
b.
c.
d.
e.
f.

9
Go Topic: Families of functions The chart below names five families of functions and the parent function. The parent is the equation in its simplest form. In the right hand column is a list of key features of the functions in random order. Match each key feature with the correct function. A key feature may relate to more than one function.
Family Parent(s) Key Features
11. Linear (E, H, I, P)
a. The ends of the graph have the same behavior. b. The graphs may have a horizontal asymptote and a vertical asymptote. c. The graph only has a horizontal asymptote. d. These functions either have both a local maximum and minimum or no
local maximum and minimum. e. The graph is usually defined in terms of its slope and y-intercept. f. The graph has either a maximum or a minimum but not both. g. As x approaches , the function values approach the x-axis. h. The ends of the graph have opposite behavior. i. The rate of change of this graph is constant. j. The rate of change of this graph is constantly changing. k. This graph has a linear rate of change. l. These functions are of degree 3. m. The variable is an exponent. n. These functions contain fractions with a polynomial in both the numerator
and denominator. p. The constant will always be the y-intercept.
12. Quadratic (A, F, K, P)
13. Cubic (D, H, L, P)
14. Exponential (C, G, J, M)
Etc.
15. Rational (B, D, G, J, N)
10
Name Modeling with Functions 5.3H
Ready, Set, Go!
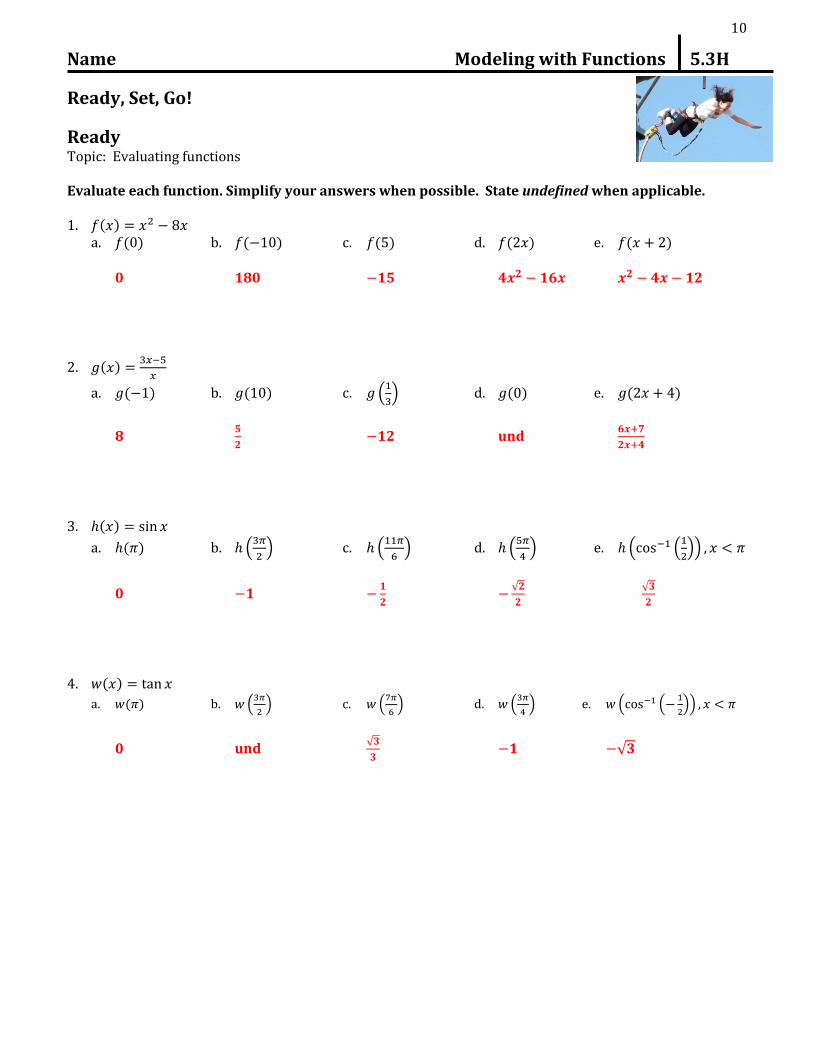
Ready Topic: Evaluating functions Evaluate each function. Simplify your answers when possible. State undefined when applicable. 1. ( ) a. ( ) b. ( ) c. ( ) d. ( ) e. ( ) 0 180
2. ( )
a. ( ) b. ( ) c. (
) d. ( ) e. ( )
8
und
3. ( )
a. ( ) b. (
) c. (
) d. (
) e. ( (
))
0
√
√
4. ( )
a. ( ) b. (
) c. (
) d. (
) e. ( (
))
0 und √
√
11
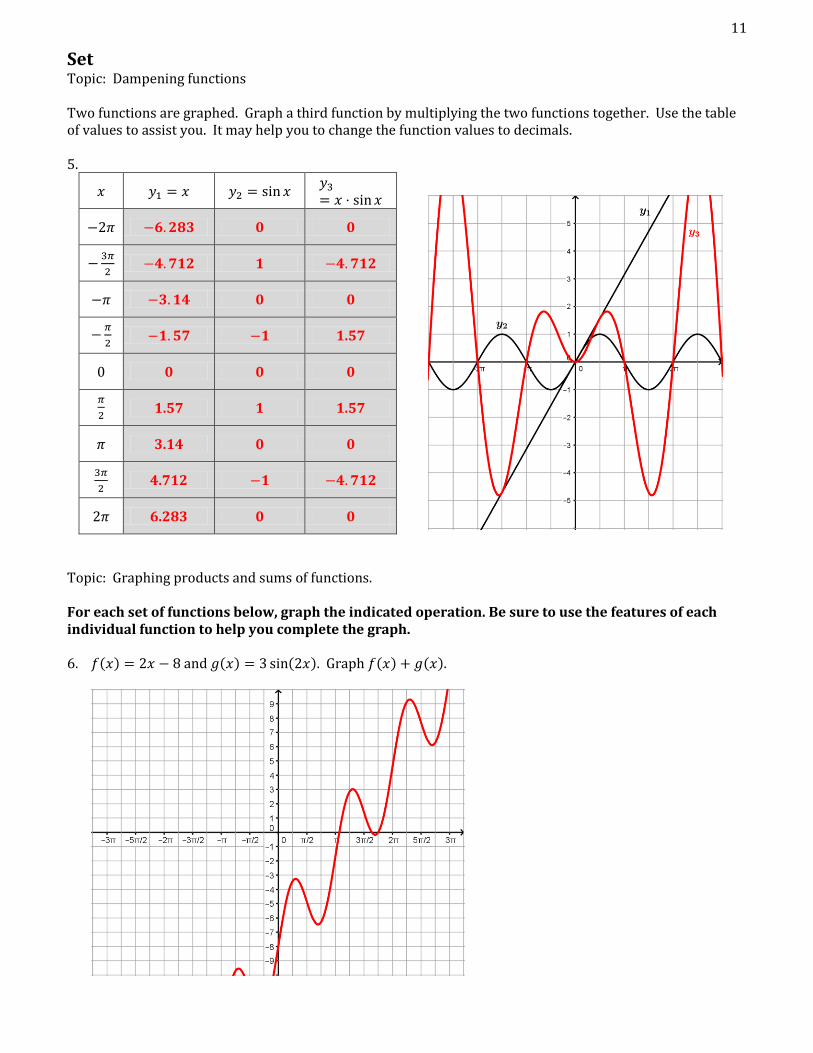
Set Topic: Dampening functions Two functions are graphed. Graph a third function by multiplying the two functions together. Use the table of values to assist you. It may help you to change the function values to decimals. 5.
0 0
1
0 0
1.57
0 0 0 0
1.57 1 1.57
3.14 0 0
4.712
6.283 0 0
Topic: Graphing products and sums of functions. For each set of functions below, graph the indicated operation. Be sure to use the features of each individual function to help you complete the graph. 6. ( ) and ( ) ( ). Graph ( ) ( ).

12
7. ( ) (
)
and ( ) ( ). Graph ( ) ( ).
Go Topic: Measures of central tendency (Mean, median, mode) During salary negotiations for teacher pay in a rural community, the local newspaper headlines announced: Greedy Teachers Demand More Pay! The article went on to report that teachers were asking for a pay hike even though district employees, including teachers, were paid an average of $70,000 per year, while the average annual income for the community was calculated to be $55,000 per household. The 65 school teachers in the district responded by declaring that the newspaper was spreading false information. Use the table below to explore the validity of the newspaper report. Job Description Number Having Job Annual Salary Superintendent 1 $258,000 Business Administrator 1 $250,000 Financial Officer 1 $205,000 Transportation Coordinator 1 $185,000 District secretaries 5 $ 55,000 School Principals 5 $200,000 Assistant Principals 5 $175,000 Guidance Counselors 10 $ 85,000 School Nurse 5 $ 83,000 School Secretaries 10 $ 45,000 Teachers 65 $ 48,000 Custodians 10 $ 40,000
8. Which measure of central tendency (mean, median, mode) do you think the newspaper used to report
the teachers’ salaries? Justify your answer. They used the mean since the mean is $69,605.04 and the median and mode are both $48,000. The mean is skewed away from the salary of teachers due to higher up positions in the district.
13
9. Which measure of central tendency do you think the teachers would use to support their argument? Justify your answer.
The median would support their argument since the salary of teachers is the median of the data. The median is lower than the annual income for the community.
10. Which measure gives the clearest picture of the salary structure in the district? Justify.
Mean gives the clearest picture of the salary structure because it shows how skewed the salaries are in favor of administrators (away from teachers’ salaries).
11. Make up a headline for the newspaper that would be more accurate.
Answers may vary.
14
Name Modeling with Functions 5.4H
Ready, Set, Go!
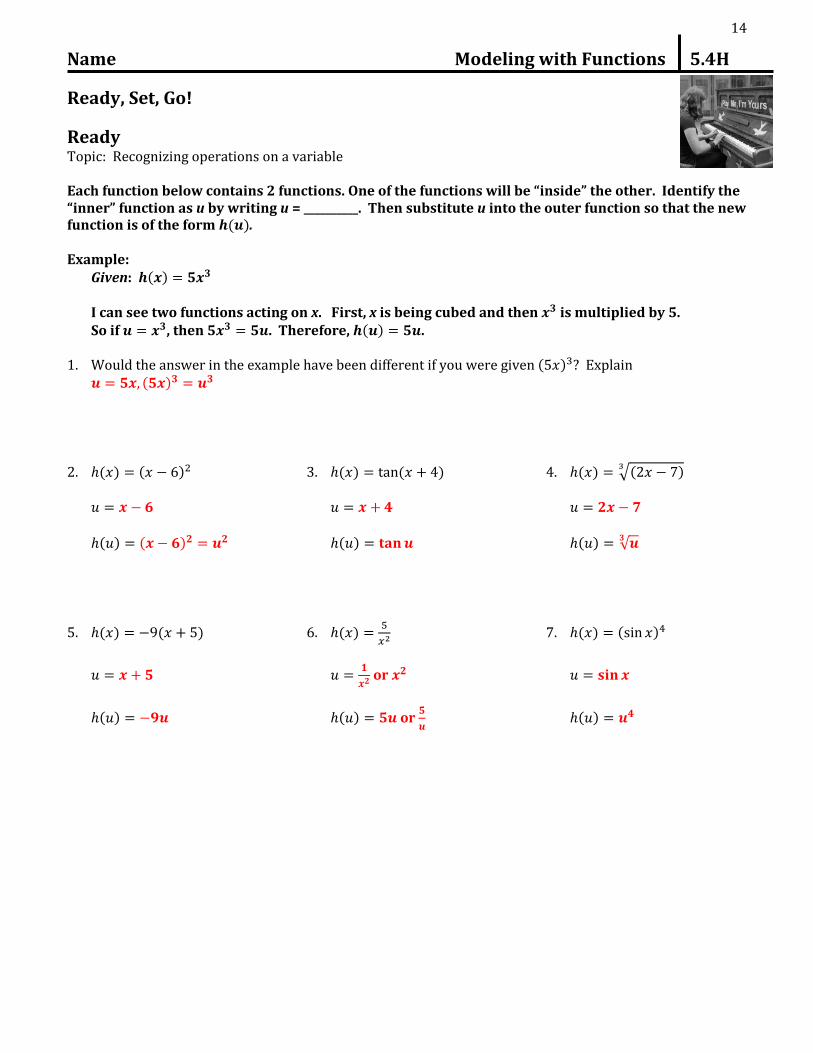
Ready Topic: Recognizing operations on a variable Each function below contains 2 functions. One of the functions will be “inside” the other. Identify the “inner” function as u by writing u = __________. Then substitute u into the outer function so that the new function is of the form ( ). Example:
Given: ( )
I can see two functions acting on x. First, x is being cubed and then is multiplied by 5. So if , then . Therefore, ( ) .
1. Would the answer in the example have been different if you were given ( ) ? Explain
( )
2. ( ) ( ) 3. ( ) ( ) 4. ( ) √( )
( ) ( ) ( ) ( ) √
5. ( ) ( ) 6. ( )
7. ( ) ( )
or
( ) ( ) or
( )

15
Topic: Identifying and graphing conic sections Identify the type of conic section (parabola, circle, ellipse, or hyperbola). Then graph the conic section. 8. ( ) ( ) 9. ( ) ( ) Circle Parabola
10. ( )
( )
11.
Ellipse Hyperbola
16
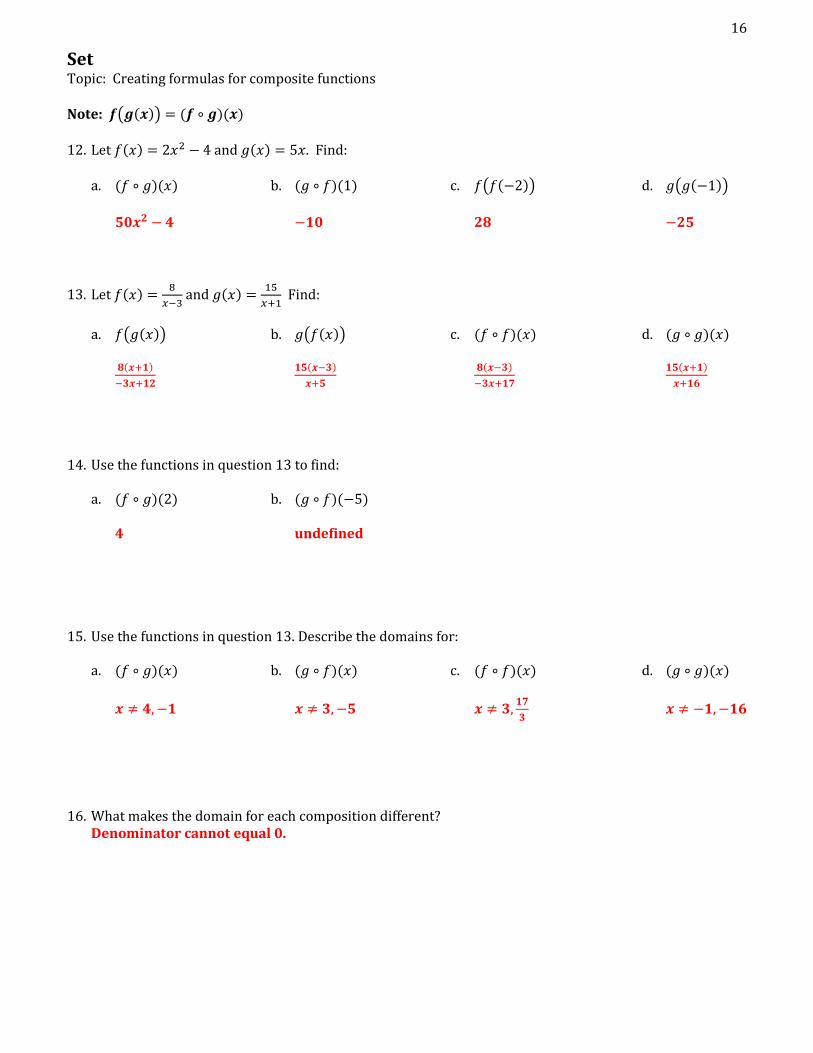
Set Topic: Creating formulas for composite functions
Note: ( ( )) ( )( )
12. Let ( ) and ( ) . Find:
a. ( )( ) b. ( )( ) c. ( ( )) d. ( ( ))
28
13. Let ( )
and ( )
Find:
a. ( ( )) b. ( ( )) c. ( )( ) d. ( )( )
( )
( )
( )
( )
14. Use the functions in question 13 to find: a. ( )( ) b. ( )( )
4 undefined
15. Use the functions in question 13. Describe the domains for:
a. ( )( ) b. ( )( ) c. ( )( ) d. ( )( )
16. What makes the domain for each composition different?
Denominator cannot equal 0.
17
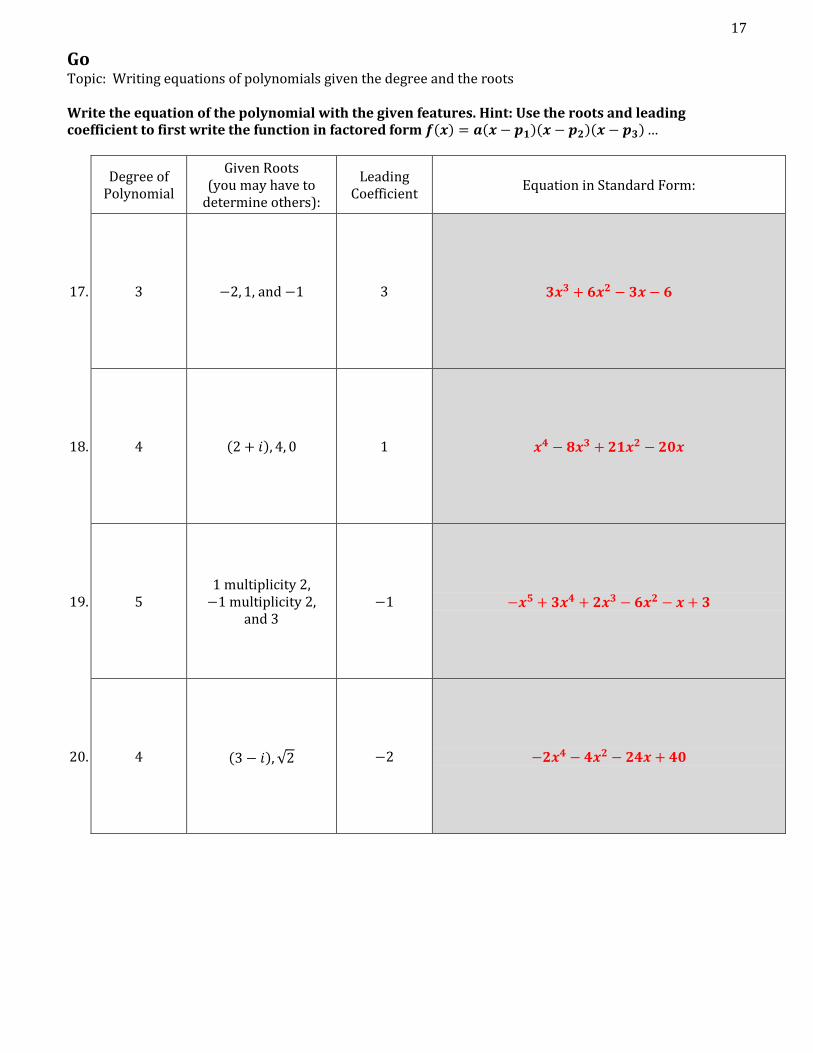
Go Topic: Writing equations of polynomials given the degree and the roots Write the equation of the polynomial with the given features. Hint: Use the roots and leading coefficient to first write the function in factored form ( ) ( )( )( )
Degree of
Polynomial
Given Roots (you may have to
determine others):
Leading Coefficient
Equation in Standard Form:
17. 3 and 3
18. 4 ( ) 1
19. 5 1 multiplicity 2, multiplicity 2,
and 3
20. 4 ( ) √

18
Name Modeling with Functions 5.5H
Ready, Set, Go!
Ready Topic: Using a table to find the value of a composite function Use the table to find the indicated function values.
( ) ( )
Example: Find ( ( )). ( ) ( )
Therefore, ( ( ))
2 3
1
0 3
1
2 0
3 19 0
1. ( ( )) 2. ( ( )) 3. ( ( )) 4. ( ( ))
3 1 5. ( ( )) 6. ( ( )) 7. ( ( ))
0 0 19 8. Do the graphs of ( ) and ( ) ever intersect each other? How do you know? Yes because ( ) ( ) Use the graph at the right to find the indicated values. 9. ( ( )) 10. ( ( ))
6 2 11. ( ( )) 12. ( ( ))
0 6
19
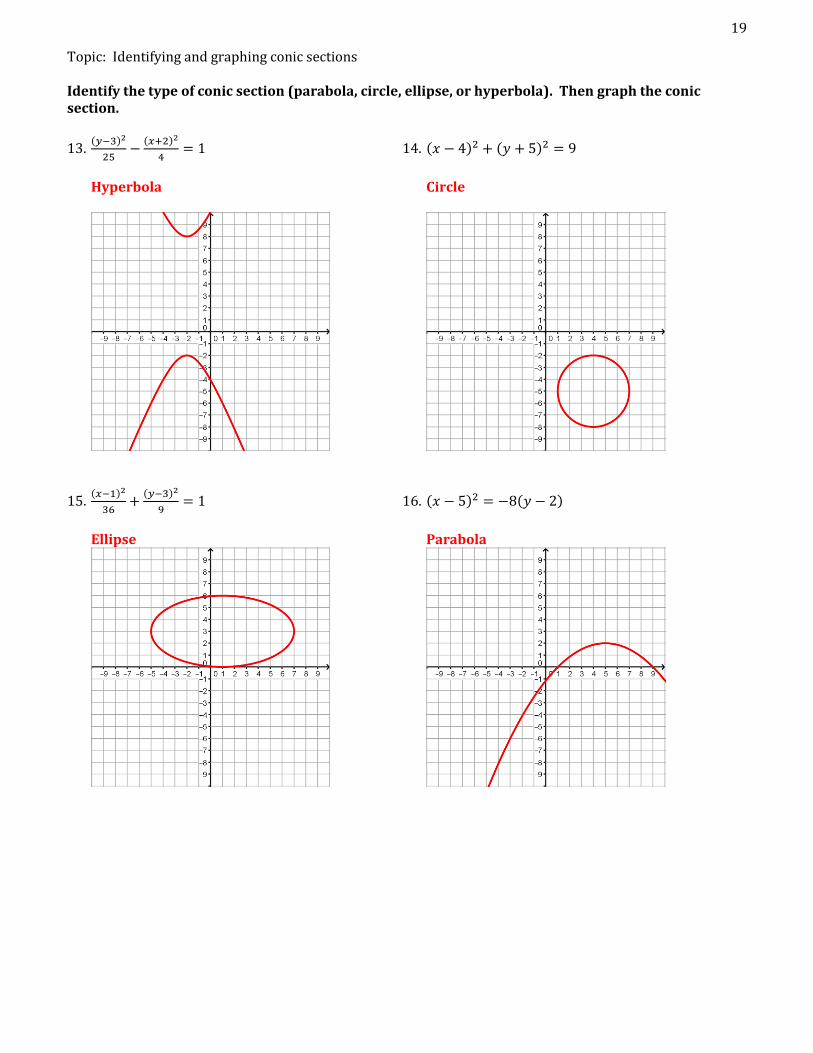
Topic: Identifying and graphing conic sections Identify the type of conic section (parabola, circle, ellipse, or hyperbola). Then graph the conic section.
13. ( )
( )
14. ( ) ( )
Hyperbola Circle
15. ( )
( )
16. ( ) ( )
Ellipse Parabola
20
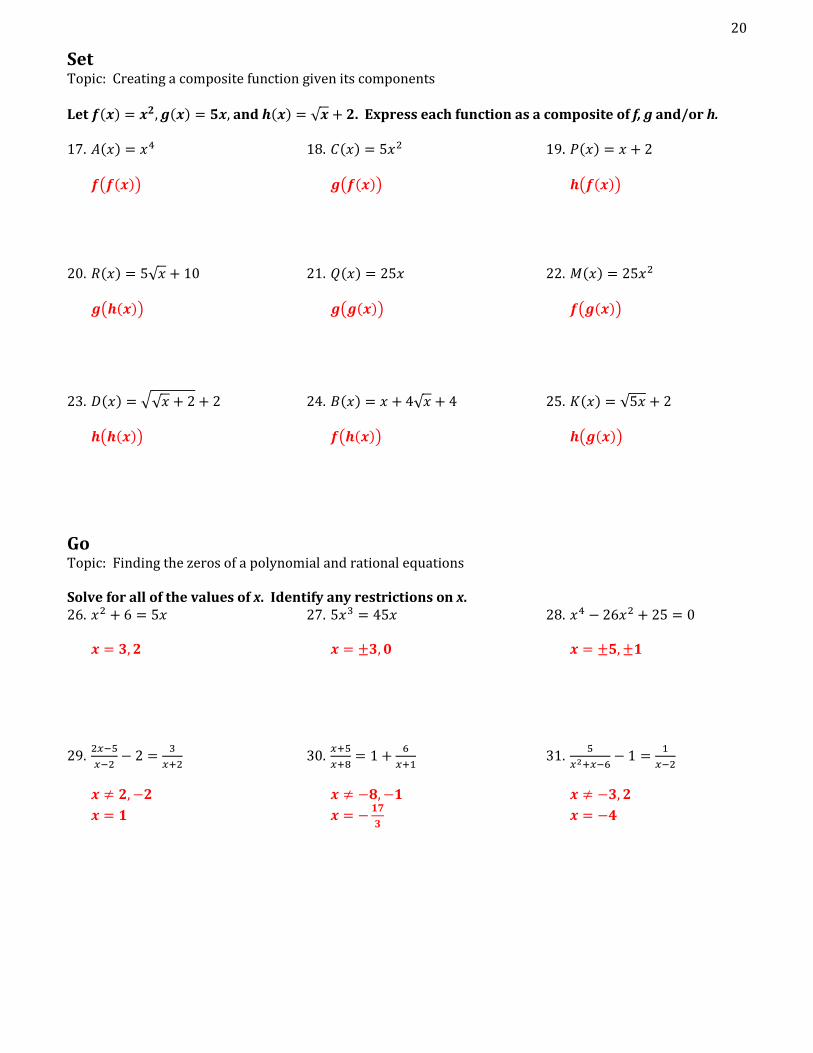
Set Topic: Creating a composite function given its components
Let ( ) ( ) and ( ) √ . Express each function as a composite of f, g and/or h. 17. ( ) 18. ( ) 19. ( )
( ( )) ( ( )) ( ( ))
20. ( ) √ 21. ( ) 22. ( )
( ( )) ( ( )) ( ( ))
23. ( ) √√ 24. ( ) √ 25. ( ) √
( ( )) ( ( )) ( ( ))
Go Topic: Finding the zeros of a polynomial and rational equations Solve for all of the values of x. Identify any restrictions on x. 26. 27. 28.
29.
30.
31.

21
Name Modeling with Functions 5.6H
Ready, Set, Go!
Ready Topic: Identifying and graphing conic sections Identify the type of conic section (parabola, circle, ellipse, or hyperbola). Then graph the conic section.
1. ( ) ( ) 2. ( )
( )
Parabola Hyperbola
3. ( ) ( ) 4. ( )
( )
Circle Ellipse

22
Set Topic: Identifying the 2 functions that make up a composite function Find functions f and g so that
5. ( ) √ 6. ( ) (
)
7. ( ) ( )
( ) √ ( ) ( ) ( )
( ) ( )
8. ( ) | | 9. ( )
10. ( ) ( )
( ) | | ( ) ( )
( ) ( ) ( )
11. ( ) ( ) 12. ( ) √
13. ( ) ( )
( ) ( ) ( ) √ ( )
( ) ( )
Go Topic: Finding function values given the graph Use the graph to find all of the missing values. 14. ( ) 15. ( )
0 16. ( ) 17. ( )
0 5 18. ( ) 19. ( )
0 5 20. ( ) ( ) 21. ( ) ( )
( ) ( ) ( ) ( ) 22. ( ) ( )=0 23. ( ) ( )
6 24. ( ) ( )