Integrated Master s in Environmental Engineering 2012/2013 · Integrated Master’s in...
142
Integrated Master’s in Environmental Engineering 2012/2013 INDOOR ULTRAFINE PARTICLES: EVALUATION OF PRE-SCHOOL ENVIRONMENTS JIMMY ANDRÉS CARVALHO FONSECA Dissertation for the Degree of: MASTER IN ENVIRONMENTAL ENGINEERING President of the Jury: Fernando Francisco Machado Veloso Gomes Cathedratic Professor of the Department of Civil Engineering of the Faculty of Engineering of the University of Porto ___________________________________________________________ Supervisor: Maria do Carmo da Silva Pereira Auxiliary Professor of the Department of Chemical Engineering of the Faculty of Engineering of the University of Porto Co-Supervisor: Klára Slezáková Post-Doctoral Researcher Porto, July 2013
Transcript of Integrated Master s in Environmental Engineering 2012/2013 · Integrated Master’s in...

Integrated Master’s in Environmental Engineering
2012/2013
INDOOR ULTRAFINE PARTICLES:
EVALUATION OF PRE-SCHOOL ENVIRONMENTS
JIMMY ANDRÉS CARVALHO FONSECA
Dissertation for the Degree of:
MASTER IN ENVIRONMENTAL ENGINEERING
President of the Jury: Fernando Francisco Machado Veloso Gomes Cathedratic Professor of the Department of Civil Engineering of the Faculty of Engineering of
the University of Porto
___________________________________________________________ Supervisor: Maria do Carmo da Silva Pereira
Auxiliary Professor of the Department of Chemical Engineering of the Faculty of Engineering of the University of Porto
Co-Supervisor: Klára Slezáková
Post-Doctoral Researcher
Porto, July 2013

Faculty of Engineering University of Porto
Indoor Ultrafine Particles: Evaluation of Pre-School
Environments
Jimmy Andrés Carvalho Fonseca
Dissertation for the Degree
Integrated Master’s in Environmental Engineering
Supervisor: Maria do Carmo da Silva Pereira
Co-Supervisor: Klara Slezakova
Porto, July 2013

Abstract
Recent scientific evidence indicates that a specific “subclass” of particulate matter (PM) - ultrafine
particles (UFPs) have a greater potential to cause adverse health effects than larger particles. UFPs are
defined as particles with aerodynamic diameter smaller than 100 nm. Due to their small sizes, they
penetrate deep in the respiratory system, as far the alveolar wall and the bloodstream, which may lead
to deposition in specific organ tissues. UFP are also associated with very high surface areas and
compositions including toxic and carcinogenic substances, such as heavy metals and polycyclic
aromatic hydrocarbons. These factors, and considering the predominant contribution of UFPs number
concentration to PM, indicates the importance of further studies of this pollutant for environmental
and health purposes. This is particularly relevant for children, as they have developing, and therefore,
more susceptible respiratory systems, and are more commonly associated with high intensity activities
and inhalation rates. Considering the fact that most children spend a great amount of their time in
school, an analysis on school environments regarding UFP is worthy of note. Thus this work aims to
evaluate UFP in pre-schools environments. The specific objectives were: (i) to assess ultrafine particle
number concentration in three Portuguese pre-schools; (ii) to evaluate potential emission sources of
ultrafine particles in pre-school environments; and (iii) to estimate exposure dose of 3 to 5 years old
children to ultrafine particles in pre-school environments.
UFP particle number concentrations were collected in 3 Portuguese pre-schools (one rural and two
urban), during a total of 31 days. UFP were concurrently sampled for both outdoors (schools’
playgrounds) and indoors (various micro-environments) each day from 08:30 to 17:30. Meteorological
outdoor conditions and temperature and relative humidity of each micro-environment were also
collected during sampling days.
The results showed that average indoor UFP number concentration levels were higher for the urban
schools (9.35×10³ and 1.07×10
4 particle number cm-3 than in the rural one (6.86×10
3 particle number
cm-3
). Regarding outdoor ambient concentration levels of UFP, schools located in urbanized areas
exhibited higher average UFP number concentrations (1.71×10⁴ and 1.21×10
4 particle number cm
-3)
than the one in a rural environment (1.02×10⁴). In all three schools mean I/O ratios of UFP were lower
than 1, indicating that outdoor emissions were the main contributor of UFP concentrations observed
indoors. The levels of UFP highly varied between different indoor school micro-environments, with
classrooms being the micro-environment with lower UFP number concentrations and canteens with
the highest values. Calculated higher exposure doses of UFP yielded the result that urban schools
presented higher values than the rural school.

“Encumbered forever by desire and ambition, there's a hunger still unsatisfied. Our weary
eyes still stray to the horizon, though down this road we've been so many times”
Pink Floyd – High Hopes


Acknowledgements
Throughout the whole development of this work, many are the ones to whom I now owe my gratitude,
for all that they’ve done. Although not much, these are my words to them.
First of all, I would like to thank my supervisor and co-supervisor, Professor Maria do Carmo da Silva
Pereira and Klára Slezáková, for their precious guidance in every step of this work. Thank you for
your suggestions and advices, constructive criticism, patience, and understanding to my limitations
and difficulties, all of which much contributed to my academic and personal growth.
I would also like to thank Professor Oliveira Fernandes, Dr. Gabriela Ventura and Joana Madureira,
from the Institute of Mechanical Engineering (IdMEC), for providing me with the equipment used in
this work.
This work would also not have been possible without the cooperation and patience of all the schools I
analyzed. I’m greatly thankful for the help of Irmã Aurora from Colégio Luso-Francês, Dr. Tiago
Barros from Pom-Pom, Dra. Felisbina Moreira das Neves and Dra. Laura Lima Viera, of
Agrupamento de Escolas de Alfena and especially Prof. Maria do Céu from EB1 / J.I. do Xisto. As for
the other members, teachers and staff of the schools, although it’s impossible to mention all of them
by name, my gratitude will not be silent.
My deepest and largest thanks go to my family. To all my relatives, thank you for always blessing me
with kind words of encouragement and believing in me without a sliver of doubt. To my parents, thank
you so much for all that you’ve done for me, from supporting me through five years of college to
always raising me to be a decent, honest and hardworking person. As for my other family, the one I
chose, my friends, I thank each and every one of you for all the good times spent by your side. Be it
during lunches, by the coffee machine, during classes or in any other situation, as long as you were
there, things were always better.
Finally, there is one more “thank you” I have to say, directed to the Faculty of Engineering of the
University of Porto, embodied by its teachers and students. Thank you all for what you’ve done,
directly or indirectly, in little or large amounts, intentionally or not. Thanks to you, I’ve learned to be
an Engineer both on an academic level, as well as on a personal level. For the last five years, this place
truly was a Home.
This work was supported by the IJUP project PP_IJUP2011 121.


List of Publications
Most of the content presented in this thesis was submitted or accepted for publication in:
Publications in Scientific Meetings with abstract:
1. J. Fonseca, K. Slezakova, S. Morais, M. C. Pereira, Ultrafine particle measurements at an urban
school, 10ª Conferência Nacional do Ambiente – Congresso Nacional de Engenharia do
Ambiente, Aveiro November 2013.
2. J. Fonseca, K. Slezakova, S. Morais, M. C. Pereira, Assessment of ultrafine particles in a urban
Portuguese pre-school: levels and sources identification, International Conference on
Occupational & Environmental Toxicology 2013, Porto September 2013.

XIII
Indoor Ultrafine Particles: Evaluation of Pre-school Environments
Table of Contents
Abstract………………………………………………………………………….………...…..V
Acknowledgements………………………………………………………….…..….….…..…IX
List of Publications…………………………………………………………………….……..XI
List of Figures……………………………………………………………………………….XV
List of Tables……………………………………………………………………………….XIX
Nomenclature……………………………………………………………………………….XXI
1. INTRODUCTION ............................................................................................................. 1 1.1 Relevance and Motivation ......................................................................................... 1 1.2 Objectives .................................................................................................................. 2 1.3 Thesis Outline ............................................................................................................ 2 1.4 References .................................................................................................................. 3
2. STATE OF THE ART ...................................................................................................... 5 2.1 Air Pollution ............................................................................................................... 5 2.2 Indoor and Outdoor Air Quality and Exposure .......................................................... 6 2.3 Particulate Matter ....................................................................................................... 9
2.3.1 Coarse Mode ................................................................................................ 11 2.3.2 Fine Mode .................................................................................................... 12
2.4 Nuclei Mode - Ultrafine Particles ............................................................................ 13
2.4.1 Properties ...................................................................................................... 14
2.4.2 Sources ......................................................................................................... 15 2.4.3 Formation Processes ..................................................................................... 16
2.4.4 Composition ................................................................................................. 17 2.4.5 Environmental Effects .................................................................................. 18 2.4.6 Health Effects ............................................................................................... 19
2.5 Ultrafine Particles and Future Research Needs........................................................ 20 2.6 Legislation ................................................................................................................ 21
2.7 References ................................................................................................................ 23
3. MATERIALS AND METHODS .................................................................................... 31 3.1 School Characterization ........................................................................................... 31
3.1.1 Urban School 1 ............................................................................................. 31
3.1.2 Urban School 2 ............................................................................................. 33 3.1.3 Rural School 1 .............................................................................................. 36 3.1.4 Overview of the most important properties of each school ......................... 38
3.2 Micro-environments ................................................................................................. 40 3.3 Sample Collection .................................................................................................... 43
3.4 Children Daily Activities ......................................................................................... 47 3.4.1 Urban School 1 ............................................................................................. 47 3.4.2 Urban School 2 ............................................................................................. 48 3.4.3 Rural School 1 .............................................................................................. 50
3.5 Dose Rate ................................................................................................................. 51 3.6 Statistical Analysis ................................................................................................... 53 3.7 References ................................................................................................................ 53

XIV
Indoor Ultrafine Particles: Evaluation of Pre-school Environments
4. RESULTS .........................................................................................................................55 4.1 Particle Number Concentrations and Comparison with other Studies .....................55
4.2 Evaluation of Ultrafine Particle Sources in Pre-School Environments ....................59 4.3 Particle Number Concentration in Different Pre-School Micro-Environments .......61 4.4 Assessment of Exposure Doses for 3 to 5 years old children...................................67 4.5 References ................................................................................................................74
5. CONCLUSION AND FUTURE PERSPECTIVES ......................................................77 5.1 Conclusions ..............................................................................................................77 5.2 Future Perspectives ...................................................................................................78
APPENDIX
A. Micro-Environment Characterization……………………………………………………A-1

XV
Indoor Ultrafine Particles: Evaluation of Pre-school Environments
List of Figures
Chapter 2:
Figure 2.1 – Schematic representation of the size distribution of atmospheric particles.
(Extracted from Slezakova, Morais et al. 2013) .................................................. 12
Chapter 3:
Figure 3.1 – Colégio Luso-Francês. ......................................................................................... 32
Figure 3.2 – Luso-Francês's geographical layout. .................................................................... 32
Figure 3.3 – Average traffic density profiles for the two streets surrounding CLF. ................ 33
Figure 3.4 – Pom-Pom. ............................................................................................................. 34
Figure 3.5 – Pom-Pom's geographical layout. .......................................................................... 35
Figure 3.6 –Average traffic density profiles for the two streets surrounding Pom-Pom.......... 36
Figure 3.7 – Escola EB1 / J.I. do Xisto .................................................................................... 37
Figure 3.8 – Escola EB1 / J.I. do Xisto's geographical layout. ................................................ 37
Figure 3.9 – Average traffic density profiles for the two streets surrounding Escola EB1 /
J.I. do Xisto. ........................................................................................................ 38
Figure 3.10 – Used TSI P-Traks™ Model 8525. ..................................................................... 43
Figure 3.11 – Condensation Particle Counter schematic. Extracted from (TSI Inc. 2012). ..... 44
Figure 3.12 – Associated analytical methods according to particle size range and type.
Extracted from (TSI Inc. 2012). .......................................................................... 44
Figure 3.13 – Testo 174H. ........................................................................................................ 45
Figure 3.14 – Used metric tape. ................................................................................................ 47
Chapter 4:
Figure 4.1 – Ultrafine particle number concentrations at three schools: average minimum
and maximum values, median, 25th
and 75th
percentile. ..................................... 56
Figure 4.2 – Average UFP number concentrations for the studied micro-environments at
three pre-schools. ................................................................................................ 61
Figure 4.3 – Daily profile of UFP concentrations for the canteens of the three schools. ......... 63
Figure 4.4 – Daily profile of UFP concentrations for selected classrooms in US1. ................. 64
Figure 4.5 – Daily profile of UFP concentrations for selected classrooms in US2. ................. 64
Figure 4.6 – Daily profile of UFP concentrations for selected classrooms in RS1. ................. 65
Figure 4.7 – Daily profile of UFP concentrations in the gymnasium in US2. ......................... 66
Figure 4.8 – Daily profile of UFP concentrations in the playroom in US1. ............................. 67

XVI
Indoor Ultrafine Particles: Evaluation of Pre-school Environments
Appendix:
Figure 1 – 0 Floor Classroom estimated blueprint. .....................................................................2
Figure 2 – 0 Floor Classroom (1). ...............................................................................................3
Figure 3 – 0 Floor Classroom (2). ...............................................................................................3
Figure 4 – 1 Floor Classroom A estimated blueprint. .................................................................4
Figure 5 – 1 Floor Classroom A..................................................................................................5
Figure 6 – 1 Floor Classroom B estimated blueprint. .................................................................6
Figure 7 – 1 Floor Classroom B (1). ...........................................................................................6
Figure 8 – 1 Floor Classroom B (2). ...........................................................................................7
Figure 9 – Canteen estimated blueprint. .....................................................................................8
Figure 10 – Canteen (1). .............................................................................................................8
Figure 11 - Canteen (2). ..............................................................................................................9
Figure 12 – Playroom estimated blueprint. ...............................................................................10
Figure 13 – Playroom (1). .........................................................................................................10
Figure 14 – Playroom (2). .........................................................................................................11
Figure 15 – Schematic Representation of Outdoor Sampling Location. ..................................11
Figure 16 – Exterior (1). ...........................................................................................................12
Figure 17 – 0 Floor Classroom estimated blueprint. .................................................................13
Figure 18 – 0 Floor Classroom (1). ...........................................................................................13
Figure 19 – 0 Floor Classroom (2). ...........................................................................................14
Figure 20 – 1 Floor Classroom A estimated blueprints. ...........................................................15
Figure 21 – 1 Floor Classroom A (1). .......................................................................................15
Figure 22 – 1 Floor Classroom A (2). .......................................................................................16
Figure 23 – 1 Floor Classroom A (3). .......................................................................................16
Figure 24 – 1 Floor Classroom B estimated blueprints. ...........................................................17
Figure 25 – 1 Floor Classroom B (1). .......................................................................................18
Figure 26 – 1 Floor Classroom B (2). .......................................................................................18
Figure 27 – 1 Floor Classroom B (3). .......................................................................................19
Figure 28 – Canteen estimated blueprint. .................................................................................20
Figure 29 – Canteen (1). ...........................................................................................................21
Figure 30 – Canteen (2). ...........................................................................................................21
Figure 31 – Canteen (3). ...........................................................................................................22
Figure 32 – Canteen (4). ...........................................................................................................22
Figure 33 – Gymnasium estimated blueprint. ...........................................................................23
XVII
Indoor Ultrafine Particles: Evaluation of Pre-school Environments
Figure 34 – Gymnasium (1). .................................................................................................... 24
Figure 35 – Gymnasium (2). .................................................................................................... 24
Figure 36 - Gymnasium (3). ..................................................................................................... 25
Figure 37 – Schematic Representation of Outdoor Sampling Location. .................................. 25
Figure 38 – Exterior (1). ........................................................................................................... 26
Figure 39 – Exterior (2). ........................................................................................................... 26
Figure 40 – Exterior (3). ........................................................................................................... 27
Figure 41 – 0 Floor Classroom estimated blueprint. ................................................................ 28
Figure 42 – 0 Floor Classroom (1). .......................................................................................... 28
Figure 43 – 0 Floor Classroom (2). .......................................................................................... 29
Figure 44 – 1 Floor Classroom estimated blueprint. ................................................................ 30
Figure 45 – 1 Floor Classroom (1). .......................................................................................... 30
Figure 46 – 1 Floor Classroom (2). .......................................................................................... 31
Figure 47 – 1 Floor Classroom (3). .......................................................................................... 31
Figure 48 – Canteen estimated blueprint. ................................................................................. 32
Figure 49 – Canteen (1). ........................................................................................................... 33
Figure 50 – Canteen (2). ........................................................................................................... 33
Figure 51 – Schematic Representation of Outdoor Sampling Location. .................................. 34
Figure 52 – Exterior (1). ........................................................................................................... 34
Figure 53 – Exterior (2). ........................................................................................................... 35
Figure 54 – Exterior (3). ........................................................................................................... 35

XIX
Indoor Ultrafine Particles: Evaluation of Pre-school Environments
List of Tables
Chapter 2:
Table 2.1 – Indoor air quality standard for particulate matter in Portugal. .............................. 22
Chapter 3:
Table 3.1 – Average values for traffic density of the two streets surrounding CLF. ............... 33
Table 3.3 – Average values for traffic density of the two streets surrounding Pom-Pom........ 35
Table 3.3 – Average values for traffic density of the two streets surrounding Escola EB1 /
J.I. do Xisto. ........................................................................................................ 38
Table 3.4 – Important properties of the selected schools. ........................................................ 39
Table 3.5 – Main properties of selected micro-environments. ................................................. 40
Table 3.6 – Sampling periods for each school. ........................................................................ 43
Table 3.7 – Sampling specifications for ultrafine particle number concentration levels. ........ 45
Table 3.8 – Sampling specifications for temperature and relative humidity levels. ................ 46
Table 3.9 – Main meteorological conditions for US1. ............................................................. 46
Table 3.10 – Main meteorological conditions for US2. .......................................................... 46
Table 3.11 – Main meteorological conditions for RS1. ........................................................... 46
Table 3.12 – Daily schedule for children of 3 and 4 years. ...................................................... 47
Table 3.13 – Daily schedule for children of 5 years. ................................................................ 48
Table 3.14 – Daily Schedule for children of 3 years. ............................................................... 48
Table 3.15 – Daily Schedule for children of 4 and 5 years. ..................................................... 49
Table 3.16 – Daily Schedule for all pre-school children. ......................................................... 50
Table 3.17 – Age-specific body weight values. Extracted from (U. S. EPA 2011). ................ 52
Table 3.18 – Age and activity level specific breathing rate values. Extracted from (U. S.
EPA 2011). .......................................................................................................... 52
Chapter 4:
Table 4.1 – Ultrafine particle number concentration ranges for indoor environments of
three schools, mean, minimum and maximum. ................................................... 56
Table 4.2 – Indoor UFP number concentrations: comparison between urban and rural
schools. ................................................................................................................ 57
Table 4.3 – Comparison of UFP levels in pre-schools: summary of existing studies. ............. 57
Table 4.4 –Assessment of outdoor contributions (particle number cm–3
). ............................... 59
Table 4.5 – UFP number concentration values for the different micro-environments
(particle number cm–3
). ....................................................................................... 62
Table 4.6 – Parameters for UFP exposure assessment of 3-5 years old children in US1......... 68
XX
Indoor Ultrafine Particles: Evaluation of Pre-school Environments
Table 4.7 – Parameters for UFP exposure assessment of 3-5 years old children in US2. ........69
Table 4.8 – Parameters for UFP exposure assessment of 3-5 years old children in RS1. ........70
Table 4.9 – Main parameters for the calculation of the UFP dose rates. ..................................71
Table 4.10 – Calculated age-specific dose rates for the selected schools. ................................71
Table 4.11 – Parameters for UFP exposure assessment of 3-5 years children in US2
considering physical activities in the gymnasium. ..............................................72
Table 4.12 – Main parameters for the calculation of dose rates. ..............................................73
Table 4.13 – Calculated age-specific dose rates for US2 days with and without physical
education (P.E.). ..................................................................................................74
Appendix:
Table 1 – Relevant 0 Floor Classroom properties.......................................................................1
Table 2 – Relevant 1 Floor Classroom A properties. ..................................................................4
Table 3 – Relevant 1 Floor Classroom B properties. ..................................................................5
Table 4 – Relevant Canteen properties. ......................................................................................7
Table 5 – Relevant Playroom properties. ....................................................................................9
Table 6 – Relevant 0 Floor Classroom properties.....................................................................12
Table 7 – Relevant 1 Floor Classroom A properties. ................................................................14
Table 8 – Relevant 1 Floor Classroom B properties. ................................................................17
Table 9 – Canteen relevant properties.......................................................................................19
Table 10 – Gymnasium relevant properties. .............................................................................22
Table 11 – 0 Floor Classroom relevant properties. ...................................................................27
Table 12 – 1 Floor Classroom relevant properties. ...................................................................29
Table 13 – Canteen relevant properties. ....................................................................................31
XXI
Indoor Ultrafine Particles: Evaluation of Pre-school Environments
Nomenclature
Abbreviations
APA Agência Portuguesa do Ambiente
BSI British Standards Institution
BW Body Weight
CLF Colégio Luso – Francês
CO Carbon Monoxide
CO2 Carbon Dioxide
COPD Chronic Obstructive Pulmonary Disease
CPC Condensation Particle Counter
EU European Union
FEF Photometric Phenomenon
I/O Indoor/Outdoor Ratio
loael Lowest tested dose a pollutant that can cause harmful health
effects on people or animals
NOX Nitrogen Oxides
O3 Ozone
PM Particulate Matter
PM10
Particulate matter which passes through a size-selective
inlet with a 50% efficiency cut-off at 10 mm aerodynamic
diameter
PM2.5
Particulate matter which passes through a size-selective
inlet with a 50% efficiency cut-off at 2.5 mm aerodynamic
diameter

XXII
Indoor Ultrafine Particles: Evaluation of Pre-school Environments
RS Rural School
RSECE Regulamento dos Sistemas Energéticos e de Climatização
de Edifícios
SCE Sistema de Certificação Energética
SO2 Sulphur Dioxide
U. S. EPA United States Environmental Protection Agency
UFP Ultrafine Particles
UNEP United Nations Environment Program
US Urban School
VOC Volatile Organic Compounds
WHO World Health Organization
Greek Symbols
∑ Sum
Roman Symbols
BR Breathing Rates
C Particle number concentration
N Daily total time spent by age-specific children in the school
n Number of hours spent by age-specific children in that
location per day
SD Standard Deviation
XXIII
Indoor Ultrafine Particles: Evaluation of Pre-school Environments
Subscripts
i Counter
WA Weighted Average

1. Introduction
1.1 Relevance and Motivation
Air pollution is one of the major contributors to the decrease of the general quality of human
life, due to the numerous adverse health effects it may cause, or due to its negative effects on
the environment (WHO 2006). Ultrafine particles (UFP) are an atmospheric pollutant that
also plays an important part in the negative consequences. However, unlike other pollutants
much less is known regarding their origin, properties, exposure levels, and health and
environmental impacts (WHO 2006). Therefore, in recent years, efforts have been made in
order to better understand this pollutant and its implications.
The aim of this thesis is to obtain information regarding levels of ultrafine particles in pre-
schools in the Oporto Metropolitan area, Portugal. Such results would allow further analysis
on the behaviour and properties of this pollutant, as well as on the assessment of the potential
risks of exposure that pre-school children are subjected to in these environments on a daily
basis.
Ultrafine particles are characterized by small dimensions of particles (typically less than 100
nm) with predominantly high surface area and a high variability of their chemical
composition (which often includes toxic substances). Due to these properties, this pollutant
has a high potential to cause adverse health effects on biological systems as ultrafine particles
are able to penetrate deeply into organisms via respiratory airways, ingestion and dermal
2 CHAPTER 1
Indoor Ultrafine Particles: Evaluation of Pre-school Environments
exposure (through existing open wounds). If in sufficient smaller sizes, ultrafine particles are
even able to penetrate through cellular tissues. When inside of the organisms, the combined
effects of high surface areas and potential toxic compositions may promote the occurrence of
physical and chemical reactions that can result in adverse health effects (WHO 2006; Stone,
Johnston et al. 2007; Kumar, Robins et al. 2011). Studies have shown that exposures to
ultrafine particles are associated with a vast number of health problems such as impaired lung
function, inflammatory response, impairment of pulmonary defense mechanisms,
cardiovascular problems, asthma and the worsening of respiratory diseases and allergic
conditions, and in some specific cases even with carcinogenic and genotoxic consequences
(WHO 2006; Stanek, Sacks et al. 2011; Shinde, Grampurohit et al. 2012; Ferreira, Cemlyn-
Jones et al. 2013).
The potential risks that ultrafine particles pose to public health indicate the need of further
monitoring and regulation of this pollutant. This is particularly relevant for specific members
of human society, namely young children who are much more susceptible to the adverse
effects of air pollution. Therefore, the characterization and analysis of ultrafine particles in
specific indoor environments, such as schools, where children spend a great amount of their
time, is essential for a positive contribution on the improvement of public health and child
overall life quality (Sioutas, Delfino et al. 2005; WHO 2006; Kumar, Robins et al. 2011).
1.2 Objectives
This work aims to evaluate ultrafine particles in pre-schools environments. The specific
objectives of this work were:
To assess ultrafine particle number concentration in three Portuguese pre-schools, in
comparison with other, both Portuguese and international studies;
To evaluate potential emission sources of ultrafine particles in pre-school
environments;
To estimate exposure dose of 3 to 5 years old children to ultrafine particles in pre-
school environments.
1.3 Thesis Outline
This thesis is divided into 5 Chapters, each associated to the following content.
Introduction 3
Indoor Ultrafine Particles: Evaluation of Pre-school Environments
Chapter 1, which is the present chapter, explains the motivation of this work and the outline
of the thesis, acting as a preface.
Chapter 2 consists on the state of the art. It introduces the problematic associated with air
pollution and the contribution of particulate matter in general, then focusing on ultrafine
particles. It contains an overview regarding the properties, sources, formation processes,
composition and environmental and health effects of ultrafine particles. Finally a brief
analysis on legislative regulations regarding this pollutant is introduced.
Chapter 3 presents materials and methods used for the purpose of this work. Specifically, the
sampling sites and its micro-environments are characterized, the equipment used and its
fundamental principles of function, the sampling procedure and also the principles on data
treatment by statistical methods are described in details.
Chapter 4 includes the obtained results and their further discussions. Daily profiles and
average values of ultrafine particles number concentrations in pre-schools, both for outdoor
and various indoor micro-environments, are presented as well as comparisons with other
similar published studies.
Finally, the conclusions based on the execution of this work and its results are presented in
Chapter 5, as well as considerations and suggestions for future studies in this area.
1.4 References
Ferreira, A. J., J. Cemlyn-Jones and C. Robalo Cordeiro (2013). "Nanoparticles,
nanotechnology and pulmonary nanotoxicology." Portuguese Journal of Pulmonology 19(1):
28-37.
Kumar, P., A. Robins, S. Vardoulakis and P. Quincey (2011). "Technical challenges in
tackling regulatory concerns for urban atmospheric nanoparticles." Particuology 9(6): 566-
571.
Shinde, S. K., N. D. Grampurohit, D. D. Gaikwad, S. L. Jadhav, M. V. Gadhave and P. K.
Shelke (2012). "Toxicity induced by nanoparticles." Asian Pacific Journal of Tropical Disease
2(4): 331-334.

4 CHAPTER 1
Indoor Ultrafine Particles: Evaluation of Pre-school Environments
Sioutas, C., R. J. Delfino and M. Singh (2005). "Exposure assessment for atmospheric
ultrafine particles (UFPs) and implications in epidemiologic research." Environmental Health
Perspectives 113(8): 947-955.
Stanek, L. W., J. D. Sacks, S. J. Dutton and J.-J. B. Dubois (2011). "Attributing health effects
to apportioned components and sources of particulate matter: An evaluation of collective
results." Atmospheric Environment 45(32): 5655-5663.
Stone, V., H. Johnston and M. J. Clift (2007). "Air pollution, ultrafine and nanoparticle
toxicology: cellular and molecular interactions." IEEE Transactions on Nanobioscience 6(4):
331-340.
WHO (2006). Air quality guidelines global update 2005: Particulate matter, ozone, nitrogen
dioxide, and sulfur dioxide. Copenhagen: World Health Organization Regional Office for
Europe, World Health Organization Regional Office for Europe: 496.

2. State of the Art
2.1 Air Pollution
The creation and development of superior and faster production processes, as well as new
forms of energy and, above all, a mentality based solely on the idea of producing large
numbers of goods to supply the existing demands that occurred in the 18th
and 19th
century,
starting primarily in Great Britain, is what is now commonly referred to as the Industrial
Revolution. Although this moment in time has much contributed to the current state of
development, it was also this much accelerated growth, with purely economic and technologic
objectives, one of the main influential factors which resulted in the current situation of
unsustainable development and less than ideal environmental conditions. Due to the
application of combustion fossil fuels processes as one of the main means for energy
production and transportation, as well as the development of industrial processes associated
with the use and emissions of several chemical substances, the atmosphere of the planet has
been subjected to higher degrees of pollution, with special focus regarding the troposphere
layer. Such an occurrence was also aggravated due to the absence of adequate environmental
legislation and means of pollution mitigation during that period. Therefore, although efforts
are being made in order to minimize the effects of air pollution and its consequences, air
quality is affected by a large number of anthropogenic pollutants, which range from nitrogen
and sulphur oxides (NOX and SO2) to carbon monoxide (CO), ozone (O3), volatile organic
compounds (VOC) and particulate matter (PM), among others.
6 CHAPTER 2
Indoor Ultrafine Particles: Evaluation of Pre-school Environments
One of the main problems regarding the existence of atmospheric pollution is its influence on
public health. Epidemiologic studies have shown that many of the air pollutants that are
present in the troposphere are directly related to health problems such as asthma,
cardiovascular diseases, loss of pulmonary function and allergenic reactions, as well as cases
of mortality due to acute exposures (Barakat-Haddad, Elliott et al. 2012; Pascal, Corso et al.
2013). Such occurrence is mainly due to the fact that these pollutants are in most part
xenobiotic and contain a considerable level of toxicity, or another property, at most times
even multiple, able to cause adverse health effects.
2.2 Indoor and Outdoor Air Quality and Exposure
Air quality is defined as a number of conditions that must be met by the environment in
question, in order to assure a minimum level of adequacy for the activity of any individual.
This translates itself not only in specific maximum levels of concentration for certain
substances, but also for other conditions, such as humidity, temperature and the existence of
odors (Agência Portuguesa do Ambiente 2013).
The concept of exposure may be defined as “the event when a person comes into contact with
a pollutant of a certain concentration during a certain period of time” (WHO 2006). This
definition establishes the difference between the concentration of a pollutant in the
environment in which it exists and the actual dose that an individual intakes into its organism.
The dose, i.e. quantification of the substance inside the organism, depends on the
circumstances that surround the individual at the moment of exposure. These include means
of exposure (ingestion, inhalation, etc.) as well as the time the individual remains in the
environment, and its geographical position relative to the source, in other words, the spatial
concentration gradient of the pollutant (Zhu, Hinds et al. 2005; WHO 2006). Therefore, the
existence of proper and adequate air quality conditions in both outdoor and indoor
environments is of extreme importance, as these conditions have a high degree of influence in
the rate of exposure of individuals to pollutants and the resulting consequences.
Outdoor air quality is thought to be the most influential factor for the analysis of the exposure
levels that an individual is subjected to on a daily basis (WHO 2006; Kearney, Wallace et al.
2011). However, as most people spend a majority (up to 80%) of their daily time indoors, it is
essential to account for the effects of exposure in the indoor environments (Matson 2005).
State of the Art 7
Indoor Ultrafine Particles: Evaluation of Pre-school Environments
These are often called micro-environments and are defined as three-dimensional spaces where
the levels of the pollutant at some specified time is uniform or has constant statistical
properties (WHO 2006). However, in practical terms, these are simply considered as specific
spaces that have a high contribution to the exposure of a specific group of individuals, and are
predominantly applied for indoor environments. According to the guidelines provided by the
World Health Organization there are three main classifications of a micro-environment. These
are: rural and urban; indoor and outdoor; and in developing and in developed countries (WHO
2006).
The air quality of indoor micro-environments is mostly altered by two fundamental
phenomena: (i) the influence of outdoor pollutants in the environment (either by penetration
or changes in the spatial distribution of the contaminants concentration); and (ii) existence of
indoor emission sources of pollutants (Zhu, Hinds et al. 2005; WHO 2006, Norhidayah, Chia-
Kuang et al. 2013). The spatial distribution of a contaminant’s concentration, influenced by
atmospheric and climatic conditions such as wind direction and speed, temperature, solar
radiation and relative humidity, influences its concentration levels in different areas, or in
other words, different neighboring micro-environments (Chan 2002). The source type is also
an influential factor, as point sources and line sources have different emissions and therefore
cause different concentration levels and spatial distributions. Apart from these factors, it is
necessary to considerer the exposure time as different pollutants may result in different health
effects when exposed to different periods of time. Spatial distribution of a contaminant’s
concentration also depends on the properties of the pollutants in general (WHO 2006;
Madureira, Paciencia et al. 2012).
Indoor micro-environments experience a significant degree of influence from the penetration
of outdoor pollutants, which results in alterations of their air quality. Obviously, such
influence depends on the pollutant in question, as the majority of known atmospheric
pollutants have a multitude of different behaviors derived from their physicochemical
properties. There are three main parameters that influence the extent of contribution of
outdoor air on the air quality of indoor micro-environments: (i) the penetration coefficient; (ii)
the ventilation rate; and (iii) the decay rate (WHO 2006). The decay rate mostly translates
itself through residence time of a pollutant in a specific system. Volatile and reactive
substances are more likely to have a lower effect over long periods of time. Regarding the
penetration coefficient, this factor is mostly influenced by the physical properties of the
8 CHAPTER 2
Indoor Ultrafine Particles: Evaluation of Pre-school Environments
pollutant in question, and by the properties of the buildings and its micro-environments (such
as the dimension of the gaps and other potential penetration ways) (Zhu, Hinds et al. 2005). In
fact indoor concentration measurements are often used in order to provide information about
building penetration factors, mainly through the coupling of simultaneously measured indoor
and outdoor levels (Chaloulakou and Mavroidis 2002). Finally, ventilation rate is the most
important and variable factor for the alteration of indoor air quality due to outdoor influence.
If there is a high ventilation rate, then accumulation of indoor pollutants is reduced, but at the
same time higher penetration of outdoor pollutants is expected within the indoor micro-
environment (Chaloulakou and Mavroidis 2002). Ventilation rate is also influenced by
economic and climate factors. Due to the basic need to regulate indoor temperatures, indoor
micro-environments are usually associated with higher ventilation rates in hot climates than in
colder ones (Madureira, Paciencia et al. 2012). In addition the level of development is an
important factor for ventilation, as indoor micro-environments in developed countries have, in
general, better and more appropriate ventilation conditions, in order to reduce existing indoor
sources of pollutants and promote and overall better quality of activity (WHO 2006). Climate
properties also influence the environment’s thermal isolation conditions, which will
consequentially have some influence on the degree of penetration from outdoor contaminants
(Sioutas, Delfino et al. 2005; WHO 2006). The building’s properties, such as construction
materials, room dimensions and layout also affect the behavior of outdoor pollutants as some
materials are more likely to promote the accumulation of ultrafine particles indoors (Sioutas,
Delfino et al. 2005). On the contrary, indoor spaces with large dimensions and non-sinuous
configurations promote better aerodynamics, which allow a higher degree of free circulation
for most air contaminants and consequently less probability of pollutants accumulation
(Sioutas, Delfino et al. 2005; Norhidayah, Chia-Kuang et al. 2013). Therefore, the combined
effects of these three parameters will dictate the flux of airborne outdoor pollutants that will
penetrate indoors, thus influencing air quality of indoor micro-environments.
Indoor emission sources of pollutants are also important. If these sources exist in a specific
micro-environment, they might have the predominant influence for quality of the indoor air.
Considering that particulate pollutants have a highly variable chemical composition, the
control and analysis of indoor sources is of extreme importance, as it may differ from outdoor
pollutants of the same group, and therefore compromise an accurate assessment of the overall
exposure in a specific micro-environment (WHO 2006, Agência Portuguesa do Ambiente
2009, Norhidayah, Chia-Kuang et al. 2013).

State of the Art 9
Indoor Ultrafine Particles: Evaluation of Pre-school Environments
2.3 Particulate Matter
Particulate matter (PM) has been recognized by several scientific organizations, such as US
Environmental Protection Agency (USEPA) and WHO, as one of the priority pollutants that
has a high potential to induce various adverse health effects to human health (increased
morbidity and mortality rates due to the cardiovascular and respiratory problems) (Stanek,
Sacks et al. 2011; Tranfield and Walker 2012). Particulate matter is commonly defined as a
mixture of both solid and liquid particles suspended in the atmosphere that possess variable
compositions, originate from various sources, and which particle sizes range, approximately,
from 100 µm to 2 nm (WHO 2006; Tranfield and Walker 2012). Due to the high number of
variable PM properties, the classification of PM is commonly defined according to its
“particle size”, which is, the equivalent aerodynamic diameter of the particle. This property
standardizes the dimensions of one particular particle, expressing the diameter of an ideal
spherical particle with a density of 1 g cm-3
that has the same inertial properties and settling
velocity as the particle in question (Wilson, Chow et al. 2002). Such a choice in classification
relates to the fact that the equivalent aerodynamic diameter of the particle is directly
associated with its aerodynamic properties, namely the properties that affect its behavior in
the atmosphere regarding transport, deposition and removal processes, while simultaneously
allowing a simplified mean of comparison between different particles, of (frequently)
irregular sizes and different densities (WHO 2006). Particle size is also an important
parameter regarding the interactions that PM may have with environmental and biological
systems, due to the fact that this parameter allows some degree of inference regarding the
superficial area of the particle in question, as well as its penetration abilities (Tranfield and
Walker 2012).
Although the particles size is the standard parameter for PM description and categorization,
there are multiple classification systems, which are based on different principles. The most
commonly used systems are: (i) sampler cutpoint; (ii) occupational classification; (iii)
regulatory classification; and (iv) modal classification that is the most used system (Slezakova
2009).
The sampler cutpoint classification system is based on the size-selective sampling that limited
to a specific size range, usually defined by the upper 50% cutpoint size. As an example, PM10
can be defined as particles, which pass through a size selective inlet with a 50% efficiency
10 CHAPTER 2
Indoor Ultrafine Particles: Evaluation of Pre-school Environments
cut-off at 10 μm of aerodynamic diameter. Such a system derived from the fact that specific
size ranges have certain particularities, as in: health effects; sources; environmental impacts;
composition, etc., that are frequently objects of further and more detailed observation
(Slezakova 2009).
The occupational system of classification is based in particle deposition in the respiratory
system, in order to easily classify its level of potential health risk. The classification considers
three categories of particles: inhalable, thoracic and respirable ones. Inhalable particles refer
to the larger-sized ones that are able to penetrate and deposit in the upper respiratory system.
Thoracic particles are able to penetrate past the larynx and deposit in the lower respiratory
tract, and respirable particles are those which are able to reach the alveolar wall. Although the
terms are not completely equal, in literature thoracic particles usually correspond to PM10
(particles with aerodynamic diameter smaller than 10 μm), while respirable particles typically
correspond to PM2.5 (Slezakova 2009).
The regulatory classification system is based on the need to define specific parameters for the
control and legislation of particle concentrations in the atmosphere, due to resulting health
effects. The selection of PM10 as an indicator was based on health considerations and was
intended to focus regulatory concern on those particles small enough to enter the thoracic
region, whereas the use of PM2.5 standard was based primarily on epidemiological studies
(Slezakova 2009).
PM can be also classified based on its origin and formation process. It can be either from
natural or anthropogenic sources, and may be defined as primary or secondary pollutants.
Primary PM is originated directly from a specific source whereas secondary PM is formed
from other processes and reactions that occur in the atmosphere involving other substances
(Slezakova 2009). Natural sources of PM include, but are not limited to: sea sprays; pollen;
forest fires; bacterial and virus matter; volcanoes; mechanical erosion and suspension of solid
matter from roads and dirt, etc. As for anthropogenic sources of particulate matter, the most
prominent sources are those associated with means of transportation associated with the
combustion of fossil fuels, heating, stationary energy production, as well as several industrial
production processes and some commercial activities (Oberdorster, Gelein et al. 1995; Buseck
and Adachi 2008; Kumar, Robins et al. 2011; Smita, Gupta et al. 2012).
State of the Art 11
Indoor Ultrafine Particles: Evaluation of Pre-school Environments
As for modal classification, this system is based on the definition of particle modes
associated with specific diameters, where each mode has specific properties, namely particle
size range, formation mechanisms, sources, composition, and deposition pathways
(Slezakova, Morais et al. 2013). This system comprehends essentially two modes which are
coarse and fine one, based on particle sizes divided by the minimum in the particle mass
distribution, which generally occurs between 1000 and 3000 µm, as demonstrated in Figure
2.1.
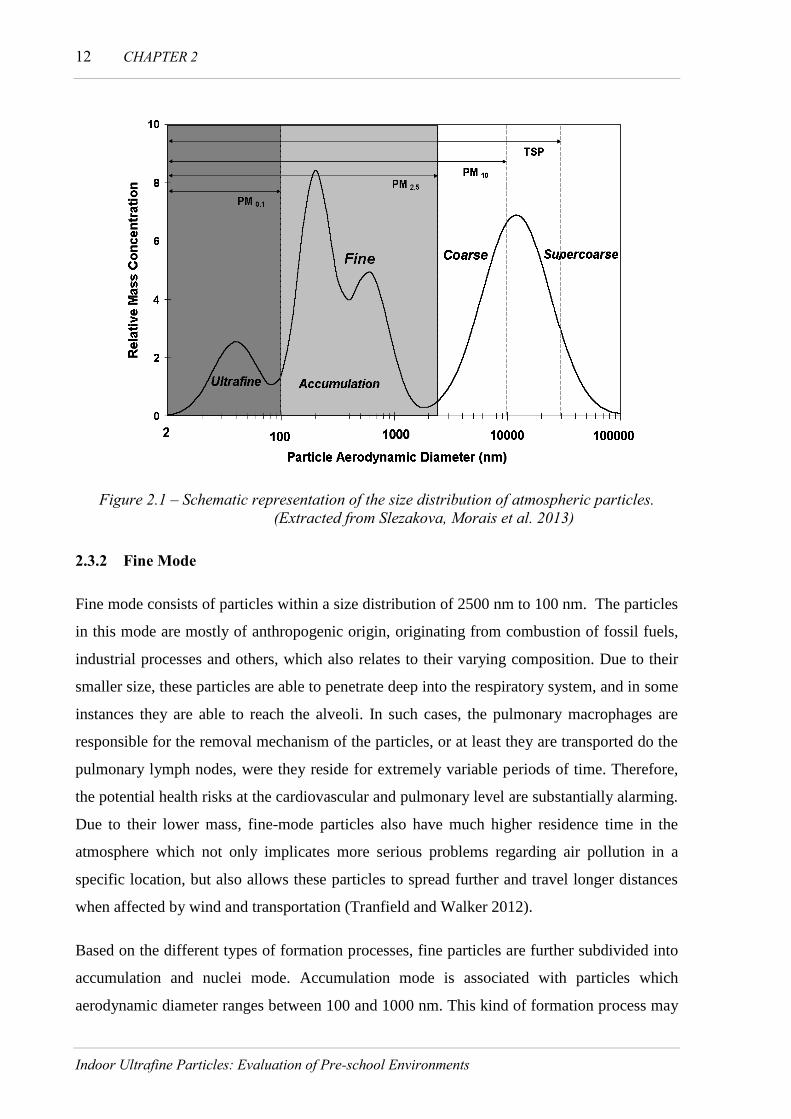
2.3.1 Coarse Mode
Coarse mode refers to a group of particles with a size higher than the above mentioned
minimum of relative mass concentration, i.e. particles with aerodynamic diameters typically
larger than 2500 µm. These particles are usually related to natural sources through mechanical
break-up of larger materials, such as wind erosion and transport of unsettled soils and
pavements, sea salt sprays, pollen and spores (WHO 2006). Some authors suggest a
subdivision regarding coarse mode, into supercoarse and coarse particles.
Supercoarse particles are defined as a subgroup that includes particles with aerodynamic
diameter above 10000 nm. These particles are unable to penetrate into the respiratory system
and from the health point of view are not considered as relevant. Nonetheless, these particles
can cause some potential environmental impacts, and therefore are further monitored as total
suspended particles (TSP), that includes particles of size range up to 30000 nm (i.e. 30 µm)
(Slezakova, Morais et al. 2013).
Coarse particles have a diameter between 2500 nm and 10000 nm and, due to their large size
these particles remain only up to a few hours in the atmosphere. Coarse particles are incapable
of penetrating deeper than the upper airways of the human respiratory system, due to their
high mass and consequential inertia, which results in an inability to transport these particles
through the sinuous paths of the respiratory system. These particles are cleared from the
human body by mucociliary clearance processes (Tranfield and Walker 2012). Therefore, this
subgroup of particles is one of little concern regarding direct health effects.
12 CHAPTER 2
Indoor Ultrafine Particles: Evaluation of Pre-school Environments
Figure 2.1 – Schematic representation of the size distribution of atmospheric particles.
(Extracted from Slezakova, Morais et al. 2013)
2.3.2 Fine Mode
Fine mode consists of particles within a size distribution of 2500 nm to 100 nm. The particles
in this mode are mostly of anthropogenic origin, originating from combustion of fossil fuels,
industrial processes and others, which also relates to their varying composition. Due to their
smaller size, these particles are able to penetrate deep into the respiratory system, and in some
instances they are able to reach the alveoli. In such cases, the pulmonary macrophages are
responsible for the removal mechanism of the particles, or at least they are transported do the
pulmonary lymph nodes, were they reside for extremely variable periods of time. Therefore,
the potential health risks at the cardiovascular and pulmonary level are substantially alarming.
Due to their lower mass, fine-mode particles also have much higher residence time in the
atmosphere which not only implicates more serious problems regarding air pollution in a
specific location, but also allows these particles to spread further and travel longer distances
when affected by wind and transportation (Tranfield and Walker 2012).
Based on the different types of formation processes, fine particles are further subdivided into
accumulation and nuclei mode. Accumulation mode is associated with particles which
aerodynamic diameter ranges between 100 and 1000 nm. This kind of formation process may
State of the Art 13
Indoor Ultrafine Particles: Evaluation of Pre-school Environments
occur by two separate phenomena, namely coagulation or condensation. Coagulation occurs
with higher frequency when a large number of particles is present, and consists basically in
the aggregation by collision of the particles. On the other hand, condensation consists on the
condensation of a gas or vapor on the surface of existing particles, and is more partial to
particles with larger surface areas. However, both these processes loose efficiency with higher
aerodynamic diameter particles. This results in a maximum cap size of approximately 1000
nm, so that beyond this value no particles are originated by these processes (Slezakova,
Morais et al. 2013).
Additionally, most sizes of particles in accumulation mode are correspondent with the
wavelengths of visible light, which leads to contributions to the existing anthropogenic
visibility impairment problem in many urban areas (Seinfeld and Pandis 2006).
2.4 Nuclei Mode - Ultrafine Particles
Nuclei mode is characterized by particles smaller than 100 nm that are also called ultrafine
particles or nanoparticles. The use of these designations has varied between authors and
times, with “ultrafine particles” being applied mostly in environmental sciences, while
“nanoparticles” has been used predominantly in the medical and engineering areas. Both
terms however, represent an arbitrary classification of particles in terms of their size,
indicating the significant role of this physical characteristic on particle fate in the air.
Theoretically, nanoparticle is any particle with a size range in nanometer scale, in other
words, bellow 1000 nm (Kumar, Robins et al. 2010). British Standards Institution (BSI 2005)
defined nanoparticles as those that have one or more dimensions in the order of 100 nm or
less. However in current scientific works, the size range definitions for nanoparticles differ
significantly. The term “nanoparticles” was used for atmospheric particles in size ranges such
as below 100 nm, 50 nm, 10 nm or occasionally even for particles smaller than 1 µm
(Anastasio and Martin 2001; BSI 2005; Morawska, Ristovski et al. 2008). It is worth
mentioning that some authors (Kumar, Robins et al. 2010) recently defined atmospheric
nanoparticles as those bellow 300 nm. Though this size range represents an overlap between
particles from nuclei and accumulation mode, authors rationalized that the respective range
includes more than 99% of the total number concentration of particles in the ambient
atmospheric environments (Kumar, Robins et al. 2010; Kumar, Robins et al. 2011; Slezakova,
Morais et al. 2013), being potentially relevant for future regulations. Therefore, when using
14 CHAPTER 2
Indoor Ultrafine Particles: Evaluation of Pre-school Environments
the term ultrafine or nanoparticles it is necessary to define the size range of the particles in
question. For the purposes of this document the term ultrafine particles will be used
throughout and referring to particles with aerodynamic diameter below 100 nm.
2.4.1 Properties
Due to their high instability, result of their small dimensions and large surface area, ultrafine
particles have low residence times in the atmosphere, and tend to fuel formation processes of
larger particles through coagulation. Due to this fact, nucleation mode particles account for
the greatest number of atmospheric particles and are found in high number concentrations
near their sources. Their concentration in air is most commonly measured and expressed in
terms of number concentrations of particles per unit volume of air, in contrast to larger
particles that are measured in terms of mass concentration, precisely due to their large
superficial area, small dimensions and substantial number (Kumar, Robins et al. 2011). Due
to the previously mentioned properties, this division on particles is also of extreme
importance in terms of health impacts. High chemical reactivity, large surface area and small
sizes allow ultrafine particles to penetrate even the alveolar wall and to be absorbed into the
bloodstream or lymphatic system, causing them to spread to other vital organs, such as the
heart, liver, brain, (Schüepp and Sly 2012). Such an occurrence is extremely problematic,
since large surface area of ultrafine particles promotes occurrence of a large number of
chemical interactions with the organ’s cells, which is influenced by the particles composition
that is often toxic. The previously mentioned properties are also responsible for the
contribution of ultrafine particles on indoor air quality. These particles demonstrate a high
level of spatial variability, due to their very small masses, acting almost like vapors, and a
high level of dispersion, when compared with higher caliber particles (WHO 2006).
Concerning their decay rate, although the composition of ultrafine particles varies
considerably, it is expected to have a very small influence on the effects of this pollutant
regarding effects on indoor air quality from outdoor environments (WHO 2006). It has also
been demonstrated that the highest values of penetration coefficients correspond to fine
particles, whereas ultrafine particles exhibit lower values of this coefficient (WHO 2006;
Slezakova, Morais et al. 2013).
State of the Art 15
Indoor Ultrafine Particles: Evaluation of Pre-school Environments
2.4.2 Sources
As previously mentioned, some correlation between specific particulate matter sources and
the size of originated particles and their composition exists. Both European and American
studies (Thurston, Ito et al. 2011; Belis, Karagulian et al. 2013) suggest that there is in fact a
relationship in terms of relative mass concentration and size distribution with specific sources,
noting that whilst natural sources (mechanical erosion and suspension of soil dusts) are
associated with mostly PM10 and larger sized particles, anthropogenic sources (i.e. those
involving diesel, petrol, coal and biomass combustion, as well as industrial production
processes) have a larger influence on PM2.5 and in some cases, ultrafine particles (WHO 2006;
Nowack and Bucheli 2007).
For anthropogenic sources, there is a high consensus among authors that these are in fact the
most influential and predominant type of PM sources that exist. Therefore, one may easily
associate the high degree in PM that is encountered primarily to the exhaust of diesel and
other fossil fueled means of transport, followed in a considerable distance by specific
industrial activities, namely heating, incineration, metallurgic and ceramic industries, etc.
(Belis, Karagulian et al. 2013; Slezakova, Morais et al. 2013).
In general particles from vehicle exhaust may be divided into two main categories. Primary
particles are directly emitted from the engines. These particles are mostly submicrometer
agglomerates (30-500 nm) of solid phase carbonaceous material containing metallic ash (from
lubricating oil additives and engine wear) and adsorbed or condensed hydrocarbons and
sulphur compounds (Nowack and Bucheli 2007; Morawska, Ristovski et al. 2008). Secondary
particles are formed in the atmosphere when hot exhaust gases are expelled from vehicle
tailpipe; as they cool and condensate they form nuclei mode particles (typically smaller than
30 nm) that consists mainly of hydrocarbons and hydrated sulphuric acid (Morawska,
Ristovski et al. 2008). There have been, however, some realizations that, although ultrafine
particles are commonly associated with man-related activities, in remote and rural areas
(where direct sources of air pollution do not exist), a considerable concentration level of this
group of particles were observed, albeit lower in order of magnitude.
In addition to outdoor sources, ultrafine particles can be also emitted from existent sources
indoors such as are cleaning products and equipment, indoor combustion processes (heating,

16 CHAPTER 2
Indoor Ultrafine Particles: Evaluation of Pre-school Environments
smoking), consumer products and indoor specific activities (painting, cleaning, cooking, etc.)
(WHO 2006; Wheeler, Xu et al. 2011; Burtscher and Schüepp 2012).
2.4.3 Formation Processes
Ultrafine particle are usually originated by the condensation of metals or organic compounds
that are vaporized in high-temperature combustion processes, and by the condensation of
gases that have been converted in atmospheric reactions to low-vapor-pressure substances.
The main precursor gases for these processes are sulfur dioxide, nitrogen oxides, ammonia
and volatile organic compounds (WHO 2006; Nowack and Bucheli 2007).
One of the more probable hypothesized mechanisms of ultrafine particle formation is
associated to binary nucleation with water and sulphuric acid. It has been observed that the
formation of new particles is preceded by an increase in the atmospheric concentration of
sulphuric acid, occurring about 1–2 h after (Weber, Marti et al. 1996; Holmes 2007), which is
then followed by a relatively small particle growth rate (Weber, Marti et al. 1996; Weber,
Marti et al. 1997; Birmili, Wiedensohler et al. 2000). However, some sources suggest the
occurrence of tertiary nucleation, related to ammonium species (Nowack and Bucheli 2007).
Several studies have concluded that particle formation can also occur from biogenic
precursors (Colin, Pasi et al. 2002). A strong example of this is the formation of 1–2×10³
particles cm-3
of climatically active particles (from late spring to early autumn) by forests.
Marine environments also possess several possible particle formation mechanisms such as
(Morawska, Ristovski et al. 2008): the seawater bubble-burst process (Colin, Maria Cristina et
al. 2004; Clarke, Owens et al. 2006) ternary nucleation and vapor condensation (Kulmala,
Pirjola et al. 2000; Kulmala, Vehkamäki et al. 2004), and the generation of coastal iodine
particles from macroalgal iodocarbon emissions (Kulmala, Pirjola et al. 2000; Colin, Maria
Cristina et al. 2004; O’Dowd and Hoffmann 2005). Of all of the above, wind produced
bubble-burst particles containing salt are the most ubiquitous in the marine environments. It is
estimated that in marine regions between 5% and 90% of the nuclei particles originate from
the sea salt flux (Clarke, Owens et al. 2006).
The above stated information indicates that ultrafine particle concentration in a certain area is
also affected by natural sources, and therefore such “background” concentration must be
analyzed and accounted for, in order to correctly study the effect of anthropogenic sources on

State of the Art 17
Indoor Ultrafine Particles: Evaluation of Pre-school Environments
the air quality of an urban area and its quantification. The characteristics of a study area are an
extremely influential factor, as a sea-side area will have a different influence on its ultrafine
particle concentration than one located near a large forest. Meteorological parameters, such as
wind speed, precipitation, relative humidity and temperature also influence ultrafine particle
concentrations and therefore should be always accounted for (WHO 2006).
The number concentrations of ultrafine particles in the atmosphere can vary by up to five or
more orders of magnitude (from 102 to 10
7 particles cm
-3) depending on environmental
conditions and source strengths but typically, in natural environments the particle number
concentrations are approximately to 1-2 orders of magnitude smaller than those in urban areas
(Kumar, Robins et al. 2010; Slezakova, Morais et al. 2013).
2.4.4 Composition
Due to its multiple sources, formation processes, shapes and properties particulate matter has
a complex and extremely variable composition which is a considerable obstacle in the
analysis of health and environmental impacts this pollutant may produce. Other factors such
as environmental properties, emission flows, weather and meteorological conditions also
contribute to the complexity of this pollutant. Generally speaking, PM includes in its
composition inorganic compounds such as sulphates, nitrates, ammonium, chloride, metals,
carbonaceous material, crystal materials, biological components, and volatile and semi-
volatile organic compounds (Oberdorster, Gelein et al. 1995). Smaller particles usually
contain toxic chemical substances like heavy metals, dioxins, hydrocarbons and other organic
chemicals, which further aggravate their health impacts (Terzano, Di Stefano et al. 2010).
Nevertheless, much information is missing especially concerning the specific composition of
the ultrafine particles. As emission sources strongly influence composition of particles,
further studies that assess ultrafine particles composition in regards to their sources are
needed. So far the existent studies focused on the characterization of ultrafine particles from
diesel engine exhausts. The results showed that the respective particles are mostly composed
of carbonaceous material containing metallic ash (which can be traced to lubricating oil
additives) and also of adsorbed or condensed hydrocarbons and sulphur compounds that result
from common additives used in diesel composition (Morawska, Ristovski et al. 2008;
Slezakova, Morais et al. 2013).
18 CHAPTER 2
Indoor Ultrafine Particles: Evaluation of Pre-school Environments
As for engineered or man-made particles (i.e. nanoparticles), this particular subgroup also
presents a challenge, as the materials used in its composition vary greatly, and result in a need
to be evaluated individually for each type of particle (Helland, Kastenholz et al. 2006).
2.4.5 Environmental Effects
Particulate matter is also one of the pollutants that affects (both directly and indirectly) the
environment. PM is one of the main contributors to visibility impairment, which is the
reduction of the ability to perceive the environment, caused by the accumulation of suspended
particles in the atmosphere that absorb and scatter the light radiated from the sun to the planet
(Slezakova, Morais et al. 2013). Particles shape and composition are also relevant for
visibility reduction; carbon particles may contribute 5–40% of overall visibility reduction
through light absorption in polluted areas, whereas particles containing sulphate, organic
carbon and nitrate species may cause 60-95% of visibility reduction (Kumar, Robins et al.
2010). Finally, visibility impairment is affected by meteorological parameters; it increases
with relative humidity and atmospheric pressure and decreases with temperature and wind
speed (Kim, Kim et al. 2001; Tsai 2005).
Particulate matter also plays a part in climate changes (Smita, Gupta et al. 2012). Particles
affect the climate as they alter the incoming solar and outgoing infra-red radiations that play
such a crucial role in the heat and temperature maintenance of the planet Earth. It was
assumed climate change caused by particulate matter was due to the particles reflecting
sunlight back to space before it reached the surface, and thus contributing to a cooling of the
surface, namely negative radiative forcing (Monks, Granier et al. 2009). Yet, recent
discoveries have shed some light on previously unknown climate mechanisms. It was found
that atmospheric particles may also enhance scattering and absorption of solar radiation,
which result in a direct warm-up (IPCC 2007; Smita, Gupta et al. 2012). This is particularly
relevant for carbonaceous particles, which are considered as one of the major contributors to
global warming. If they are coated with sulphate or organic compounds their radiative forcing
can increase even more (Kumar, Robins et al. 2010).
Ultrafine particles have also an indirect effect on climate change. Due to their properties,
these particles act as cloud condensation nuclei, which results in the modification of the
predicted formation process, modifying size and number concentrations of cloud droplets. In
clean air, clouds are composed of a relatively small number of large droplets. As a
State of the Art 19
Indoor Ultrafine Particles: Evaluation of Pre-school Environments
consequence, the clouds are somewhat dark and translucent (Smita, Gupta et al. 2012). In
polluted air with high concentrations of particles (such as urban areas) water can easily
condense on the particles, creating a large number of small droplets. These clouds are dense,
very reflective, and bright white. Due to the decrease of the size of water droplets these clouds
are less efficient at releasing precipitation. Besides, this particular type of clouds cause large
reductions in the amount of solar radiation reaching Earth’s surface, and consequentially an
increase in atmospheric solar heating, changes in atmospheric thermal structure, surface
cooling, disruption of regional circulation systems such as the monsoons, suppression of
rainfall, and less efficient removal of pollutants (Ramanathan and Feng 2009; Smita, Gupta et
al. 2012). In general the indirect effects of particles are only partially understood. The
interactions between aerosol particles (natural and anthropogenic in origin) and clouds are
complex and most instruments cannot measure aerosols within the clouds.
2.4.6 Health Effects
PM influences and consequences upon public health are also subject of many studies. PM
adverse health effects are caused by its variable composition, that at many times includes
toxic substances, as well as ability to penetrate into different areas of the respiratory system,
and therefore inducing health problems to those that are exposed to it, be it in occupational,
indoor or outdoor environments (WHO 2006; Stone, Johnston et al. 2007). It has been now
accepted by the scientific community that acute and chronic exposures to particulate matter
may lead to numerous negative health outcomes, which include impaired lung function,
inflammatory response, impairment of pulmonary defense mechanisms, cardiovascular
problems, asthma and the worsen of other already ongoing respiratory diseases (WHO 2006;
Stanek, Sacks et al. 2011; Schüepp and Sly 2012; Ferreira, Cemlyn-Jones et al. 2013). Some
sources also suggest that particulate matter is also associated with the development and
worsening of allergies and diseases such as chronic obstructive pulmonary disease (COPD)
(Tranfield and Walker 2012), while others studies indicate that particles containing
carcinogenic substances can cause genotoxic effects. These are most frequently associated the
smaller sizes of particulate matter (WHO 2006; Ferreira, Cemlyn-Jones et al. 2013; Pascal,
Corso et al. 2013).
Exposure to ultrafine particles can cause even more serious health consequences, as their
smaller size allows them to penetrate deep into biological systems. There are several means

20 CHAPTER 2
Indoor Ultrafine Particles: Evaluation of Pre-school Environments
through which this pollutant can enter the human body. Ultrafine particles are able to enter
through dermal exposure, due to fissures in the skin or simple penetration, as well as through
the gastrointestinal tract, in case of oral intake. Naturally, the most important and prominent
form of exposure and intake of ultrafine particles is through the respiratory system. Particles
of such reduced size are therefore able to penetrate deeper into tissues (that larger particles
can’t), reaching the alveoli and lower regions of the gastrointestinal tract. Up to a certain size
ultrafine particles are even capable of penetrating the tissues, being partially incorporated into
the blood stream, whereas the rest is removed by specific body functions and processes. Such
a high level of penetration poses a risk, as it allows this contaminant to reach other systemic
organs of high importance and susceptibility to its toxicity. Although it depends on the type of
exposure and intake, in general, ultrafine particles are known to reach as far as the liver,
spleen, central nervous system, heart and lymphatic nodes (WHO 2006; Shinde, Grampurohit
et al. 2012; Ferreira, Cemlyn-Jones et al. 2013).
The small size of ultrafine particles allows them to interact at a cellular level with biological
systems, passing through cell membranes, producing very specific alterations. These
alterations include reaching the cell’s nucleus and mitochondria, which may lead to DNA
mutations and cell damage (Shinde, Grampurohit et al. 2012). Yet, size is not the only
defining property of ultrafine particles that determines its toxicity and health effects.
Chemical composition, shape, surface structure and charge, aggregation, solubility and the
attachment of functional groups to the particles are important characteristics that influence
ultrafine particle behavior in organic systems and the levels of effects and interactions that
these particles and the same material in larger form result (Schüepp and Sly 2012; Shinde,
Grampurohit et al. 2012). This is particularly relevant for non-engineered nano and ultrafine
particles, as these present themselves with more complex chemical composition, irregular
shapes, and polydispersed size distribution, due to the “accidental” or non-intentional/specific
type of formation processes (Ferreira, Cemlyn-Jones et al. 2013).
2.5 Ultrafine Particles and Future Research Needs
Although ultrafine particles have gained more attention by the scientific community, the
available information on this pollutant is still rather limited. Due to their potential health
hazards, the necessity to develop and implement technologies that provide more information
on the nature and properties of exposure to this pollutant are eminent. The assessment of
State of the Art 21
Indoor Ultrafine Particles: Evaluation of Pre-school Environments
concentrations, as well as physical and chemical properties of ultrafine particles in specific
environments where people inhabit and work, such as schools, hospitals, workplaces,
vehicles, and others, is an important step in the direction of reducing public health risks.
Therefore, efforts must be made in order to create suitable methods for the analysis of
ultrafine particle size distributions of, their chemical nature, and information on physical
parameters such as shape and density. This, however, must be applicable both for general
systems as well as specific micro-environments. Confronting these parameters with studies on
activity patterns of individuals, interactions with specific micro-environments and the actual
characterization of the properties of the micro-environments will allow a deeper analysis of
the actual exposure effects and health consequences. This is due to the fact that there is a
significant relationship between outdoor and indoor ultrafine particle concentrations, which is
influenced not only by the actual properties of the pollutant and its sources, but also by the
properties of the micro-environments (Sioutas, Delfino et al. 2005; Burtscher and Schüepp
2012).
2.6 Legislation
Due to the growing knowledge on the importance of air quality and how it affects both the
environment and mankind, regulatory measures have been implemented by the corresponding
authorities. These measures have mostly originated from specific guidelines established by
organizations such WHO and the United Nations Environment Program (UNEP), which were
then adapted by the corresponding governmental authorities of individual countries. For the
European Union (EU) conditions regarding environmental legislation and courses of action
are stated in the Directive 2008/21/CE for outdoor air quality, which establishes not only limit
values for concentration of atmospheric pollutants, its analysis and evaluation, but also
politics for the interchange of information and data regarding this area for the constituting
State Members of the EU (EU Directive 2008).
Regarding outdoor air quality in Portugal, the above mentioned directive has been accepted
and transposed into (Decreto-Lei n.º 102 2010). Concerning the particulate matter, and in the
view of the negative adverse health effects and potential risks both to the human kind and
environment, the legislation has established limit values for PM10 and PM2.5. In addition,
Portuguese (Decreto-Lei n.º 102/2010) also incorporates EU Directive 2004/107/CE which
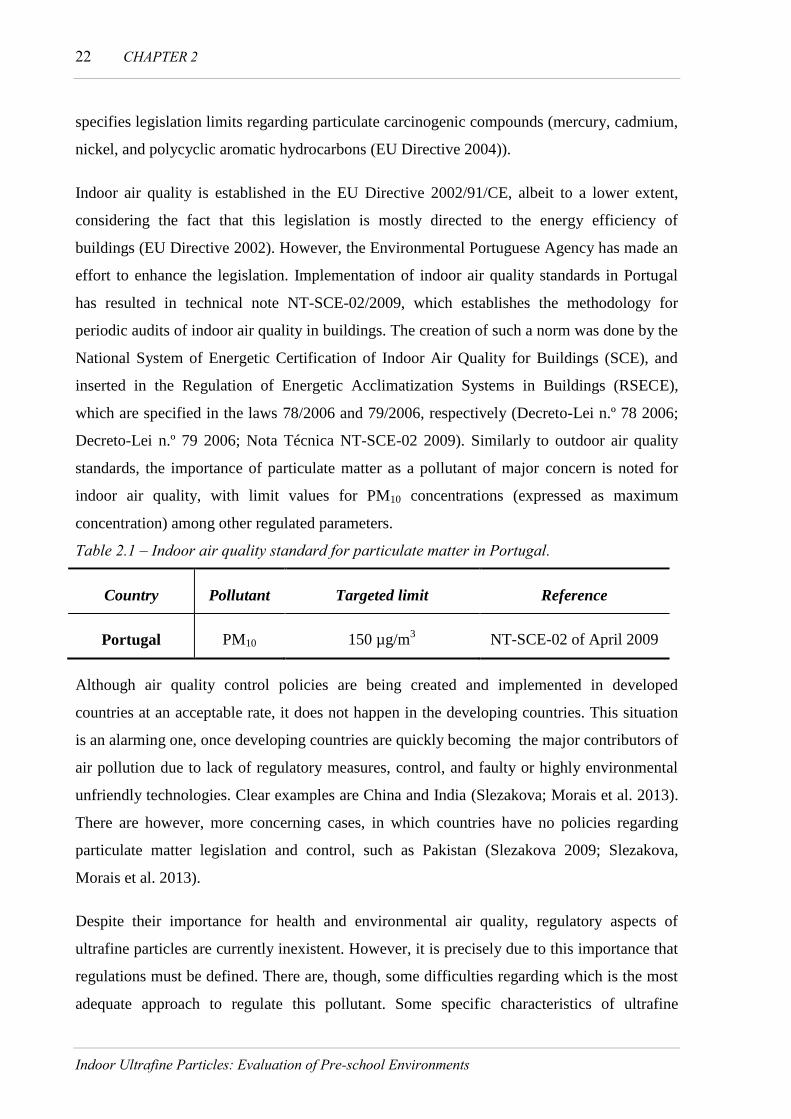
22 CHAPTER 2
Indoor Ultrafine Particles: Evaluation of Pre-school Environments
specifies legislation limits regarding particulate carcinogenic compounds (mercury, cadmium,
nickel, and polycyclic aromatic hydrocarbons (EU Directive 2004)).
Indoor air quality is established in the EU Directive 2002/91/CE, albeit to a lower extent,
considering the fact that this legislation is mostly directed to the energy efficiency of
buildings (EU Directive 2002). However, the Environmental Portuguese Agency has made an
effort to enhance the legislation. Implementation of indoor air quality standards in Portugal
has resulted in technical note NT-SCE-02/2009, which establishes the methodology for
periodic audits of indoor air quality in buildings. The creation of such a norm was done by the
National System of Energetic Certification of Indoor Air Quality for Buildings (SCE), and
inserted in the Regulation of Energetic Acclimatization Systems in Buildings (RSECE),
which are specified in the laws 78/2006 and 79/2006, respectively (Decreto-Lei n.º 78 2006;
Decreto-Lei n.º 79 2006; Nota Técnica NT-SCE-02 2009). Similarly to outdoor air quality
standards, the importance of particulate matter as a pollutant of major concern is noted for
indoor air quality, with limit values for PM10 concentrations (expressed as maximum
concentration) among other regulated parameters.
Table 2.1 – Indoor air quality standard for particulate matter in Portugal.
Country Pollutant Targeted limit Reference
Portugal PM10 150 µg/m3 NT-SCE-02 of April 2009
Although air quality control policies are being created and implemented in developed
countries at an acceptable rate, it does not happen in the developing countries. This situation
is an alarming one, once developing countries are quickly becoming the major contributors of
air pollution due to lack of regulatory measures, control, and faulty or highly environmental
unfriendly technologies. Clear examples are China and India (Slezakova; Morais et al. 2013).
There are however, more concerning cases, in which countries have no policies regarding
particulate matter legislation and control, such as Pakistan (Slezakova 2009; Slezakova,
Morais et al. 2013).
Despite their importance for health and environmental air quality, regulatory aspects of
ultrafine particles are currently inexistent. However, it is precisely due to this importance that
regulations must be defined. There are, though, some difficulties regarding which is the most
adequate approach to regulate this pollutant. Some specific characteristics of ultrafine

State of the Art 23
Indoor Ultrafine Particles: Evaluation of Pre-school Environments
particles, such as chemical composition, size, geometry or surface area have been discussed,
but no conclusions have been reached. Unlike fine or coarse particles, the distribution of
ultrafine particles is not dominated by their mass but number of particles. Thus, some studies
have suggested that the ultrafine particle number concentration is an important parameter; this
fraction accounts for the majority (about 80%) of the total number concentration of outdoor
nano-sized particles (i.e. smaller than 100 nm), but has negligible mass concentration
(Slezakova, Morais et al. 2013). Therefore, it is necessary to develop and implement more
accurate monitoring technologies that are able to provide comprehensive data on number and
size distributions of ultrafine particles in different areas, once information on levels, profiles,
sources and formation processes of these particles are still associated with a lack of data.
Ultimately much better understating on exposures to ultrafine particles is needed, in order to
define suitable risk exposure coefficients for different populations.
2.7 References
Agência Portuguesa do Ambiente (2009). Qualidade do Ar em Espaços Interiores: Um Guia
Técnico. Amadora, Agência Portuguesa do Ambiente, : 1 - 56.
Agência Portuguesa do Ambiente, I. P. (2013). "Qualidade do Ar Interior." Retrieved 1 of
June, 2013, from
http://www.apambiente.pt/index.php?ref=16&subref=82&sub2ref=319&sub3ref=338.
Anastasio, C. and S. T. Martin (2001). "Atmospheric Nanoparticles." Reviews in Mineralogy
and Geochemistry 44(1): 293-349.
Barakat-Haddad, C., S. J. Elliott and D. Pengelly (2012). "Health Impacts of Air Pollution: A
Life Course Approach for Examining Predictors of Respiratory Health in Adulthood." Annals
of Epidemiology 22(4): 239-249.
Belis, C. A., F. Karagulian, B. R. Larsen and P. K. Hopke (2013). "Critical review and meta-
analysis of ambient particulate matter source apportionment using receptor models in
Europe." Atmospheric Environment 69(0): 94-108.
Birmili, W., A. Wiedensohler, C. Plass-Dülmer and H. Berresheim (2000). "Evolution of
newly formed aerosol particles in the continental boundary layer: A case study including OH
and H2SO4 measurements." Geophysical Research Letters 27(15): 2205-2208.
24 CHAPTER 2
Indoor Ultrafine Particles: Evaluation of Pre-school Environments
BSI (2005). Vocabulary — Nanoparticles. London, United Kingdom, British Standards
Institution.
Burtscher, H. and K. Schüepp (2012). "The occurrence of ultrafine particles in the specific
environment of children." Paediatric Respiratory Reviews 13(2): 89-94.
Buseck, P. R. and K. Adachi (2008). "Nanoparticles in the Atmosphere." Elements 4(6): 389-
394.
Chaloulakou, A. and I. Mavroidis (2002). "Comparison of indoor and outdoor concentrations
of CO at a public school. Evaluation of an indoor air quality model." Atmospheric
Environment 36(11): 1769-1781.
Chan, A. T. (2002). "Indoor–outdoor relationships of particulate matter and nitrogen oxides
under different outdoor meteorological conditions." Atmospheric Environment 36(9): 1543-
1551.
Clarke, A. D., S. R. Owens and J. Zhou (2006). "An ultrafine sea-salt flux from breaking
waves: Implications for cloud condensation nuclei in the remote marine atmosphere." Journal
of Geophysical Research 111(D6).
Colin, D. O. D., F. Maria Cristina, C. Fabrizia, C. Darius, M. Mihaela, D. Stefano, F. Sandro,
Y. Young Jun and P. Jean-Philippe (2004). "Biogenically driven organic contribution to
marine aerosol." Nature 431(7009): 676-680.
Colin, D. O. D., A. Pasi, H. Kaarle, K. Markku and H. Thorsten (2002). "Aerosol formation:
Atmospheric particles from organic vapours." Nature 416(6880): 497-498.
Decreto-Lei n.º 78 (2006). Diario da República(1ª Série - A Nº 67): 2411 - 2415.
Decreto-Lei n.º 79 (2006). Diario da República(1ª Série - A Nº 67): 2416 - 2468.
Decreto-Lei n.º 102 (2010). Diario da República(1ª Série Nº 186): 4177 - 4205.
EU Directive (2002). Directive 2002/91/EC of the European Parliament and of the Council on
the energy performance of buildings. L1. Official Journal of the European Union: 65 - 71.

State of the Art 25
Indoor Ultrafine Particles: Evaluation of Pre-school Environments
EU Directive (2004). Directive 2004/107/EC of the European Parliament and of the Council
relating to arsenic, cadmium, mercury, nickel and polycyclic aromatic hydrocarbons in
ambient air. L23. Official Journal of the European Union: 3 - 23.
EU Directive (2008). Directive 2008/50/EC of the European Parliament and of the Council on
ambient air quality and cleaner air for Europe. L152. Official Journal of the European Union:
1 - 44.
Ferreira, A. J., J. Cemlyn-Jones and C. Robalo Cordeiro (2013). "Nanoparticles,
nanotechnology and pulmonary nanotoxicology." Portuguese Journal of Pulmonology 19(1):
28-37.
Helland, A., H. Kastenholz, A. Thidell, P. Arnfalk and K. Deppert (2006). "Nanoparticulate
materials and regulatory policy in Europe: An analysis of stakeholder perspectives." Journal
of Nanoparticle Research 8(5): 709-719.
Holmes, N. S. (2007). "A review of particle formation events and growth in the atmosphere in
the various environments and discussion of mechanistic implications." Atmospheric
Environment 41(10): 2183-2201.
IPCC (2007). Climate Change 2007: The Physical Science Basis. Contribution of Working
Group I to the Fourth Assessment Report of the Intergovernmental Panel on Climate Change.
Cambridge, United Kingdom, Intergovernmental Panel on Climate Change.
Kearney, J., L. Wallace, M. MacNeill, X. Xu, K. VanRyswyk, H. You, R. Kulka and A. J.
Wheeler (2011). "Residential indoor and outdoor ultrafine particles in Windsor, Ontario."
Atmospheric Environment 45(40): 7583-7593.
Kim, Y. J., K. W. Kim and S. J. Oh (2001). "Seasonal characteristics of haze observed by
continuous visibility monitoring in the urban atmosphere of Kwangju, Korea." Environmental
Monitoring and Assessment 70(1-2): 35-46.
Kulmala, M., L. Pirjola, J. M. Makela and C. D. O'Dowd (2000). "Stable sulfate clusters as a
source of new atmospheric particles." AIP Conference Proceedings 534(1): 892-295.

26 CHAPTER 2
Indoor Ultrafine Particles: Evaluation of Pre-school Environments
Kulmala, M., H. Vehkamäki, T. Petäjä, M. Dal Maso, A. Lauri, V. M. Kerminen, W. Birmili
and P. H. McMurry (2004). "Formation and growth rates of ultrafine atmospheric particles: a
review of observations." Journal of Aerosol Science 35(2): 143-176.
Kumar, P., A. Robins, S. Vardoulakis and R. Britter (2010). "A review of the characteristics
of nanoparticles in the urban atmosphere and the prospects for developing regulatory
controls." Atmospheric Environment 44(39): 5035-5052.
Kumar, P., A. Robins, S. Vardoulakis and P. Quincey (2011). "Technical challenges in
tackling regulatory concerns for urban atmospheric nanoparticles." Particuology 9(6): 566-
571.
Madureira, J., I. Paciencia and O. Fernandes Ede (2012). "Levels and indoor-outdoor
relationships of size-specific particulate matter in naturally ventilated Portuguese schools."
Journal of Toxicology and Environmental Health, Part A: Current Issues 75(22-23): 1423-
1436.
Matson, U. (2005). "Indoor and outdoor concentrations of ultrafine particles in some
Scandinavian rural and urban areas." Science of The Total Environment 343(1–3): 169-176.
Monks, P. S., C. Granier, S. Fuzzi, A. Stohl, M. L. Williams, H. Akimoto, M. Amann, A.
Baklanov, U. Baltensperger, I. Bey, N. Blake, R. S. Blake, K. Carslaw, O. R. Cooper, F.
Dentener, D. Fowler, E. Fragkou, G. J. Frost, S. Generoso, P. Ginoux, V. Grewe, A.
Guenther, H. C. Hansson, S. Henne, J. Hjorth, A. Hofzumahaus, H. Huntrieser, I. S. A.
Isaksen, M. E. Jenkin, J. Kaiser, M. Kanakidou, Z. Klimont, M. Kulmala, P. Laj, M. G.
Lawrence, J. D. Lee, C. Liousse, M. Maione, G. McFiggans, A. Metzger, A. Mieville, N.
Moussiopoulos, J. J. Orlando, C. D. O'Dowd, P. I. Palmer, D. D. Parrish, A. Petzold, U. Platt,
U. Pöschl, A. S. H. Prévôt, C. E. Reeves, S. Reimann, Y. Rudich, K. Sellegri, R. Steinbrecher,
D. Simpson, H. ten Brink, J. Theloke, G. R. van der Werf, R. Vautard, V. Vestreng, C.
Vlachokostas and R. von Glasow (2009). "Atmospheric composition change – global and
regional air quality." Atmospheric Environment 43(33): 5268-5350.
Morawska, L., Z. Ristovski, E. R. Jayaratne, D. U. Keogh and X. Ling (2008). Ambient nano
and ultrafine particles from motor vehicle emissions: characteristics, ambient processing and
implications on human exposure. Atmospheric Environment. 42: 8113 – 8138.
State of the Art 27
Indoor Ultrafine Particles: Evaluation of Pre-school Environments
Norhidayah, A., L. Chia-Kuang, M. K. Azhar and S. Nurulwahida (2013). "Indoor Air
Quality and Sick Building Syndrome in Three Selected Buildings." Procedia Engineering
53(0): 93-98.
Nota Técnica NT-SCE-02 (2009). "Metodologia para auditorias periódicas de QAI em
edifícios de serviços existentes no âmbito do RSECE." 1 - 44.
Nowack, B. and T. D. Bucheli (2007). "Occurrence, behavior and effects of nanoparticles in
the environment." Environmental Pollution 150(1): 5-22.
O’Dowd, C. D. and T. Hoffmann (2005). "Coastal New Particle Formation: A Review of the
Current State-Of-The-Art." Environmental Chemistry 2(4): 245-255.
Oberdorster, G., R. M. Gelein, J. Ferin and B. Weiss (1995). "Association of particulate air
pollution and acute mortality: involvement of ultrafine particles?" Inhalation Toxicology 7(1):
111-124.
Pascal, M., M. Corso, O. Chanel, C. Declercq, C. Badaloni, G. Cesaroni, S. Henschel, K.
Meister, D. Haluza, P. Martin-Olmedo and S. Medina (2013). "Assessing the public health
impacts of urban air pollution in 25 European cities: Results of the Aphekom project."
Science of The Total Environment 449(0): 390-400.
Ramanathan, V. and Y. Feng (2009). "Air pollution, greenhouse gases and climate change:
Global and regional perspectives." Atmospheric Environment 43(1): 37-50.
Schüepp, K. and P. D. Sly (2012). "The developing respiratory tract and its specific needs in
regard to ultrafine particulate matter exposure." Paediatric Respiratory Reviews 13(2): 95-99.
Seinfeld, J. H. and S. N. Pandis (2006). Atmospheric Chemistry and Physics: From Air
Pollution to Climate Change. Hoboken, New Jersey, John Wiley & Sons.
Shinde, S. K., N. D. Grampurohit, D. D. Gaikwad, S. L. Jadhav, M. V. Gadhave and P. K.
Shelke (2012). "Toxicity induced by nanoparticles." Asian Pacific Journal of Tropical Disease
2(4): 331-334.

28 CHAPTER 2
Indoor Ultrafine Particles: Evaluation of Pre-school Environments
Sioutas, C., R. J. Delfino and M. Singh (2005). "Exposure assessment for atmospheric
ultrafine particles (UFPs) and implications in epidemiologic research." Environmental Health
Perspectives 113(8): 947-955.
Slezakova, K., et al., (2009). Suspended Particles in Outdoor and Indoor Air: Characterization
to Support Epidemiological Studies. Philosophy Doctor in Engineering Sciences, Faculdade
de Engenharia da Universidade do Porto.
Slezakova, K., S. Morais and M. C. Pereira (2013). Atmospheric Nanoparticles and Their
Impacts on Public Health. Current Topics on Public Health (Dr. A.J. Rodriguez-Morales,
Ed.). Rijeka (Croatia), InTech: 503-529.
Smita, S., S. Gupta, A. Bartonova, M. Dusinska, A. Gutleb and Q. Rahman (2012).
"Nanoparticles in the environment: assessment using the causal diagram approach."
Environmental Health 11(Suppl 1): S13.
Stanek, L. W., J. D. Sacks, S. J. Dutton and J.-J. B. Dubois (2011). "Attributing health effects
to apportioned components and sources of particulate matter: An evaluation of collective
results." Atmospheric Environment 45(32): 5655-5663.
Stone, V., H. Johnston and M. J. Clift (2007). "Air pollution, ultrafine and nanoparticle
toxicology: cellular and molecular interactions." IEEE Transactions on Nanobioscience 6(4):
331-340.
Terzano, C., F. Di Stefano, V. Conti, E. Graziani and A. Petroianni (2010). "Air pollution
ultrafine particles: toxicity beyond the lung." European Review for Medical and
Pharmacological Sciences 14(10): 809-821.
Thurston, G. D., K. Ito and R. Lall (2011). "A source apportionment of U.S. fine particulate
matter air pollution." Atmospheric Environment 45(24): 3924-3936.
Tranfield, E. M. and D. C. Walker (2012). "Understanding Human Illness and Death
Following Exposure to Particulate Matter Air Pollution." Environmental Health - Emerging
Issues and Practice: 81 - 102.
Tsai, Y. I. (2005). "Atmospheric visibility trends in an urban area in Taiwan 1961–2003."
Atmospheric Environment 39(30): 5555-5567.
State of the Art 29
Indoor Ultrafine Particles: Evaluation of Pre-school Environments
Weber, R. J., J. J. Marti, P. H. McMurry, F. L. Eisele, D. J. Tanner and A. Jefferson (1996).
"Measured Atmospheric New Particle Formation Rates: Implications for Nucleation
Mechanisms." Chemical Engineering Communications 151(1): 53-64.
Weber, R. J., J. J. Marti, P. H. McMurry, F. L. Eisele, D. J. Tanner and A. Jefferson (1997).
"Measurements of new particle formation and ultrafine particle growth rates at a clean
continental site." Journal of Geophysical Research: Atmospheres 102(D4): 4375-4385.
Wheeler, A. J., X. Xu, R. Kulka, H. You, L. Wallace, G. Mallach, K. Van Ryswyk, M.
MacNeill, J. Kearney, E. Dabek-Zlotorzynska, D. Wang, R. Poon, R. Williams, C. Stocco, A.
Anastassopoulos, J. D. Miller, R. Dales and J. R. Brook (2011). "Windsor, Ontario exposure
assessment study: design and methods validation of personal, indoor, and outdoor air
pollution monitoring." Journal of the Air & Waste Management Association 61(2): 142-156.
WHO (2006). Air quality guidelines global update 2005: Particulate matter, ozone, nitrogen
dioxide, and sulfur dioxide. Copenhagen: World Health Organization Regional Office for
Europe, World Health Organization Regional Office for Europe: 496.
Wilson, W. E., J. C. Chow, C. Claiborn, W. Fusheng, J. Engelbrecht and J. G. Watson (2002).
"Monitoring of particulate matter outdoors." Chemosphere 49(9): 1009-1043.
Zhu, Y., W. C. Hinds, M. Krudysz, T. Kuhn, J. Froines and C. Sioutas (2005). "Penetration of
freeway ultrafine particles into indoor environments." Journal of Aerosol Science 36(3): 303-
322.


3. Materials and Methods
3.1 School Characterization
The objectives defined for this thesis were complied and applied to three selected pre-schools
located in Porto’s Metropolitan Area. These pre-schools are briefly described and
characterized in the following sections.
3.1.1 Urban School 1
Colégio Luso-Francês (CLF) is located in Amial Street, number 442, 4200-052 Paranhos,
Porto.
CLF is a private school founded by the Franciscan Order in 1936. This teaching facility now
teaches children that range from pre-school age up to the 12º year. It provides its students
with a wide range of extracurricular activities, such as dancing, choir, musical expression,
sports, foreign language learning, etc.
The sampling was carried out only in the part of the school complex used for pre-school
education. It is the second oldest building of the complex and it was constructed in 1940.
There was, however, one exception to this rule which was the analysis of the canteen located
in the wing of the newest building (constructed in 1993).

32 CHAPTER 3
Indoor Ultrafine Particles: Evaluation of Pre-school Environments
Figure 3.1 – Colégio Luso-Francês.
Figure 3.2 – Luso-Francês's geographical layout.

Materials and Methods 33
Indoor Ultrafine Particles: Evaluation of Pre-school Environments
Geographical location of Luso-Francês is demonstrated in Figure 3.2. It is surrounded by two
streets: Amial Street and Dr. Carlos Ramos Street.
In order to understand traffic density of the surrounding area, a quick study was made. This
consisted of road vehicle number counts (personal cars, buses, trucks, motorcycles) that
passed through each of the streets during 10 minutes intervals for every hour (from 5 a. m. to
24 p. m.). These counts were performed during two consecutive week days. With this data, it
was possible to obtain the average number of cars per minute in each street and to identify the
profile of the average number of cars during the day. The findings are presented in Table 3.1
and Figure 3.3.
Table 3.1 – Average values for traffic density of the two streets surrounding CLF.
Dr. Carlos Ramos St Amial St
Daily Average (cars min-1
) 5 5 11 11
Street Average (cars min-1
) 5 11
Figure 3.3 – Average traffic density profiles for the two streets surrounding CLF.
As shown in Figure 3.3, Amial St. is a much busier street than Dr. Carlos Ramos. This is most
probably due to the fact that Amial is an urban street with direct access to VCI, one of the
main traffic routes in Porto area; in addition Amial St also provides direct connection to city
center. However, during specific daily periods Dr. Carlos Ramos St exhibits higher traffic
density than Amial St, namely during the morning period, around 8 a.m. These occurrences
are due to the high number of personal cars driven at that time by the parents who drop off
children at CLF before the beginning of the morning classes (between 08:30 and 09:00). It is
0
2
4
6
8
10
12
14
16
18
5 6 7 8 9 10 11 12 13 14 15 16 17 18 19 20 21 22 23 24
Traf
fic
De
nsi
ty (
cars
/min
ute
)
Hour
Dr. Carlos Ramos
Amial
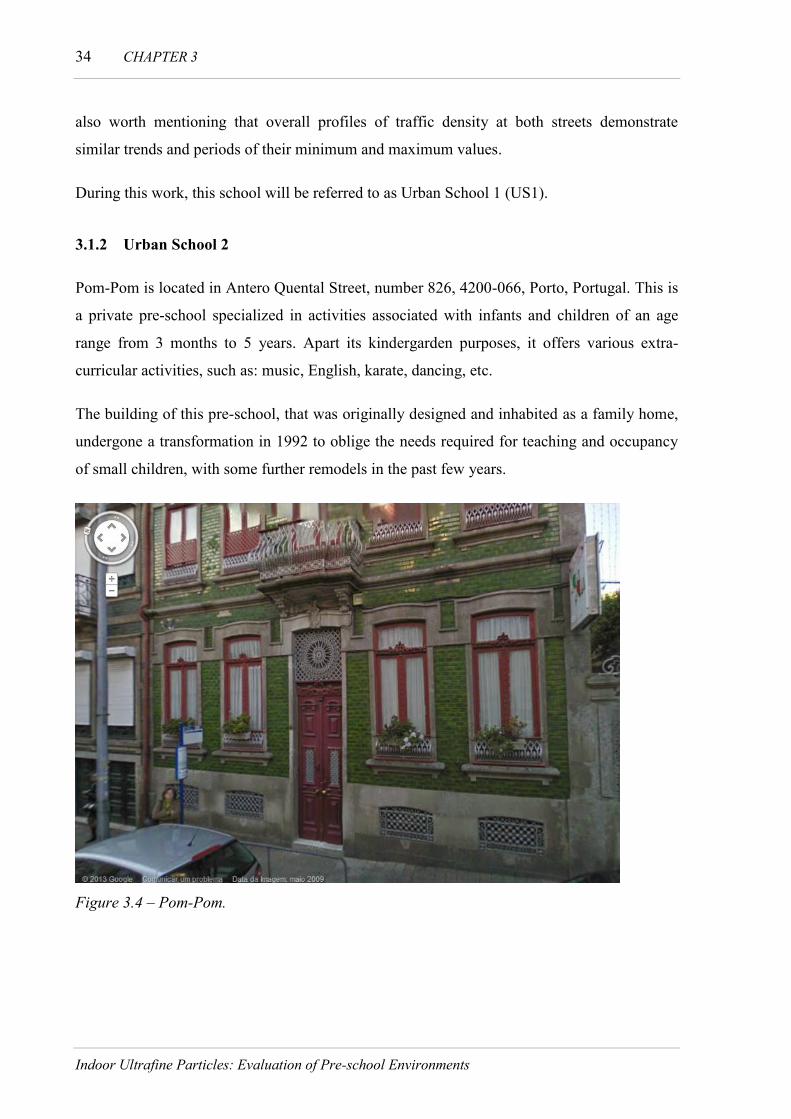
34 CHAPTER 3
Indoor Ultrafine Particles: Evaluation of Pre-school Environments
also worth mentioning that overall profiles of traffic density at both streets demonstrate
similar trends and periods of their minimum and maximum values.
During this work, this school will be referred to as Urban School 1 (US1).
3.1.2 Urban School 2
Pom-Pom is located in Antero Quental Street, number 826, 4200-066, Porto, Portugal. This is
a private pre-school specialized in activities associated with infants and children of an age
range from 3 months to 5 years. Apart its kindergarden purposes, it offers various extra-
curricular activities, such as: music, English, karate, dancing, etc.
The building of this pre-school, that was originally designed and inhabited as a family home,
undergone a transformation in 1992 to oblige the needs required for teaching and occupancy
of small children, with some further remodels in the past few years.
Figure 3.4 – Pom-Pom.

Materials and Methods 35
Indoor Ultrafine Particles: Evaluation of Pre-school Environments
Figure 3.5 – Pom-Pom's geographical layout.
As shown in Figure 3.5, the pre-school is located near Marquês. Besides the previously
mentioned street, Vale Formoso was also considered for the characterization of the pre-
school, due to the apparently high traffic density it showed and the relatively close proximity
to the school. Concerning the characterization of this school, it is necessary to remark the
existence of the charity organization Coração da Cidade, which has an exterior kitchen
located right next to Pom-Pom.
In order to evaluate the traffic intensity of this school’s vicinities, a quick study was made.
This consisted in the same methodology applied for US1, but for a period of 5 a. m. to 23 p.
m. in two consecutive days of the week. The average number of cars per minute the average
traffic density daily profiles are presented in Table 3.2 and Figure 3.6, respectively.
Table 3.2 – Average values for traffic density of the two streets surrounding Pom-Pom.
Antero Quental St Vale Formoso St
Daily Average (cars min-1
) 2 2 10 11
Street Average (cars min-1
) 2 11
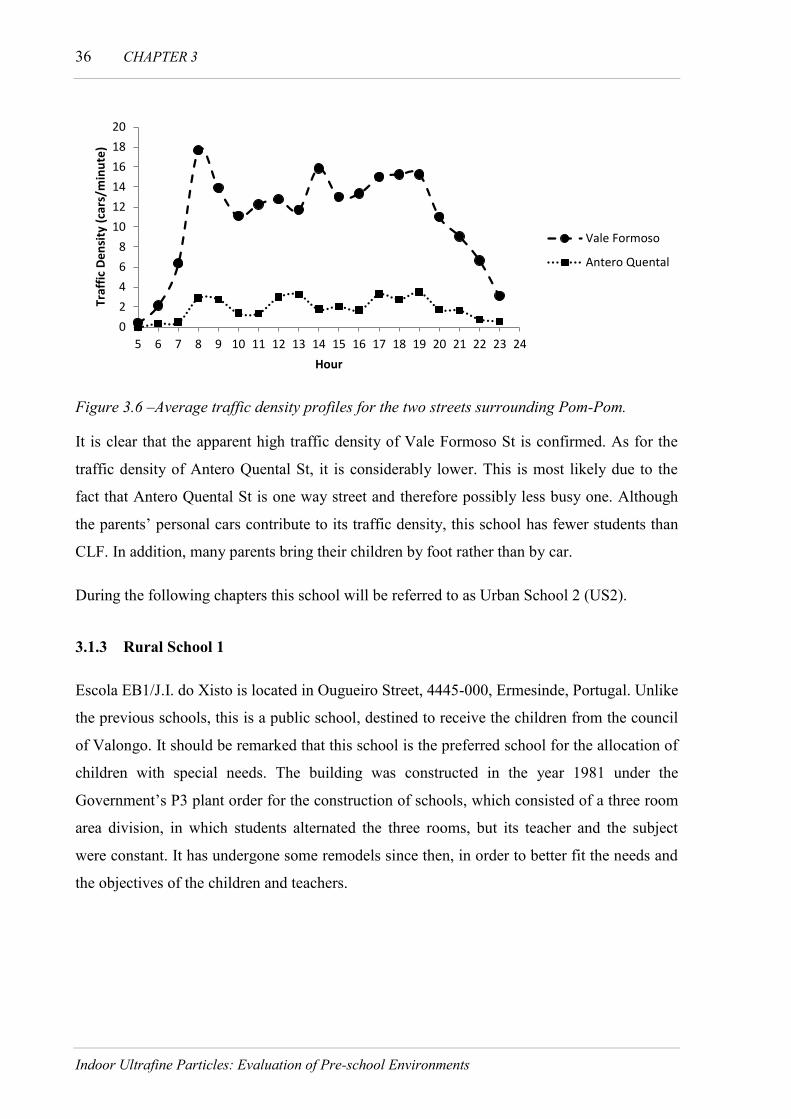
36 CHAPTER 3
Indoor Ultrafine Particles: Evaluation of Pre-school Environments
Figure 3.6 –Average traffic density profiles for the two streets surrounding Pom-Pom.
It is clear that the apparent high traffic density of Vale Formoso St is confirmed. As for the
traffic density of Antero Quental St, it is considerably lower. This is most likely due to the
fact that Antero Quental St is one way street and therefore possibly less busy one. Although
the parents’ personal cars contribute to its traffic density, this school has fewer students than
CLF. In addition, many parents bring their children by foot rather than by car.
During the following chapters this school will be referred to as Urban School 2 (US2).
3.1.3 Rural School 1
Escola EB1/J.I. do Xisto is located in Ougueiro Street, 4445-000, Ermesinde, Portugal. Unlike
the previous schools, this is a public school, destined to receive the children from the council
of Valongo. It should be remarked that this school is the preferred school for the allocation of
children with special needs. The building was constructed in the year 1981 under the
Government’s P3 plant order for the construction of schools, which consisted of a three room
area division, in which students alternated the three rooms, but its teacher and the subject
were constant. It has undergone some remodels since then, in order to better fit the needs and
the objectives of the children and teachers.
0
2
4
6
8
10
12
14
16
18
20
5 6 7 8 9 10 11 12 13 14 15 16 17 18 19 20 21 22 23 24
Traf
fic
De
nsi
ty (
cars
/min
ute
)
Hour
Vale Formoso
Antero Quental
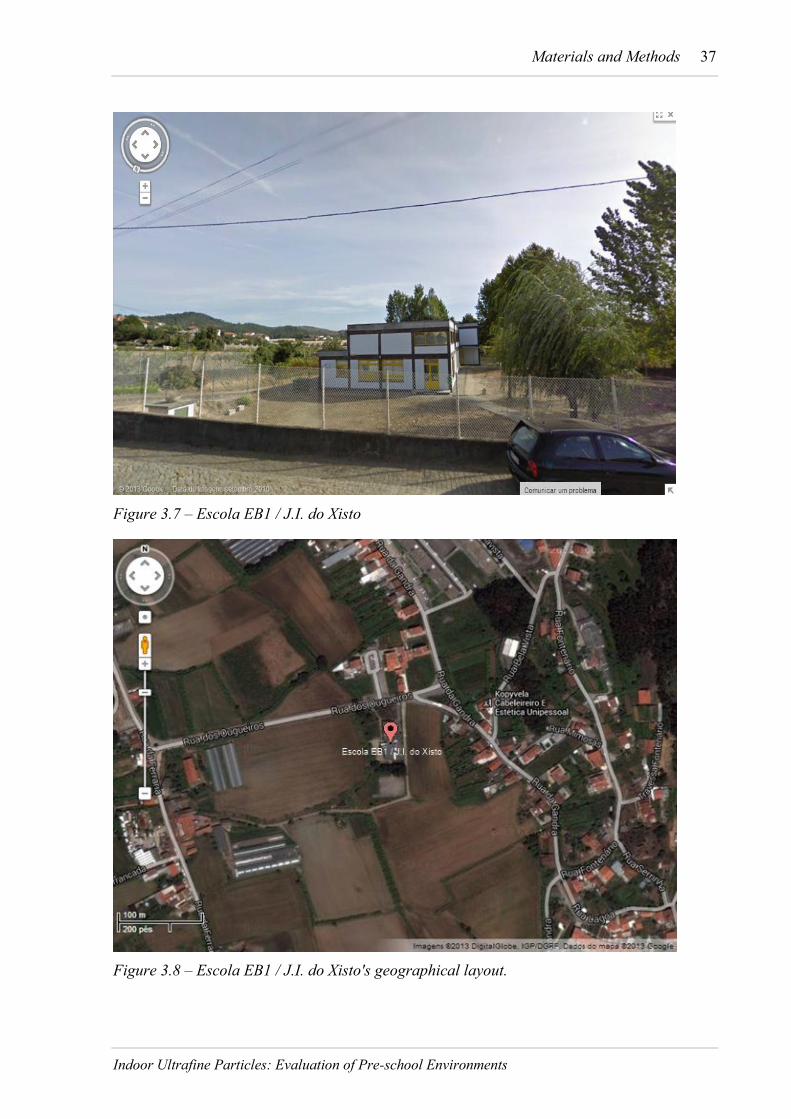
Materials and Methods 37
Indoor Ultrafine Particles: Evaluation of Pre-school Environments
Figure 3.7 – Escola EB1 / J.I. do Xisto
Figure 3.8 – Escola EB1 / J.I. do Xisto's geographical layout.
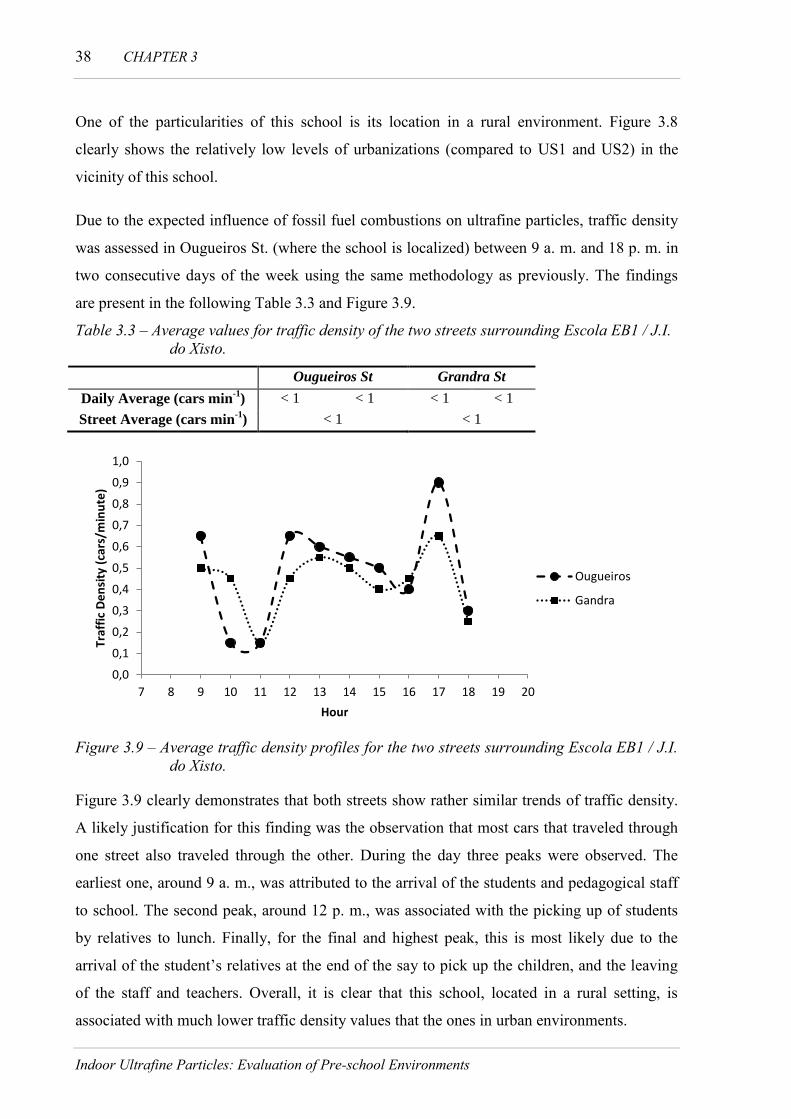
38 CHAPTER 3
Indoor Ultrafine Particles: Evaluation of Pre-school Environments
One of the particularities of this school is its location in a rural environment. Figure 3.8
clearly shows the relatively low levels of urbanizations (compared to US1 and US2) in the
vicinity of this school.
Due to the expected influence of fossil fuel combustions on ultrafine particles, traffic density
was assessed in Ougueiros St. (where the school is localized) between 9 a. m. and 18 p. m. in
two consecutive days of the week using the same methodology as previously. The findings
are present in the following Table 3.3 and Figure 3.9.
Table 3.3 – Average values for traffic density of the two streets surrounding Escola EB1 / J.I.
do Xisto.
Ougueiros St Grandra St
Daily Average (cars min-1
) < 1 < 1 < 1 < 1
Street Average (cars min-1
) < 1 < 1
Figure 3.9 – Average traffic density profiles for the two streets surrounding Escola EB1 / J.I.
do Xisto.
Figure 3.9 clearly demonstrates that both streets show rather similar trends of traffic density.
A likely justification for this finding was the observation that most cars that traveled through
one street also traveled through the other. During the day three peaks were observed. The
earliest one, around 9 a. m., was attributed to the arrival of the students and pedagogical staff
to school. The second peak, around 12 p. m., was associated with the picking up of students
by relatives to lunch. Finally, for the final and highest peak, this is most likely due to the
arrival of the student’s relatives at the end of the say to pick up the children, and the leaving
of the staff and teachers. Overall, it is clear that this school, located in a rural setting, is
associated with much lower traffic density values that the ones in urban environments.
0,0
0,1
0,2
0,3
0,4
0,5
0,6
0,7
0,8
0,9
1,0
7 8 9 10 11 12 13 14 15 16 17 18 19 20
Traf
fic
De
nsi
ty (
cars
/min
ute
)
Hour
Ougueiros
Gandra
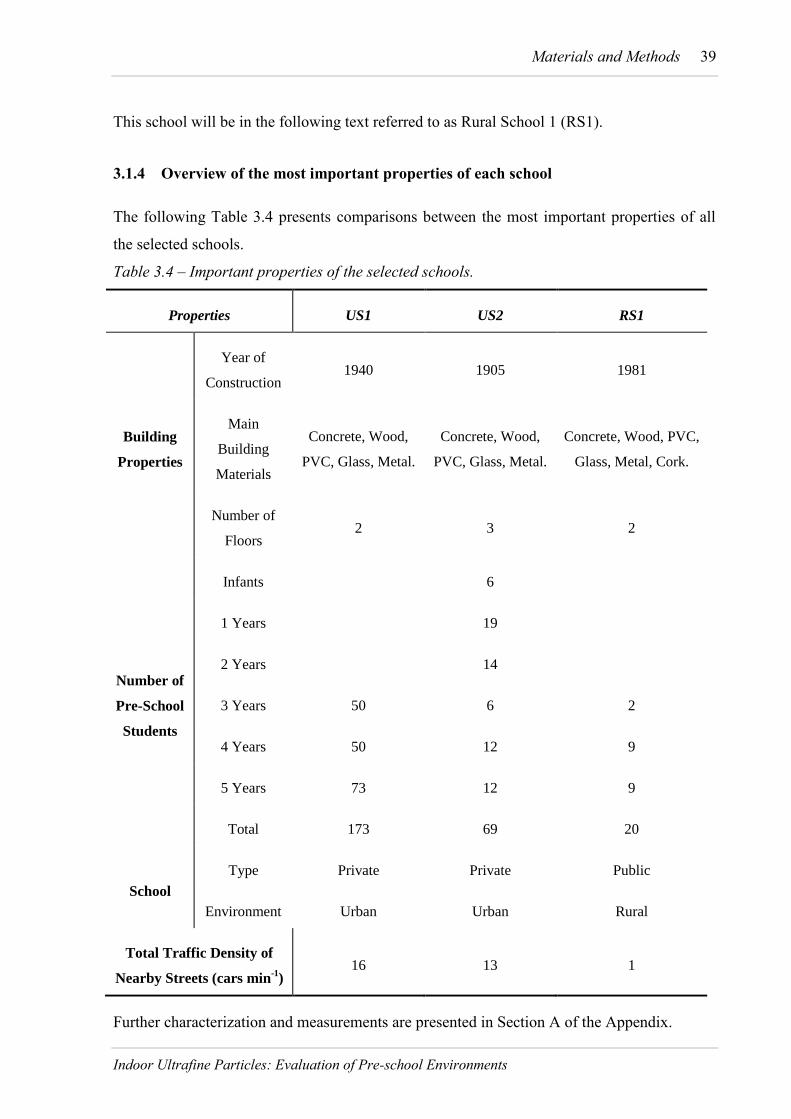
Materials and Methods 39
Indoor Ultrafine Particles: Evaluation of Pre-school Environments
This school will be in the following text referred to as Rural School 1 (RS1).
3.1.4 Overview of the most important properties of each school
The following Table 3.4 presents comparisons between the most important properties of all
the selected schools.
Table 3.4 – Important properties of the selected schools.
Properties US1 US2 RS1
Building
Properties
Year of
Construction 1940 1905 1981
Main
Building
Materials
Concrete, Wood,
PVC, Glass, Metal.
Concrete, Wood,
PVC, Glass, Metal.
Concrete, Wood, PVC,
Glass, Metal, Cork.
Number of
Floors 2 3 2
Number of
Pre-School
Students
Infants 6
1 Years 19
2 Years 14
3 Years 50 6 2
4 Years 50 12 9
5 Years 73 12 9
Total 173 69 20
School
Type Private Private Public
Environment Urban Urban Rural
Total Traffic Density of
Nearby Streets (cars min-1
) 16 13 1
Further characterization and measurements are presented in Section A of the Appendix.
40 CHAPTER 3
Indoor Ultrafine Particles: Evaluation of Pre-school Environments
3.2 Micro-environments
The indoor environments of the schools, as previously mentioned, can be divided into
different systems, or micro-environments, due to their spatial limitations and different
purposes and associated activities. Generally speaking selected schools had similar
organization of their micro-environments, meaning they all had, with two exceptions, specific
rooms for specific school activities. The selected micro-environments were commonly
denominated and defined as:
• Classrooms – these are the main microenvironments where children spend a major
amount of their time during their daily routine in the schools. It is where they do
most of the educational and free activities.
• Playground – the playground is a large open space with various playing apparatus
such as slides and swing sets, football fields, etc., that is located outdoor within
the school’s complex.
• Canteen – a specially designated area solely applied for the children to lunch and
eventually other meals.
• Gymnasium / auditorium – a specific room used for physical education activities
or, for specific school events, such as dance recitals and plays. In RS1 there was
not a gymnasium, but instead a polyvalent area openly connected with the
cafeteria, where these activities occurred.
• Playroom – used for the reception of children in the morning (before classes), and
in the afternoon (after classes); as well as a playground for rainy days and some
kinds of physical education activities (exists only in US1).
In order to better understand the behavior of ultrafine particle levels and daily profiles, some
potentially influential characteristics of micro-environments were analyzed (Table 3.5).
Table 3.5 – Main properties of selected micro-environments.
Micro-
Environment Properties US1 US2 RS1
0 Floor Total Volume (m3) 138.5 126.4 124.7

Materials and Methods 41
Indoor Ultrafine Particles: Evaluation of Pre-school Environments
Classroom Total Surface Area
(m2)
193.8 163.3 167.9
Main Construction
Materials
PVC; Wood;
Concrete.
Wood;
Concrete. Wood; Concrete; Cork.
Ventilation Natural Natural Natural
Average Temperature
(± SD) (ºC) 19.2 (± 0.3) 20.6 (± 0.9) 22.5 (± 1.0)
Average Relative Air
Humidity (± SD) (%) 44.3 (± 3.8) 52.1 (± 2.7) 64.0 (± 3.8)
1 Floor
Classroom
Total Volume (m3) 199.4 116.8 134.2
Total Surface Area
(m2)
227.2 181.0 173.6
Main Construction
Materials Wood, Concrete.
Wood;
Concrete. Wood; Concrete; Cork.
Ventilation Natural Natural Natural
Average Temperature
(± SD) (ºC) 19.8 (± 1.0) 21.7 (± 0.8) 23.2 (± 0.8)
Average Relative Air
Humidity (± SD) (%) 52.7 (± 4.6) 46.6 (± 2.9) 55.5 (± 4.4)
Canteen
Total Volume (m3) 1568.6 161.3 504.5
Total Surface Area
(m2)
1084.9 241.1 352.3
Main Construction
Materials
Ceramic; Wood;
Concrete.
PVC;
Wood;
Concrete.
Ceramic; Wood;
Concrete
Ventilation Natural Natural Natural
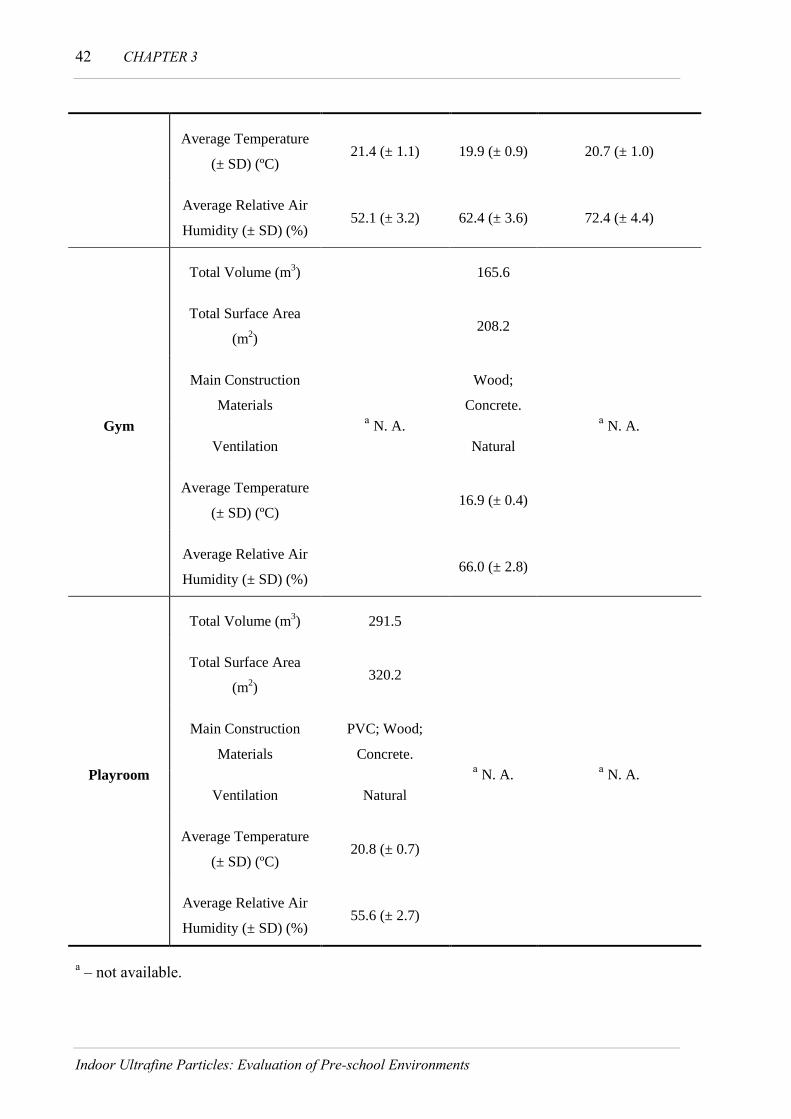
42 CHAPTER 3
Indoor Ultrafine Particles: Evaluation of Pre-school Environments
Average Temperature
(± SD) (ºC) 21.4 (± 1.1) 19.9 (± 0.9) 20.7 (± 1.0)
Average Relative Air
Humidity (± SD) (%) 52.1 (± 3.2) 62.4 (± 3.6) 72.4 (± 4.4)
Gym
Total Volume (m3)
a N. A.
165.6
a N. A.
Total Surface Area
(m2)
208.2
Main Construction
Materials
Wood;
Concrete.
Ventilation Natural
Average Temperature
(± SD) (ºC) 16.9 (± 0.4)
Average Relative Air
Humidity (± SD) (%) 66.0 (± 2.8)
Playroom
Total Volume (m3) 291.5
a N. A.
a N. A.
Total Surface Area
(m2)
320.2
Main Construction
Materials
PVC; Wood;
Concrete.
Ventilation Natural
Average Temperature
(± SD) (ºC) 20.8 (± 0.7)
Average Relative Air
Humidity (± SD) (%) 55.6 (± 2.7)
a – not available.
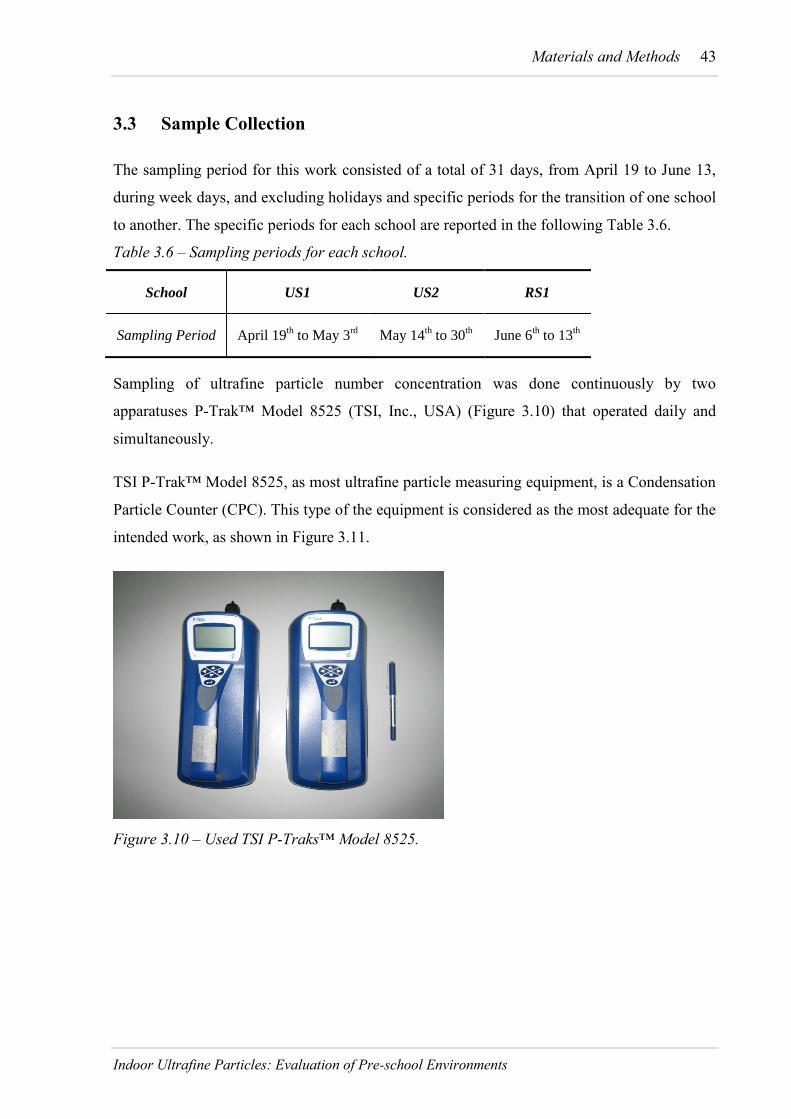
Materials and Methods 43
Indoor Ultrafine Particles: Evaluation of Pre-school Environments
3.3 Sample Collection
The sampling period for this work consisted of a total of 31 days, from April 19 to June 13,
during week days, and excluding holidays and specific periods for the transition of one school
to another. The specific periods for each school are reported in the following Table 3.6.
Table 3.6 – Sampling periods for each school.
School US1 US2 RS1
Sampling Period April 19th to May 3
rd May 14
th to 30
th June 6
th to 13
th
Sampling of ultrafine particle number concentration was done continuously by two
apparatuses P-Trak™ Model 8525 (TSI, Inc., USA) (Figure 3.10) that operated daily and
simultaneously.
TSI P-Trak™ Model 8525, as most ultrafine particle measuring equipment, is a Condensation
Particle Counter (CPC). This type of the equipment is considered as the most adequate for the
intended work, as shown in Figure 3.11.
Figure 3.10 – Used TSI P-Traks™ Model 8525.

44 CHAPTER 3
Indoor Ultrafine Particles: Evaluation of Pre-school Environments
Figure 3.11 – Associated analytical methods according to particle size range and type.
Extracted from (TSI Inc. 2012).
The Condensation Particle Counter (Figure 3.12)
operates based on photometric phenomenon (FEF).
This device counts the particles that are extracted by
a pump, through the use of a specific laser beam. In
order for such smaller particles to be counted, they
are subjected to an enlargement process, in which
alcohol vapor condenses around them and leads to
the formation of higher size droplets. This is done
by passing the particles through a saturator tube
which contains 100% reagent grade isopropyl
alcohol in vapor form, which mixes with the
particles. Afterwards, this mixture is lead into a
condenser, were the condensation into droplets
occurs. Now having proper dimensions for
detection, these droplets pass through a focused
laser beam, providing the counting of the particles
by a photodetector (TSI Inc. 1999, 2012).
The sampling properties specified for this work relative to ultrafine particle sampling and the
equipment are as follow (Table 3.7):
Figure 3.12 – Condensation Particle
Counter schematic.
Extracted from (TSI
Inc. 2012).
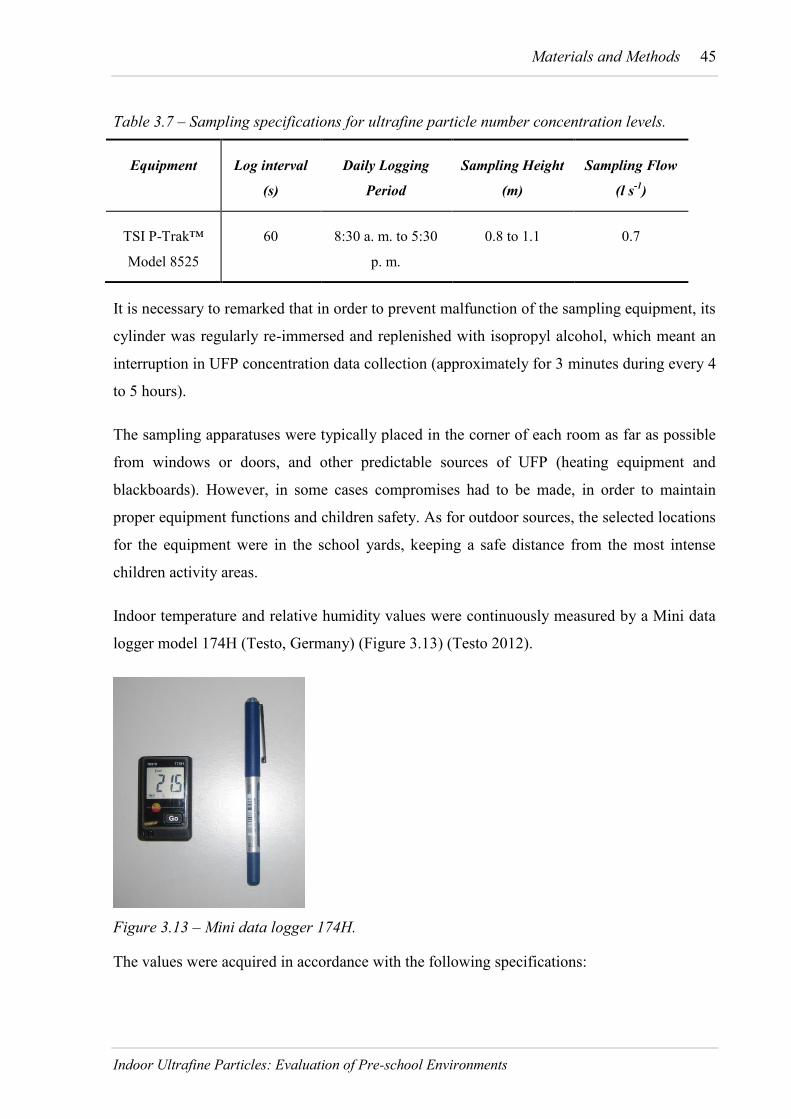
Materials and Methods 45
Indoor Ultrafine Particles: Evaluation of Pre-school Environments
Table 3.7 – Sampling specifications for ultrafine particle number concentration levels.
Equipment Log interval
(s)
Daily Logging
Period
Sampling Height
(m)
Sampling Flow
(l s-1
)
TSI P-Trak™
Model 8525
60 8:30 a. m. to 5:30
p. m.
0.8 to 1.1 0.7
It is necessary to remarked that in order to prevent malfunction of the sampling equipment, its
cylinder was regularly re-immersed and replenished with isopropyl alcohol, which meant an
interruption in UFP concentration data collection (approximately for 3 minutes during every 4
to 5 hours).
The sampling apparatuses were typically placed in the corner of each room as far as possible
from windows or doors, and other predictable sources of UFP (heating equipment and
blackboards). However, in some cases compromises had to be made, in order to maintain
proper equipment functions and children safety. As for outdoor sources, the selected locations
for the equipment were in the school yards, keeping a safe distance from the most intense
children activity areas.
Indoor temperature and relative humidity values were continuously measured by a Mini data
logger model 174H (Testo, Germany) (Figure 3.13) (Testo 2012).
Figure 3.13 – Mini data logger 174H.
The values were acquired in accordance with the following specifications:
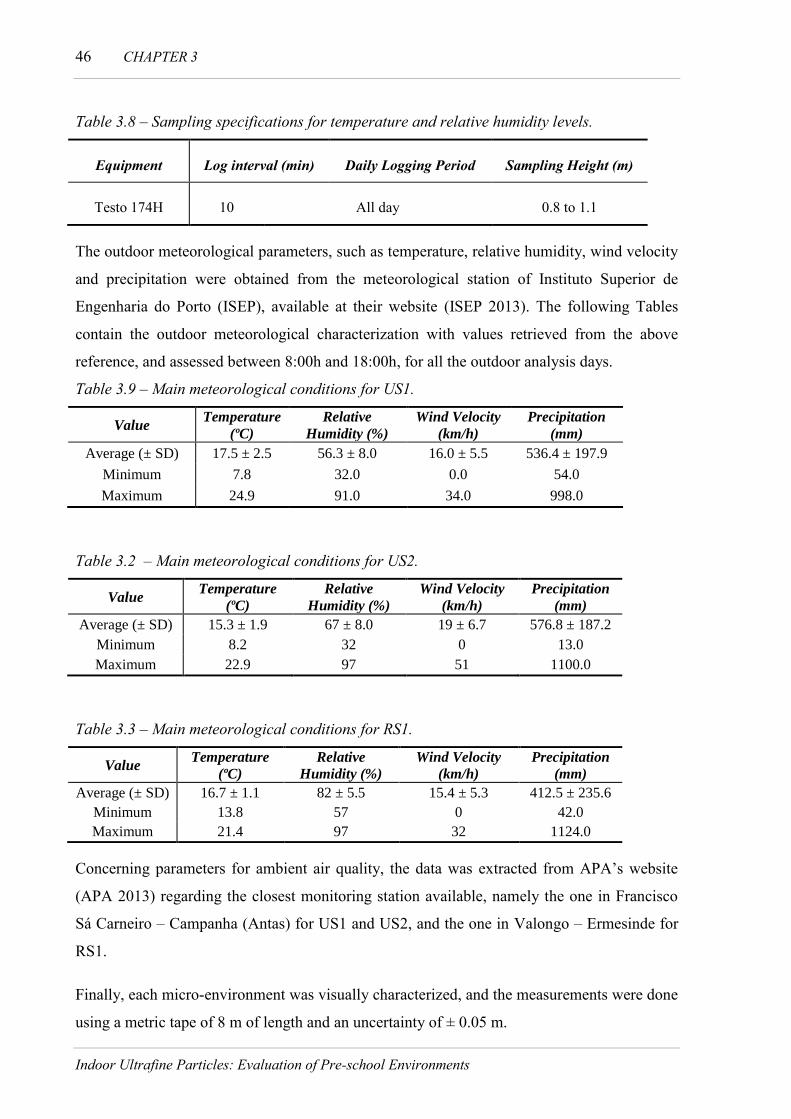
46 CHAPTER 3
Indoor Ultrafine Particles: Evaluation of Pre-school Environments
Table 3.8 – Sampling specifications for temperature and relative humidity levels.
Equipment Log interval (min) Daily Logging Period Sampling Height (m)
Testo 174H 10 All day 0.8 to 1.1
The outdoor meteorological parameters, such as temperature, relative humidity, wind velocity
and precipitation were obtained from the meteorological station of Instituto Superior de
Engenharia do Porto (ISEP), available at their website (ISEP 2013). The following Tables
contain the outdoor meteorological characterization with values retrieved from the above
reference, and assessed between 8:00h and 18:00h, for all the outdoor analysis days.
Table 3.9 – Main meteorological conditions for US1.
Value Temperature
(ºC)
Relative
Humidity (%)
Wind Velocity
(km/h)
Precipitation
(mm)
Average (± SD) 17.5 ± 2.5 56.3 ± 8.0 16.0 ± 5.5 536.4 ± 197.9
Minimum 7.8 32.0 0.0 54.0
Maximum 24.9 91.0 34.0 998.0
Table 3.2 – Main meteorological conditions for US2.
Value Temperature
(ºC)
Relative
Humidity (%)
Wind Velocity
(km/h)
Precipitation
(mm)
Average (± SD) 15.3 ± 1.9 67 ± 8.0 19 ± 6.7 576.8 ± 187.2
Minimum 8.2 32 0 13.0
Maximum 22.9 97 51 1100.0
Table 3.3 – Main meteorological conditions for RS1.
Value Temperature
(ºC)
Relative
Humidity (%)
Wind Velocity
(km/h)
Precipitation
(mm)
Average (± SD) 16.7 ± 1.1 82 ± 5.5 15.4 ± 5.3 412.5 ± 235.6
Minimum 13.8 57 0 42.0
Maximum 21.4 97 32 1124.0
Concerning parameters for ambient air quality, the data was extracted from APA’s website
(APA 2013) regarding the closest monitoring station available, namely the one in Francisco
Sá Carneiro – Campanha (Antas) for US1 and US2, and the one in Valongo – Ermesinde for
RS1.
Finally, each micro-environment was visually characterized, and the measurements were done
using a metric tape of 8 m of length and an uncertainty of ± 0.05 m.

Materials and Methods 47
Indoor Ultrafine Particles: Evaluation of Pre-school Environments
Figure 3.13 – Used metric tape.
3.4 Children Daily Activities
In order to better understand the period that pre-school children spend in school and how it is
distributed through the different existing micro-environments, the schedules of the students
were registered, and are presented in the following tables.
3.4.1 Urban School 1
Table 3.4 – Daily schedule for children of 3 and 4 years.
Time Activity Location
8:30h Arriving at the school / Free activities Playroom
9:00h Reception / Oriented Activities 0 Floor Classroom
10:30h Recess Playground
11:15h Oriented Activities 0 Floor Classroom
11:45h Lunch Time Cafeteria
13:00h Nap Time Classroom
15:00h Oriented Activities Classroom
16:00h Leaving school upon parent’s arrival Playroom

48 CHAPTER 3
Indoor Ultrafine Particles: Evaluation of Pre-school Environments
Table 3.5 – Daily schedule for children of 5 years.
Time Activity Location
8:30h Arriving at the school / Free activities Playroom
9:00h Reception / Oriented Activities 1 Floor Classrooms A and B
10:30h Recess Playground
11:15h Oriented Activities 1 Floor Classrooms A and B
11:45h Lunch Time Cafeteria
13:00h Recess Playground
14:00h Free Activities 1 Floor Classrooms A and B
15:00h Oriented Activities 1 Floor Classrooms A and B
16:00h Leaving school upon parent’s arrival Playroom
3.4.2 Urban School 2
Table 3.6 – Daily Schedule for children of 3 years.
Time Activity Location
9:00h Arriving at the School/ Breakfast /
Free Activities
Cafeteria
9:30h Reception 1 Floor Classroom B
9:45h Oriented Activity 1 Floor Classroom B
10:30h Recess Playground
a10:30h Physical Education Gymnasium
10:50h Room Organization 1 Floor Classroom B

Materials and Methods 49
Indoor Ultrafine Particles: Evaluation of Pre-school Environments
11:10h Hygiene Bathrooms
11:20h Lunch Time Cafeteria
11:45h Oral Hygiene Bathrooms
12:00h Nap Time 1 Floor Classroom B
14:30h Hygiene and Room Organization Bathrooms / 1 Floor Classroom B
15:00h Oriented and Free Activities 1 Floor Classroom B
15:30h Afternoon Snack Cafeteria
15:50h Hygiene Bathroom
16:00h Free Activities Playground
16:30h Leaving school upon parent’s arrival Playground
a – Only on Tuesdays.
Table 3.7 – Daily Schedule for children of 4 and 5 years.
Time Activity
9:00h Arriving at the School/ Breakfast /
Free Activities
Cafeteria
9:30h Reception 0 Floor Classroom
9:45h Oriented Activities 0 Floor Classroom
11:00h Recess Playground
a11:00h Physical Education Gymnasium
11:30h Room Organization 0 Floor Classroom
11:45h Hygiene Bathrooms

50 CHAPTER 3
Indoor Ultrafine Particles: Evaluation of Pre-school Environments
11:55h Lunch Time Cafeteria
12:30h Oral Hygiene Bathrooms
12:45h Free Activities 0 Floor Classroom
14:30h Oriented Activities 0 Floor Classroom
15:40h Room Organization 0 Floor Classroom
15:50h Hygiene Bathrooms
16:00h Afternoon Snack Cafeteria
16:10h Hygiene Bathrooms
16:30h Free Activities / Leaving school upon
parent’s arrival
Playground
a – Only on Tuesdays.
3.4.3 Rural School 1
Table 3.8 – Daily Schedule for all pre-school children.
Time Activity Location
9:00h Arriving at the School Playground
9:30h Reception 0 Floor Classroom
10:00h Oriented Activity 0 Floor Classroom
10:15h Morning Snack 0 Floor Classroom
10:30h Recess Playground
11:15h Oriented Activity 0 Floor Classroom
12:00h Lunch Time / Recess Cafeteria / Playground

Materials and Methods 51
Indoor Ultrafine Particles: Evaluation of Pre-school Environments
12:45h Recess Playground
13:30h Oral Hygiene Bathrooms
13:45h Oriented Activity 0 Floor Classroom
15:15h Afternoon Snack 0 Floor Classroom
15:30h Free Activities / Leaving School Playground
3.5 Dose Rate
The analysis of the potential health risk of occupants associated with inhalation exposure of
ultrafine particles bears a high relevance to the work. However, it has been noted that, due to
the recent emergence on the importance of ultrafine particles and the lack of epidemiological
studies regarding this pollutant, there is a barrier which prevents the calculation on the health
risks. This is due to the fact that the Health Risk is expressed as the ratio between the Dose
Rate and the loael. Since there is no consensus concerning the value of the loael - the lowest
tested dose of a pollutant that has been reported to cause harmful health effects on people or
animals, it is rather impossible to calculate the respective risks. However, in order to at least
quantify the level of exposure to UFP that pre-school children were subjected to in the
selected schools, the dose rate was calculated (Kalaiarasan, Balasubramanian et al. 2009;
Castro, Slezakova et al. 2011). This analysis was age-specific using 3 main categories: 3
years; 4 years and 5 years old children. The calculation of the estimate dose rate was done
according to the following Equation 1:
( ) (
) ( )
Where:
D is the age-specific dose rate (particle number kg-1
);
BRWA is the age-specific weighted average breathing rate (l min-1
)
BW is age-specific body weight (kg);
CWA is the age-specific weighted average concentration (particle number l-1
);

52 CHAPTER 3
Indoor Ultrafine Particles: Evaluation of Pre-school Environments
OF is the occupancy factor (considered always one, as children kept their schedules
and associated locations tightly);
N is the total time spent by age-specific children in the school (min);
Both age-specific breathing rate and body weight were extracted from the appropriate
literature, and the relevant values for the work are expressed in Tables 3.9 and 3.10.
Table 3.9 - Age-specific body weight values. Extracted from (U. S. EPA 2011).
Age Group Mean (kg)
3 to < 6 years 18.6
Table 3.10 – Age and activity level specific breathing rate values. Extracted from (U. S. EPA
2011).
Age Group Activity Level Mean (l min-1
)
3 to < 6
Sleep or Nap 4.3
Sedentary / Passive 4.5
Light Intensity 11.0
Moderate Intensity 21.0
High Intensity 37.0
It was observed that the age-specific breathing rate also varied during a normal school
day, as the children executed different tasks, which were associated with different levels
of activity. Therefore, in order to obtain a more representative value for the BR, the
weighted average of BR was calculated according to the different intensity levels of
activity and time periods, through the following Equation 2:
( )
In which:
BRWA is the age-specific weighted average concentration (l min-1
);

Materials and Methods 53
Indoor Ultrafine Particles: Evaluation of Pre-school Environments
BRi is the average concentration in a specific location (l min-1
);
ni is the number of hours spent by age-specific children in that location (h);
N is the total number of hours spent by age-specific children in the school (h);
As for the calculation of the age-specific values of CWA, this was done based on the
following Equation 3:
( )
Where:
CWA is the age-specific weighted average concentration (particle number l-1
);
Ci is the average concentration in a specific location (particle number l-1
);
ni is the number of hours spent by age-specific children in that location (h);
N is the total number of hours spent by age-specific children in the school (h);
The number of hours spent by age-specific children in each location were considered based on
the known schedules of their activity. Finally, regarding concentration levels for each
location, these were attained through the actual work.
3.6 Statistical Analysis
For the statistical analysis of the obtained data, T Student’s test was applied (P < 0.05; two
tailed), in order to ascertain the statistical significance of the existing differences between
calculated averages.
3.7 References
APA. (2013). "Agência Portuguesa do Ambiente - Qualidade do Ar." Retrieved June 20,
2013, from http://www.qualar.org/INDEX.PHP?page=2.
Castro, D., K. Slezakova, C. Delerue-Matos, M. d. C. Alvim-Ferraz, S. Morais and M. d. C.
Pereira (2011). "Polycyclic aromatic hydrocarbons in gas and particulate phases of indoor
environments influenced by tobacco smoke: Levels, phase distributions, and health risks."
Atmospheric Environment 45(10): 1799-1808.
54 CHAPTER 3
Indoor Ultrafine Particles: Evaluation of Pre-school Environments
ISEP. (2013). "Metereologia no Instituto Superior de Engenharia do Porto." Retrieved June
20, 2013, from http://meteo.isep.ipp.pt/almanac_Plus.htm.
Kalaiarasan, M., R. Balasubramanian, K. W. D. Cheong and K. W. Tham (2009). "Traffic-
generated airborne particles in naturally ventilated multi-storey residential buildings of
Singapore: Vertical distribution and potential health risks." Building and Environment 44(7):
1493-1500.
Testo (2012). Mini data logger - Temperature and humidity - Testo 174H. Testo.
TSI Inc. (1999). P-TRAK TM Ultrafine Particle Counter. TSI Incorporated Health and Safety
Instruments. USA, TSI Inc.
TSI Inc. (2012). P-Trak® Ultrafine Particle Counter Theory of Operation. Application Note
ITI-071. TSI Incorporated Health and Safety Instruments. USA, TSI Inc.
U. S. EPA (2011). Exposure Factors Handbook 2011 Edition (Final). U.S. Environmental
Protection Agency. Washington, DC, U.S. Environmental Protection Agency.
4. Results
4.1 Particle Number Concentrations and Comparison with other
Studies
Number concentrations of ultrafine particles in the selected schools are presented in Figure
4.1. These results consider particle number concentration values of the respective analyzed
indoor classroom microenvironments, namely classrooms on the zero and first floor. Other
analyzed micro-environments were not accounted for, as they were associated with highly
specific behaviors.
Table 4.1 presents additional information regarding the obtained data: average indoor
concentrations and lowest and highest recorded values indoor. As for the same information
for outdoor settings, it is present in Table 4.4.

56 CHAPTER 4
Indoor Ultrafine Particles: Evaluation of Pre-school Environments
Figure 4.1 – Ultrafine particle number concentrations at three schools: average minimum
and maximum values, median, 25th
and 75th
percentile.
Table 4.1 – Ultrafine particle number concentration ranges for indoor environments of three
schools, mean, minimum and maximum.
US1 US2 RS1
Mean (particle
number cm-3
) 9.35×10
3 1.07×10
4 6.86×10
3
Minimum (particle
number cm-3
) 2.51×10
3 3.01×10
3 2.24×10
3
Maximum (particle
number cm-3
) 1.13×10
5 4.19×10
4 4.50×10
4
The statistical analysis of these results indicated that UFP number concentrations were
significantly lower (P < 0.05) at the rural school than at the US1 and US2.
The comparison of UFP at each urban school showed that the means between both US1 and
US2 were not significantly different (P < 0.05).
The ratios of the average, minimal and maximal concentrations of UFP at urban and rural
schools are presented in Table 4.2.
0
10000
20000
30000
40000
50000
60000
Indoor Outdoor Indoor Outdoor Indoor Outdoor
US1 US2 RS1
Par
ticl
e N
um
be
r C
on
cen
trat
ion
(p
arti
cle
nu
mb
er
cm-3
)
Indoor
Outdoor
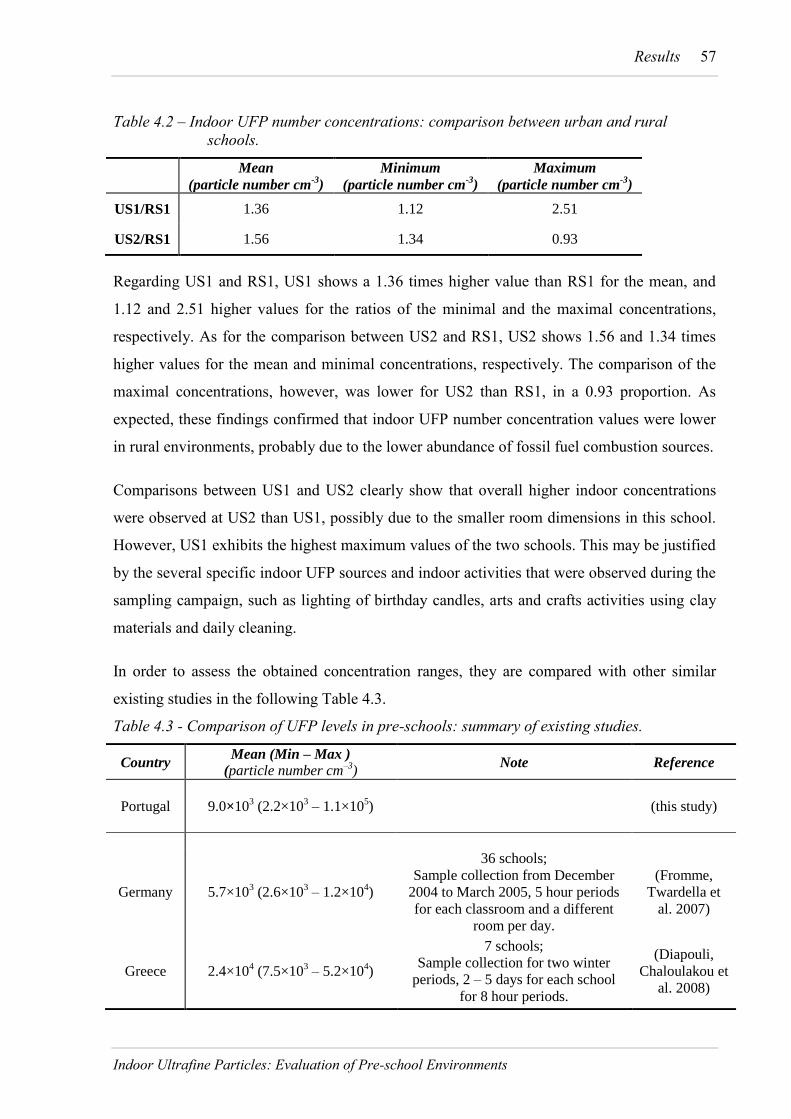
Results 57
Indoor Ultrafine Particles: Evaluation of Pre-school Environments
Table 4.2 – Indoor UFP number concentrations: comparison between urban and rural
schools.
Mean
(particle number cm-3
)
Minimum
(particle number cm-3
)
Maximum
(particle number cm-3
)
US1/RS1 1.36 1.12 2.51
US2/RS1 1.56 1.34 0.93
Regarding US1 and RS1, US1 shows a 1.36 times higher value than RS1 for the mean, and
1.12 and 2.51 higher values for the ratios of the minimal and the maximal concentrations,
respectively. As for the comparison between US2 and RS1, US2 shows 1.56 and 1.34 times
higher values for the mean and minimal concentrations, respectively. The comparison of the
maximal concentrations, however, was lower for US2 than RS1, in a 0.93 proportion. As
expected, these findings confirmed that indoor UFP number concentration values were lower
in rural environments, probably due to the lower abundance of fossil fuel combustion sources.
Comparisons between US1 and US2 clearly show that overall higher indoor concentrations
were observed at US2 than US1, possibly due to the smaller room dimensions in this school.
However, US1 exhibits the highest maximum values of the two schools. This may be justified
by the several specific indoor UFP sources and indoor activities that were observed during the
sampling campaign, such as lighting of birthday candles, arts and crafts activities using clay
materials and daily cleaning.
In order to assess the obtained concentration ranges, they are compared with other similar
existing studies in the following Table 4.3.
Table 4.3 - Comparison of UFP levels in pre-schools: summary of existing studies.
Country Mean (Min – Max )
(particle number cm–3
) Note Reference
Portugal 9.0×10³ (2.2×10
3 – 1.1×10
5) (this study)
Germany 5.7×10³ (2.6×10
3 – 1.2×10
4)
36 schools;
Sample collection from December
2004 to March 2005, 5 hour periods
for each classroom and a different
room per day.
(Fromme,
Twardella et
al. 2007)
Greece 2.4×10⁴ (7.5×10
3 – 5.2×10
4)
7 schools;
Sample collection for two winter
periods, 2 – 5 days for each school
for 8 hour periods.
(Diapouli,
Chaloulakou et
al. 2008)
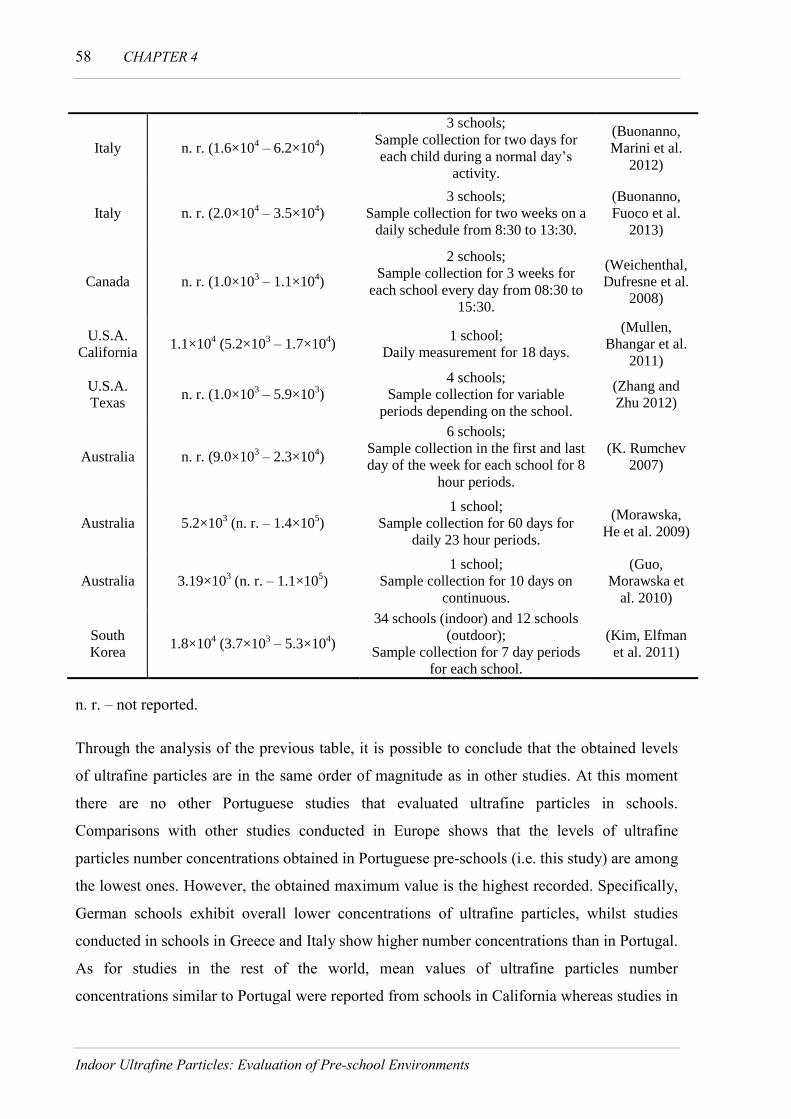
58 CHAPTER 4
Indoor Ultrafine Particles: Evaluation of Pre-school Environments
Italy n. r. (1.6×10⁴ – 6.2×10
4)
3 schools;
Sample collection for two days for
each child during a normal day’s
activity.
(Buonanno,
Marini et al.
2012)
Italy n. r. (2.0×10⁴ – 3.5×10
4)
3 schools;
Sample collection for two weeks on a
daily schedule from 8:30 to 13:30.
(Buonanno,
Fuoco et al.
2013)
Canada n. r. (1.0×10³ – 1.1×10
4)
2 schools;
Sample collection for 3 weeks for
each school every day from 08:30 to
15:30.
(Weichenthal,
Dufresne et al.
2008)
U.S.A.
California 1.1×10
4 (5.2×10
3 – 1.7×10
4)
1 school;
Daily measurement for 18 days.
(Mullen,
Bhangar et al.
2011)
U.S.A.
Texas n. r. (1.0×10
3 – 5.9×10
3)
4 schools;
Sample collection for variable
periods depending on the school.
(Zhang and
Zhu 2012)
Australia n. r. (9.0×10³ – 2.3×10
4)
6 schools;
Sample collection in the first and last
day of the week for each school for 8
hour periods.
(K. Rumchev
2007)
Australia 5.2×10³ (n. r. – 1.4×10
5)
1 school;
Sample collection for 60 days for
daily 23 hour periods.
(Morawska,
He et al. 2009)
Australia 3.19×10³ (n. r. – 1.1×10
5)
1 school;
Sample collection for 10 days on
continuous.
(Guo,
Morawska et
al. 2010)
South
Korea 1.8×10
4 (3.7×10
3 – 5.3×10
4)
34 schools (indoor) and 12 schools
(outdoor);
Sample collection for 7 day periods
for each school.
(Kim, Elfman
et al. 2011)
n. r. – not reported.
Through the analysis of the previous table, it is possible to conclude that the obtained levels
of ultrafine particles are in the same order of magnitude as in other studies. At this moment
there are no other Portuguese studies that evaluated ultrafine particles in schools.
Comparisons with other studies conducted in Europe shows that the levels of ultrafine
particles number concentrations obtained in Portuguese pre-schools (i.e. this study) are among
the lowest ones. However, the obtained maximum value is the highest recorded. Specifically,
German schools exhibit overall lower concentrations of ultrafine particles, whilst studies
conducted in schools in Greece and Italy show higher number concentrations than in Portugal.
As for studies in the rest of the world, mean values of ultrafine particles number
concentrations similar to Portugal were reported from schools in California whereas studies in

Results 59
Indoor Ultrafine Particles: Evaluation of Pre-school Environments
South Korea and in Australia observed particle number concentrations twice higher and 2-3
times lower, respectively. Evaluating the concentrations extremes (i.e. minimal and maximal
values), the present study exhibit both the lowest minimal and the highest maxima value (with
the exception of Australia by (Morawska, He et al. 2009). In general it is possible to conclude
that overall levels of ultrafine particles in Portuguese pre-schools are similar to those in other
developed countries, but relatively lower than in developing countries. Such a fact may be
derived from the existing differences of the considered countries. The differences in
concentrations of ultrafine particles might be justified by different seasonal and
meteorological conditions that vary from each country according to its geographical
localization, and might strongly influence UFP concentrations (Chan 2002; WHO 2006). The
level of urbanization, industrialization and overall development of each country and, more
specifically, of the surrounding areas where the schools are located, is also another important
parameter that justifies existing concentration variations. Finally, it is also necessary to
remark on different organizations of the analyzed studies (number and type of schools; study
duration; the analyzed micro-environments; sampling equipment; the building’s properties
such as construction materials, ventilation, and heating systems; and potential existence of
other specific sources) that might influence the overall results and comparisons.
4.2 Evaluation of Ultrafine Particle Sources in Pre-School Environments
In order to better understand ultrafine particle levels and its behavior in indoor pre-school
environments, measurements were also made in the outdoor playgrounds of the schools. This
was done in order to compare the levels for both indoor and outdoor environments, which
would allow further assessment of the possible influences that outdoor air quality may cause
to indoor one (due to penetration and transportation phenomena).
The following results are presented in Table 4.4:
Table 4.4 – Assessment of outdoor contributions (particle number cm–3
).
Indoor Outdoor I/O
Mean Range Mean Range Mean
US1 9.35×10³ 2.51×10
3 – 1.13×10
5 1.71×10
4 4.87×10
3 – 4.36×10
4 0.55
US2 1.07×10⁴ 3.01×10
3 – 4.19×10
4 1.21×10
4 2.46×10
3 – 3.03×10
4 0.89
RS1 8.20×10³ 2.24×10
3 – 4.50×10
4 1.02×10
4 1.51×10
3 – 3.39×10
4 0.67

60 CHAPTER 4
Indoor Ultrafine Particles: Evaluation of Pre-school Environments
As for UFP number concentration values for the outdoor ambiences, both mean and
concentrations ranges are overall higher for urban schools than for the rural one, as expected.
These values are also directly influenced by traffic density of its surrounding streets
(presented in Chapter 3). However further analysis of obtained results suggest that traffic
density was not the only outdoor UFP source. Firstly, the mean for RS1 is not as low as
expected: about 0.60 times for US1 and 0.85 times for US2, whereas traffic densities for
urban schools are approximately 10 times higher. Secondly, maximum concentration of
ultrafine particles observed at RS1 is higher than at US2. Both of these occurrences suggest
that beyond traffic emissions are other outdoor sources of ultrafine particles. During the
sampling period there were recorded occurrences of soil plowing on the neighboring farms.
These soil excavating activities, combined with the existing meteorological conditions, could
be a possible explanation for the obtained values in RS1.
In order to further analyze the influence of outdoor air on indoor UFP number concentration
values, the Indoor/Outdoor ratio (I/O) was calculated. The implications of the ratio values are
the following:
If I/O < 1 – Indoor concentration values were probably caused by the contribution of
outdoor sources to indoor UFP air quality through transportation and penetration
phenomena (i.e. outdoor air was the predominant source of UFP indoors);
If I/O > 1 – Indoor concentration values were most likely caused by the existence of
specific indoor emission sources of UFP.
All the analyzed schools show I/O values lower than 1. Therefore, it is possible to conclude
that a great amount of the average indoor ultrafine particle number concentration levels are
due to contribution of outdoor UFP sources. Considering US1 and US2, their I/O values are
lower than 1, and are most likely due to the increased traffic density in the streets surrounding
the schools. As for RS1, the obtained values are probably a consequence of the observed
farming activities.
It is necessary to point out that in some days the values of I/O ratios were higher than 1. These
occurrences were probably due to specific indoor sources that caused higher concentrations of
ultrafine particles indoors than those outdoors. In US1 the identified UFP sources were clay
molding activities with the use of sand paper, lighting of birthday candles and wood
varnishing, which resulted in the suspension of a large quantity of ultrafine particles in indoor

Results 61
Indoor Ultrafine Particles: Evaluation of Pre-school Environments
air. As for RS1, high UFP concentrations occurred during painting activities performed in the
classroom, whereas at the same time soil plowing was done in farms surrounding the school,
with UFP entering easily in the classroom as all windows were wide open. I/O ratio values
larger than 1 may also be due entrapment or accumulation of UFP inside the school, since
windows and doors closing induces reduced aerodynamics and escape routes for this pollutant
(unlike outdoors where physical barriers are practically inexistent).
4.3 Particle Number Concentration in Different Pre-School Micro-
Environments
In order to identify which are the most problematic micro-environments in the selected pre-
schools and comprehend each micro-environment’s potential influence, detailed information
on the average levels and ranges of number concentrations for ultrafine particles is presented
in Figure 4.2 and Table 4.5.
Figure 4.2 – Average UFP number concentrations for the studied micro-environments at
three pre-schools.
0,0
10000,0
20000,0
30000,0
40000,0
50000,0
60000,0
0 FloorClassroom
1 FloorClassroom A
1 FloorClassroom B
Canteen Gymnasium Playroom
Par
ticl
e N
um
be
r C
on
cen
trat
ion
(p
arti
cle
nu
mb
er
cm-3
)
Micro-Environment
US1
US2
RS1

62 CHAPTER 4
Indoor Ultrafine Particles: Evaluation of Pre-school Environments
Table 4.5 – UFP number concentration values for the different micro-environments (particle
number cm–3
).
Micro –
Environment
US1 US2 RS1
Mean Range Mean Range Mean Range
0 Floor
Classroom 8.59×10
3
2.51×10³ –
1.04×10⁵
1.13×10⁴
3.01×10³ –
4.19×10⁴
7.55×10³
2.24×10³ –
4.50×10⁴
1 Floor
Classroom A 8.85×10
3
3.14×10³ –
1.13×10⁵
1.20×10⁴
5.87×10³ –
2.25×10⁴
6.16×10³
2.53×10³ –
1.60×10⁴
1 Floor
Classroom B 1.06×10
4
4.23×10³ –
2.92×10⁴
8.89×10³
3.64×10³ –
2.79×10⁴
N. A. a
Canteen 5.15×10⁴
9.28×10³ –
1.73×10⁵
3.28×10⁴
1.05×10⁴ –
2.48×10⁵
4.09×10⁴ 7.18×10
3 –
1.38×10⁵
Gymnasium N. A. a
9.46×10³
5.46×10³ –
1.71×10⁴
N. A. a
Playroom 1.68×10⁴
5.28×10³ –
1.93×10⁵
N. A. a N. A.
a
a – not available.
The results in Table 4.5 clearly show that the canteens are the micro-environment that
exhibits higher levels of UFP number concentrations. These rooms are associated with a
specific source of UFP, namely gas fueled stoves, which are used for cooking the meals for
the students. Depending on the number of students, the production of UFP by this source will
vary, being higher for higher number of students (i.e. longer cooking period and a higher
number of active sources). It was also observed that the studied schools canteens were
directly connected to the kitchens through a large opening, and therefore the penetration of
this pollutant from the source to this room is facilitated. Specifically, the highest average
concentration value is observed for US1’s canteen, which is the school with the higher
number of students. The highest recorded maximal and minimal values of UFP however, are
in canteen in US2, and are considerably higher than for the other two schools. This
occurrence might be due to US2 canteen being the smallest one out of the three, which
consequently implies that the pollutant disperses in a smaller volume.
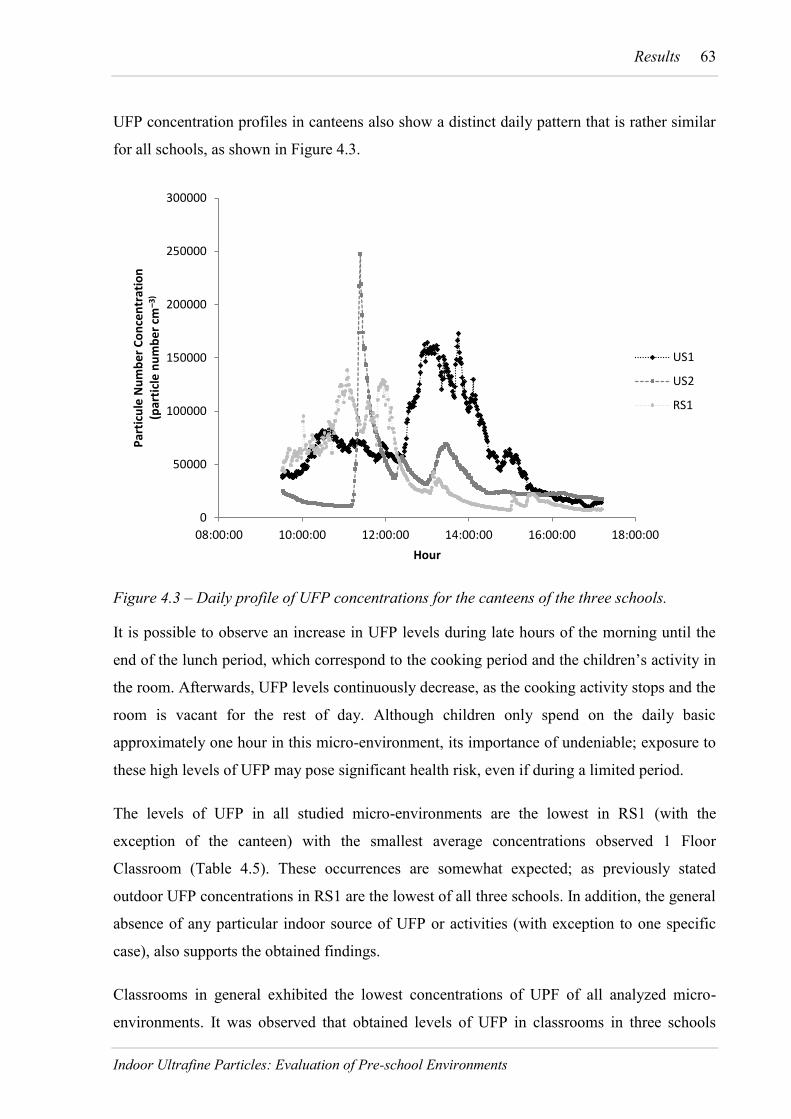
Results 63
Indoor Ultrafine Particles: Evaluation of Pre-school Environments
UFP concentration profiles in canteens also show a distinct daily pattern that is rather similar
for all schools, as shown in Figure 4.3.
Figure 4.3 – Daily profile of UFP concentrations for the canteens of the three schools.
It is possible to observe an increase in UFP levels during late hours of the morning until the
end of the lunch period, which correspond to the cooking period and the children’s activity in
the room. Afterwards, UFP levels continuously decrease, as the cooking activity stops and the
room is vacant for the rest of day. Although children only spend on the daily basic
approximately one hour in this micro-environment, its importance of undeniable; exposure to
these high levels of UFP may pose significant health risk, even if during a limited period.
The levels of UFP in all studied micro-environments are the lowest in RS1 (with the
exception of the canteen) with the smallest average concentrations observed 1 Floor
Classroom (Table 4.5). These occurrences are somewhat expected; as previously stated
outdoor UFP concentrations in RS1 are the lowest of all three schools. In addition, the general
absence of any particular indoor source of UFP or activities (with exception to one specific
case), also supports the obtained findings.
Classrooms in general exhibited the lowest concentrations of UPF of all analyzed micro-
environments. It was observed that obtained levels of UFP in classrooms in three schools
0
50000
100000
150000
200000
250000
300000
08:00:00 10:00:00 12:00:00 14:00:00 16:00:00 18:00:00
Par
ticu
le N
um
be
r C
on
cen
trat
ion
(p
arti
cle
nu
mb
er
cm–3
)
Hour
US1
US2
RS1
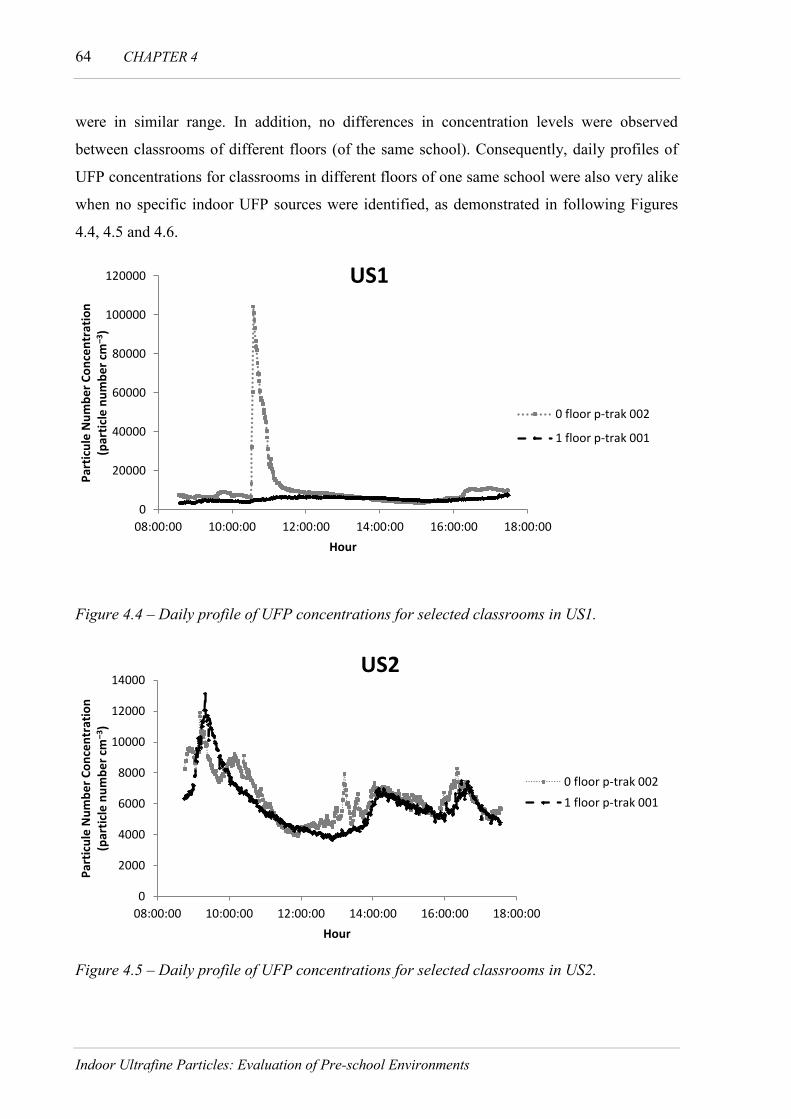
64 CHAPTER 4
Indoor Ultrafine Particles: Evaluation of Pre-school Environments
were in similar range. In addition, no differences in concentration levels were observed
between classrooms of different floors (of the same school). Consequently, daily profiles of
UFP concentrations for classrooms in different floors of one same school were also very alike
when no specific indoor UFP sources were identified, as demonstrated in following Figures
4.4, 4.5 and 4.6.
Figure 4.4 – Daily profile of UFP concentrations for selected classrooms in US1.
Figure 4.5 – Daily profile of UFP concentrations for selected classrooms in US2.
0
2000
4000
6000
8000
10000
12000
14000
08:00:00 10:00:00 12:00:00 14:00:00 16:00:00 18:00:00
Par
ticu
le N
um
be
r C
on
cen
trat
ion
(p
arti
cle
nu
mb
er
cm–3
)
Hour
US2
0 floor p-trak 002
1 floor p-trak 001
0
20000
40000
60000
80000
100000
120000
08:00:00 10:00:00 12:00:00 14:00:00 16:00:00 18:00:00
Par
ticu
le N
um
be
r C
on
cen
trat
ion
(p
arti
cle
nu
mb
er
cm–
3 )
Hour
US1
0 floor p-trak 002
1 floor p-trak 001

Results 65
Indoor Ultrafine Particles: Evaluation of Pre-school Environments
Figure 4.6 – Daily profile of UFP concentrations for selected classrooms in RS1.
In addition, the daily profiles of UFP concentrations were in general relatively stable.
However, some differences were observed, which in most cases were associated with specific
UFP emission sources and activities. Examples are demonstrated in Figure 4.4, where in 0
floor classroom the number concentrations of UFP, for a short period, reached levels up to
1×10⁵ particles cm
-3. This temporary increase of UFP was attributed to the lighting of candles
for a birthday cake. At RS1 (Figure 4.6) both classrooms exhibited two increases of UFP
number concentrations during afternoon. Such an occurrence was due to painting activities in
the 0 floor classroom, which later diffused into the 1 floor classroom. This would explain the
lower concentration of UFP and the time delay of levels in the 1 floor classroom.
The fact that classrooms are the micro-environment with the lowest UFP number
concentrations is somewhat reassuring. Classrooms are the most important micro-
environment, simply because children spend more than 50% of their total time in school
inside classrooms. Therefore, reducing UFP number concentrations in these rooms as much as
possible is of high importance, in order to prevent the potential health risks related with UFP
exposure on pre-school children.
0
5000
10000
15000
20000
25000
08:00:00 10:00:00 12:00:00 14:00:00 16:00:00 18:00:00
Par
ticu
le N
um
be
r C
on
cen
trat
ion
(p
arti
cle
nu
mb
er
cm–3
)
Hour
RS1
0 floor p-trak 001
1 floor p-trak 002
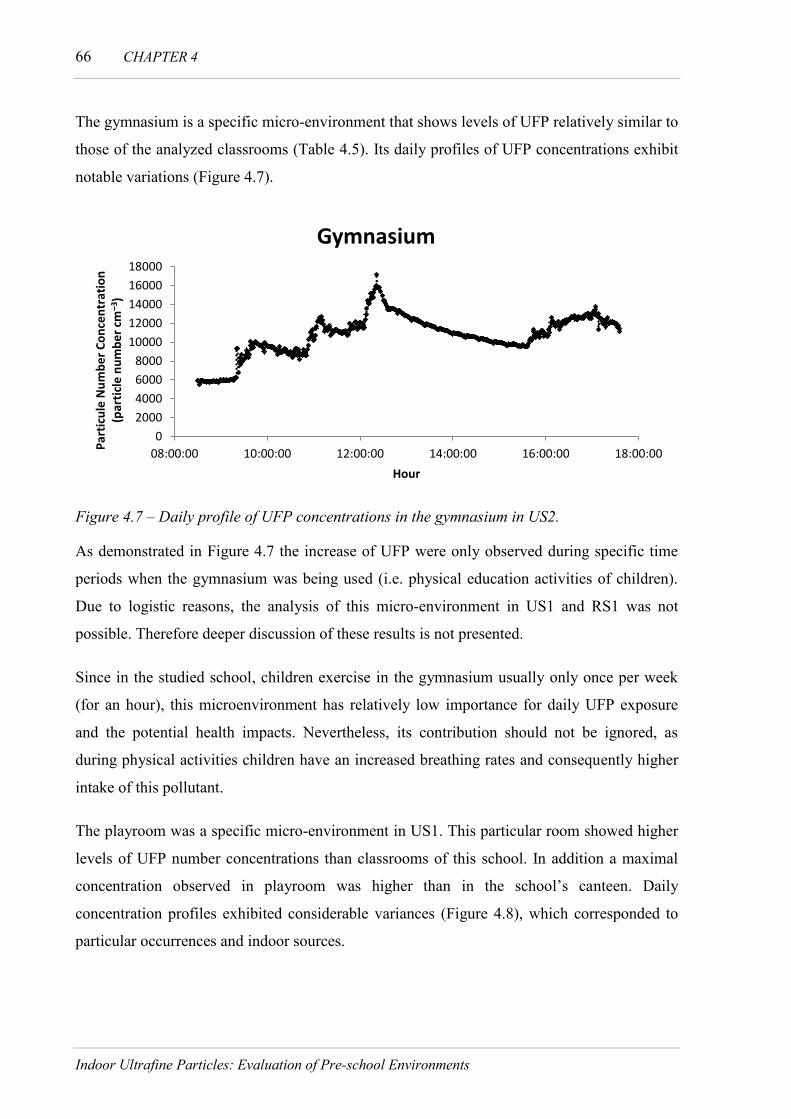
66 CHAPTER 4
Indoor Ultrafine Particles: Evaluation of Pre-school Environments
The gymnasium is a specific micro-environment that shows levels of UFP relatively similar to
those of the analyzed classrooms (Table 4.5). Its daily profiles of UFP concentrations exhibit
notable variations (Figure 4.7).
Figure 4.7 – Daily profile of UFP concentrations in the gymnasium in US2.
As demonstrated in Figure 4.7 the increase of UFP were only observed during specific time
periods when the gymnasium was being used (i.e. physical education activities of children).
Due to logistic reasons, the analysis of this micro-environment in US1 and RS1 was not
possible. Therefore deeper discussion of these results is not presented.
Since in the studied school, children exercise in the gymnasium usually only once per week
(for an hour), this microenvironment has relatively low importance for daily UFP exposure
and the potential health impacts. Nevertheless, its contribution should not be ignored, as
during physical activities children have an increased breathing rates and consequently higher
intake of this pollutant.
The playroom was a specific micro-environment in US1. This particular room showed higher
levels of UFP number concentrations than classrooms of this school. In addition a maximal
concentration observed in playroom was higher than in the school’s canteen. Daily
concentration profiles exhibited considerable variances (Figure 4.8), which corresponded to
particular occurrences and indoor sources.
0
2000
4000
6000
8000
10000
12000
14000
16000
18000
08:00:00 10:00:00 12:00:00 14:00:00 16:00:00 18:00:00
Par
ticu
le N
um
be
r C
on
cen
trat
ion
(p
arti
cle
nu
mb
er
cm–3
)
Hour
Gymnasium
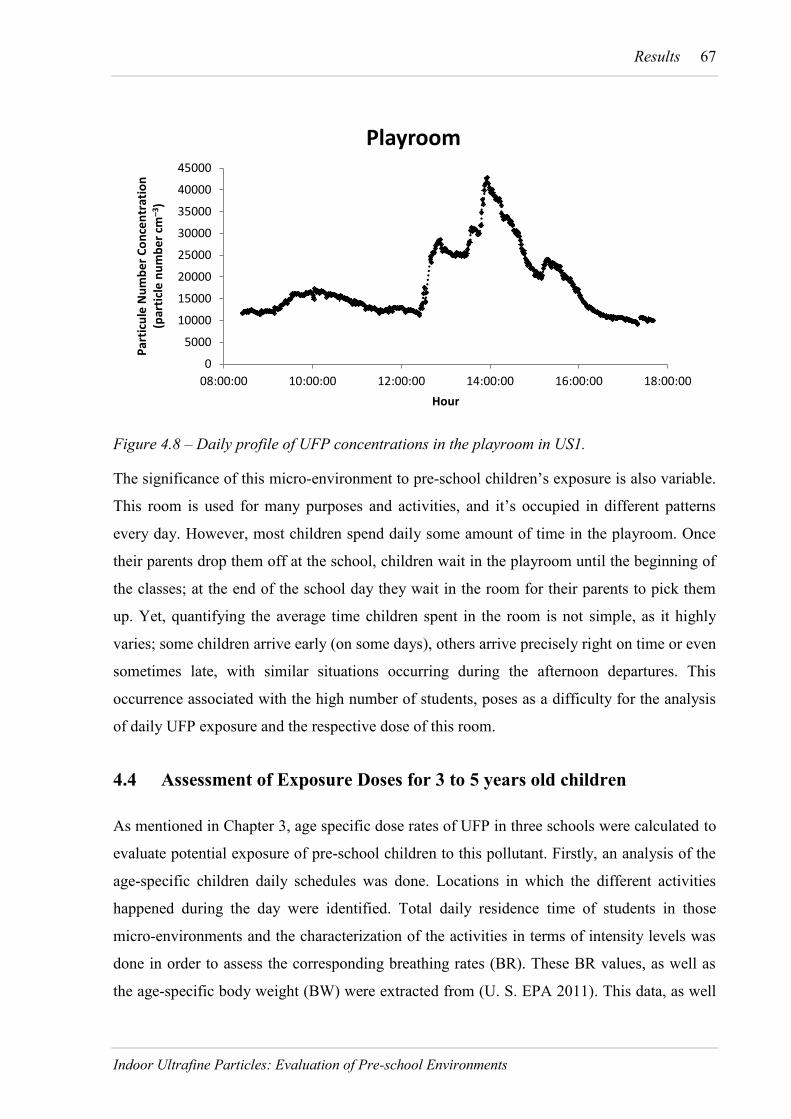
Results 67
Indoor Ultrafine Particles: Evaluation of Pre-school Environments
Figure 4.8 – Daily profile of UFP concentrations in the playroom in US1.
The significance of this micro-environment to pre-school children’s exposure is also variable.
This room is used for many purposes and activities, and it’s occupied in different patterns
every day. However, most children spend daily some amount of time in the playroom. Once
their parents drop them off at the school, children wait in the playroom until the beginning of
the classes; at the end of the school day they wait in the room for their parents to pick them
up. Yet, quantifying the average time children spent in the room is not simple, as it highly
varies; some children arrive early (on some days), others arrive precisely right on time or even
sometimes late, with similar situations occurring during the afternoon departures. This
occurrence associated with the high number of students, poses as a difficulty for the analysis
of daily UFP exposure and the respective dose of this room.
4.4 Assessment of Exposure Doses for 3 to 5 years old children
As mentioned in Chapter 3, age specific dose rates of UFP in three schools were calculated to
evaluate potential exposure of pre-school children to this pollutant. Firstly, an analysis of the
age-specific children daily schedules was done. Locations in which the different activities
happened during the day were identified. Total daily residence time of students in those
micro-environments and the characterization of the activities in terms of intensity levels was
done in order to assess the corresponding breathing rates (BR). These BR values, as well as
the age-specific body weight (BW) were extracted from (U. S. EPA 2011). This data, as well
0
5000
10000
15000
20000
25000
30000
35000
40000
45000
08:00:00 10:00:00 12:00:00 14:00:00 16:00:00 18:00:00
Par
ticu
le N
um
be
r C
on
cen
trat
ion
(p
arti
cle
nu
mb
er
cm–3
)
Hour
Playroom
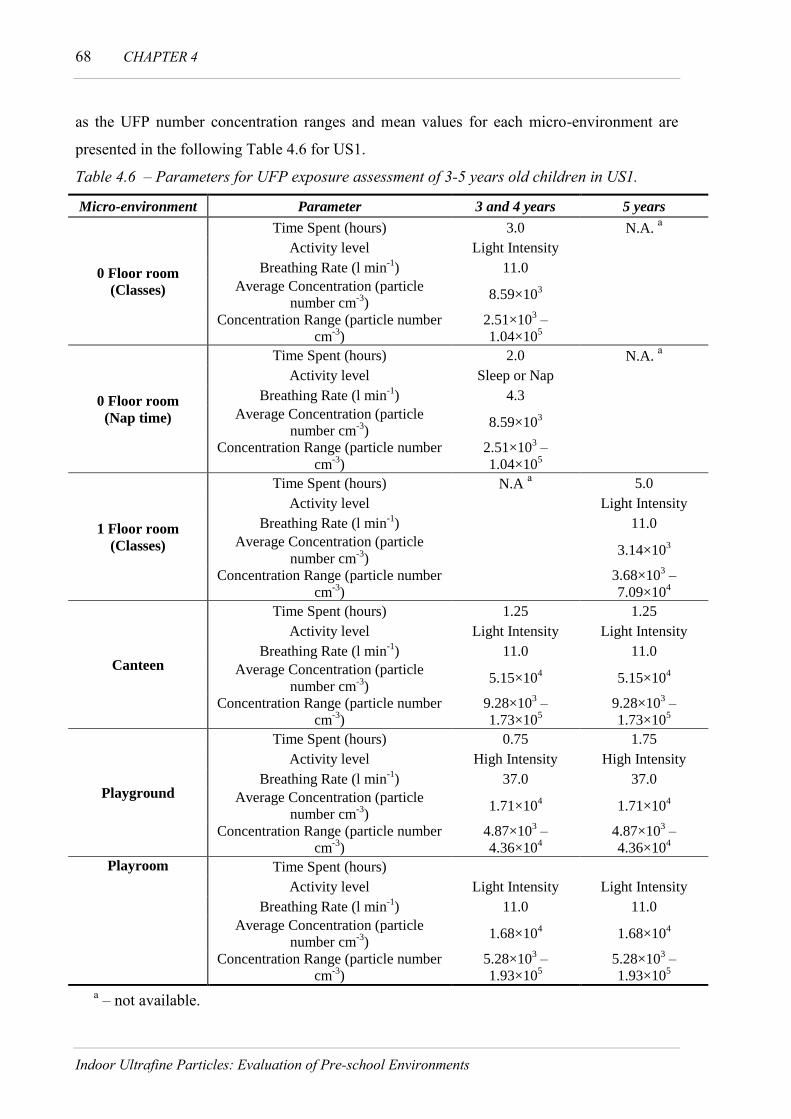
68 CHAPTER 4
Indoor Ultrafine Particles: Evaluation of Pre-school Environments
as the UFP number concentration ranges and mean values for each micro-environment are
presented in the following Table 4.6 for US1.
Table 4.6 – Parameters for UFP exposure assessment of 3-5 years old children in US1.
Micro-environment Parameter 3 and 4 years 5 years
0 Floor room
(Classes)
Time Spent (hours) 3.0 N.A. a
Activity level Light Intensity
Breathing Rate (l min-1
) 11.0
Average Concentration (particle
number cm-3
) 8.59×10
3
Concentration Range (particle number
cm-3
)
2.51×10³ –
1.04×10⁵
0 Floor room
(Nap time)
Time Spent (hours) 2.0 N.A. a
Activity level Sleep or Nap
Breathing Rate (l min-1
) 4.3
Average Concentration (particle
number cm-3
) 8.59×10
3
Concentration Range (particle number
cm-3
)
2.51×10³ –
1.04×10⁵
1 Floor room
(Classes)
Time Spent (hours) N.A a 5.0
Activity level Light Intensity
Breathing Rate (l min-1
) 11.0
Average Concentration (particle
number cm-3
) 3.14×10
3
Concentration Range (particle number
cm-3
)
3.68×10³ –
7.09×10⁴
Canteen
Time Spent (hours) 1.25 1.25
Activity level Light Intensity Light Intensity
Breathing Rate (l min-1
) 11.0 11.0
Average Concentration (particle
number cm-3
) 5.15×10
4 5.15×10
4
Concentration Range (particle number
cm-3
)
9.28×10³ –
1.73×10⁵
9.28×10³ –
1.73×10⁵
Playground
Time Spent (hours) 0.75 1.75
Activity level High Intensity High Intensity
Breathing Rate (l min-1
) 37.0 37.0
Average Concentration (particle
number cm-3
) 1.71×10
4 1.71×10
4
Concentration Range (particle number
cm-3
)
4.87×10³ –
4.36×10⁴
4.87×10³ –
4.36×10⁴
Playroom Time Spent (hours)
Activity level Light Intensity Light Intensity
Breathing Rate (l min-1
) 11.0 11.0
Average Concentration (particle
number cm-3
) 1.68×10
4 1.68×10
4
Concentration Range (particle number
cm-3
)
5.28×10³ –
1.93×10⁵
5.28×10³ –
1.93×10⁵
a – not available.
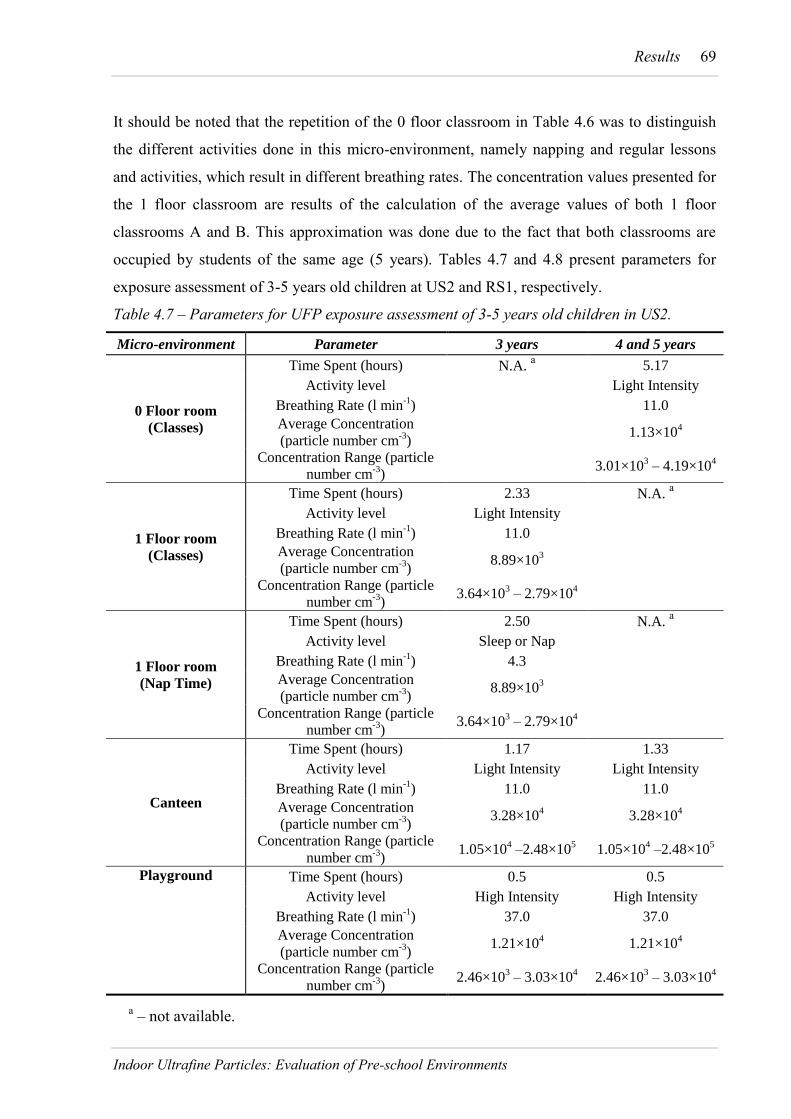
Results 69
Indoor Ultrafine Particles: Evaluation of Pre-school Environments
It should be noted that the repetition of the 0 floor classroom in Table 4.6 was to distinguish
the different activities done in this micro-environment, namely napping and regular lessons
and activities, which result in different breathing rates. The concentration values presented for
the 1 floor classroom are results of the calculation of the average values of both 1 floor
classrooms A and B. This approximation was done due to the fact that both classrooms are
occupied by students of the same age (5 years). Tables 4.7 and 4.8 present parameters for
exposure assessment of 3-5 years old children at US2 and RS1, respectively.
Table 4.7 – Parameters for UFP exposure assessment of 3-5 years old children in US2.
Micro-environment Parameter 3 years 4 and 5 years
0 Floor room
(Classes)
Time Spent (hours) N.A. a 5.17
Activity level Light Intensity
Breathing Rate (l min-1
) 11.0
Average Concentration
(particle number cm-3
) 1.13×10
4
Concentration Range (particle
number cm-3
) 3.01×10
3 – 4.19×10
4
1 Floor room
(Classes)
Time Spent (hours) 2.33 N.A. a
Activity level Light Intensity
Breathing Rate (l min-1
) 11.0
Average Concentration
(particle number cm-3
) 8.89×10
3
Concentration Range (particle
number cm-3
) 3.64×10
3 – 2.79×10
4
1 Floor room
(Nap Time)
Time Spent (hours) 2.50 N.A. a
Activity level Sleep or Nap
Breathing Rate (l min-1
) 4.3
Average Concentration
(particle number cm-3
) 8.89×10
3
Concentration Range (particle
number cm-3
) 3.64×10
3 – 2.79×10
4
Canteen
Time Spent (hours) 1.17 1.33
Activity level Light Intensity Light Intensity
Breathing Rate (l min-1
) 11.0 11.0
Average Concentration
(particle number cm-3
) 3.28×10
4 3.28×10
4
Concentration Range (particle
number cm-3
) 1.05×10
4 –2.48×10
5 1.05×10
4 –2.48×10
5
Playground Time Spent (hours) 0.5 0.5
Activity level High Intensity High Intensity
Breathing Rate (l min-1
) 37.0 37.0
Average Concentration
(particle number cm-3
) 1.21×10
4 1.21×10
4
Concentration Range (particle
number cm-3
) 2.46×10
3 – 3.03×10
4 2.46×10
3 – 3.03×10
4
a – not available.

70 CHAPTER 4
Indoor Ultrafine Particles: Evaluation of Pre-school Environments
Once again, 1 floor classroom in Table 4.7 is repeated to distinguish between different
activities performed in this micro-environment. As for the UFP concentrations, the values
presented in Table 4.7 are those obtained for 1 Floor Classroom B, which is assigned to 3
year-old students.
Table 4.8 – Parameters for UFP exposure assessment of 3-5 years old children in RS1.
Micro-environment Parameter 3. 4 and 5 years
0 Floor room
(Classes)
Time Spent (hours) 3.50
Activity level Light Intensity
Breathing Rate (l min-1
) 11.0
Average Concentration (particle number cm-3
) 7.55×10³
Concentration Range (particle number cm-3
) 2.24×10³ – 4.50×10
4
Canteen
Time Spent (hours) 0.75
Activity level Light Intensity
Breathing Rate (l min-1
) 11.0
Average Concentration (particle number cm-3
) 4.09×10⁴
Concentration Range (particle number cm-3
) 7.18×10³ – 1.38×10
5
Playground
Time Spent (hours) 1.75
Activity level High Intensity
Breathing Rate (l min-1
) 37.0
Average Concentration (particle number cm-3
) 1.02×10⁴
Concentration Range (particle number cm-3
) 1.51×10³ – 3.39×10
4
Concerning RS1, it is possible assume that exposure for all pre-school children from 3 to 5
years old will be rather similar, as all children constitute only one class and therefore have
same time and activity schedules.
Due to the high variations in terms of time and children, the period before the beginning
classes and at the end of the day (i.e. when children arrive or wait for their relatives to pick
them up) was not included in exposure assessment. Therefore, the considered schedules were:
9 a. m. to 4 p. m. in US1; 9:30 a. m. to 4:30 p. m. in US2; and 9:30 a. m. to 3:30 p. m. in RS1.
Weighted average age-specific breathing rates and concentrations (BRWA and CWA) were then
calculated for all three schools (Table 4.9).

Results 71
Indoor Ultrafine Particles: Evaluation of Pre-school Environments
Table 4.9 –Main parameters for the calculation of the UFP dose rates.
Parameter US1 US2 RS1
3 and 4 years 5 years 3 years 4 and 5 years 3, 4 and 5 years
BRWA (l min-1
) 11.9 17.5 10.4 12.9 18.9
CWA (particle number cm-3
) 1.72×10⁴ 1.90×10
4 1.34×10
4 1.54×10
4 1.25×10
4
N (h) 7.00 7.00 6.50 7.00 6.00
BW (kg) 18.6 18.6 18.6 18.6 18.6
The data in Table 4.9 show that RS1, a public school, is the one with the shortest residence
time of children in the premises. This school, which is in rural location, also exhibited the
lowest concentrations of UFP. However, the estimated age-specific weighted breathing rate in
RS1 is the highest among all three schools. This is most likely due to longer residences of
children in the playground area (environment with relatively high average concentrations
during recess), where they perform activities with higher intensity such as running around.
It is also necessary to mention that due to logistic reasons, no room assigned to only 4 years
old children was analyzed in US1. Since some children in the class of 3 years were already 4
years old, the calculation of exposure dose for these students was made and adapted.
However, it is not representative of all 4 years-old children of this school, since their schedule
is assumed the same as the 5 year-old children.
The calculated Dose Rates are presented in the following Table 4.10.
Table 4.10 – Calculated age-specific dose rates for the selected schools.
Dose
(particle number kg-1
) US1 US2 RS1
3 and 4 years 5 years 3 years 4 and 5 years 3, 4 and 5 years
Children
Mean 4.60×10
9 7.52×10
9 2.94×10
9 4.48×10
9 4.50×10
9
Minimum 1.06×10
9 1.84×10
9 1.04×10
9 1.37×10
9 9.50×10
8
Maximum 2.95×10
10 4.20×10
10 1.48×10
10 2.51×10
10 1.92×10
10
Adults
(25 – 64
years old)
Mean 1.12×10
9 1.25×10
9 8.17×10
8 1.01×10
9 7.01×10
8
Minimum 2.60×10
8 3.05×10
8 2.90×10
8 2.87×10
8 1.48×10
8
Maximum 7.21×10
9 6.95×10
9 4.11×10
9 5.25×10
9 3.00×10
9

72 CHAPTER 4
Indoor Ultrafine Particles: Evaluation of Pre-school Environments
Judging by the obtained results, it is possible to conclude that, in general, pre-school children
in US1 are the ones associated with significantly higher exposure doses of UFP, since this
school exhibited higher levels of UFP number concentrations. In US2, lower exposure doses
were observed. Considering lower average levels of UFP in RS1 the dose rates are not as low
as expected, probably due to the considerably longer periods that children in RS1 spend
outdoors. Comparing age-specific dose rates, older children are always associated with higher
values (if differences in time schedules exist). This is most likely due to two factors. Firstly,
younger children spend a period of school time napping, which is an activity associated with
low levels of intensity and therefore low breathing rates. The other factor is amount of time
spent outdoors. Older children usually spend more time outdoors in the playground, with
higher intensity levels for the activities.
The estimated dose rates for children in all three schools were compared to those of adults of
25 to 64 years-old (Table 4.10), considering an inhalation rate of 1.2 l min-1
and body weight
of 77 kg that were retrieved from the EPA Exposure Handbook (U. S. EPA 2011). The time
schedule of adults was considered equal to children. As shown, the exposure doses for
children in the respective schools were 3.6 to 6.4 times higher than those of adults. In
addition, considering the high susceptibility of children to UFP, these results show that school
environments are an important place in children’s exposure assessment.
Considering child physical activities as an important factor influencing dose rates of UFP in
pre-schools, the age-specific exposure doses were assessed in US2 for the day during which
the children had physical education (P.E.) in the gymnasium. The parameters for the
respective exposure assessment and calculation of dose rates are presented in Table 4.11 and
4.12, respectively.
Table – 4.11 – Parameters for UFP exposure assessment of 3-5 years children in US2
considering physical activities in the gymnasium.
Micro-environment Parameter 3 years 4 and 5 years
0 Floor room
(Classes)
Time Spent (hours)
N.A. a
4.92
Activity level Light Intensity
Breathing Rate (l min-1
) 11.0
Average Concentration
(particle number cm-3
) 1.13×10
4
Concentration Range
(particle number cm-3
) 3.01×10
3 – 4.19×10
4
1 Floor room
(Classes)
Time Spent (hours) 2.33 N.A.
a
Activity level Light Intensity
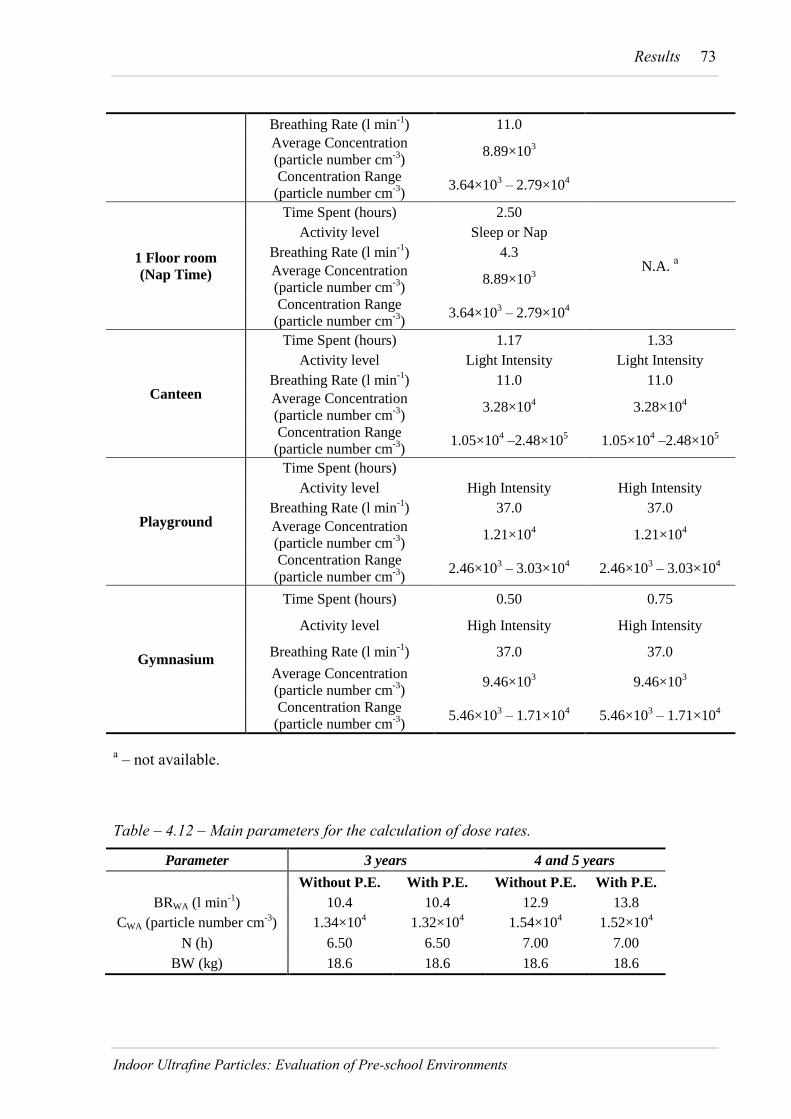
Results 73
Indoor Ultrafine Particles: Evaluation of Pre-school Environments
Breathing Rate (l min-1
) 11.0
Average Concentration
(particle number cm-3
) 8.89×10
3
Concentration Range
(particle number cm-3
) 3.64×10
3 – 2.79×10
4
1 Floor room
(Nap Time)
Time Spent (hours) 2.50
N.A. a
Activity level Sleep or Nap
Breathing Rate (l min-1
) 4.3
Average Concentration
(particle number cm-3
) 8.89×10
3
Concentration Range
(particle number cm-3
) 3.64×10
3 – 2.79×10
4
Canteen
Time Spent (hours) 1.17 1.33
Activity level Light Intensity Light Intensity
Breathing Rate (l min-1
) 11.0 11.0
Average Concentration
(particle number cm-3
) 3.28×10
4 3.28×10
4
Concentration Range
(particle number cm-3
) 1.05×10
4 –2.48×10
5 1.05×10
4 –2.48×10
5
Playground
Time Spent (hours)
Activity level High Intensity High Intensity
Breathing Rate (l min-1
) 37.0 37.0
Average Concentration
(particle number cm-3
) 1.21×10
4 1.21×10
4
Concentration Range
(particle number cm-3
) 2.46×10
3 – 3.03×10
4 2.46×10
3 – 3.03×10
4
Gymnasium
Time Spent (hours) 0.50 0.75
Activity level High Intensity High Intensity
Breathing Rate (l min-1
) 37.0 37.0
Average Concentration
(particle number cm-3
) 9.46×10
3 9.46×10
3
Concentration Range
(particle number cm-3
) 5.46×10
3 – 1.71×10
4 5.46×10
3 – 1.71×10
4
a – not available.
Table – 4.12 – Main parameters for the calculation of dose rates.
Parameter 3 years 4 and 5 years
Without P.E. With P.E. Without P.E. With P.E.
BRWA (l min-1
) 10.4 10.4 12.9 13.8
CWA (particle number cm-3
) 1.34×10⁴ 1.32×10
4 1.54×10
4 1.52×10
4
N (h) 6.50 6.50 7.00 7.00
BW (kg) 18.6 18.6 18.6 18.6
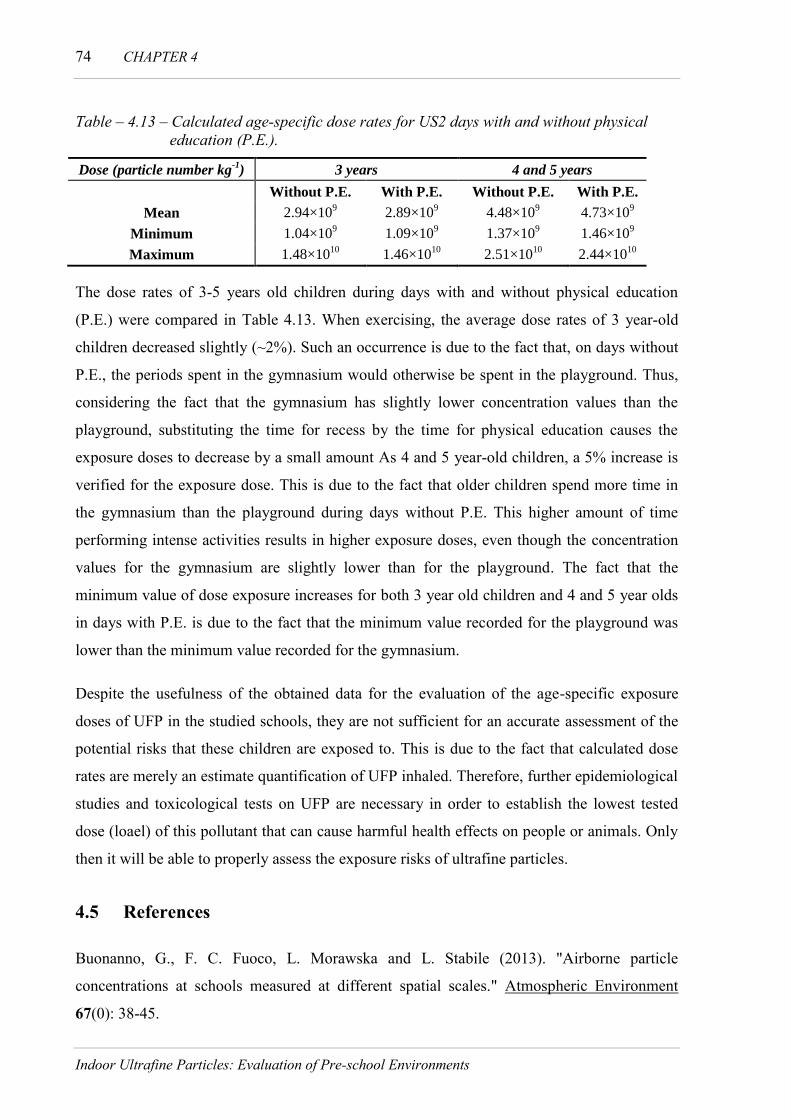
74 CHAPTER 4
Indoor Ultrafine Particles: Evaluation of Pre-school Environments
Table – 4.13 – Calculated age-specific dose rates for US2 days with and without physical
education (P.E.).
Dose (particle number kg-1
) 3 years 4 and 5 years
Without P.E. With P.E. Without P.E. With P.E.
Mean 2.94×10⁹ 2.89×10
9 4.48×10
9 4.73×10
9
Minimum 1.04×10⁹ 1.09×10
9 1.37×10
9 1.46×10
9
Maximum 1.48×10¹⁰
1.46×10¹⁰
2.51×10¹⁰
2.44×10¹⁰
The dose rates of 3-5 years old children during days with and without physical education
(P.E.) were compared in Table 4.13. When exercising, the average dose rates of 3 year-old
children decreased slightly (~2%). Such an occurrence is due to the fact that, on days without
P.E., the periods spent in the gymnasium would otherwise be spent in the playground. Thus,
considering the fact that the gymnasium has slightly lower concentration values than the
playground, substituting the time for recess by the time for physical education causes the
exposure doses to decrease by a small amount As 4 and 5 year-old children, a 5% increase is
verified for the exposure dose. This is due to the fact that older children spend more time in
the gymnasium than the playground during days without P.E. This higher amount of time
performing intense activities results in higher exposure doses, even though the concentration
values for the gymnasium are slightly lower than for the playground. The fact that the
minimum value of dose exposure increases for both 3 year old children and 4 and 5 year olds
in days with P.E. is due to the fact that the minimum value recorded for the playground was
lower than the minimum value recorded for the gymnasium.
Despite the usefulness of the obtained data for the evaluation of the age-specific exposure
doses of UFP in the studied schools, they are not sufficient for an accurate assessment of the
potential risks that these children are exposed to. This is due to the fact that calculated dose
rates are merely an estimate quantification of UFP inhaled. Therefore, further epidemiological
studies and toxicological tests on UFP are necessary in order to establish the lowest tested
dose (loael) of this pollutant that can cause harmful health effects on people or animals. Only
then it will be able to properly assess the exposure risks of ultrafine particles.
4.5 References
Buonanno, G., F. C. Fuoco, L. Morawska and L. Stabile (2013). "Airborne particle
concentrations at schools measured at different spatial scales." Atmospheric Environment
67(0): 38-45.

Results 75
Indoor Ultrafine Particles: Evaluation of Pre-school Environments
Buonanno, G., S. Marini, L. Morawska and F. C. Fuoco (2012). "Individual dose and
exposure of Italian children to ultrafine particles." Science of The Total Environment 438(0):
271-277.
Chan, A. T. (2002). "Indoor–outdoor relationships of particulate matter and nitrogen oxides
under different outdoor meteorological conditions." Atmospheric Environment 36(9): 1543-
1551.
Diapouli, E., A. Chaloulakou, N. Mihalopoulos and N. Spyrellis (2008). "Indoor and outdoor
PM mass and number concentrations at schools in the Athens area." Environmental
Monitoring and Assessment 136(1-3): 13-20.
Fromme, H., D. Twardella, S. Dietrich, D. Heitmann, R. Schierl, B. Liebl and H. Rüden
(2007). "Particulate matter in the indoor air of classrooms—exploratory results from Munich
and surrounding area." Atmospheric Environment 41(4): 854-866.
Guo, H., L. Morawska, C. He, Y. L. Zhang, G. Ayoko and M. Cao (2010). "Characterization
of particle number concentrations and PM2.5 in a school: influence of outdoor air pollution
on indoor air." Environmental Science and Pollution Research 17(6): 1268-1278.
K. Rumchev, R. O., D. Bertolatti & J. Spickett (2007). "Indoor air quality in old and new
schools." WIT Transactions on Biomedicine and Health 11: 8.
Kim, J. L., L. Elfman, G. Wieslander, M. Ferm, K. Toren and D. Norback (2011).
"Respiratory health among Korean pupils in relation to home, school and outdoor
environment." Journal of Korean Medical Science 26(2): 166-173.
Morawska, L., C. He, G. Johnson, H. Guo, E. Uhde and G. Ayoko (2009). "Ultrafine Particles
in Indoor Air of a School: Possible Role of Secondary Organic Aerosols." Environmental
Science & Technology 43(24): 9103-9109.
Mullen, N. A., S. Bhangar, S. V. Hering, N. M. Kreisberg and W. W. Nazaroff (2011).
"Ultrafine particle concentrations and exposures in six elementary school classrooms in
northern California." Indoor Air 21(1): 77-87.
U. S. EPA (2011). Exposure Factors Handbook 2011 Edition (Final). U.S. Environmental
Protection Agency. Washington, DC, U.S. Environmental Protection Agency.

76 CHAPTER 4
Indoor Ultrafine Particles: Evaluation of Pre-school Environments
Weichenthal, S., A. Dufresne, C. Infante-Rivard and L. Joseph (2008). "Characterizing and
predicting ultrafine particle counts in Canadian classrooms during the winter months: model
development and evaluation." Environmental Research 106(3): 349-360.
WHO (2006). Air quality guidelines global update 2005: Particulate matter, ozone, nitrogen
dioxide, and sulfur dioxide. Copenhagen: World Health Organization Regional Office for
Europe, World Health Organization Regional Office for Europe: 496.
Zhang, Q. and Y. Zhu (2012). "Characterizing ultrafine particles and other air pollutants at
five schools in South Texas." Indoor Air 22(1): 33-42.
5. Conclusion and Future Perspectives
5.1 Conclusions
The execution of this work has led to the following conclusions.
Regarding indoor average concentration levels for UFP, it was observed that both analyzed
schools in an urban environment presented higher values than the selected rural school. This
was particularly relevant for the classroom microenvironments. The identified specific indoor
sources of UFP and activities in the classrooms were: lighting of birthday candles; cleaning;
painting, arts and crafts activities using clay.
Regarding outdoor ambient concentration levels of UFP, schools located in urbanized areas
presented higher UFP number concentrations than the one in rural environment. Apart from
vehicular traffic emissions, farming and soil plowing activities on the neighboring farms
contributed to suspension of ultrafine particles in the rural school.
In all three schools mean I/O ratios of UFP were lower than 1. Therefore, outdoor emissions
were the main contributor of UFP concentrations observed indoors.
The levels of UFP highly varied between different indoor school micro-environments.
Classrooms were the micro-environments with lower mean UFP concentrations and their
location did not influence the observed levels. Cafeterias, on the other hand, exhibited the

78 CHAPTER 5
Indoor Ultrafine Particles: Evaluation of Pre-school Environments
highest recorded values of UFP mostly due to the cooking activities and use of fossil fuel-
powered ovens.
Urban schools presented higher exposure doses of UFP than in rural school. However,
accurate risk assessment of UFP that pre-school children are exposed to cannot be obtained at
this stage. The lowest tested dose of UFP reported to cause adverse health effects on people or
animals (loael) needs to be defined in order to properly assess the risks of UFP. In addition,
the risks that ultrafine particles pose to public health indicate the need of further monitoring
and regulation of this pollutant. Therefore, future guidelines on UFP for indoor air may
benefit from individual regulation for different existing micro-environments. This would be
particularly important for classrooms which are the micro-environments where pre-school
children spend most of their time at school.
The present work is one of the first studies on ultrafine particle concentrations in pre-school
environments conducted in Portugal. The assessment of UFP in these specific environments is
an important step in the direction of reducing public health risks. However, further
characterization of UFP in schools is essential in order to improve public health and child
overall life quality.
5.2 Future Perspectives
In order to improve this work, a higher number of schools, both in urban as well as rural
settings should be analyzed, which would guarantee a higher quality and representability of
the obtained data.
Further micro-environments should also be analyzed, such as libraries, hallways, music
rooms, etc.
The simultaneous study of other air quality parameters, such as carbon monoxide and dioxide
(CO and CO2), nitrogen and sulphur oxides (NOX and SO2), ozone (O3) and particulate matter
(PM10 and PM2.5) is also of importance, as it would allow one to correlate and determine
potential UFP sources and formation processes.
Stricter and more controlled studies could also be done for the identification of potential
indoor UFP sources associated with common practices and activities in schools. Factors such
as the distance to the source, climatic properties (temperature, relative humidity, precipitation,

Conclusions and Future Perspectives 79
Indoor Ultrafine Particles: Evaluation of Pre-school Environments
wind velocity and solar radiation) and building materials should also be analyzed regarding
concentration levels and behaviors.


APPENDIX


A. Micro-Environment Characterization
In order to better comprehend and correlate possible influential factors of one micro-
environment on its ultrafine particle number concentration levels, an extensive
characterization of each sampled micro-environment is presented.
A.1 Urban School 1
The following micro-environments properties’ for US1 are presented in this sub-chapter.
A.1.1 0 Floor Classroom
Table 1 – Relevant 0 Floor Classroom properties.
Total Room Volume (m3) 138.5
Total Room Surface (m2) 193.8
Ventilation (Natural / Forced) Natural
Heating Systems (Existent / Nonexistent) Nonexistent
Room Height (m) 2.25
Main Materials Plastic, Wood, Wall
Floor Coating Plastic (PVC)
Wall Coating White Paint and blackboard
Ceiling Coating White Paint
Door Surface (m2) 3.3
Type of Door Double door, wood and glass
Doors Number 1
Window Surface (m2) 2.3

A –2
Indoor Ultrafine Particles: Evaluation of Pre-school Environments
Type of Window One glass layer and wood
Windows Number 7
Average Temperature (± SD) (ºC) 19.2 (± 0.3)
Average Relative Air Humidity (%) 44.3 (± 3.8)
Daily Sampling Period 08:30 to 17:30
Sampling Dates 29-04-2013 and 30-04-2013
Distance from sampling point to main exit
(m) 5.45
Figure 1 – 0 Floor Classroom estimated blueprint.
× Sampling Point Location

Micro-Environment Characterization A –3
Indoor Ultrafine Particles: Evaluation of Pre-school Environments
Figure 2 – 0 Floor Classroom (1).
Figure 3 – 0 Floor Classroom (2).
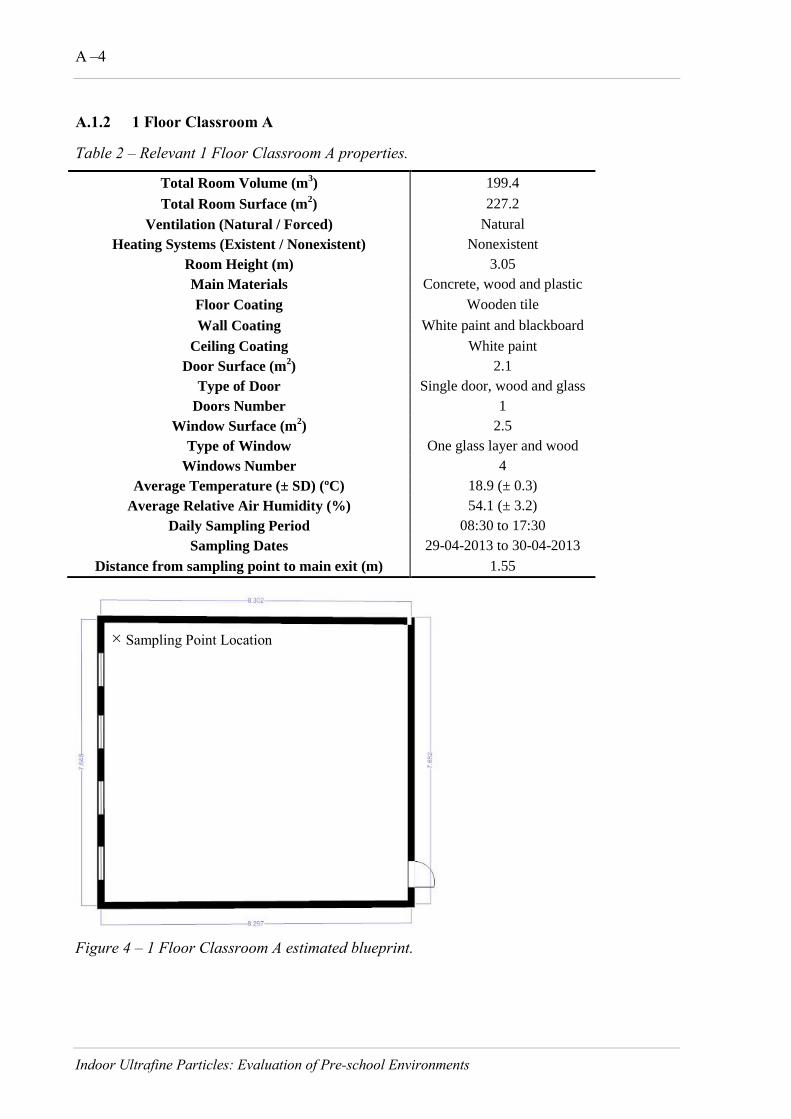
A –4
Indoor Ultrafine Particles: Evaluation of Pre-school Environments
A.1.2 1 Floor Classroom A
Table 2 – Relevant 1 Floor Classroom A properties.
Total Room Volume (m3) 199.4
Total Room Surface (m2) 227.2
Ventilation (Natural / Forced) Natural
Heating Systems (Existent / Nonexistent) Nonexistent
Room Height (m) 3.05
Main Materials Concrete, wood and plastic
Floor Coating Wooden tile
Wall Coating White paint and blackboard
Ceiling Coating White paint
Door Surface (m2) 2.1
Type of Door Single door, wood and glass
Doors Number 1
Window Surface (m2) 2.5
Type of Window One glass layer and wood
Windows Number 4
Average Temperature (± SD) (ºC) 18.9 (± 0.3)
Average Relative Air Humidity (%) 54.1 (± 3.2)
Daily Sampling Period 08:30 to 17:30
Sampling Dates 29-04-2013 to 30-04-2013
Distance from sampling point to main exit (m) 1.55
Figure 4 – 1 Floor Classroom A estimated blueprint.
× Sampling Point Location

Micro-Environment Characterization A –5
Indoor Ultrafine Particles: Evaluation of Pre-school Environments
Figure 5 – 1 Floor Classroom A.
A.1.3 1 Floor Classroom B
Table 3 – Relevant 1 Floor Classroom B properties.
Total Room Volume (m3) 165.6
Total Room Surface (m2) 194.1
Ventilation (Natural / Forced) Natural
Heating Systems (Existent / Nonexistent) Nonexistent
Room Height (m) 3.35
Main Materials Concrete, wood and plastic
Floor Coating Wooden tile and carpets
Wall Coating White paint and blackboard
Ceiling Coating White paint
Door Surface (m2) 2.0
Doors Number 1
Type of Door Single, wood and glass
Window Surface (m2) 2.9
Windows Number 3
Type of Window Single glass layer and wood
Average Temperature (± SD) (ºC) 20.6 (± 1.7)
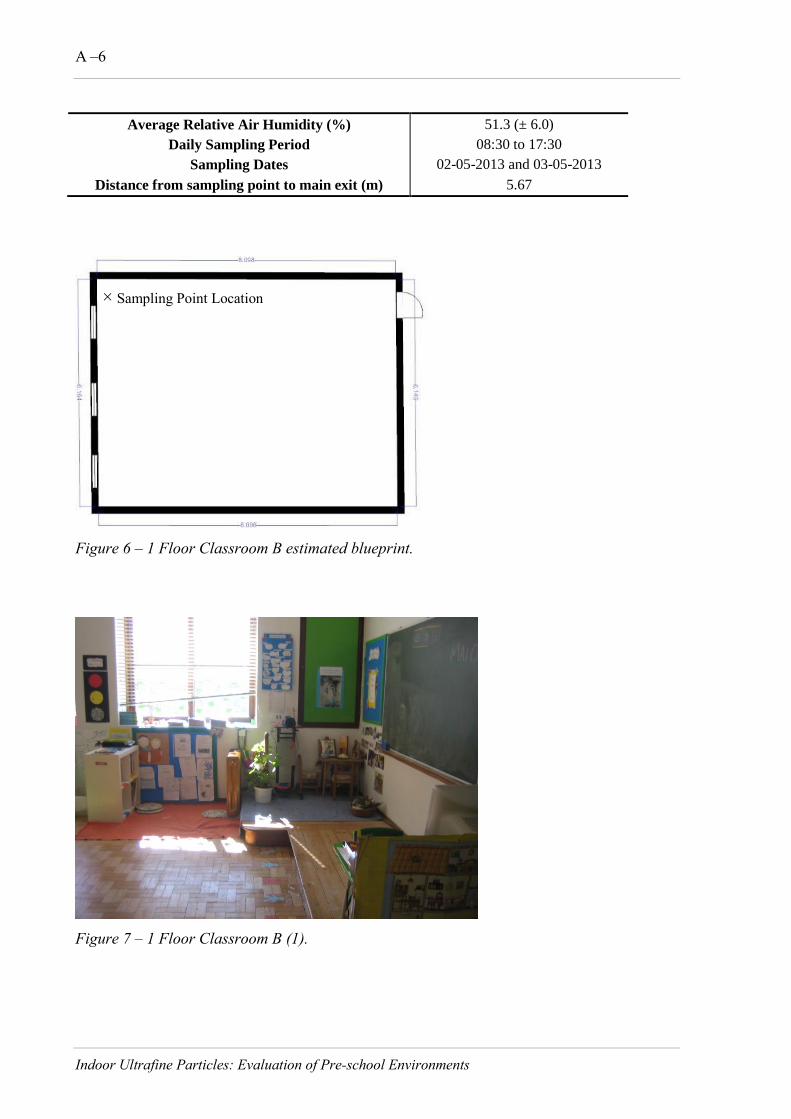
A –6
Indoor Ultrafine Particles: Evaluation of Pre-school Environments
Average Relative Air Humidity (%) 51.3 (± 6.0)
Daily Sampling Period 08:30 to 17:30
Sampling Dates 02-05-2013 and 03-05-2013
Distance from sampling point to main exit (m) 5.67
Figure 6 – 1 Floor Classroom B estimated blueprint.
Figure 7 – 1 Floor Classroom B (1).
× Sampling Point Location
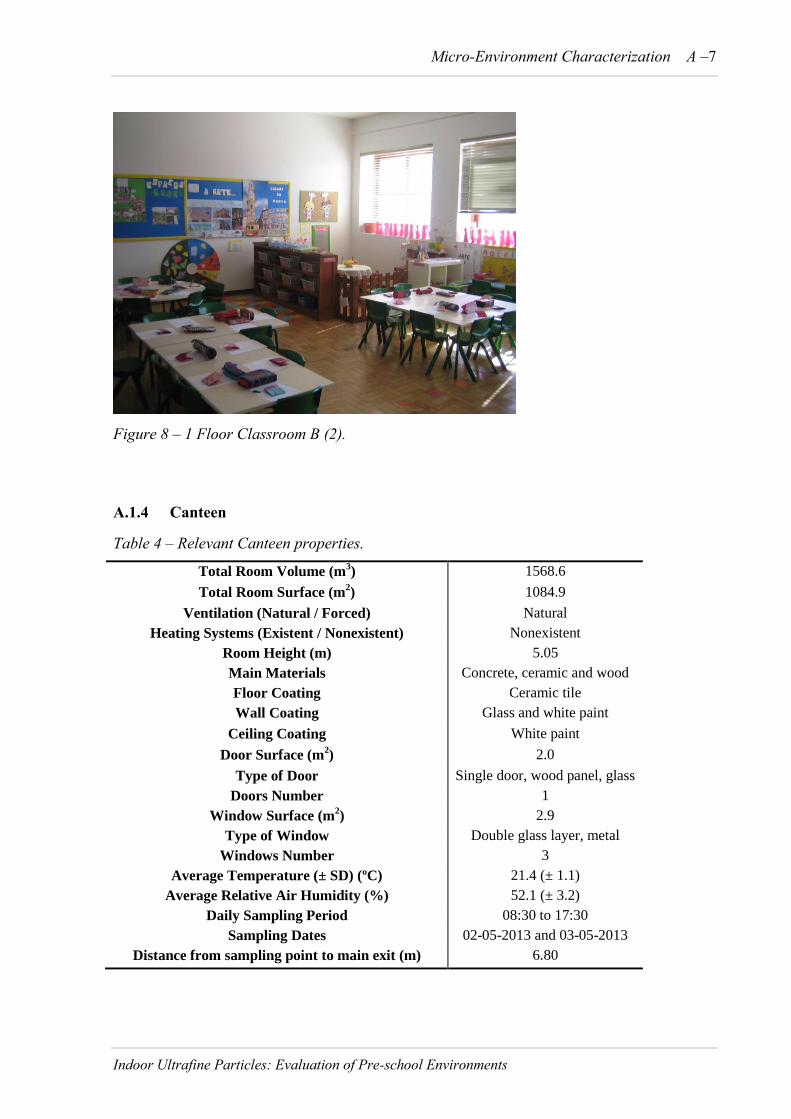
Micro-Environment Characterization A –7
Indoor Ultrafine Particles: Evaluation of Pre-school Environments
Figure 8 – 1 Floor Classroom B (2).
A.1.4 Canteen
Table 4 – Relevant Canteen properties.
Total Room Volume (m3) 1568.6
Total Room Surface (m2) 1084.9
Ventilation (Natural / Forced) Natural
Heating Systems (Existent / Nonexistent) Nonexistent
Room Height (m) 5.05
Main Materials Concrete, ceramic and wood
Floor Coating Ceramic tile
Wall Coating Glass and white paint
Ceiling Coating White paint
Door Surface (m2) 2.0
Type of Door Single door, wood panel, glass
Doors Number 1
Window Surface (m2) 2.9
Type of Window Double glass layer, metal
Windows Number 3
Average Temperature (± SD) (ºC) 21.4 (± 1.1)
Average Relative Air Humidity (%) 52.1 (± 3.2)
Daily Sampling Period 08:30 to 17:30
Sampling Dates 02-05-2013 and 03-05-2013
Distance from sampling point to main exit (m) 6.80
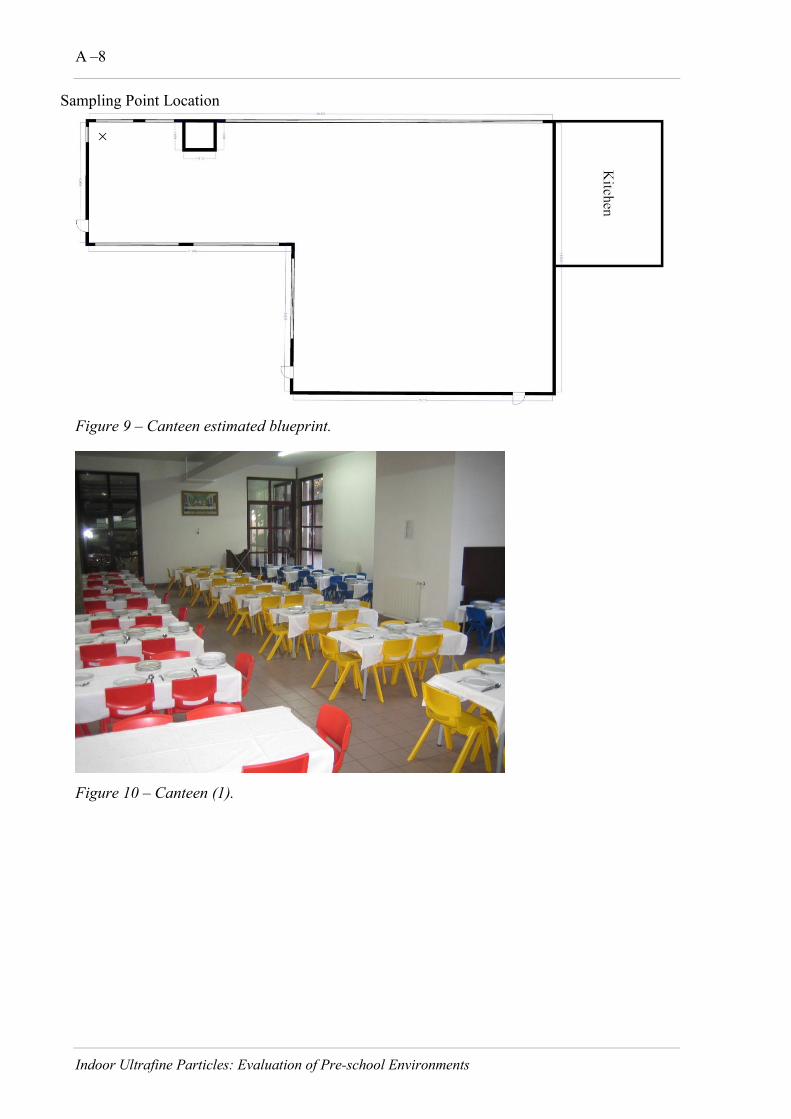
A –8
Indoor Ultrafine Particles: Evaluation of Pre-school Environments
Figure 9 – Canteen estimated blueprint.
Figure 10 – Canteen (1).
Sampling Point Location
×

Micro-Environment Characterization A –9
Indoor Ultrafine Particles: Evaluation of Pre-school Environments
Figure 11 - Canteen (2).
A.1.5 Playroom
Table 5 – Relevant Playroom properties.
Total Room Volume (m3) 291.5
Total Room Surface (m2) 320.2
Ventilation (Natural / Forced) Natural
Heating Systems (Existent / Nonexistent) Nonexistent
Room Height (m) 2.90
Main Materials Concrete, plastic and wood
Floor Coating Plastic (PVC)
Wall Coating White paint
Ceiling Coating White paint
Door Surface (m2) 4.1
Doors Number 2
Door Type Double, wood and glass
Window A Surface (m2) 2.0
Windows A Number 5
Type of Window Single glass layer, wood
Window B Surface (m2) 3.7
Windows B Number 5.5
Type of Window Single glass layer, wood
Average Temperature (± SD) (ºC) 20.8 (± 0.7)
Average Relative Air Humidity (%) 55.6 (± 2.7)
Daily Sampling Period 08:30 to 17:30

A –10
Indoor Ultrafine Particles: Evaluation of Pre-school Environments
Sampling Dates 19-04-2013 to 26-04-2013
Distance from sampling point to main exit (m) 6.57
Figure 12 – Playroom estimated blueprint.
Figure 13 – Playroom (1).
× Sampling Point Location
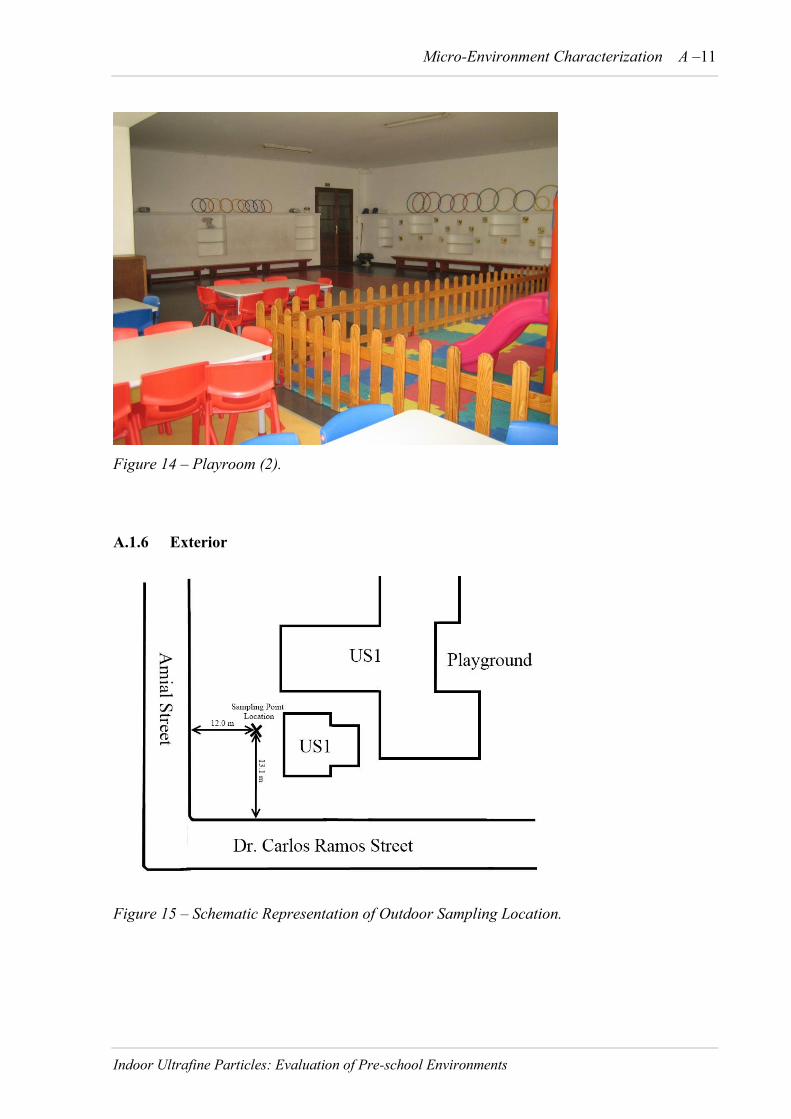
Micro-Environment Characterization A –11
Indoor Ultrafine Particles: Evaluation of Pre-school Environments
Figure 14 – Playroom (2).
A.1.6 Exterior
Figure 15 – Schematic Representation of Outdoor Sampling Location.

A –12
Indoor Ultrafine Particles: Evaluation of Pre-school Environments
Figure 16 – Exterior (1).
A.2 Urban School 2
A.1.7 0 Floor Classroom
Table 6 – Relevant 0 Floor Classroom properties.
Total Room Volume (m3) 126.4
Total Room Surface (m2) 163.3
Ventilation (Natural / Forced) Natural
Heating Systems (Existent / Nonexistent) Nonexistent
Room Height (m) 3.60
Main Materials Concrete, wood and plastic
Floor Coating Wooden tile and blackboard
Wall Coating Green and white paint
Ceiling Coating Plaster
Door Surface (m2) 4.1
Doors Number 2
Type of Door Double, wood
Window Surface (m2) 2.2
Windows Number 4
Type of Window Double, wood and glass
Average Temperature (± SD) (ºC) 20.6 (± 0.9)
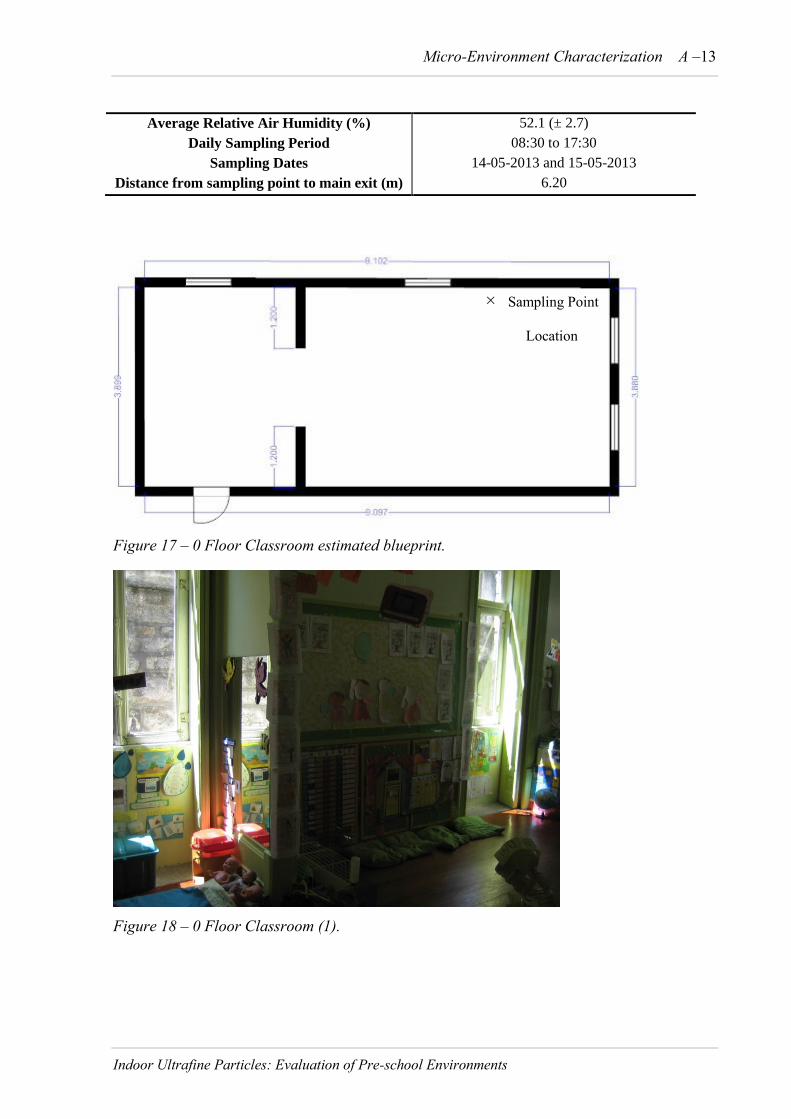
Micro-Environment Characterization A –13
Indoor Ultrafine Particles: Evaluation of Pre-school Environments
Average Relative Air Humidity (%) 52.1 (± 2.7)
Daily Sampling Period 08:30 to 17:30
Sampling Dates 14-05-2013 and 15-05-2013
Distance from sampling point to main exit (m) 6.20
Figure 17 – 0 Floor Classroom estimated blueprint.
Figure 18 – 0 Floor Classroom (1).
× Sampling Point
Location
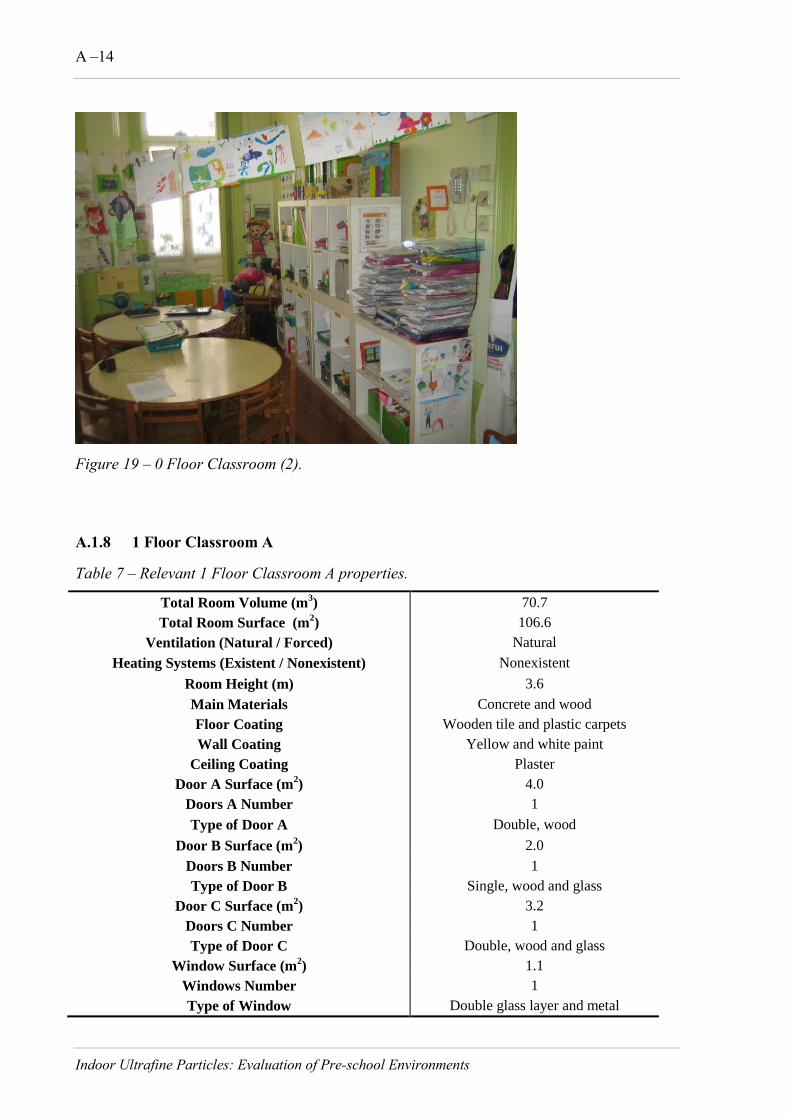
A –14
Indoor Ultrafine Particles: Evaluation of Pre-school Environments
Figure 19 – 0 Floor Classroom (2).
A.1.8 1 Floor Classroom A
Table 7 – Relevant 1 Floor Classroom A properties.
Total Room Volume (m3) 70.7
Total Room Surface (m2) 106.6
Ventilation (Natural / Forced) Natural
Heating Systems (Existent / Nonexistent) Nonexistent
Room Height (m) 3.6
Main Materials Concrete and wood
Floor Coating Wooden tile and plastic carpets
Wall Coating Yellow and white paint
Ceiling Coating Plaster
Door A Surface (m2) 4.0
Doors A Number 1
Type of Door A Double, wood
Door B Surface (m2) 2.0
Doors B Number 1
Type of Door B Single, wood and glass
Door C Surface (m2) 3.2
Doors C Number 1
Type of Door C Double, wood and glass
Window Surface (m2) 1.1
Windows Number 1
Type of Window Double glass layer and metal

Micro-Environment Characterization A –15
Indoor Ultrafine Particles: Evaluation of Pre-school Environments
Average Temperature (± SD) (ºC) 22.7 (± 1.0)
Average Relative Air Humidity (%) 46.1 (± 2.3)
Daily Sampling Period 08:30 to 17:30
Sampling Dates 14-05-2013 and 15-05-2013
Distance from sampling point to main exit (m) 3.60
Figure 20 – 1 Floor Classroom A estimated blueprints.
Figure 21 – 1 Floor Classroom A (1).
×
Sampling Point Location

A –16
Indoor Ultrafine Particles: Evaluation of Pre-school Environments
Figure 22 – 1 Floor Classroom A (2).
Figure 23 – 1 Floor Classroom A (3).

Micro-Environment Characterization A –17
Indoor Ultrafine Particles: Evaluation of Pre-school Environments
A.1.9 1 Floor Classroom B
Table 8 – Relevant 1 Floor Classroom B properties.
Total Room Volume (m3) 116.8
Total Room Surface (m2) 181.0
Ventilation (Natural / Forced) Natural
Heating Systems (Existent / Nonexistent) Existent (but not used during sampling period)
Room Height (m) 3.60
Main Materials Concrete, wood and plastic
Floor Coating Wooden tile and plastic carpets
Wall Coating Pink and white paint
Ceiling Coating Plaster
Door Surface (m2) 4.2
Doors Number 2
Type of Door Double, wood
Window Surface 3.7
Windows Number 5
Type of Window Single glass layer and wood
Average Temperature (± SD) (ºC) 20.7 (± 0.6)
Average Relative Air Humidity (%) 47.1 (± 3.4)
Daily Sampling Period 08:30 to 17:30
Sampling Dates 16-05-2013 and 17-05-2013
Distance from sampling point to main exit
(m)
1.25
Figure 24 – 1 Floor Classroom B estimated blueprints.
× Sampling Point Location

A –18
Indoor Ultrafine Particles: Evaluation of Pre-school Environments
Figure 25 – 1 Floor Classroom B (1).
Figure 26 – 1 Floor Classroom B (2).
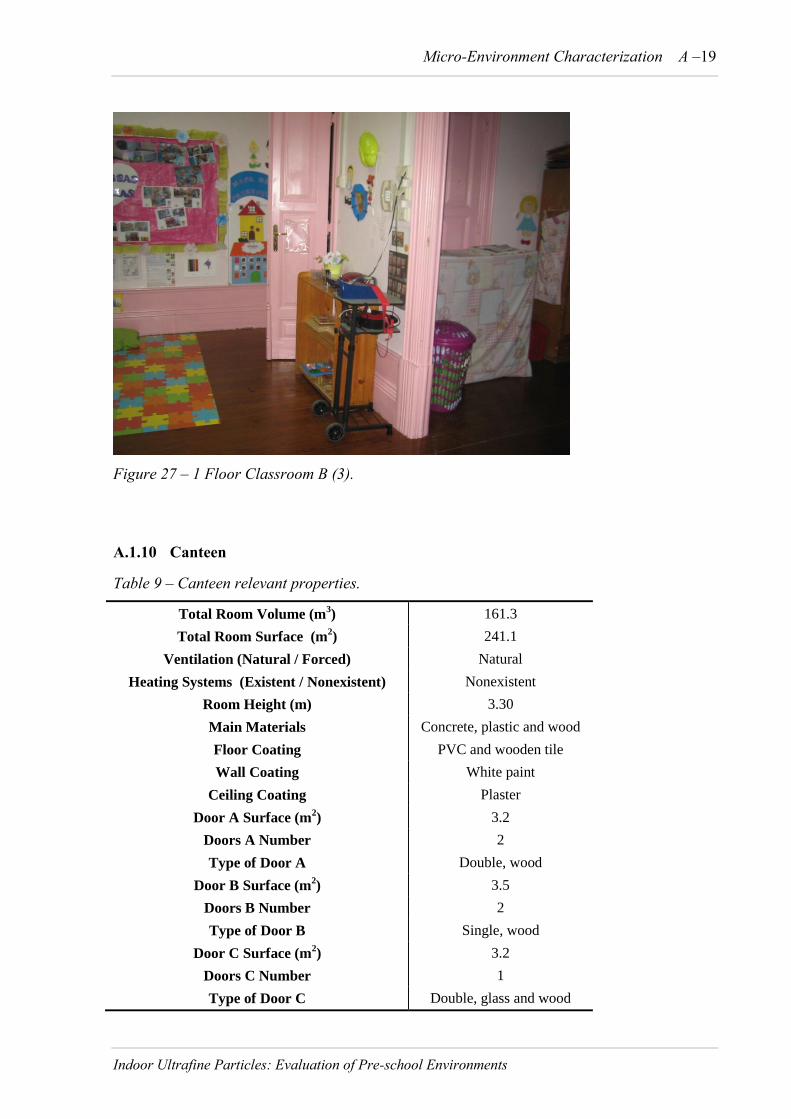
Micro-Environment Characterization A –19
Indoor Ultrafine Particles: Evaluation of Pre-school Environments
Figure 27 – 1 Floor Classroom B (3).
A.1.10 Canteen
Table 9 – Canteen relevant properties.
Total Room Volume (m3) 161.3
Total Room Surface (m2) 241.1
Ventilation (Natural / Forced) Natural
Heating Systems (Existent / Nonexistent) Nonexistent
Room Height (m) 3.30
Main Materials Concrete, plastic and wood
Floor Coating PVC and wooden tile
Wall Coating White paint
Ceiling Coating Plaster
Door A Surface (m2) 3.2
Doors A Number 2
Type of Door A Double, wood
Door B Surface (m2) 3.5
Doors B Number 2
Type of Door B Single, wood
Door C Surface (m2) 3.2
Doors C Number 1
Type of Door C Double, glass and wood
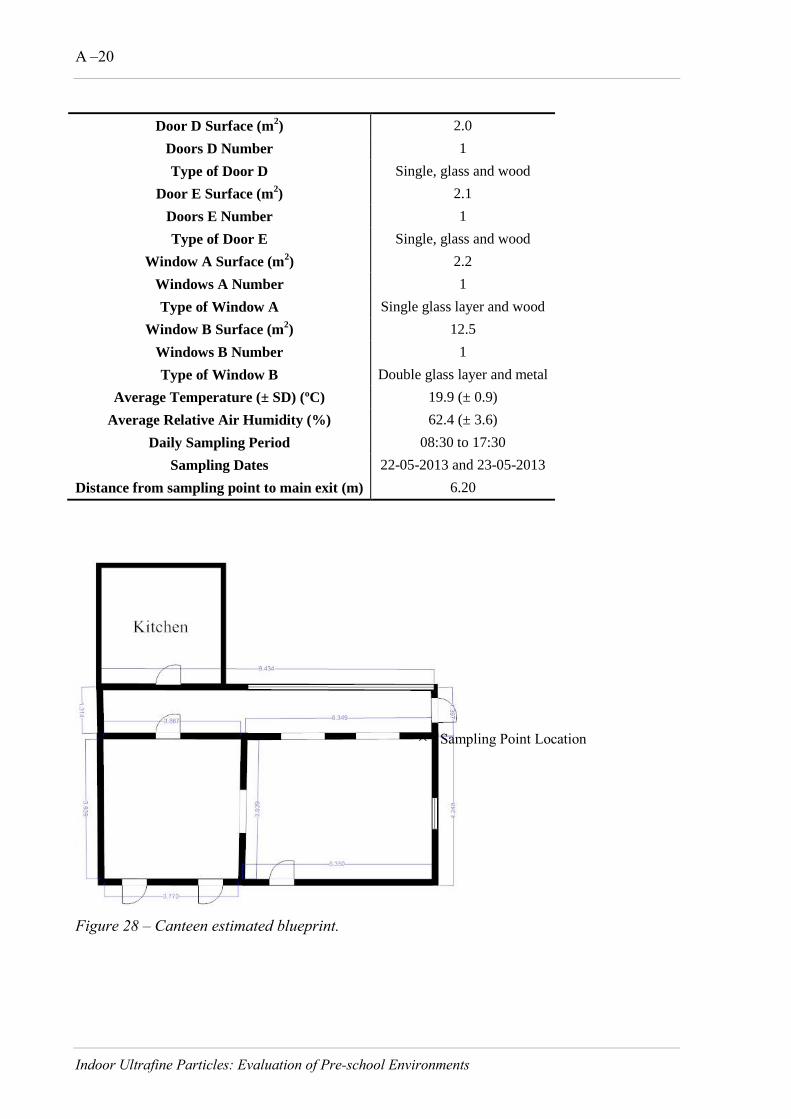
A –20
Indoor Ultrafine Particles: Evaluation of Pre-school Environments
Door D Surface (m2) 2.0
Doors D Number 1
Type of Door D Single, glass and wood
Door E Surface (m2) 2.1
Doors E Number 1
Type of Door E Single, glass and wood
Window A Surface (m2) 2.2
Windows A Number 1
Type of Window A Single glass layer and wood
Window B Surface (m2) 12.5
Windows B Number 1
Type of Window B Double glass layer and metal
Average Temperature (± SD) (ºC) 19.9 (± 0.9)
Average Relative Air Humidity (%) 62.4 (± 3.6)
Daily Sampling Period 08:30 to 17:30
Sampling Dates 22-05-2013 and 23-05-2013
Distance from sampling point to main exit (m) 6.20
Figure 28 – Canteen estimated blueprint.
× Sampling Point Location

Micro-Environment Characterization A –21
Indoor Ultrafine Particles: Evaluation of Pre-school Environments
Figure 29 – Canteen (1).
Figure 30 – Canteen (2).

A –22
Indoor Ultrafine Particles: Evaluation of Pre-school Environments
Figure 31 – Canteen (3).
Figure 32 – Canteen (4).
A.1.11 Gymnasium
Table 10 – Gymnasium relevant properties.
Total Room Volume (m3) 165.6
Total Room Surface (m2) 208.2
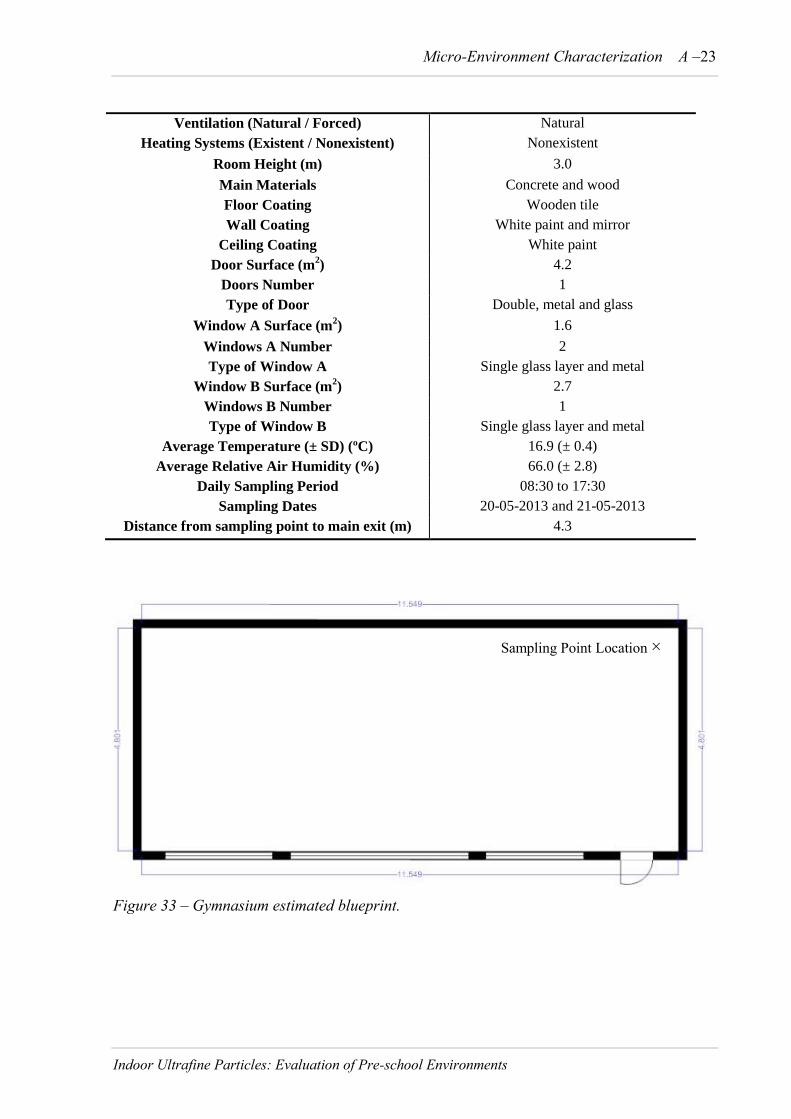
Micro-Environment Characterization A –23
Indoor Ultrafine Particles: Evaluation of Pre-school Environments
Ventilation (Natural / Forced) Natural
Heating Systems (Existent / Nonexistent) Nonexistent
Room Height (m) 3.0
Main Materials Concrete and wood
Floor Coating Wooden tile
Wall Coating White paint and mirror
Ceiling Coating White paint
Door Surface (m2) 4.2
Doors Number 1
Type of Door Double, metal and glass
Window A Surface (m2) 1.6
Windows A Number 2
Type of Window A Single glass layer and metal
Window B Surface (m2) 2.7
Windows B Number 1
Type of Window B Single glass layer and metal
Average Temperature (± SD) (ºC) 16.9 (± 0.4)
Average Relative Air Humidity (%) 66.0 (± 2.8)
Daily Sampling Period 08:30 to 17:30
Sampling Dates 20-05-2013 and 21-05-2013
Distance from sampling point to main exit (m) 4.3
Figure 33 – Gymnasium estimated blueprint.
Sampling Point Location ×

A –24
Indoor Ultrafine Particles: Evaluation of Pre-school Environments
Figure 34 – Gymnasium (1).
Figure 35 – Gymnasium (2).
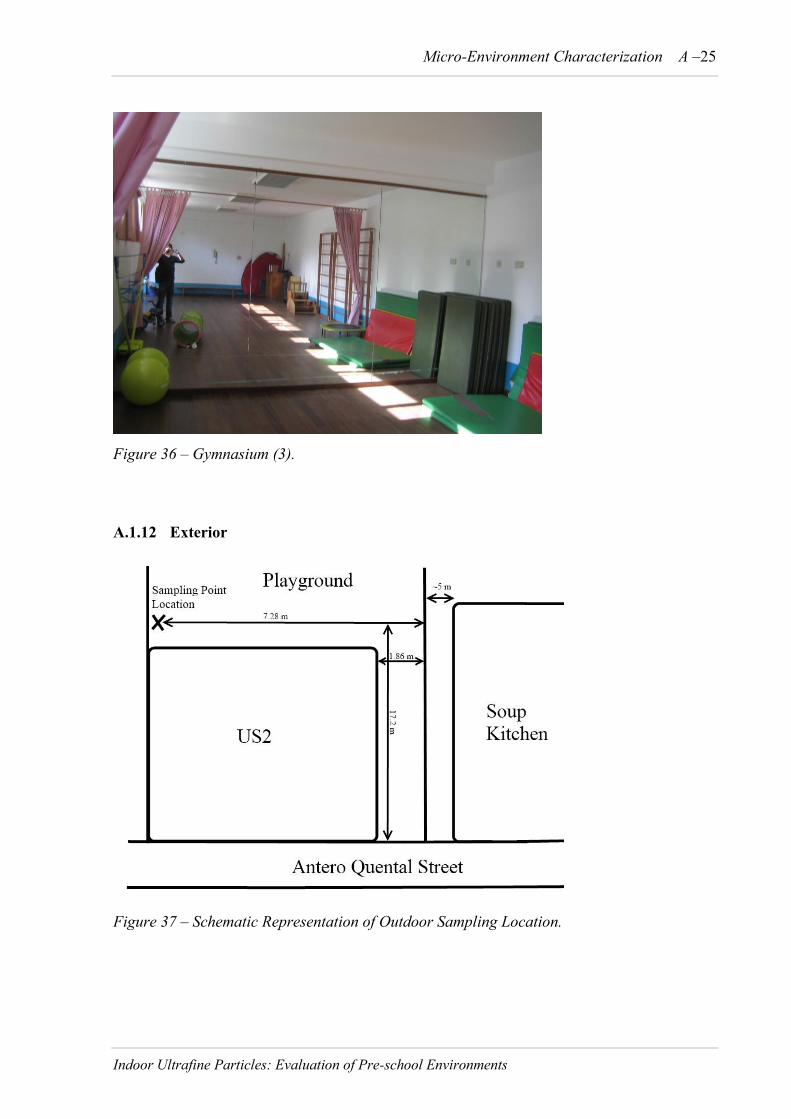
Micro-Environment Characterization A –25
Indoor Ultrafine Particles: Evaluation of Pre-school Environments
Figure 36 – Gymnasium (3).
A.1.12 Exterior
Figure 37 – Schematic Representation of Outdoor Sampling Location.

A –26
Indoor Ultrafine Particles: Evaluation of Pre-school Environments
Figure 38 – Exterior (1).
Figure 39 – Exterior (2).

Micro-Environment Characterization A –27
Indoor Ultrafine Particles: Evaluation of Pre-school Environments
Figure 40 – Exterior (3).
A.3 Rural School 1
A.1.13 0 Floor Classroom
Table 11 – 0 Floor Classroom relevant properties.
Total Room Volume (m3) 124.7
Total Room Surface (m2) 167.9
Ventilation (Natural / Forced) Natural
Heating Systems (Existent / Nonexistent) Non Existent
Room Height (m) 2.55
Main Materials Concrete, wood and plastic
Floor Coating Wooden tile
Wall Coating White paint and blackboard
Ceilling Coating Cork
Door Surface (m2) 2.0
Doors Number 1
Type of Door Single, wood
Window Surface(m2) 4.6
Windows Number 3
Type of Window Double glass layer and metal
Average Temperature (± SD) (ºC) 22.5 (± 1.0)
Average Relative Air Humidity (%) 64.0 (± 3.8)
Daily Sampling Period 09:00 to 17:30

A –28
Indoor Ultrafine Particles: Evaluation of Pre-school Environments
Sampling Dates 06-06-2013 to 13-06-2013
Distance from sampling point to main exit (m) 3.80
Figure 41 – 0 Floor Classroom estimated blueprint.
Figure 42 – 0 Floor Classroom (1).
× Sampling Point Location

Micro-Environment Characterization A –29
Indoor Ultrafine Particles: Evaluation of Pre-school Environments
Figure 43 – 0 Floor Classroom (2).
A.1.14 1 Floor Classroom
Table 12 – 1 Floor Classroom relevant properties.
Total Room Volume (m3) 134.2
Total Room Surface (m2) 173.6
Ventilation (Natural / Forced) Natural
Heating Systems (Existent / Nonexistent) No
Room Height (m) 2.71
Main Materials Concrete, wood and plastic
Floor Coating Wooden tile
Wall Coating White paint and blackboard
Ceilling Coating Cork
Door Surface (m2) 1.6
Doors Number 1
Type of Door Wood, Single
Window Surface (m2) 4.6
Windows Number 3
Type of Window Double glass layer and metal
Average Temperature (± SD) (ºC) 23.2 (± 0.8)
Average Relative Air Humidity (%) 55.5 (± 4.4)
Daily Sampling Period 09:00 to 17:30
Sampling Dates 06-06-2013 and 07-06-2013
Distance from sampling point to main exit (m) 6.84

A –30
Indoor Ultrafine Particles: Evaluation of Pre-school Environments
Figure 44 – 1 Floor Classroom estimated blueprint.
Figure 45 – 1 Floor Classroom (1).
× Sampling Point Location

Micro-Environment Characterization A –31
Indoor Ultrafine Particles: Evaluation of Pre-school Environments
Figure 46 – 1 Floor Classroom (2).
Figure 47 – 1 Floor Classroom (3).
A.1.15 Canteen
Table 13 – Canteen relevant properties.
Total Room Volume (m3) 504.6
Total Room Surface (m2) 352.4
Ventilation (Natural / Forced) Natural
Heating Systems (Existent / Nonexistent) Nonexistent
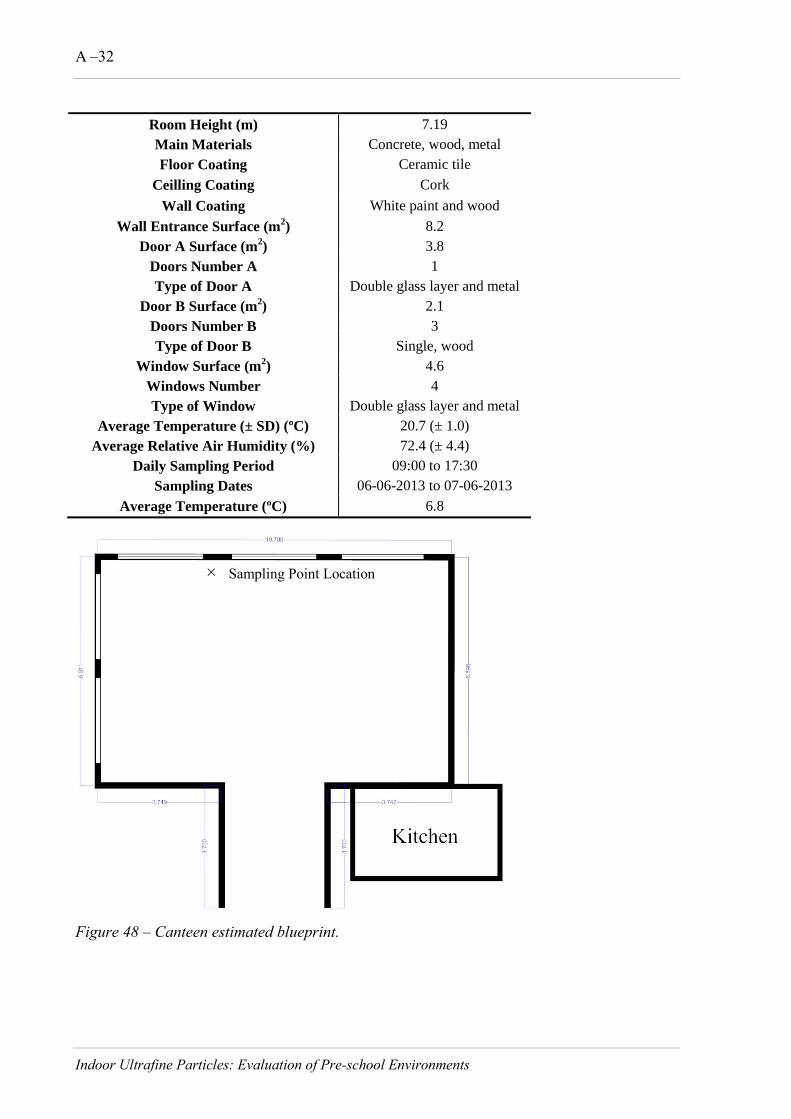
A –32
Indoor Ultrafine Particles: Evaluation of Pre-school Environments
Room Height (m) 7.19
Main Materials Concrete, wood, metal
Floor Coating Ceramic tile
Ceilling Coating Cork
Wall Coating White paint and wood
Wall Entrance Surface (m2) 8.2
Door A Surface (m2) 3.8
Doors Number A 1
Type of Door A Double glass layer and metal
Door B Surface (m2) 2.1
Doors Number B 3
Type of Door B Single, wood
Window Surface (m2) 4.6
Windows Number 4
Type of Window Double glass layer and metal
Average Temperature (± SD) (ºC) 20.7 (± 1.0)
Average Relative Air Humidity (%) 72.4 (± 4.4)
Daily Sampling Period 09:00 to 17:30
Sampling Dates 06-06-2013 to 07-06-2013
Average Temperature (ºC) 6.8
Figure 48 – Canteen estimated blueprint.
× Sampling Point Location

Micro-Environment Characterization A –33
Indoor Ultrafine Particles: Evaluation of Pre-school Environments
Figure 49 – Canteen (1).
Figure 50 – Canteen (2).
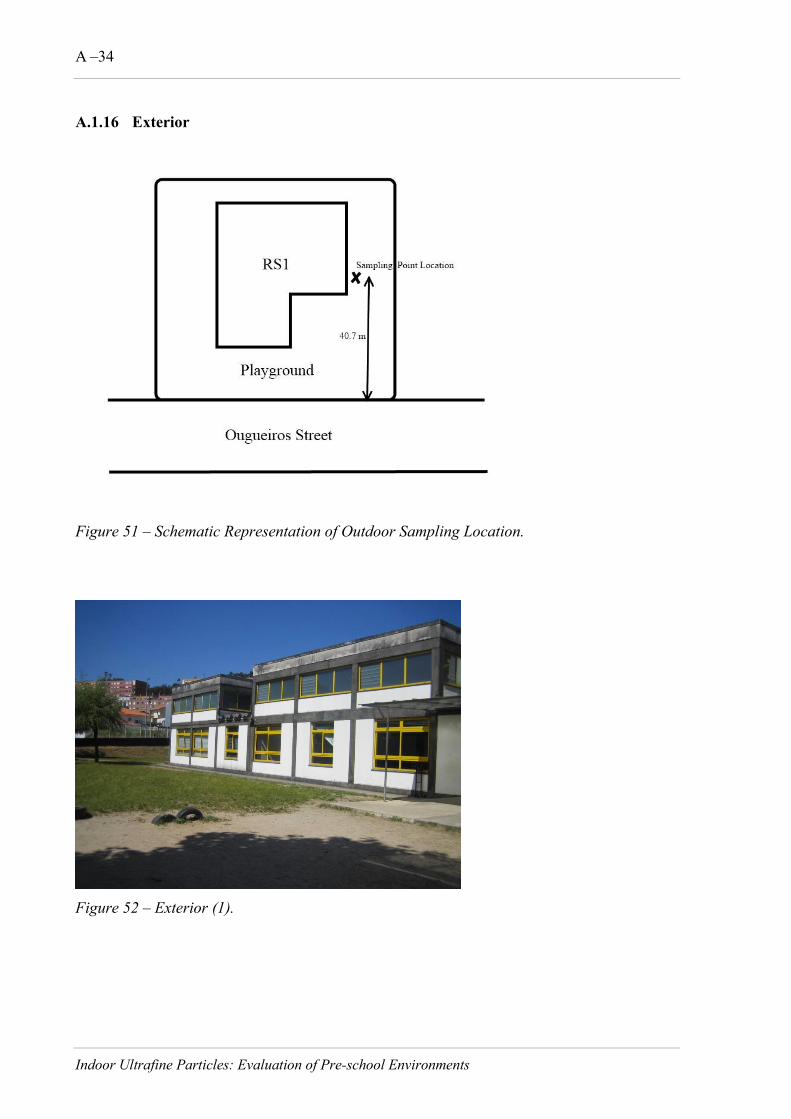
A –34
Indoor Ultrafine Particles: Evaluation of Pre-school Environments
A.1.16 Exterior
Figure 51 – Schematic Representation of Outdoor Sampling Location.
Figure 52 – Exterior (1).
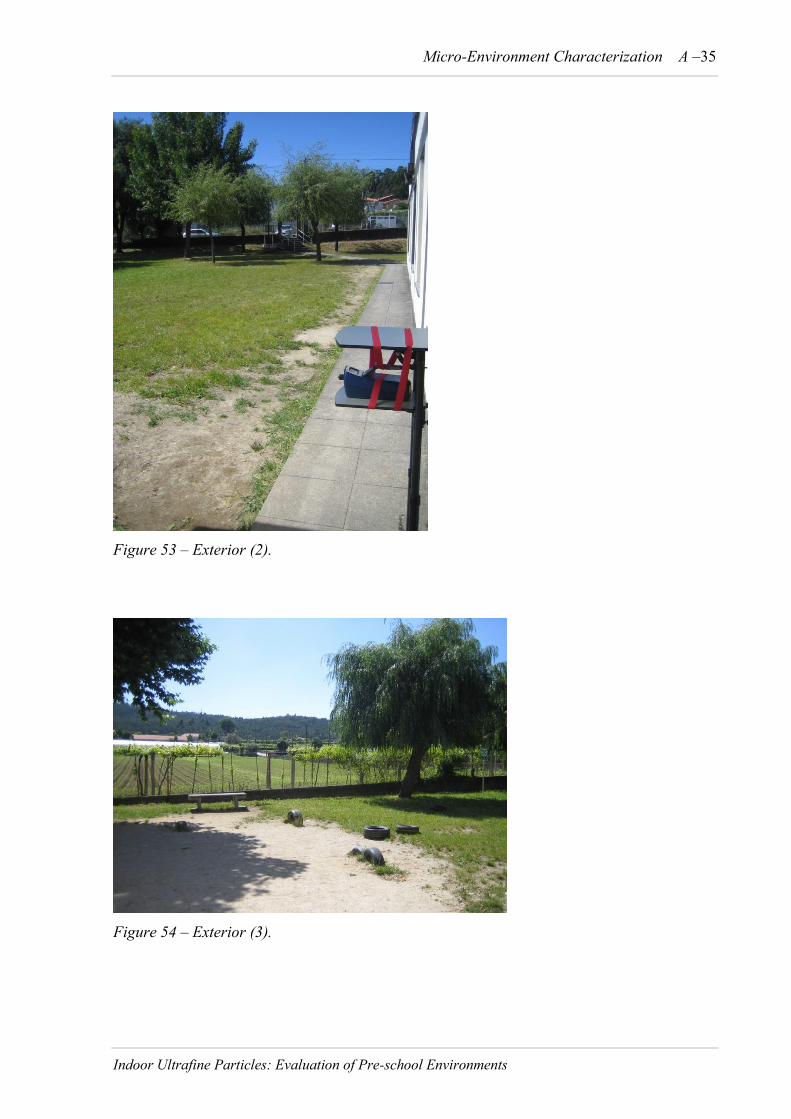
Micro-Environment Characterization A –35
Indoor Ultrafine Particles: Evaluation of Pre-school Environments
Figure 53 – Exterior (2).
Figure 54 – Exterior (3).