Integrated Formation Evaluation using the TechlogPlatform ...
20
Integrated Formation Evaluation using the Techlog Platform in a Complex Clastic Reservoir Zhandos Zhangaziyev Petrophysicist Dragon Oil
Transcript of Integrated Formation Evaluation using the TechlogPlatform ...
Integrated Formation Evaluation using the Techlog Platform in a Complex Clastic Reservoir
Zhandos ZhangaziyevPetrophysicistDragon Oil

Agenda
• Formation evaluation with LWD / WL logging methods
• Fluid typing with Modular Dynamic Tester / NMR fluid mapping
• Well correlation in compartmentalized environment
• Pore Pressure regimes determination using OH logs
• Geomechanics / Acoustics
• Summary

Open hole logging (Logging while drilling)
Interpretation output
• CPI interpretation
Shale volume
Porosity
Water saturation
• Borehole image interpretation
(structural)
• Formation Sigma
• Spectroscopy
• Well correlation
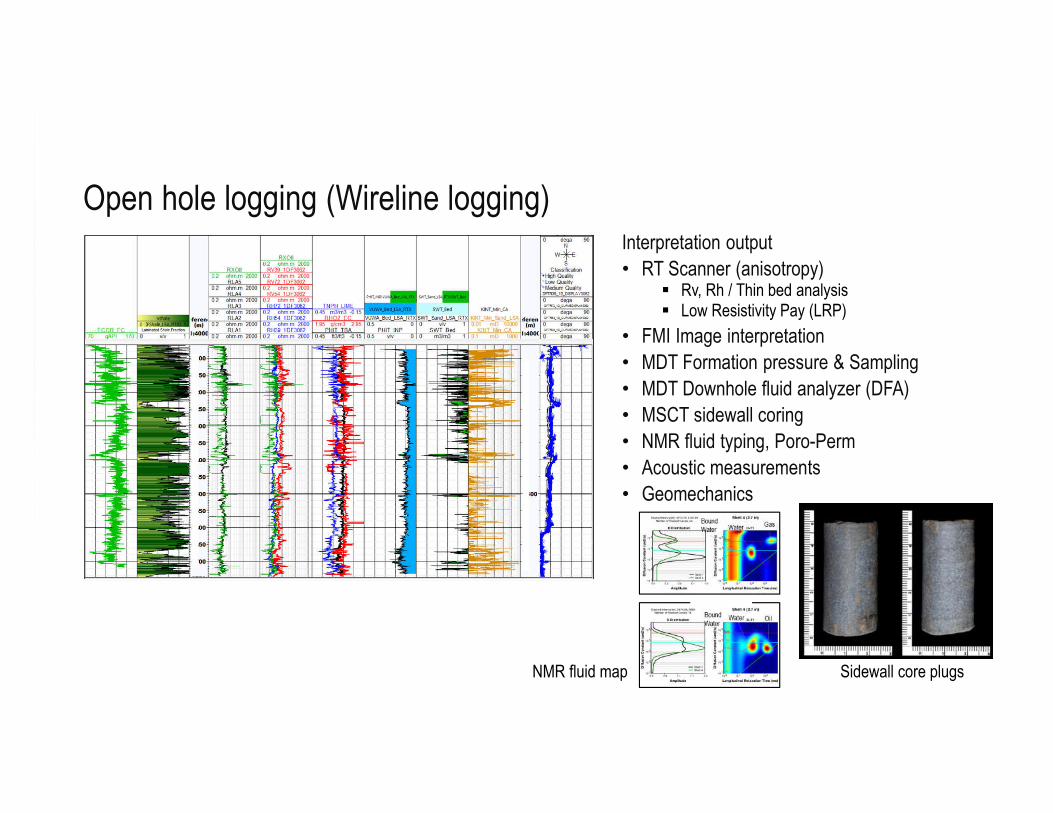
Open hole logging (Wireline logging)Interpretation output
• RT Scanner (anisotropy) Rv, Rh / Thin bed analysis Low Resistivity Pay (LRP)
• FMI Image interpretation
• MDT Formation pressure & Sampling
• MDT Downhole fluid analyzer (DFA)
• MSCT sidewall coring
• NMR fluid typing, Poro-Perm
• Acoustic measurements
• Geomechanics
NMR fluid map Sidewall core plugs

Integrated formation evaluation using LWD & Wireline data
Fluid typing with Modular Dynamic Tester / NMR fluid mapping

Difficulty of Gas vs Oil differentiation in shaly sand environment
• Challenge:
High clay content masks the conventional density-neutron crossover
Possible solutions:
Formation tester (DFA)
NMR fluid typing
PLT
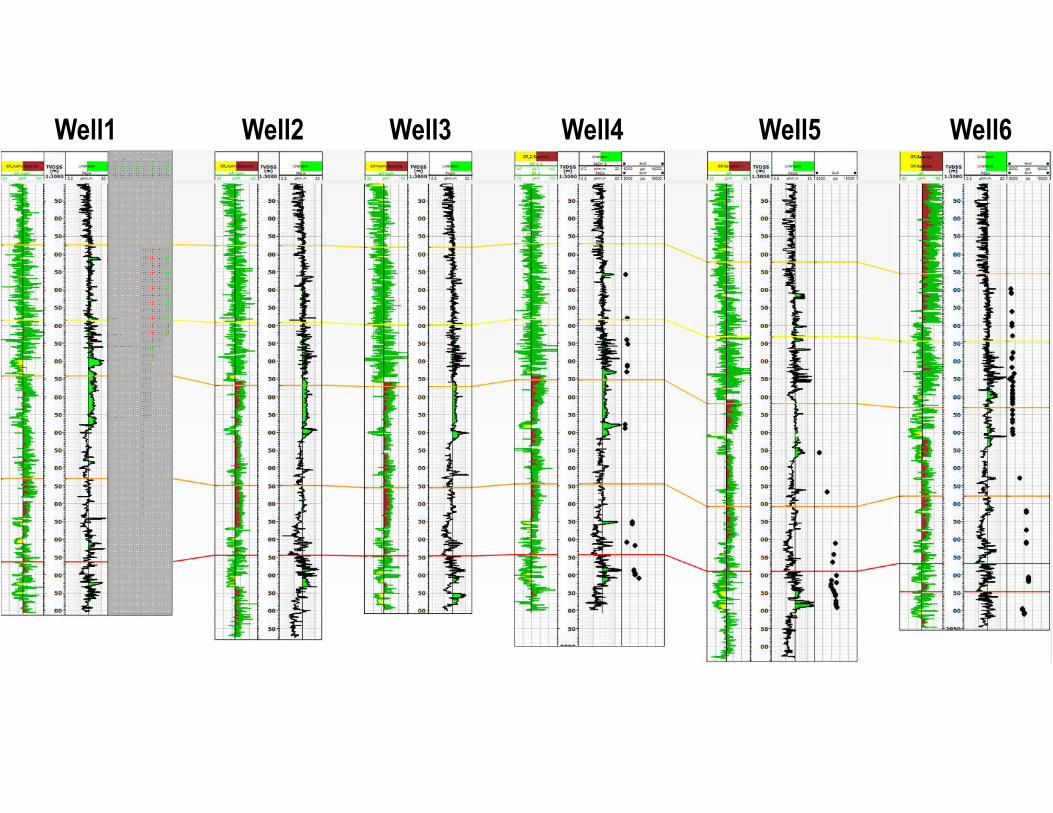
Well1 Well2 Well3 Well4 Well5 Well6

Well1 Well2 Well3 Well4 Well5 Well6
oil
oiloiloiloiloil
GasCond.
gas Cond.GOR~ 15,000gas
gasgasGOR~40,000
gas
MDT CFA (Compositional Fluid Analyzer)

Well correlation in compartmentalized / faulted environment

=
Repeat section was observed on OH logs confirmed by density image interpretation and pore pressures

• 30m drag
• Logs response (minor density and neutron, resistivity) change along fault formation displacement along fault
• Small washout as indirect fault sign. Usually formation is damaged (can be breccia) near fault easier to be washed out
• Pore pressure results are different in the repeat section
Reverse faults were identified from LWD image interpretation

FMI Image interpretation
Fault interpretation (NNE-SSE strike):
• Drag (red arrow)
• Fracturing
• Tool severe sticking in washouts along fault zone possibly due to tectonic damaged rocks
• High dip angles of bed boundaries

Well1 Well2 Well3 Well4 Well5

Pore pressure regime identification

Well1 Well2 Well3 Well4 Well5 Well6

Two pressure regimes observed on Resistivity - Sonic logs and confirmed by pressure data
I
II II II
I I
Well1 Well2 Well3 Well4 Well5 Well6

Resistivity and Sonic data have been used to generate pre-production Pore Pressure Profiles (shale points)
Sonic Resistivity

Compressional and Shear processing
Shear Anisotropy analysis
Shear Radial Variation Profiling
3D Anisotropy analysisCompressional from
MonopoleShear from X/Y Dipoles
Acoustic processing on Techlog platform

Summary
TECHLOG platform is used in multiple log interpretation:
• Real time LWD log interpretation
• Wireline log interpretation (Open hole and Cased hole)
• Well log correlation panel
• Formation tester analysis (pretest, DFA, sampling, VIT)
• NMR analysis
• Image interpretation (LWD density image and FMI images)
• Fault identification using OH logs and image data
• Geomechanics / Acoustics
• Integration of all above information provide robust understanding of the complex compartmentalized shaly-sand reservoir