Integrated Ecosystem Assessment Initiative for Selected ...€¦ · ii Integrated Ecosystem...
68
Integrated Ecosystem Assessment Initiative for Selected Systems in the Northern Gulf of Mexico By Northern Gulf Institute Ecosystem Team
Transcript of Integrated Ecosystem Assessment Initiative for Selected ...€¦ · ii Integrated Ecosystem...

Integrated Ecosystem Assessment Initiative for Selected Systems in the Northern Gulf of Mexico
By Northern Gulf Institute Ecosystem Team

ii
Integrated Ecosystem Assessment Initiative for Selected Systems in the Northern Gulf of Mexico
By Northern Gulf Institute Ecosystem Team
January 2010
Northern Gulf Institute Mississippi State University
Stennis Space Center, Mississippi

iii
iv
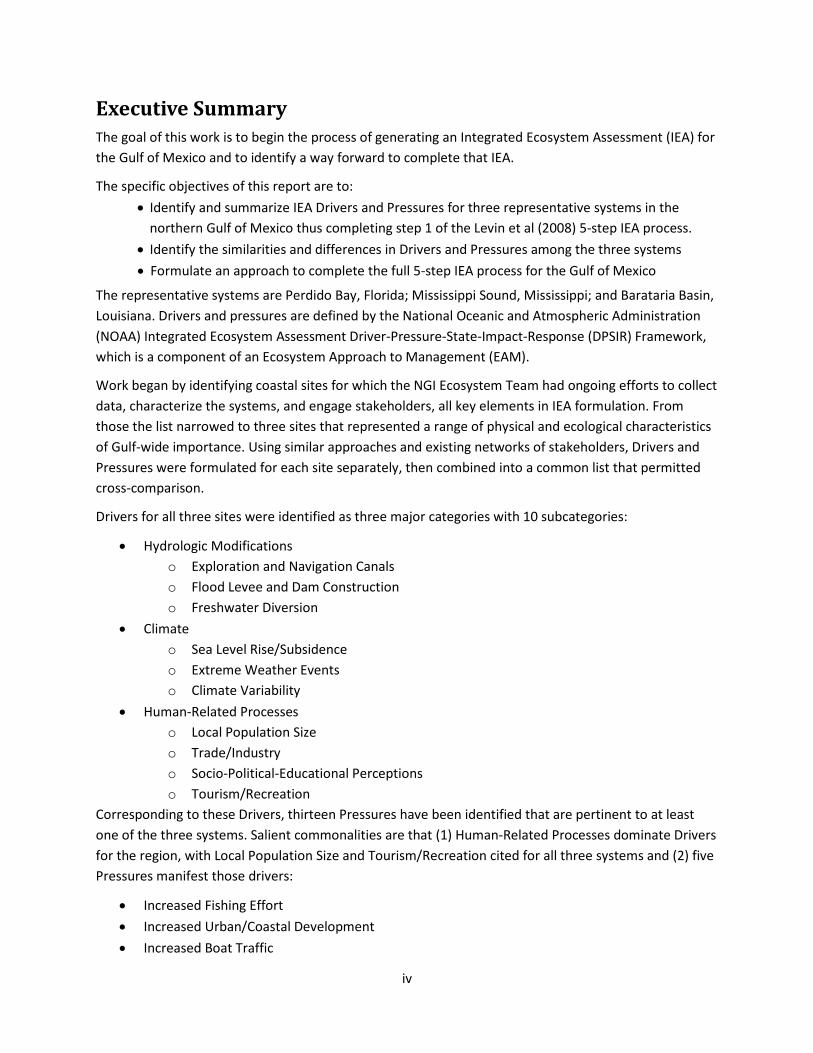
Executive Summary The goal of this work is to begin the process of generating an Integrated Ecosystem Assessment (IEA) for the Gulf of Mexico and to identify a way forward to complete that IEA.
The specific objectives of this report are to:
• Identify and summarize IEA Drivers and Pressures for three representative systems in the northern Gulf of Mexico thus completing step 1 of the Levin et al (2008) 5-step IEA process.
• Identify the similarities and differences in Drivers and Pressures among the three systems
• Formulate an approach to complete the full 5-step IEA process for the Gulf of Mexico
The representative systems are Perdido Bay, Florida; Mississippi Sound, Mississippi; and Barataria Basin, Louisiana. Drivers and pressures are defined by the National Oceanic and Atmospheric Administration (NOAA) Integrated Ecosystem Assessment Driver-Pressure-State-Impact-Response (DPSIR) Framework, which is a component of an Ecosystem Approach to Management (EAM).
Work began by identifying coastal sites for which the NGI Ecosystem Team had ongoing efforts to collect data, characterize the systems, and engage stakeholders, all key elements in IEA formulation. From those the list narrowed to three sites that represented a range of physical and ecological characteristics of Gulf-wide importance. Using similar approaches and existing networks of stakeholders, Drivers and Pressures were formulated for each site separately, then combined into a common list that permitted cross-comparison.
Drivers for all three sites were identified as three major categories with 10 subcategories:
• Hydrologic Modifications o Exploration and Navigation Canals o Flood Levee and Dam Construction o Freshwater Diversion
• Climate o Sea Level Rise/Subsidence o Extreme Weather Events o Climate Variability
• Human-Related Processes o Local Population Size o Trade/Industry o Socio-Political-Educational Perceptions o Tourism/Recreation
Corresponding to these Drivers, thirteen Pressures have been identified that are pertinent to at least one of the three systems. Salient commonalities are that (1) Human-Related Processes dominate Drivers for the region, with Local Population Size and Tourism/Recreation cited for all three systems and (2) five Pressures manifest those drivers:
• Increased Fishing Effort
• Increased Urban/Coastal Development
• Increased Boat Traffic

v
• Increased Nutrients
• Increased Pollution A marked difference is seen between Drivers and Pressures at the Perdido Bay sites and the other two systems, with Perdido experiencing only one significant Driver – Extreme Weather Events – outside the major category of Human-Related Processes; whereas Barataria Basin and Mississippi Sound experience the entire range of Drivers. This difference may be due to the scale of the analyses (three lagoons within Perdido Bay vs. large basins for Barataria and Mississippi Sound) and/or to the difference in physical environments. Some of the Drivers and Pressures are shared by all three systems but differ in scale and type.
These three systems can now be examined for the next steps in the IEA process: indicator development, risk analysis, status assessment and management strategy evaluation.
This effort and its follow-on activities can also be used as a template for extending the Ecosystem Approach to Management (EAM) to other systems and other regions in the Gulf of Mexico. To do so, several steps are recommended:
1. Extend the Drivers and Pressures analysis to the entire Perdido Bay, in order to separate the effects of scale from the effects of geographical location.
2. Use the stakeholder groups already assembled plus upstream (watershed) groups to validate the work reported here and to continue the IEA definition of States, Impacts, and Responses for these three systems.
3. Begin a risk analysis framework as described in Step 3 of the IEA process for the index systems capitalizing on modeling expertise within the NGI working group as well as stakeholder groups already assembled.
4. Compile a guidance document that will serve as a template for applications to new sites and provide lessons learned.
5. Continue development of the Sulis toolkit, with an emphasis on tools supporting EAM and IEA. 6. Initiate two to three new system IEAs to complement the three described here. Example
regions might include a coastal area in mid- to southern Texas (with low freshwater flows) and one in the Big Bend area of Florida (with primarily sandy substrates).
7. Begin integration of the individual IEA into a Gulf of Mexico EAM by creation of a hierarchy of IEA at larger scales (NOAA 2009). For example, Mississippi Sound and Barataria IEA can be combined with new ones for the Pontchartrain Basin and Mississippi River Delta to create a regional IEA.

vi
Preface This work was performed with funding from the Northern Gulf Institute (NGI) under the guidance of Michael Carron and John Harding. The document was prepared by an interdisciplinary team consisting of:
William McAnally, Mississippi State University Civil and Environmental Engineering Department Rita Jackson, Mississippi State University Geosystems Research Institute Just Cebrian, Dauphin Island Sea Lab Richard Fulford, University of Southern Mississippi Department of Coastal Sciences Sara Green, Louisiana State University Department of Oceanography & Coastal Sciences Jill Hendon, University of Southern Mississippi Center for Fisheries Research and Development Steve Lohrenz, University of Southern Mississippi Department of Marine Science Alaina Owens, Louisiana State University Department of Oceanography & Coastal Sciences Mark Peterson, University of Southern Mississippi Department of Coastal Sciences Erick Swenson, Louisiana State University Department of Oceanography & Coastal Sciences John Harding, Northern Gulf Institute Julien Lartigue, National Oceanic and Atmospheric Administration
Dr. Michael Carron is Director of the NGI and Dr. John Harding is Chief Scientific Officer. The NGI web site is at http://www.northerngulfinstitute.org/home/ngi.php

vii
Contents Executive Summary ...................................................................................................................................... iv
Preface ......................................................................................................................................................... vi
1. Introduction .............................................................................................................................................. 1
Objectives ................................................................................................................................................. 1
Integrated Ecosystem Assessments .......................................................................................................... 1
Approach ................................................................................................................................................... 5
Sulis Decision Support Tools ..................................................................................................................... 5
2. Selected Systems....................................................................................................................................... 7
Perdido Bay ............................................................................................................................................... 7
Mississippi Sound ...................................................................................................................................... 8
Barataria Basin .......................................................................................................................................... 9
Commonalities and Differences .............................................................................................................. 10
3. Summary and Conclusions ...................................................................................................................... 17
References .................................................................................................................................................. 18
Appendix A: Selected IEA Applications ....................................................................................................... 19
Appendix B: Perdido Bay Analysis ............................................................................................................... 28
Appendix C: Mississippi Sound Analysis ...................................................................................................... 37
Appendix D: Barataria Basin Analysis ......................................................................................................... 46
1. Introduction
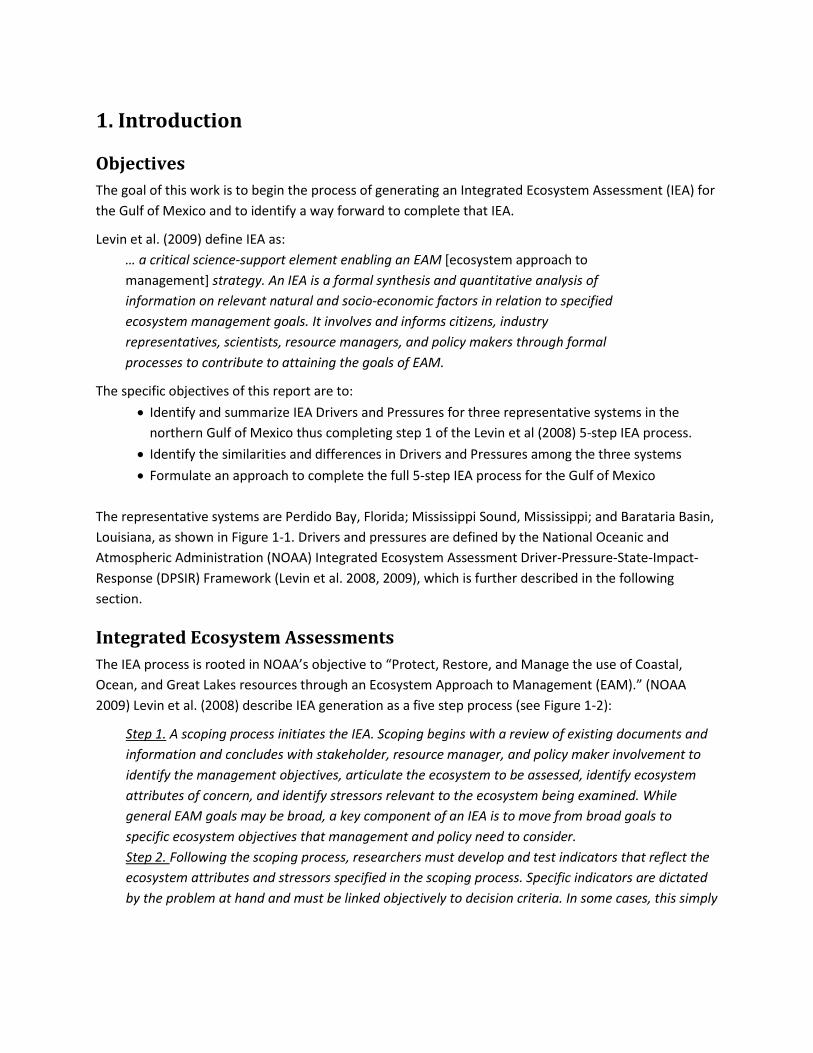
Objectives The goal of this work is to begin the process of generating an Integrated Ecosystem Assessment (IEA) for the Gulf of Mexico and to identify a way forward to complete that IEA.
Levin et al. (2009) define IEA as: … a critical science-support element enabling an EAM [ecosystem approach to management] strategy. An IEA is a formal synthesis and quantitative analysis of information on relevant natural and socio-economic factors in relation to specified ecosystem management goals. It involves and informs citizens, industry representatives, scientists, resource managers, and policy makers through formal processes to contribute to attaining the goals of EAM.
The specific objectives of this report are to:
• Identify and summarize IEA Drivers and Pressures for three representative systems in the northern Gulf of Mexico thus completing step 1 of the Levin et al (2008) 5-step IEA process.
• Identify the similarities and differences in Drivers and Pressures among the three systems
• Formulate an approach to complete the full 5-step IEA process for the Gulf of Mexico
The representative systems are Perdido Bay, Florida; Mississippi Sound, Mississippi; and Barataria Basin, Louisiana, as shown in Figure 1-1. Drivers and pressures are defined by the National Oceanic and Atmospheric Administration (NOAA) Integrated Ecosystem Assessment Driver-Pressure-State-Impact-Response (DPSIR) Framework (Levin et al. 2008, 2009), which is further described in the following section.
Integrated Ecosystem Assessments The IEA process is rooted in NOAA’s objective to “Protect, Restore, and Manage the use of Coastal, Ocean, and Great Lakes resources through an Ecosystem Approach to Management (EAM).” (NOAA 2009) Levin et al. (2008) describe IEA generation as a five step process (see Figure 1-2):
Step 1. A scoping process initiates the IEA. Scoping begins with a review of existing documents and information and concludes with stakeholder, resource manager, and policy maker involvement to identify the management objectives, articulate the ecosystem to be assessed, identify ecosystem attributes of concern, and identify stressors relevant to the ecosystem being examined. While general EAM goals may be broad, a key component of an IEA is to move from broad goals to specific ecosystem objectives that management and policy need to consider. Step 2. Following the scoping process, researchers must develop and test indicators that reflect the ecosystem attributes and stressors specified in the scoping process. Specific indicators are dictated by the problem at hand and must be linked objectively to decision criteria. In some cases, this simply

2
Figure 1-1. Area map showing selected systems and their direct drainage watersheds.
means following the abundance of a single species (for instance in the case of an endangered species) or suites of species (e.g., coral reefs, harmful algal blooms). In other instances, the indicator may be a proxy for an ecosystem attribute indicated in Step 1. Step 3. Once indicators are chosen, an analysis that evaluates the risk to the indicators posed by human activities and natural processes is performed. This analysis is hierarchical in approach and moves from a comprehensive, but qualitative analysis initially, through a more focused and semi-quantitative approach, and finally to a highly focused and fully quantitative approach. This step initially screens out many potential risks, so that more intensive and quantitative analyses are limited to a subset of ecosystem indicators and human or natural threats. Step 4. Results from the risk analysis for each ecosystem indicator are then integrated in the assessment phase of the IEA. The assessment quantifies the status of the ecosystem relative to 1 year cycle historical status and prescribed targets. Thus, the risk analysis rigorously quantifies the status of individual ecosystem indicators, while the full assessment considers the state of all indicators simultaneously.

3
Step 5. The next phase of the IEA uses ecosystem modeling frameworks to evaluate the potential of different management strategies to influence the status of natural and human system indicators. To accomplish this, a formal Management Strategy Evaluation (MSE) is employed.
Figure 1-2. IEA Steps and Explanation (Source: Levin et al. 2009. Used with permission.)

4
Steps 1 and 2 employ the Driver-Pressure-State-Impact-Response (DPSIR) framework, with the framework terms described by Levin et al. (2009) (see Figure 1-3) as:
• Drivers are factors that result in pressures that in turn cause changes in the system. For the purposes of an IEA, both natural and anthropogenic forcing factors are considered; an example of the former is climate variability while the latter include factors such as human population size in the coastal zone and associated coastal development, demand for seafood, etc. In principle, human driving forces can be assessed and controlled. Natural environmental changes cannot be controlled but must be accounted for in management.
• Pressures include factors such as coastal pollution, habitat loss and degradation, and fishing effort that can be mapped to specific drivers. For example, coastal development results in increased coastal armoring and the loss of associated intertidal habitat.
• State variables are indicators of the condition of the ecosystem (including physical, chemical, and biotic factors). Impacts comprise measures of the effect of change in these state variables such as loss of biodiversity, declines in productivity and yield, etc.
• Impacts are measured with respect to management objectives and the risks associated with exceeding or returning to below these targets and limits.
• Responses are the actions (regulatory and otherwise) that are taken in response to predicted impacts. Forcing factors under human control trigger management responses when target values are not met as indicated by risk assessments. Natural drivers may require adaptational response to minimize risk. For example, changes in climate conditions that in turn affect the basic productivity characteristics of a system may require changes in ecosystem reference points that reflect the shifting environmental states.
Figure 1-3. DPSIR Framework (Source: NOAA 2009)

5
IEA have been applied to systems as diverse as the coastal waters of New Jersey and California, the inland Columbia River Basin, and Lake Ontario in North America and to ecosystems in Africa. A partial list of these applications is given in Appendix A.
Approach The Northern Gulf Institute (NGI), a NOAA Cooperative Institute, develops, operates, and maintains an integrated research and transition program focused on filling priority gaps and reducing limitations in current Northern Gulf of Mexico awareness, understanding and decision support. The institute is a collaboration led by Mississippi State University (MSU) that includes the University of Southern Mississippi (USM), Louisiana State University (LSU), Florida State University (FSU) and the Dauphin Island Sea Lab (DISL).
The priority area of NGI interest is the Gulf of Mexico coastal zone between the Suwannee River in Florida and the Sabine-Neches estuary in Louisiana plus the watersheds that supply water, sediment, nutrients, and other materials to that zone. Inclusion of the watershed, which is hydrologically inseparable from the coastal zone, encompasses more than 40 percent of the continental United States.
NGI partners perform extensive research and outreach in the states of Florida, Alabama, Mississippi and Louisiana. It is therefore a natural extension for the NGI to engage in creating an IEA for the region and assisting the states and Federal government in formulating an ecosystem approach to management. Accordingly, an NGI partners team came together to define an approach to achieve those ends.
For this initial study, we began by identifying coastal sites for which we had ongoing efforts to collect data, characterize the systems, and engage stakeholders, all key elements in IEA formulation. From those we narrowed the list to three sites that represented a range of physical and ecological characteristics of gulf-wide importance. Using similar approaches and existing networks of stakeholders, we formulated Drivers and Pressures for each site separately, then forged a common list that permitted cross-comparison. Finally, we evaluated the process for lessons learned and determined a recommended path forward toward the goal of a Gulf of Mexico IEA. A critical part of the path forward will be decision support tools for IEA and particularly EAM. While not directly applied in this preliminary IEA study we briefly introduce one such tool kit that can play a key role as we progress to the next stages of IEA.
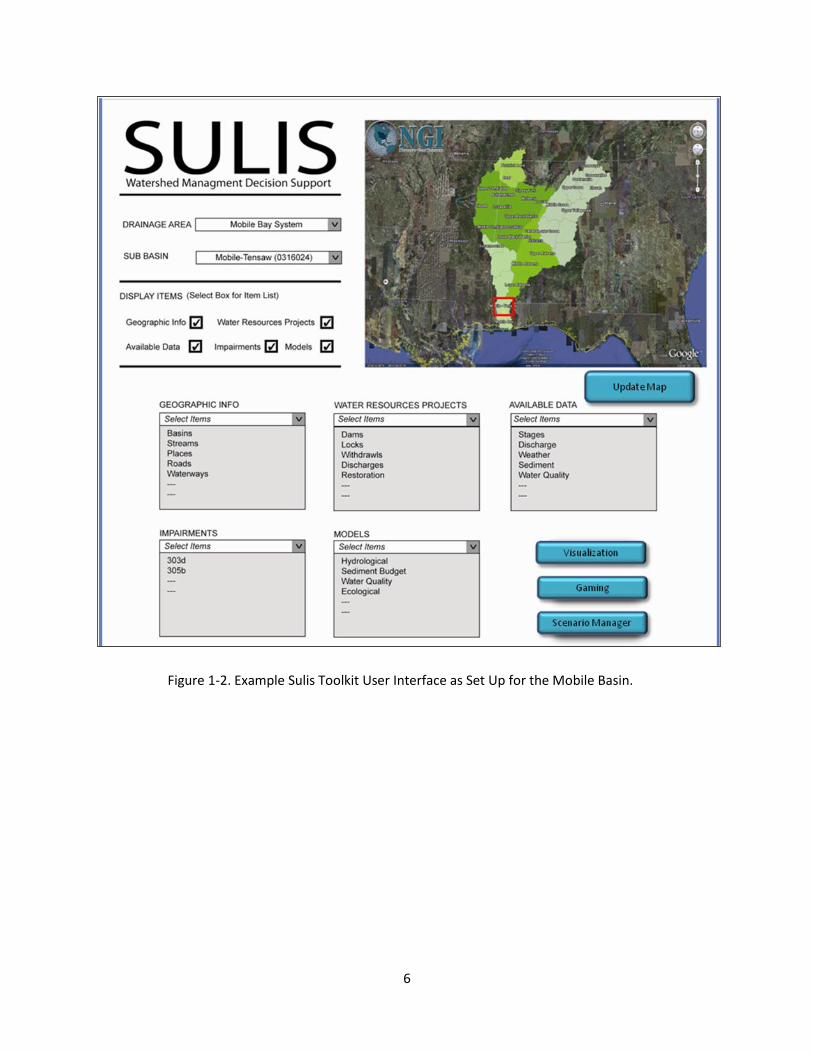
Sulis Decision Support Tools NGI is developing a decision support toolkit for Holistic Aquascape Management that is directly applicable to EAM and IEA. The system, named Sulis after the Celtic goddess of wisdom, will provide tools to examine the fundamental interconnectedness of water systems and ecosystems, including human economic systems, infrastructure, and social systems throughout the aquascape – the watershed over which water flows toward the sea and the coastal and ocean waters which receive those flows. Sulis is designed for compatibility with EAM, IEA, Marine Spatial Planning, Regional Sediment Management, and Total Watershed Management and will provide graphical displays of analyses in support of those approaches. (NGI 2009) A sample screenshot of the Sulis toolkit is shown in Figure 1-2.
6
Figure 1-2. Example Sulis Toolkit User Interface as Set Up for the Mobile Basin.

7
2. Selected Systems The existing study sites selected as representative were Perdido Bay, Florida; Mississippi Sound, Mississippi; and Barataria Basin, Louisiana, as shown in Figure 1-1. Each is an estuarine system with typical northern Gulf characteristics, but with unique features that distinguish them and provide a preliminary view of how IEA will be manifested in many other systems.
Perdido Bay
Perdido Bay is a coastal lagoon-type shallow estuary with a small upstream watershed, leading to high salinities except during freshets. Three lagoons within the Bay were studied – State Park, Kee’s Bayou and Gongora. The lagoons are moderate in size and, as typically found for other coastal lagoons, they are shallow and connected to a sound through a relatively narrow mouth (Figure 2-1). The lagoons also have other similar physical properties but differ in degree and type of human impacts.
The State Park site, as the name indicates, resides within Big Lagoon State Park, Florida and represents the most pristine lagoon with the least amount of human alteration. It is entirely surrounded by salt marsh and maritime forest with no residential development. Kee’s Bayou is developed on the northern and eastern sides (i.e. condominium complex and houses) and bordered by marsh vegetation on the southern and western sides. In addition, a 2-m wide channel along the center of the lagoon is periodically dredged for navigation. Finally, Gongora is bordered by residential development on its
northern and eastern sides and by marsh vegetation on the southern and western sides, although a newly developed condominium lies behind that marsh vegetation. The lagoon is periodically dredged along its central axis for navigation, which, given the narrow, spindle shape of the lagoon, has a large impact in the lagoon (Cebrian 2009).
For additional details of the site and its Drivers and Pressures, see Appendix B.
Figure 2-1. Perdido Bay and Sites (Watershed shown in Figure 1-1.)

8
Mississippi Sound
Mississippi Sound (Figure 2-2) is a shallow, partially stratified estuary that is variably influenced by the Gulf of Mexico, principally through the barrier islands passes, and the coastal watershed, principally through the six major rivers that connect to the Sound, as well as the Mississippi river via Lake Pontchartrain in Louisiana. The Mississippi Sound ecosystem is comprised of the Sound and the connected coastal watersheds that feed into it from three principal embayments (St Louis Bay, Biloxi Bay, and the Pascagoula River distributary). The natural coastal boundaries of sinuous bayous fringed with emergent marsh vegetation and sandy barrier islands have been substantially altered by human activities such as shoreline hardening and dredging, as well as natural climatic events such as hurricanes. Mississippi Sound contains approximately 2023 km2 of open water and 283 km2 of emergent marsh.
The relative importance of marine and freshwater influence to the Sound changes seasonally, as well as daily in response to climatic variability and freshwater diversion; and affects species distributions, species production and spawning success, aquatic nutrient concentrations, water clarity, and even human health (Fulford et al. 2009).
For additional details of the site and its Drivers and Pressures, see Appendix C.
Figure 2-2. Mississippi Sound (Watersheds shown in Figure 1-1.)

9
Barataria Basin The Barataria Basin (Figure 2-3) is an irregularly shaped bar-built estuary, approximately 120 km in length, located west of the Mississippi River in southeastern Louisiana. It is bounded on the north and east by the Mississippi River, on the west by Bayou Lafourche, a former distributary channel of the Mississippi River, and on the south by a barrier island chain and the Gulf of Mexico. The basin has several freshwater diversion sites (Davis Pond, Naomi, and West Pointe à la Hache) designed to moderate salinities and re-introduce Mississippi River water into the wetlands. The basin consists of a foundation of pro-delta clay deposits overlain by a mixture of swamp forest, fresh, intermediate, brackish, and saline marshes, barrier islands, natural levees, and former distributary channels of the Mississippi River (Coleman et al., 1998). The basin contains approximately 616 km2 of freshwater swamp forest, 701 km2 of fresh marsh, 241 km2 of intermediate marsh, 416 km2 of brackish marsh, and 541 km2 of saline marsh. (LaCoast 2009)
For additional details of the site and its Drivers and Pressures, see Appendix D.
Figure 2-3. Barataria Basin (Watersheds shown in Figure 1-1.)

10
Commonalities and Differences Barataria Basin and Mississippi Sound are large areas with a multitude of stakeholders. Perdido Bay is somewhat smaller, but our selected lagoons are smaller still, illustrating some of the differences of scale. Barataria Basin is a complex of islands, marshes, shallow bays and interconnected channels; whereas both Mississippi Sound and Perdido Bay are open waters surrounded by both fringe marshes and sandy shores.
Each of the three systems exhibits the small, mostly diurnal tidal range of the northern Gulf, generally less than about half a meter. Surges associated with tropical and extra-tropical storms are aperiodic occurrences and can be as much as 10 m in extreme events. Freshwater inflows range from the relatively small but mostly unregulated flow of the Perdido Basin, to significant Mississippi Sound inflows of the partly regulated primary tributaries plus the large flows of the Pearl, and Mobile Rivers at the lateral boundaries, to highly regulated flows of the Barataria Basin diversions. Massive Mississippi River discharges may affect the offshore salinities of either Barataria or Mississippi Sound, depending on Gulf circulation patterns.
The Barataria Basin has a relatively low population density but relatively high industrial activity, with the latter driven mainly by the petroleum and fishing industries. Mississippi Sound is bordered by the heavily populated Mississippi, Louisiana, and Alabama coastlines, with a mix of tourism and industry. Perdido Bay has significant residential population, tourism, and fishing, but little industry, and the three lagoons examined in detail range from highly populated to pristine.
Drivers and Pressures for the three systems as identified by Green et al. (2009), Fulford et al. (2009), and Cebrian (2009) are summarized in Table 2-1 and Figure 2-4. Drivers are grouped into three major categories and 10 subcategories as shown in the Table column headings and Figure 2-4 horizontal axis.
• Hydrologic Modifications o Exploration and Navigation Canals o Flood Levee and Dam Construction o Freshwater Diversion
• Climate o Sea Level Rise/Subsidence o Extreme Weather Events o Climate Variability
• Human-Related Processes o Local Population Size o Trade/Industry o Socio-Political-Educational Perceptions o Tourism/Recreation
While Hydrologic Modifications are a Human-Related Process, they are separated here for two reasons – first, Hydrologic Modifications have such a large effect in some areas (such as Barataria) that they dwarf other human influences, and second, they are purposeful, i.e., they are intended to directly modify the physical environment, unlike other Human-Related Processes that indirectly serve as Drivers.

11
Corresponding to these Drivers, thirteen Pressures have been identified that are pertinent to at least one of our three systems, and they are shown as rows in Table 2-1. The intersections of applicable Pressures and Drivers are denoted by a B, M, or P in the table cell for Barataria, Mississippi Sound, or Perdido, respectively. For example, the Driver “flood levee and dam construction” is manifested as the Pressure “altered river input” in two of the systems, Barataria and Mississippi Sound.
Salient commonalities are that (1) Human-Related Processes dominate Drivers for the region, with Local Population Size and Tourism/Recreation cited for all three systems and (2) five Pressures manifest those drivers:
• Increased Fishing Effort
• Increased Urban/Coastal Development
• Increased Boat Traffic
• Increased Nutrients
• Increased Pollution A marked difference is seen between Drivers and Pressures at the Perdido Bay sites and the other two systems, with Perdido experiencing only one significant Driver – Extreme Weather Events – outside the major category of Human-Related Processes; whereas Barataria Basin and Mississippi Sound experience the entire range of Drivers. This difference may be due to the scale of the analyses (three lagoons within Perdido Bay vs. large basins for Barataria and Mississippi Sound) and/or to the difference in physical environments. Some of the Drivers and Pressures are shared by all three systems but differ in scale and type. For example:
• Dredging of exploration and navigation canals in Barataria Basin alters internal wetland connectivity by direct wetland removal, redirecting water flows from overland to more of a channelized pattern, providing a more direct conduit for salt water intrusion, and by isolating areas of wetlands via dredged material banks (impoundments). These channels also increase boat traffic damage (wake, grounding, and anchor-related). In Mississippi Sound these channels are mostly in shallow but open coastal waters and may impact barrier islands, but few wetlands. In Perdido Bay dredged channels are small and used by recreational and fishing craft.
• Flood levees and dam construction alter riverine (Mississippi River and Bayou Lafourche) input by cutting off freshwater, sediment and nutrient input that is needed to sustain the Barataria wetlands. They alter internal wetland connectivity by isolating some wetland areas. Flood levees have also increased coastal development pressures, by reducing flood frequency and impacts, and thus making these areas more appealing to developers. In Mississippi Sound and Perdido Bay levees do not play a role, but upstream impoundments capture sediment and attenuate flood flows to some degree, but much less than the near total control of the Barataria Basin.

12
Table 2-1. Common Drivers (Columns) and Pressures (Rows) for Barataria Basin (B), Mississippi Sound (M) and Perdido Bay (P) (absence of a letter code indicates that either the Driver-Pressure combination does not apply to that system.)
PRESSURES
DRIVERS
Hydrologic Modifications Climate Human-Related Processes Exploration
& navigation
canals
Flood levee & dam
construction
Freshwater diversion
Sea Level Rise/Subsidence
Extreme Weather
Events
Variability Local Population
Size
Trade/Industry Socio-Political-
Educational Perceptions
Tourism/Recreation
Altered riverine input
B, M B, M B B, M M M
Altered internal wetland connectivity
B B B, M B, M M B, M M
Increased nutrients (point and non-point)
B M B, P, M B, M P, M B, M
Increased pollution (point and non-point)
B B, P, M B, M B, M B, M
Increased dredging
B M M P, M B, M M B, M

13
PRESSURES
DRIVERS
Hydrologic Modifications Climate Human-Related Processes Exploration
& navigation
canals
Flood levee & dam
construction
Freshwater diversion
Sea Level Rise/Subsidence
Extreme Weather
Events
Variability Local Population
Size
Trade/Industry Socio-Political-
Educational Perceptions
Tourism/Recreation
Increased fishing effort
M M B, M B, M M B, P, M
Increased boat traffic (wakes, grounding, and anchoring)
B B, M B,M M B, P, M
Introduction of non-indigenous species
M M M B, M B, M B, M B, M
Increased urban/coastal development
M B M B, P, M B, M B, P,M B, P, M
Increased logging
B B

14
PRESSURES
DRIVERS
Hydrologic Modifications Climate Human-Related Processes Exploration
& navigation
canals
Flood levee & dam
construction
Freshwater diversion
Sea Level Rise/Subsidence
Extreme Weather
Events
Variability Local Population
Size
Trade/Industry Socio-Political-
Educational Perceptions
Tourism/Recreation
Redistribution of marsh & barrier island sediment
M M B, M B, M M M M M
Decreased land elevation
B B, M
Critical habitat degradation
M M M M P, M M M M M M

15
Figure 2-4. Distribution of Pressures and Drivers
• Freshwater diversions have been initiated as a management tool in Barataria to ameliorate the effects caused by leveeing the Mississippi River. They reconnect the riverine resources to the wetlands in a small-scale and controlled manner. They are vehicles for introducing freshwater, nutrients, and pollutants. While they have not previously played a substantial role in the other two systems, proposals to use the Leaf or Pascagoula Rivers in Mississippi to carve oil storage caverns in salt domes would raise enormous issues for ecosystem management in Mississippi Sound.
• Extreme weather events such as river floods, increase riverine input to the basins. Hurricanes and severe tropical storms alter internal wetland connectivity and decrease land elevation through direct marsh destruction and/or redistribution. These events also redistribute sediments from the marsh and barrier island systems, which can either be deposited within or removed from the system. Severe droughts can result in wetland vegetation death and resulting decrease in land elevation. Annual climatic variability alters local riverine input through the annual spring discharge of the rivers and local bayous. Winds associated with winter cold fronts
0
2
4
6
8
10
12N
umbe
r of P
ress
ures
Barataria
Miss. Sound
Perdido

16
cause a ‘set up’ and ‘set down,’ in which coastal waters flush into and out of the system. This often results in redistribution of basin salinity and sediment. While these effects are experienced by all three systems, Barataria and coastal Mississippi are more strongly threatened because of subsidence and bathymetry, respectively.
• Local population size results in increased urban and coastal development, impacts wetland biodiversity, and generally results in degraded wetlands. As population increases, fishing demand increases and there is increased boat traffic damage (wake, grounding, and anchor-related). Humans also introduce non-indigenous plant and animal species. In addition, increased urban and coastal development leads to increased point and non-point sources of nutrients and pollutants; however, in Perdido Bay increased nutrients and pollutants come primarily from coastal watersheds; in Mississippi Sound they drain from almost the entire state of Mississippi; and in Barataria they come from a huge swath of middle America. These differences in scale make analyses of the issues and planning of solutions significantly different enterprises.
• Primary trade and industry in Barataria Basin and Mississippi Sound include oil and gas exploration and production, navigation, ship building, and commercial fisheries. Industrial activities can lead to increased point and non-point sources of nutrients and pollutants. Increased boat traffic damage (wake, grounding, and anchor-related) is associated with a number of trade industries, and non-indigenous plant and animal species can be introduced through ship ballasts and other activities (aquaculture - tilapia, fur trade - nutria, etc.). There is a large commercial fishing (fin fish, crab, shrimp, oysters) industry, which leads to increased fishing pressures. Cypress mulch has also become an increasing trade activity, leading to increased logging pressure in upper Barataria Basin. Perdido Bay has much less industrial activity, with trade dominated by tourism, residential communities, and fishing.
• The socio-political-educational perceptions in all three systems are such that there is a disconnect between policy and public education and perception of the issues, such as point and non-point sources of nutrients and pollutants (e.g., dumping of vessel waste, littering, sewage treatment in coastal camps), introduction of non-indigenous species (e.g., landscaping, exotic pets), logging (e.g., demand for cypress mulch), and development in sensitive coastal areas. In addition, the regulatory frameworks can be unclear and often unevenly enforced in different management areas. For example, the current knowledge on maintaining sustainable cypress forests is not consistently applied (USACE, 2005) and many laws and regulations are enforced by different state agencies with varying emphases. Such disconnects frustrate stakeholders and ultimately undermine restoration efforts.
• Tourism and recreation can lead to increased urban and coastal development, such as coastal camps and marinas, producing increased point and non-point sources of nutrients and pollutants. The Gulf is a popular fishing destination, for both fresh and salt water fishing, and increased fishing demand is linked to these activities. Increased recreational boating increases boat traffic damage and dredging for marinas and boat slips. Some tourist and recreation activities can also introduce non-indigenous plant and animal species, by transporting plant (e.g., hydrilla) and animal (e.g., live bait) species.

17
3. Summary and Conclusions We have completed step 1 of the Levin et al (2009) 5-step IEA process for three systems in the northern Gulf of Mexico – Barataria Basin, Mississippi Sound, and Perdido Bay. These three systems offer a range of geographic, hydrologic, and population characteristics that is typical of much of the region from the Northern Texas Gulf coast through the Florida Panhandle.
This preliminary analysis has identified Human-Related Processes as the most prevalent IEA Driver category, affecting all three systems. It has further demonstrated that five related Pressures -- Increased Fishing Effort, Urban/Coastal Development, Boat Traffic, Nutrients, and Pollution are common to all three systems.
These three systems can now be examined for the next steps in the IEA process: indicator development, risk analysis, status assessment and management strategy evaluation.
This effort and its follow-on activities can also be used as a template for extending the Ecosystem Approach to Management (EAM) to other systems and other regions in the Gulf of Mexico. To do so, several steps are recommended:
1. Extend the Drivers and Pressures analysis to the entire Perdido Bay, in order to separate the effects of scale from the effects of geographical location.
2. Use the stakeholder groups already assembled plus upstream (watershed) groups to validate the work reported here and to continue the IEA definition of States, Impacts, and Responses for these three systems.
3. Begin a risk analysis framework as described in Step 3 of the IEA process for the index systems capitalizing on modeling expertise within the NGI working group as well as stakeholder groups already assembled.
4. Compile a guidance document that will serve as a template for applications to new sites and provide lessons learned.
5. Continue development of the Sulis toolkit, with an emphasis on tools supporting EAM and IEA. 6. Initiate two to three new system IEAs to complement the three described here. Example
regions might include a coastal area in mid- to southern Texas (with low freshwater flows) and one in the Big Bend area of Florida (with primarily sandy substrates).
7. Begin integration of the individual IEA into a Gulf of Mexico EAM by creation of a hierarchy of IEA at larger scales (NOAA 2009). For example, Mississippi Sound and Barataria IEA can be combined with new ones for the Pontchartrain Basin and Mississippi River Delta to create a regional IEA from Mobile to the Mississippi.

18
References Cebrian, J., 2009. Integrated Ecosystem Assessment (IEA) of coastal lagoons in Perdido Bay, Florida.
Northern Gulf Institute, Stennis Space Center, Mississippi.
Fulford, R., S. Lohrenz, M. Peterson, J. Hendon. 2009. Preliminary report on Drivers and Pressures for an Integrated Ecosystem Assessment (IEA) of the coastal North Central Gulf of Mexico Ecosystem (Mississippi Sound). Northern Gulf Institute, Stennis Space Center, Mississippi.
Green, S.E., A.B. Owens, E. Swenson. 2009. Integrated Ecosystem Assessment: Barataria Basin, Louisiana. Northern Gulf Institute, Stennis Space Center, Mississippi.
LaCoast 2009. La Coast, www.lacoast.gov, Accessed November 2009.
Levin P.S., M.J. Fogarty, S.A. Murawski, D. Fluharty. 2009. Integrated ecosystem assessments: Developing the scientific basis for ecosystem-based management of the ocean. PLoS Biol 7(1): e1000014. doi:10.1371/journal.pbio.1000014.
Levin, P.S., M.J. Fogarty, G.C. Matlock, and M. Ernst. 2008. Integrated ecosystem assessments. U.S. Dept. Commerce, NOAA Tech. Memo. NMFS-NWFSC-92.
NGI 2009. Sulis: A Framework for Healthy Watersheds – Healthy Oceans –Healthy Ecosystems, Technical Report by Northern Gulf Institute H3O Team, Stennis Space Center, Mississippi. December 2009.
NOAA 2009. FY-2010-2014 Strategic Investment Question, Integrated Ecosystem Assessments: A synthesis and quantitative analysis of information on relevant physical, chemical, ecological and human processes in relation to specified ecosystem management objectives.
USACE 2005. Donaldsonville to the Gulf- Feasibility Study- Hurricane Protection Project-Environmental Workshop Report – January 25, 2005. US Army Corps of Engineers. 25 pp.

19
Appendix A: Selected IEA Applications
Title Author(s) Source Journal D, M, Y:
Page No. Annotation Pilot Integrated Ecosystem Assessment Bugesera Region Rwanda
Alex Mulisa Power Point: Poverty & Environment Initiative UNEP/UNDP Rwanda Environment Management Authority
Rwanda, 2007 To identify linkages between human well-being and ecosystem services at regional and local levels.
Integrated Ecosystem Assessment(IEA)
Robert Duff, David Hartley, Ken Currens, Joe Gaydos, Tom Mumford, Mark Plummer, Michael Rylko, David St. John, Mary Mahaffy, Bruce Crawford
Power Point: Integrated Ecosystem Assessment (IEA)
The Power Point addresses policy questions and IEA steps.
Annotated Bibliography of Integrated Ecosystem Assessment Concepts, Methods, Evaluations, and Implementation Examples NOAA IEA Task Team
none given Word doc. 7-Jun-07 Topics: Conceptual Framework Documents, Methods/Tools Evaluation and Integration, Assessment Products and Processes, Integrated Assessment Implementation Examples (national, regional and international)

20
Title Author(s) Source Journal D, M, Y:
Page No. Annotation Integrated Ecosystem Assessments: Developing the Scientific Basis for Ecosystem-Based Management of the Ocean
Phillip S. Levin, Michael J. Fogarty, Steven A. Murawski, David Fluharty
PloS Biology 20-Jan-09 A Five Step Process for IEAs (Scoping, Indicator development, risk analysis, management strategy evaluation, monitoring) The Importance of Scale, Applying the IEA Concept, Puget Sound: An IEA Case Study, Concluding Thoughts, Acknowledgments, References
California Current Ecosystem-Based Management Initiative
none given Web site Science to Inform Ecosystem Service Trade-off Analysis (SIESTA) has been developed in collaboration with those working on NOAA’s Integrated Ecosystem Assessment (IEA) framework, which aims to guide the process of synthesizing and analyzing the scientific information needed for an ecosystem approach to management. SIESTA focuses more exclusively on thinking about trade-offs among ecosystem services. It presents a more explicit methodology for a component of the IEA and is intended to work within the broader IEA framework. Click here to see how SIESTA nests within IEA. http://ims.ucsc.edu/CCEBM/CCEBM_IEA_SIESTA.pdf
Advancing the Science for Ecosystem-Based Management on the U.S. West Coast
NOAA, NESDIC NODC, National Coastal Data Development Center
White paper (DRAFT)
IEAs involve the integration of heterogeneous data from numerous, distributed sources. This requires access to both historical or legacy data, as well as real-time in situ data streams. To produce an IEA, scientists need to discover all available and relevant data for the area of interest, understand each dataset well enough to use it with confidence, access the data in usable formats, and fuse it with other data and models for analysis, forecasting, or other product generation.
UNDP-UNEP Poverty-Environment Initiative
none given Web site Regional Poverty Reduction Plans implemented at the district level. Training of academics, policy makers, economists and CSOs to the techniques of Integrated Ecosystem Assessment (IEA), which will lead to a better understanding of the links between poverty and the environment.
GoMRCT IEA Workshop February 2009
none given web site Presentations and other material from workshop.

21
Title Author(s) Source Journal D, M, Y:
Page No. Annotation Notes From The Urban Coast Institute Workshop Improving Regional and Ecosystem Based Ocean management Approaches in new Jersey -Monmouth University
Workshop presenters Workshop report Mr. Jay Odell: A threats analysis will be undertaken Using GIS information and an Integrated Ecosystem Assessment (IEA) approach that will lead to the development of threat abatement strategies.
Integrating Population, Health, and Environment In Rwanda
Melissa Thaxton Policy Brief In Rwanda, the importance of addressing development issues in an integrated fashion is reflected in the recently implemented (2006) Poverty- Environment Initiative (PEI), supported jointly by the United Nations Development Programme (UNDP) and the UN Environment Programme (UNEP). In the first phase of this initiative, an integrated ecosystem assessment (IEA) was conducted in Bugesera district in southeastern Rwanda between 2006 and 2007. The IEA concluded that population pressure and poverty were among the main drivers of declining availability of and access to ecosystem services such as clean water, food, and energy, and that these shortages have had a profound effect on Bugesera residents’ health and well-being. The IEA also concluded that integrated approaches would be more effective in ecosystem rehabilitation and in reversing the negative impacts of environmental changes on human well-being.4
NOAA Integrated Ecosystem Assessment (IEA) Priority Area Task Team (PATT)
none given web site The NOAA IEA PATT works with NOAA Regional Teams in concept development for the implementation of IEAs.
What is an Integrated Ecosystem Assessment?
Steve Murawski & Emily Menashes (NOAA Ecosystem Goal Team, March 27, 2007)
Power Point IEA Overview • Definition & purpose of IEA • Current and required capabilities to produce IEAs • Strategies for progress

22
Title Author(s) Source Journal D, M, Y:
Page No. Annotation Integrated Ecosystem Assessment:The First Steps in Ecosystem-Based Management of Living Marine Resources, July 2007
John Boreman, Director, Office of Science and Technology NOAA Fisheries Service
Power Point Integrated Ecosystem Assessment • What is IEA • Steps in IEA • Appropriate Geographical Scales in IEA • Pilot Studies • Critical Outcomes of IEA • Vision
INTEGRATED ECOSYSTEM ASSESSMENT: UGANDA’S EXPERIENCES
Ronald Kaggwa Environment Economist and National Focal Point National Environment Management Authority (NEMA) UGANDA
Power Point • Uganda carried out a Pilot Integrated Ecosystem Assessment (IEA) covering the Lake Kyoga catchment (a Sub-catchment of the Nile Basin). • The IEA had three layers of focus; – local sites in Nakasongola, Bududa and Butaleja Districts; – the regional assessment focusing on the Lake Kyoga catchment as a whole; – the linkage with national level activities, policies and programmes.
Integrated Ecosystem Assessment: Lake Ontario Water Management
Mark B. Bain, Nuanchan Singkran, Katherine E. Mills, Department of Natural Resources, Cornell University, Ithaca, New York, United States of America
Research Article Ecosystem management requires organizing, synthesizing, and projecting information at a large scale while simultaneously addressing public interests, dynamic ecological properties, and a continuum of physicochemical conditions. We compared the impacts of seven water level management plans for Lake Ontario on a set of environmental attributes of public relevance.

23
Title Author(s) Source Journal D, M, Y:
Page No. Annotation An Integrated Ecosystem Assessment of the Interior Columbia Basin
Russell T. Graham, Thomas M. Quigley, Rebecca Gravenmier
Journal Article 2, 11, 2004: 31-40
Abstract Driven by the need to replace interim direction, address recent species listings as threatened or endangered under the Endangered Species Act, and break the gridlock of implementing actions, the U.S. Department of Agriculture, Forest Service (FS) and the U.S. Department of the Interior, Bureau of Land Management (BLM), initiated an effort to develop a scientifically-sound, ecosystem-based strategy for lands they administer in the Interior Columbia Basin. The effort included an integrated assessment of 58.3 million ha in seven states describing the Basin's current conditions and risks associated with different management strategies. The assessment provides the foundation for environmental impact statements outlining management direction for 31 million hectares of FS and BLM administered lands. The process produced a framework for ecosystem management, ecosystem component (social, economic, landscape, terrestrial, and aquatic) assessments, and estimates of ecological integrity and socioeconomic resiliency.
Integrated Ecosystem Assessment for Western Development of China
Liu Ji-yuan, Masataka Watanabe, Yue Tian-xiang, Ouyang Hua and Deng Xiang-zheng
Journal Article 22,02,2008: 127-134
Abstract The objectives of Integrated Ecosystem Assessment for Western Development of China includes: (1) providing scientific basis for ecosystem protection, ecosystem management and ecological construction in the western development; (2) developing complete database and analytical tools and strengthening decision-making support capacity; and (3) improving ecosystem management in China, spreading ecological knowledge to the public, serving decision-making of local and central governments, and promoting socio-economic sustainable development. The design and implementation of the project are of significance under the macro background of western development of China. By the integrated assessment of western China, we can get the first-hand data covering all the environmental factors as well as disclose the situations and their changing trends of ecosystem in the western part of China, which will benefit the decision-making for the central and local governments in the implementation of the western development strategy. In other words, the implementation of the project, to a certain extent, can guarantee the regional sustainable development of western China.

24
Title Author(s) Source Journal D, M, Y:
Page No. Annotation NOAA Project: Integrated Ecosystem Assessment
None given Web site (Vieques Island, Pueto Rico: Database & Mapping)
NOAA is working with our federal and commonwealth partners to conduct a broad-scale characterization of Vieques’ coral reef ecosystems using established assessment and monitoring techniques currently employed throughout the U.S. Caribbean as part of NOAA’s National Coral Reef Ecosystem Monitoring Program (NCREMP). Although the Commonwealth of Puerto Rico is currently part of this program, monitoring efforts undertaken to date have primarily concentrated on the main island. Expansion of long-term monitoring efforts using standardized protocols to Vieques would enable the condition of coral reef ecosystems there to be evaluated in the context of the rest of the Commonwealth, the U.S. Caribbean, and the nation as a whole. Furthermore, the proposed monitoring work would ensure that Vieques data would be represented in the next release of The State of Coral Reef Ecosystems of the U.S. and Pacific Freely Associated States, which is currently slated for publication in 2008. Contingent on future funding, this assessment will provide the basis for establishment of a long-term monitoring strategy for Vieques that is consistent with and complementary to other NCREMP activities as well as information on trends in the condition of resources to support effective management.
Integrated Ecosystem Assessment
None given White Paper Background The NOAA 2005-2010 Strategic Plan highlights the importance of incorporating ecosystem principles in resource management. Specifically, a critical agency objective is to “Protect, Restore, and Manage the use of Coastal, Ocean, and Great Lakes resources through an Ecosystem Approach to Management (EAM)”. An ecosystem approach to management is one that provides a comprehensive framework for marine, coastal, and Great Lakes resource decision making. In contrast to individual species or single issue management, EAM considers a wider range of relevant ecological, environmental, and human factors bearing on societal choices regarding resource use and protection.

25
Title Author(s) Source Journal D, M, Y:
Page No. Annotation Developing the California Curent Integrated Ecosystem Assessment, Module I: Select Time-Series of Ecosystem State
William J. Sydeman & Merdith l. Elliott January 15, 2008
NCCOS Web site An Integrated Ecosystem Assessment (IEA) is a dynamic, decision-support toolurces. Fluharty et al. (2006) include the following specific objectives for IEAs to be developed for each large marine ecosystem (LME) in the U.S.: To compile relevant data sets for the ecosystem (e.g., physical oceanography, atmospheric, climatological and weather observations, human use patterns and statistics, abundance and distribution of biological resources), • To report on current conditions and trends in relevant data time series of physical, biological and human uses, • To synthesize time series data to link important ecological outcomes to changes in relevant climate and human use drivers (i.e., forecasting),...
Integrated Ecosystem Assessment
Phillip S. Levin, Michael J. Fogarty, and Gary C. Matlock
The reports of the U.S. Oceans Commission, the Pew Oceans Commission, the Ocean Priorities Plan, and other nationwide reviews highlight the importance of incorporating ecosystem principles in ocean and coastal resource management. Specific to NOAA, a critical objective is to “Protect, Restore, and Manage the use of Coastal, Ocean, and Great Lakes resources through an Ecosystem Approach to Management (EAM)”. An ecosystem approach to management is one that provides a comprehensive framework for marine, coastal, and Great Lakes resource decision making. In contrast to individual species or single issue management, EAM considers a wider range of ecological, environmental, and human factors bearing on diverse societal objectives regarding resource use and protection.
An Integrated Ecosystem Assessment of the Central Baltic Sea and the Gulf of Rica
Christian Möllmann, B. Müller-Karulis, R. Diekmann, J. Flinkman, G. Kornilovs, E. Lysiak-Pastuszak, J. Modin, M. Plikshs, Y. Walther, and N. Wasmund
International Council for the Exploration of the Sea
An integrated ecosystem assessment of two sub-systems of the Baltic Sea was conducted in the frame of the ICES/HELCOM/BSRP “Workshop on Developing a Framework for an Integrated Assessment for the Baltic Sea [WKIAB]”. We present results of meta-analyses of oceanographic, nutrient, phyto- and zooplankton as well as fisheries data for the Central Baltic Sea (CBS) and the Gulf of Riga (GOR), the former comprising the highly stratified deep basins of the Baltic while the latter represents a shallow low saline Gulf. Considering the...

26
Title Author(s) Source Journal D, M, Y:
Page No. Annotation Integrated ecosystem assessment of wetlands in the in the Northern Territory: a tool for NRM: A pilot case study in the Daly River, Mary River and East Alligator River catchments
Olga Ypma & Matthew Zylstra Summary for Stakeholders
This booklet provides an overview of the main research results from six individual MSc theses as components of an integrated ecosystem assessment on ecological, social and economic values of wetlands in northern Australia. These values fed into an analysis of competing interests, relevant policy and stitutional aspects and management implications and options. The study areas used for this pilot study were key wetland areas in the catchments of the River, Mary River and, to a lesser extent, the East Alligator River.
Science and Integrated Ecosystem Assessment to Support Reginal Planning
Dr. Thomas Noji NOAA Fisheries, Northerns Fisheries Science Center, James J. Howard, Marine Science Laboratory, Sandy Hook, NJ
Power Point Science and IEA • IEA defined • An IEA • Indicators • Partnership Roles
Integrated Ecosystem Assessment Initiative
Marybeth Bauer, Gary C. Matlock, Bob Wood, Ruth Kelly, Susan Baker, National Centers for Coastal Ocean Science
Power Point NCCOs’ IEA Model Step 1: Articulate the question Step 2: Define the ecosystem Step 3: Assess ecosystem health Step 4: Assess causes and consequences Step 5: Evaluate management alternatives Step 6: Identify information gaps
Linking ecosystem and economic models for integrated ecosystem assessment of western China
Pan, Shufen, Tian, Hanqin, Liu, Jiyuan, Melillo, Jerry , Liu, Mingliang, Deng, Xiangzheng, The University of Kansas, Lawrence, KS 660452 Institute of Geographic Science and Natural Resource Research, Beijing, 100101, China The Ecosystem Center, Woods Hole, MA 02543
ESA 2003 Annual Meeting (Oral session)
ABSTRACT- In this research we develop a system modeling framework for integrated ecosystem assessment at a regional scale. This system modeling framework is a close coupling of three existing models including the terrestrial ecosystem model, the land use model and an economic decision model. We apply the system modeling framework for the integrated ecosystem assessment of Western China, a sub-global assessment of the Millennium Ecosystem Assessment Project (MA). We investigate how changing human impacts (e.g. population growth, urbanization, industrialization and land-use change) and changing natural processes (e.g. climate variability and change) affect the sustainability of ecosystems and economic productivity in the region.
27
Title Author(s) Source Journal D, M, Y:
Page No. Annotation Integrated ecosystem assessment of Vieques, Puerto Rico Fish Assessment and Monitoring Data
National Oceanic and Atmospheric Association (NOAA)/National Ocean Service (NOS)/National Centers for Coastal Ocean Science (NCCOS)/Center for Coastal Monitoring and Assessment (CCMA)/Biogeography Branch
metadata Abstract: This fish and benthic composition database is the result of a multifaceted effort described below. The National Oceanic and Atmospheric Administration’s (NOAA) Biogeography Branch, in consultation with NOAA’s Office of Response and Restoration (OR&R) and other local and regional experts, is conducting an ecological characterization of the marine ecosystem around Vieques Island, Puerto Rico. The assessment will support effective management and conservation of marine resources in Vieques as a whole. To date a spatially comprehensive assessment of coral reef and hardbottom habitat around Vieques has been lacking. To fill this gap, the Biogeography Branch is expanding long term monitoring efforts to Vieques to collect detailed information about the benthic habitats, fish, and invertebrate communities. Spatially comprehensive information on reefs and hardbottom is vital to future management of the marine resources around Vieques. The collected data will be used to quantify the abundance and spatial distribution of fish, corals, and benthic invertebrates on hardbottom habitats around Vieques. Further, with regular monitoring, changes in the composition and condition of Vieques reefs over time can be detected.
Support for Integrated Ecosystem Assessments of NOAA’s National Estuarine Research Reserves System (NERRS), Volume II: Assessment of Ecological Condition and Stressor Impacts in Subtidal Waters of the North Carolina NERRS
Cooksey, Cynthia and Hyland, Jeff and Wirth, Ed and Balthis, W. Leonard and Fulton, Mike and Whitall, David and White, Susan
web site A study was conducted to assess the status of ecological condition and potential human-health risks in subtidal estuarine waters throughout the North Carolina National Estuarine Research Reserve System (NERRS) (Currituck Sound, Rachel Carson, Masonboro Island, and Zeke’s Island). Field work was conducted in September 2006 and incorporated multiple indicators of ecosystem condition including measures of water quality (dissolved oxygen, salinity, temperature, pH, nutrients and chlorophyll, suspended solids), sediment quality (granulometry, organic matter content, chemical contaminant concentrations), biological condition (diversity and abundances of benthic fauna, fish contaminant levels and pathologies), and human dimensions (fish-tissue contaminant levels relative to human-health consumption limits, various aesthetic properties).

28
Appendix B: Perdido Bay Analysis
Integrated Ecosystem Assessment (IEA) of coastal lagoons in Perdido Bay, Florida
By Just Cebrian, Dauphin Island Sea Laboratory
Introduction
The 3 lagoons studied (State Park, Kee’s Bayou and Gongora) are located within Perdido Bay, Florida, USA. The lagoons are moderate in size and, as typically found for other coastal lagoons, they are shallow and connected to a sound through a relatively narrow mouth (Figure B1). The lagoons also have other similar physical properties (Figure B2).
Figure B1. Study sites located in NW Florida, USA

29
Figure B2. Selected water-column physical parameters in the three lagoons from 2001 to
2003. Data are mean ± SE. Closed circles correspond to State Park, closed squares to Kee’s Bayou and inverted open triangles to Gongora.

30
Management and Policy Questions
Increasing human development of the watershed and the negative environmental impacts that follow is by far the most worrisome management concern in the Perdido Bay area where the lagoons are located (Figure B1). Local officials and neighbors are now trying to come up with strategies of coastal development that preserve the environmental quality of their coastal waters. In other words, how can we guarantee that the health, productivity, glamour and ecosystem services and benefits of pristine lagoons, bayous and bays are maintained when developing them for human use? How can we assure that human development of coastal watersheds in the area is environmentally and economically-sustainable? These are the questions that guide our IEA efforts in Perdido Bay. The following excerpts exemplify this salient management need in the area;
“The Perdido Key Neighborhood Plan was a huge piece of work by many organizations, professionals and county staff. This is the vision of the community for the future growth of Perdido Key. The County Commissioners adopted it, however they have been slow to fund and implement it. We are constantly bringing their attention back to the commitments made in the PKNP since it originated in 1997. The Plan encourages responsible, quality growth on the Key with a balanced mixture of residential and commercial development while maintaining its character as a family oriented beach community. The Plan addresses land use, hurricane evacuation, transportation, signage, community center, public waterfront access areas and gateway areas.”
“Perdido Key Association Partners With Perdido Key State Park to Host the 2009 International Coastal Cleanup Saturday, September 19, 2009 - Registration 8am until 12 at the West Beach State Recreation Area, Perdido Key. The International Coastal Cleanup is the world's largest volunteer effort to help protect the ocean. Last year, nearly 400,000 volunteers hit their local beaches, lakes, and rivers with a common mission of improving the health of the ocean and waterways. On one day, they removed and tallied 6.8 million pounds of debris, from 6,485 sites in 100 countries and 42 U.S. states and the District of Columbia.”
Excerpts From the Perdido Key Association Web Page (http://www.perdidokeyassociation.org). The Association is committed to the orderly growth of Perdido Key
We follow a three step approach to shed light on those questions. First, we have been studying the impacts of increasing human development on the health of coastal lagoons in the region. Second, we have been coming up with tools and strategies to alleviate negative impacts. Third, we are working with local officials and residents to implement those tools.
Drivers and Pressures
The watersheds of the lagoons have different degrees of human occupation (Figure B3). The State Park site, as the name indicates, resides within Big Lagoon State Park, Florida (30.308° N, 87.403° W) and represents the most pristine lagoon with the least amount of human alteration. It is entirely surrounded by salt marsh (predominantly Juncus roemerianus) and maritime forest with no residential development. Kee’s Bayou (30.313° N, 87.469° W) is developed on the northern and eastern sides (i.e. condominium

31
complex and houses) and bordered by marsh vegetation on the southern and western sides. In addition, a 2 m wide channel that runs along the center of the lagoon is periodically dredged for navigation. Finally, Gongora (30.305° N, 87.424° W) is bordered by residential development on its northern and eastern sides and by marsh vegetation on the southern and western sides, although a newly developed condominium lies behind that marsh vegetation. Furthermore, a culvert that serves as a flushing point for an 18-hole golf course opens up at the northern tip of the lagoon. The lagoon is periodically dredged along its central axis for navigation, which, given the narrow, spindle shape of the lagoon, has a large impact in the lagoon.
The higher intensity of watershed development results in higher nitrogen loading into the lagoon from sources such as fertilized lawns, culverts and pipes, atmospheric deposition, and tidal import when we compare State Park (4.2 Kg N ha-1 yr-1) to Kee’s Bayou (25.7 Kg N ha-1 yr-1) to Gongora (27.7 Kg N ha-1 yr-1; Stutes et al. 2007, Lehrter and Cebrian 2009). In turn, higher nitrogen loading leads to the accumulation of phytoplankton and particulate organic matter in the water column, which shades the benthic macrophytes (i.e. seagrasses) that grow at the bottom and profoundly alters the ecological functioning, metabolism and nutrient cycling in the lagoons (Cebrian et al. 2009a). On top of this, the intensity of dredging also increases from State Park to Kee’s Bayou to Gongora, which furthers contributes to the shading of benthic macrophytes and environmental alteration in the lagoons. Therefore, nutrient pollution and dredging are the most important pressures of environmental change in these three lagoons (Table B1), as local officers and neighborhood associations have recognized. We have also studied the numerous impacts of these two pressures on the environmental well-being of the lagoons (a selection of
State Park Kee’s Bayou Gongora
Increasing human development in the watershed
Figure B3. Watershed development in the three lagoons studied

32
impacts is provided in Appendix) and we are now working with local officers, development planners, builders, neighbors and state and federal agencies to develop strategies for an environmentally- and economically-sustainable human use of coastal watersheds in the Perdido Bay region.
Conclusions/Next Steps
After ca. 10 years of research in the Perdido Bay area, we know well the specific drivers and pressures of interest to the local constituency (Table B1). We have also studied some of the impacts of those pressures (Appendix) and we are now in the process of applying our knowledge to help local officers create strategies for the environmentally- and economically-sustainable development of their watersheds and coastlines. Towards that end, we are working with officers from NOAA and the Corps of Engineers to develop Russell’s Bayou (which is adjacent to Kee’s Bayou, Figures B1 and B3) in an environmentally-friendly way.
Our next steps are to continue the study of impacts on these three lagoons and others in the area of the drivers and pressures listed in Table B1 and others that could become important (e.g. sea level rise), particularly the synergistic impacts of diverse pressures acting concomitantly. Such a comprehensive analysis is essential for the creation of environmentally- and economically-responsible policies of human occupation of coastal watersheds, as well as for adaptive strategies to potential new climate scenarios such as increased sea level rise or frequency of extreme weather events.

33
Table B1. Drivers (Columns) and Pressures (Rows) in the lagoons studied at Perdido Bay. Bolded signs (P) denote stronger pressures
Hydrologic Modifications
Climate Human-Related Processes
Exploration
& naviga
tion canals
Flood levee &
dam constru
ction
Freshwater diversi
on
Sea Level Rise/Subs
idence
Extreme
Weather Even
ts
Variability
Local Population Size
Trade/Industry
Socio-Politic
al- Educational
Perceptions
Tourism/Recreation
Increased nutrients (point and non-point)
P P
Increased pollution (point and non-point)
P
Increased dredging
P
Increased fishing effort
P
Increased boat traffic (wakes,
P

34
grounding, and anchoring)
Increased urban/coastal development
P P P
Habitat Degradation
P
References Stutes, J. P., J. Cebrian, A. L. Stutes, A. Hunter and A. A. Corcoran. 2007. Benthic metabolism across a gradient of anthropogenic impact in three shallow coastal lagoons in NW Florida. Mar. Ecol. Progr. Ser. 348: 55-70; Cebrian, J., Corcoran A. A., A. L. Stutes, J. P. Stutes and J. Pennock. 2009a. Effects of ultraviolet-B radiation and nutrient enrichment on the productivity of benthic microalgae in shallow coastal lagoons of the North Central Gulf of Mexico. Journal of Experimental Marine Biology and Ecology 372: 9–21; Cebrian, J. , G. A. Miller, J. P. Stutes, A. L. Stutes, M. Miller and K. Sheehan. 2009b. A comparison of fish populations in shallow coastal lagoons with contrasting shoalgrass (Halodule wrightii) cover in the North Central Gulf of Mexico. Gulf and Caribbean Research 21: 57-61 Lehrter, J. C. and J. Cebrian.2009. Uncertainty propagation in an ecosystem mass balance budget. Ecological Applications (In Press)
Appendix to Appendix B Some Impacts State Park has a healthy population of the seagrass Halodule wrightii (known as shoalgrass), with ca. 65% of the bottom in the lagoon covered by the seagrass. Intense shading in Kee’s Bayou and dredging has reduced the extent of shoalgrass to only ca. 5% of the bottom covered. Due to intense shading and the proportionally larger effect of dredging (i.e. narrower lagoon), there is no shoalgrass present in Gongora (Stutes et al. 2007). The decrease in shoalgrass cover from State Park to Kee’s Bayou to Gongora reduces the provision of habitat for numerous adult and juvenile fishes (Figure B4; Cebrian et al. 2009b). In contrast, system-integrated benthic net community productivity (i.e. the net uptake of CO2), and thus the potential for the system to act as a carbon sink, does not differ across the three lagoons (Figure B5) because, as microalgae accumulate and shoalgrass declines with higher nitrogen loading, both system-integrated benthic gross primary productivity and benthic respiration

35
decrease such that the net balance between the two processes (i.e. system-integrated benthic net community productivity) remains unaltered (Stutes et al. 2007). These results indicate that the impacts of nutrient enrichment on the services provided by shallow coastal systems may be disparate. The effects of rising nutrient pollution on the benefits that humans obtain from natural ecosystems will vary depending on the targeted benefit. Thus, the design of policies to manage coastal ecosystems under increasing eutrophication will depend on what ecosystem services are regarded as priorities by policy makers.
Figure B4. Box plots of abundance of (A) tidewater silversides, (B) juvenile pinfish, and (C) the fish population in State Park (SP), Kee’s Bayou (KB) and Gongora (G) in mid September and late October. Boxes encompass the 25% and 75% quartiles, and the central line represents the median, for the sixteen seines in each lagoon on each date. Bars encompass the range of values between (1) the 25% quartile minus 1.5 times the difference between the quartiles 75% and 25% and (2) the 75% quartile plus 1.5 times the difference between the quartiles 75% and 25%. Circles represent values outside these limits.

36
Figure B5. System-integrated (weighted) rates of benthic gross primary productivity (GPP), respiration (R ) and net community productivity (NP). Bars: SE of weighted rate. Letters: significant differences (p ≤ 0.01)

37
Appendix C: Mississippi Sound Analysis Preliminary report on Drivers and Pressures for an Integrated Ecosystem Assessment (IEA) of the coastal Northcentral Gulf of Mexico Ecosystem. IEA working group – Mississippi Richard Fulford, USM Department of Coastal Sciences Steve Lohrenz, USM Department of Marine Science Mark Peterson, USM Department of Coastal Sciences Jill Hendon, USM Center for Fisheries Research and Development An Integrated Ecosystem Assessment (IEA) is an informational document intended to convey the dominant or consensus components of a clearly defined ecosystem that influence the health and resiliency of the system. This report details the findings of a scoping effort for an IEA of the state of Mississippi’s coastal zone. The spatial scope for this effort extends from the Mississippi/Alabama state line in the east to the Mississippi/Louisiana state line in the west; and from the southernmost boundary of the barrier island chain north to an arbitrary line located near Hattiesburg, MS. The northern boundary of this area was a subject of much discussion and is not considered absolute. Rather this boundary is considered driver-dependent as the influence of the watershed on the coastal system may vary. The Mississippi Sound ecosystem (MSE) is comprised of Mississippi Sound (MS) and the connected coastal watersheds that feed into MS from the three principal embayments (St Louis bay, Biloxi bay, and the Pascagoula river distributary). The MSE includes the entire coastal zone of Mississippi. The natural coastal boundary of MSE is comprised of sinuous bayous fringed by emergent brackish marsh plants (e.g., Spartina spp., Junctus spp.) rooted in fine sediment mixed with sand. The MSE is bounded on the southern side by barrier islands comprising sandy beach habitat mixed with both emergent marsh and SAV (e.g., Ruppia spp.). Both the barrier islands and the coastal marshes have been substantially altered by human activities such as shore line hardening and dredging, as well as natural climatic events such as hurricanes.
Mississippi Sound is the dominant aquatic feature within the MSE and represents a link between terrestrial component of the MSE and the Gulf of Mexico. Mississippi Sound is a shallow partially stratified estuary that is variably influenced by the Gulf of Mexico (i.e., marine) principally through the barrier islands passes, and the coastal watershed (i.e., freshwater) principally through the six major rivers that connect to the Sound and the Mississippi river via Lake Pontchartrain in Louisiana. The tidal influence within MS is low (< 0.75 m) and often overwhelmed by wind driven tides particularly between November and January. The relative importance of marine and freshwater influence to the Sound changes seasonally, as well as daily in response to climatic variability and freshwater diversion; and affects species distributions, species production and spawning success, aquatic nutrient concentrations, water clarity, and even human health.

38
Mississippi Sound is home to commercially important fisheries for shrimp, oysters, and menhaden; and diverse recreational fishing accounting for over 1 million angler trips per year. Most importantly for natural resource production, Mississippi Sound and the adjacent embayment’s serve as an important nursery area for all of these natural resource groups. In addition, coastal development within the MSE is a primary driver for tourism and recreation, interstate commercial shipping through Gulfport and Pascagoula, Pascagoula shipyards, and oil and gas refining.
The scoping effort for this report was structured based on the DPSIR (Driver, Pressure, State, Impact, Response) framework (NOAA 2008) for partitioning factors of importance based on their interrelationships. Under this system factors can be labeled as Drivers, Pressures, measures of ecosystem State, measures of Impact, or measures of ecosystem Response to management. The objective of this effort is to indentify important Drivers and Pressures for the ecosystem defined above as a starting point for a complete DPSIR delineation. A scoping workshop was held August 26, 2009 at the Gulf Coast Research Laboratory in Ocean Springs, MS to solicit stakeholder input on the important Drivers and Pressures for the Mississippi Sound ecosystem (Figure C1). This workshop was attended by a wide array of interest groups and the following material represents a synthesized list of workshop outcomes. This list was developed by the Mississippi IEA working group based on workshop data and only considers the dominant or consensus values for Drivers and Pressures. A complete list of workshop output is given in Appendix A.
An introductory presentation was given at the workshop by Dr. Richard Fulford intended to give workshop participants some background on the IEA and DPSIR framework as well as a working definition of Drivers and Pressures. For purposes of discussion Drivers and Pressures were differentiated in the following manner: Driver – Measurable but not generally manageable (What do we need to know?) Pressure – Measurable and at least partially manageable (What do we need to change or preserve?) In addition, the workshop group was asked to list important data needs based on the list of Drivers and Pressures. This input was used to develop a list of preliminary Indicator variables mapped to specific Drivers. Results The results of this effort, based primarily on the scoping workshop hosted by the Gulf Coast Research Laboratory, are summarized in Table C1. Workshop attendees were asked to list and then rank Drivers and Pressures for the MSE and the results below represent the consensus output of these lists with minor editing and additions by the Mississippi IEA working group. The results therefore represent the collective wisdom of a wide array of interests and several decades of experience with issues in MSE. The important Drivers and Pressures for the Mississippi Sound ecosystem can be separated into Hydrologic Modifications, Climatic Factors, and Human-Related Processes. The broad opinion of the group was that coastal land use is the most important factor influencing the MSE. Land use was partitioned into two Pressures broadly defined as Urban/Coastal Development and Critical Habitat

39
Degradation. These two pressures were related to several key Drivers; Local Population Size, Trade/Industry (e.g., fishery, tourism, manufacturing), Socio-Political-Educational Perceptions, and Climatic Variability. In particular the effects of Climatic variability in the form of severe storm events was highlighted as an important Driver of coastal land use with the most significant influence occurring in the period after a severe storm when large scale remediation efforts (e.g., shoreline repair/protection, debris removal) will occur, as well as a significant reshuffling of land use distributions as user groups enter or leave the impacted area (e.g., new development, changes in flood maps).
The second most important factor discussed was variability in freshwater flow and its consummate influence on sediment delivery and redistribution within the MSE. Freshwater flow is primarily controlled by the Hydrologic drivers of Freshwater Diversion, Flood Levee & Dam Construction, and the dredging of Exploration and Navigation Canals, but is also influenced by Climatic Variability. These in turn result in several pressures; Altered Riverine Input, Altered Internal Wetland Connectivity, and Increased Fishing Effort as most commercially viable species are influenced by spatial distribution of optimal salinity. Freshwater pressures are also influenced by Human Related Processes such as Local Population Size, Socio-Political-Educational Perceptions of coastal residents, economic drivers such as Trade/Industry and Tourism/Recreation development.
The most important Industrial factors were shipping activity and commercial fishing. These factors include pressures for Increased Boat Traffic due to commercial navigation and ship building, as well as Increased Fishing Effort. In turn these pressures are related to hydrologic Drivers: development of Exploration and Navigation Canals and Freshwater Diversion; and Human-Related Drivers: Local Population Size, and Trade/Industry. Climatic Drivers were not rated as important in this case but may still have an effect through influences on accessibility of Sea Level Rise/Subsidence and/or Extreme Weather Events.
The most important biological factor was biodiversity, which is related to the Hydrologic Driver of Freshwater Diversion, the Climatic Driver of Variability, and the Human Related Driver of Local Population Size. This factor is largely related back to land-use pressures already mentioned and it was a source of discussion whether it should be included independently. Ultimately it was included based on the point that biodiversity influences habitat quality for natural resources and thus is not simply an effect of other things already mentioned.
The final broad factors discussed were pollutants and toxicants, which were separated into internal and external source groups. Internal sources represent a pressure on the ecosystem related to Human-Related Drivers: Local Population Size, Trade/Industry, and Tourism/Recreation. External pollutant sources represent a Driver on the ecosystem as they are delivered into the system via the airshed or watershed. This Driver is related to both Climatic and Hydrologic Drivers and was removed from the overall table for that reason. However, this driver was identified by the Mississippi Sound IEA workshop as being an important for the MSE.
The workshop group also examined priorities for the development of Indicators of Impact and State as defined under the DPSIR framework. The consensus view of the working group was that data regarding land use/land cover particularly temporal/spatial patterns in coastal land use is the biggest priority for an assessment of ecosystem state. Several small studies have been completed in MSE that measured current amounts of hard shoreline (Peterson et al. 2000; Partyka and Peterson 2008), as well as studies that have predicted the impact of changes in the amount of living shorelines on fish

40
production (Jordan et al. 2009). However, a comprehensive study involving remotely sensed data closely coordinated with quantitative modeling efforts is warranted.
Literature Cited Jordan, S.J., L.M. Smith, and J.A. Nestlerode (2008). Cumulative effects of coastal habitat alterations on
fishery resources: toward prediction at regional scales. Ecology and Society 14(1):16. [online] RUL: http://www.ecology and society/vol14/iss1/art16/
NOAA. 2008. Integrated Ecosystem Assessments. NOAA Technical Memorandum NMFS-NWFSC-92
Partyka, M.L. and M.S. Peterson. (2008). Habitat quality and salt marsh species assemblages along an anthropogenic estuarine landscape. Journal of Coastal Research 24(6):1570-1581.
Peterson, M.S., B.H. Comyns, J.R. Hendon, P.A. Bond, and G.A. Duff. (2000). Habitat use by early life-history stages of fishes and crustaceans along a changing estuarine landscape: differences between natural and altered shoreline sites. Wetlands Ecology and Management 8(2/3):209-219.

41
Table C1. Important Drivers and Pressures for the Mississippi Sound ecosystem with related preliminary indicators. Pressures are mapped back to at least one Driver by numbers in parentheses. Pressures (by letter) are then listed with their respective indicators.
Drivers (measurable but not manageable
Pressures (measurable and manageable
Indicators (measurable and needed to manage pressures)
1) Population size 2) Product demand (natural and manufactured) 3) Environmental variability (Salinity, temperature, SSH) 4) Politics/Education 5) Sediment budget 6) Hydrology (amount and variation in freshwater flow) 7) Pollutants and toxicants (Non-regional origin)
a) Land use (1, 2, 4) b) Nutrient influx (1, 3, 6, 5) c) Fishing effort (1,2,3,4, 7) d) Shipping/navigation (1, 2, 4, 3) e) Habitat loss/alteration (1, 2, 3, 4) f) Protective measures/mitigation (1, 2, 3, 4) g) Freshwater inflow (1, 2, 3, 5, 6) h) Tourism/recreation (2, 3, 5) i) Biodiversity (1, 3, 4, 5, 6, 7) j) Pollutants and toxicants (Regional origin; 1, 2, 4, 7)
a) Relative proportion – natural, restored, urbanized, altered by area b) Nutrient load (mg/d) from index watershed (Pearl, Pascagoula; see g) c) Catch per unit effort either by sector or for an index sector (e.g., shrimp) d) tonnage/yr commercial to index port (e.g., Pascagoula) AND boat-days of recreational usage from index port (e.g., Biloxi harbor) e) Change in (a) through time for index zone (e.g., Bay St Louis/Pascagoula distributary) f) Changes in (a) planned and/or occurring in the five year period following a major storm event. g) Seasonally-adjusted mean flow normalized to precipitation rate for index river (e.g., Pearl, Pascagoula) h) Tax revenue for index portion of coastal gaming system split between residence and non-residence revenue AND boat-days of recreational boat use (see d). i) Species richness of index guilds (e.g., benthic invertebrates, salt marsh residence spp.) j) Concentration of index elements in water column of MS Sound corrected for external sources based on (g).

42
* Three dominant variables of regional importance for environmental variation. This includes both short-term (e.g., hurricanes) and long-term (e.g., sea level rise) variation.
Figure C1. Geographic scope of Mississippi component of the regional IEA. Circles indicate candidate index systems and are subject to change based on IEA development.

43
Appendix A to Appendix C – Complete list of participants and output for IEA scoping workshop as well as the comprehensive list of Drivers and Pressures suggested and discussed during the workshop. The list in Table C1 is based on a consensus ranking at the end of the workshop.
IEA Workshop participant Affiliation
Alice Dossett MDEQ
Barbara Viskup MDEQ
Becky Allee Gulf Coast Services Center
Ben Posadas MSU CREC
Bradley Randall MDMR
Brent Hales USM-EWFD
Buck Buchanan MDMR
Chet Rakocinski USM COA
Chris Boyd MS/AL SEAGRANT
Corky Perret MDMR
Dale Diaz MDMR
Daniel Stuart MDEQ
David Burrage MS/AL SEAGRANT
Erick Porche MDMR
Jack Moody MS Development Authority
Jill Hendon USM CFRD
John Harding NGI
John Mitchell MDMR
Julien Lartigue NGI
Kim Caviness MDEQ
Mark Peterson USM COA
Mark Woodrey Grand Bay NEER
Mary McKay MDEQ
Mike Murphy The Nature Conservancy
Nick Gatian MDEQ
Patrick Biber USM COA
Paul Grammer USM COA
Read Hendon USM Center for Fisheries Reseaech and Development
Richard Fulford USM COA
Scott Milroy USM MAR
Shiao Wang USM BIO
Stephan Howden USM MAR
Stephen Brown MS Dept of Wildlife Fisheries and Parks
Stephen Sempier MS/AL SEAGRANT
Steven Lohrenz USM MAR
William Underwood Grand Bay NEER

44
Drivers Pressures -Population Growth -Hydrology -Rainfall -Wind -Product Demand -Storms -Temperature -Sea Level Rise -Economic Pressure -Coastal Life-Style -Natural Resource Prod. -Technology -Biodiversity -Fisheries Demand -Population Size/Density -Coastal Development -Maritime Industry -Fishery State -1 2 Production -Respiration -T,S,DO,Nut,Turbidity -Contaminant Conc. -Sediment Dynamics -Habitat Availability -Erosion/Accretion -Stratification -Governing (interagency/state) -Alternative Energy -Hydrodynamics
-Effluent Discharge -Protection Measures/Mitigation -Freshwater Inflow -Habitat Loss -Dredging -Nutrient Influx (nat. vs. anthro) -Land Use/Change -Sea Level Rise -Pollutant Spills -Overfishing -Air Pollution -Fishing -Recreational Use -Shipping Transportation Navigation Ports -Aquaculture/Mariculture -Endangered Species -Invasive Species -MS River Impacts -Population Growth -Tourism -Coastal Development Policies -Water Use/Quantity -Physiological Stress -Ranges and Distribution -Food Sources/Trophic Potential -Nutrient Recycling -Pathogens -Hydrology-Human Influence -Natural Habitat Loss

45
Drivers Pressures -Economic Base Shift -Transportation -Climate Change -*Education -Politics Driving Development -Economics -Globalization
-Sediment Budgets -Pollution/Contamination -Nursery Grounds -Lack of Fire -Rehabilitation Green Space -Flood Control -Mineral Excavation -Alternative Energy -Litter -Pathogens -Weather -Wetland Loss -Development (new, re, abandoned,inland) -Contaminant Event -Hunting

46
Appendix D: Barataria Basin Analysis
Integrated Ecosystem Assessment
Barataria Basin, Louisiana
This report details the primary drivers and pressures in the Barataria Basin system. Drivers and pressures are defined by the NOAA Integrated Ecosystem Assessment Driver-Pressure-State-Impact-Response (DPSIR) Framework. Future work will include identifying the other components of the DPSIR framework, including state variables, impacts, and responses.
Sara Green, Alaina Owens, Erick Swenson Louisiana State University Department of Oceanography & Coastal Sciences

47
INTRODUCTION The Barataria Basin is an irregularly shaped bar-built estuary, approximately 120 km in length, located
west of the Mississippi River in southeastern Louisiana. It is bounded on the north and east by the
Mississippi River, on the west by Bayou Lafourche, a former distributary channel of the Mississippi River,
and on the south by a barrier island chain and the Gulf of Mexico. The basin has several freshwater
diversion sites (Davis Pond, Naomi, and West Pointe à la Hache) designed to moderate salinities and re-
introduce Mississippi River water (Figure D1). The basin consists of a foundation of pro-delta clay
deposits overlain by a mixture of swamp forest, fresh, intermediate, brackish, and saline marshes,
barrier islands, natural levees, and former distributary channels of the Mississippi River (Coleman et al.,
1998). The basin contains approximately 616 km2 of freshwater swamp forest, 701 km2 of fresh marsh,
241 km2 of intermediate marsh, 416 km2 of brackish marsh, and 541 km2 of saline marsh
(www.lacost.gov). For basic definitions of Louisiana’s coastal types, please refer to America’s Wetland
Resource Center
(http://www.americaswetlandresources.com/wildlife_ecology/plants_animals_ecology/wetlands/Ty
pesofWetlands.html).
The basin spans approximately 6,300 km2, including portions of nine governmental parishes (Ascension,
Assumption, Jefferson, Lafourche, Orleans, Plaquemines, St. Charles, St. James, St. John the Baptist).
Between the 2000 census and 2008 almost half of the parishes decreased in population size
(Assumption, Jefferson, Orleans, and Plaquemines) and the other five parishes had small relative
increase in population size (http://louisiana.hometownlocator.com/census/index.cfm). Orleans,
Jefferson, and Plaquemines Parishes were severely affected by hurricanes in 2005 and 2008.

48
Figure D1. Map of Barataria Basin, Louisiana.
Fresh and salt water fishing, crabbing, shrimping, and hunting are all important recreational and
commercial activities supported by the various habitats within the Barataria Basin. Approximately 735
species of birds, finfish, shellfish, reptiles, amphibians, and mammals spend all or part of their life cycle
in the basin (BTNEP, 1992). Tourism is also important to Louisiana, drawing nearly 20 million visitors a
year; a high proportion of travelers in Louisiana are either in-state residents or from nearby southern
states (TNS Report, 2008).
Hydrologic modification in coastal Louisiana has significantly altered Barataria Basin. Since the flood of
1927, the increasing containment levees of the Lower Mississippi River have essentially eliminated the
overbank contribution of freshwater and sediment that occurred when the river overflowed its banks
seasonally, flooding the surrounding wetlands (Kesel, 1989; Snedden et al., 2007).
Man-made waterways also disrupt natural water flow patterns. In the 1920s construction on the Gulf
Intracoastal Waterway began, crossing Barataria Basin from east to west, separating the upper (fresh)
wetlands from the lower (saline) wetlands. The Barataria Waterway navigation channel cuts north-
south through the Basin, providing a more direct connection between the upper and lower wetlands.
Hydrodynamic model results presented by Inoue et al. (2009) indicate that the Barataria Waterway

49
serves as a primary conduit in bringing freshwater from the Davis Pond diversion to the lower basin.
Many smaller navigation channels, canals, and natural waterways crisscross the basin, further
complicating water flow patterns (Figure D2). At the northern end of the basin, Highway 90 and freight
railroad beds cut off historical drainage patterns from the upper to middle basin. To the west, Bayou
Lafourche, a former distributary of the Mississippi River was dammed in 1905, decreasing its freshwater
and sediment input to Barataria wetlands. In addition, there are 11 failed agricultural impoundments
within the basin, which are currently large open water areas (Turner and Streever, 2002).
Figure D2. A portion of Barataria Basin showing a number of hydrologic modifications, including oil and
gas canals, navigation channels, and impounded wetland areas.
Since the construction of the flood control levees along the Mississippi River, precipitation had been the
primary source of freshwater to Barataria Basin. Average annual precipitation for the southeastern
Louisiana coastal area is approximately 175 cm (Swenson et al., 2004). Sklar (1983) estimated that
approximately 40 percent of the precipitation becomes available for runoff, with most of the surplus
occurring in winter, and deficits most likely to occur during the summer. Swenson and Swarzwzenski

50
(1995) estimated the precipitation derived input the basin is ~200 m3 s−1. A small amount of riverine
input, designed to mimic a natural crevasse, was recently introduced into the basin's lower wetlands
through siphons at Naomi and West Pointe à la Hache in 1992. These have been working at a maximum
pumping rate of 60 m3 s−1 of freshwater into the basin at each site. The Gulf Intracoastal Waterway
(GIWW) also serves as a conduit to deliver freshwater from the Atchafalaya River to the Barataria
estuary. Swarzenski (2003) indicated that the GIWW has an average flow of about 60 m3 s-1. A larger
diversion site, Davis Pond, was opened in 2002 with a maximum design-pumping rate of 300 m3 s−1 of
freshwater. An analysis of operation data from 2002 through 2005 indicated a base flow of ~10 m3s-1,
with occasional higher discharge events of ~50 m3s-1 (Swenson et al., 2006). Lower Barataria Basin also
receives water from the Mississippi River from the southern end, as indicated by the inverse relationship
between river discharge and salinity near Grand Isle, LA. This inverse relationship between Mississippi
river discharge and Louisiana coastal salinities was first mentioned by Geyer (1950). Barrett (1971) and
Gagliano et al. (1973) further described this inverse relationship using linear statistics. Wiseman et al.
(1990) used Auto-Regressive Moving Average (ARMA) models to analyze the relationship between
weekly discharge of the Mississippi River and Louisiana coastal salinities. The river discharge portion of
the models accounted for 30 to 50% of the variance of the observed salinity data. The results were
consistent with a conceptual model in which Mississippi River discharge alters coastal salinities, which in
turn propagates up-estuary and westward along the coast (Wiseman et al., 1990).
There is a wide salinity distribution in Barataria Basin, ranging from freshwater in the upper reaches to
15 ppt in mid-basin and to 25 ppt at the coast (Swenson and Turner, 1998). Swenson and Turner (1998)
developed empirical statistical models to explain the seasonal isohalines in the Barataria estuary using
coastal water levels, Mississippi River discharge, and local (New Orleans) precipitation from 1980
through 1995. The models were able to explain ~50% of the variance of the observed data, and
indicated that a change from low rainfall to high rainfall can shift isohalines by 10-20 km. This makes the
Barataria System unique since it has a freshwater input at both ends of the estuary and is strongly
influenced by the Mississippi River in the southern portions.
Oil and gas is a major industry in Louisiana. Louisiana currently ranks fourth in the nation in the
production of crude oil and Southern Louisiana (including Barataria Basin) accounts for the majority of
that total (Mckenzie et al., 1995). The Caminada-Moreau Headland along the Barataria shoreline
protects the highest concentration of near-gulf oil and gas infrastructure in the Louisiana coastal area

51
(US ACE, 2004) Louisiana. Established in 1960 near the terminus of Bayou Lafourche, Port Fourchon has
become one of the largest ports in the U.S. servicing the oil and gas industry. Annually, 675 million
barrels of oil are transported via pipeline through the port, furnishing the nation with 15-18% of its oil
supply (http://www.portfourchon.com/site100-01/1001757/docs/annual_report-_pdf_copy.pdf). The
Louisiana Offshore Oil Port (LOOP) facilities are located in and offshore of the Barataria Basin system.
The complex consists of an offshore (~30 km) marine terminal and an underground storage facility in the
Clovelly salt dome, near Galliano and a large diameter pipeline system, including a booster pump near
Fourchon, to deliver oil to the storage facility (Sasser and Visser, 1998).
MANAGEMENT AND POLICY QUESTIONS
The primary management concerns for Barataria Bain are wetland loss and habitat
degradation. Physical factors such as subsidence and the loss of river sediments into the
Barataria estuary, as well as the multiple changes to the basin’s natural hydrology have
contributed to wetland loss, increased flooding, and associated socio-economic losses (such
as farming, fisheries resources, hunting activities, nature tourism). Hydrologic
modifications have also led to a loss of habitat for fish, wildlife and other biota, a decrease
in water quality needed to sustain a variety of terrestrial and aquatic systems, the
introduction of toxic substances into waterways, and stressed swamp forests (cypress-
tupelo). Historic wetland loss in the Barataria basin from 1956 – 2006 is 806 km2 (Barras
et al., 2008).
A breakdown of land loss and loss rates follows:
1956-1978 = -442.9 km2 or -20.1 km2/yr
1978-1990 = -220.2 km2 or -18.2 km2/yr
1990-2001 = -108.8 km2or -9.9 km2/yr
2001-2004 = -15.5 km2 or -5.1 km2/yr
2004-2006 = -18.1 km2 or -9.2 km2/yr
In 1991, the Barataria-Terrebonne National Estuary Program (BTNEP) was established, with the goal of
developing management and policy goals for the restoration and preservation of the Barataria and
Terrebonne Estuaries (BTNEP, www.btnep.org). The ecological management action plans developed by

52
BTNEP directly address priority problems identified for the Barataria estuary. Constructed as a
“Comprehensive Conservation Management Plan” as a compact between the public and the Estuary
Program, the action plans are listed below under four sub-headings, Habitat Management, Water
Quality, Living Resources, and Accessible and Compatible Data Sets:
Habitat Management - actions which address the issues of water and sediment flows, habitat loss, and
marsh protection
• Action Plan EM-1: Hydrologic Restoration
• Action Plan EM-2: Freshwater and Sediment Diversions
• Action Plan EM-3: Evaluate the Effectiveness of Reactivating Bayou Lafourche as a Distributary
Channel of the Mississippi River
• Action Plan EM-4: Beneficial Use of Dredged and Non-Indigenous Material
• Action Plan EM-5: Preservation and Restoration of Barrier Islands
• Action Plan EM-6: Shoreline Stabilization and Induced Sediment Deposition
• Action Plan EM-7: Marsh Management
Water Quality - actions which identify water quality problems and protect water resources
• Action Plan EM-8: Nutrient, Bacteria and Toxic Contaminant
• Action Plan EM-9: Oil and Produced Water Spill Prevention and Early Detection
• Action Plan EM-10: Reduction of Sewage Pollution
• Action Plan EM-11: Reduction of Agricultural Pollution
• Action Plan EM-12: Storm Water Management
• Action Plan EM-13: Contaminated Sediment Data Base
• Action Plan EM-14: Assessment of Toxic and Noxious Phytoplankton Blooms
Living Resources - actions which address problems associated with the plant and animal life of the
estuary
• Action Plan EM-15: Protection of Habitat for Migratory and Resident Birds
• Action Plan EM-16: Reduction of Impacts from Exotic Vegetation

53
• Action Plan EM-17: Zebra Mussel Monitoring and Control
Accessible and Compatible Data Sets - actions which address the need for a centralized accessible body
of scientific information about the estuary and its problems
• Action Plan EM-18: Centralized Data Sets
The Drivers and Pressures outlined in the next section are adapted and modified from the BTNEP estuary compact
and its ecological management action plans.
DRIVERS AND PRESSURES
The entire NOAA Integrated Ecosystem Assessment process follows the Driver-Pressure-State-Impact-
Response (DPSIR) framework. This report only addresses drivers and pressures in Barataria Basin, not
state variables, impacts, or responses. The categories were made broad so they can apply not only to
the Barataria system, but also to our joint systems (Perdido Bay, Florida and Mississippi Sound,
Mississippi). We used broad, big picture, terms for the drivers and pressures, so that each group could
address the specifics of their particular system.
The three primary drivers are hydrologic modification, climate, and human-related processes, and
there are a number of ‘sub-drivers’ under each. This section is arranged by sub-drivers (columns in
Table D1) and associated pressures (rows in Table D1).
Hydrologic Modification
Dredging of exploration and navigation canals alters internal wetland connectivity by direct wetland
removal, redirecting water flows from overland to more of a channelized pattern, providing a more
direct conduit for salt water intrusion, and by isolating areas of wetlands via dredged material banks
(impoundments). These channels also increase boat traffic damage (wake, grounding, and anchor-
related).
Flood levees and dam construction alter riverine (Mississippi River and Bayou Lafourche) input by
cutting off freshwater, sediment and nutrient input that is needed to sustain the Barataria wetlands.
They alter internal wetland connectivity by isolating some wetland areas. Flood levees have also

54
increased coastal development pressures, by reducing flood frequency and impacts, and thus making
these areas more appealing to developers.
Freshwater diversions have been initiated as a management tool to ameliorate the effects caused by
leveeing the Mississippi River. They reconnect the riverine resources to the wetlands in a small-scale and
controlled manner. They are vehicles for introducing freshwater, nutrients, and pollutants.
Climate
Sea level rise and subsidence act together to decrease land elevation which alters internal wetland
connectivity and increases connectivity to the Gulf of Mexico.
Extreme weather events such as river floods, increase riverine input to the basin. Hurricanes and severe
tropical storms alter internal wetland connectivity and decrease land elevation through direct marsh
destruction and/or redistribution. These events also redistribute sediments from the marsh and barrier
island systems, which can either be deposited within or removed from the Barataria system. Severe
droughts can result in wetland vegetation death and resulting decrease in land elevation.
Annual climatic variability alters local riverine input through the annual spring discharge of the
Mississippi River and local bayous. Winds associated with winter cold fronts cause a ‘set up’ and ‘set
down,’ in which coastal waters flush into and out of the system. This often results in redistribution of
basin salinity and sediment.
Human-Related Processes
Local population size results in increased urban and coastal development, impacts wetland biodiversity,
and generally results in degraded wetlands. In addition, increased urban and coastal development
leads to increased point and non-point sources of nutrients and pollutants. As population increases,
fishing demand increases and there is increased boat traffic damage (wake, grounding, and anchor-
related). Humans also introduce non-indigenous plant and animal species.
Primary trade and industry in Barataria Basin include oil and gas exploration and production, navigation,
ship building, and commercial fisheries. Dredging of exploration and navigation canals alters internal
wetland connectivity and wetland biodiversity. Industrial activities can lead to increased point and non-
point sources of nutrients and pollutants. Increased boat traffic damage (wake, grounding, and anchor-
related) is associated with a number of trade industries in Barataria, and non-indigenous plant and
animal species can be introduced through ship ballasts and other activities (aquaculture - tilapia, fur
trade - nutria, etc.). There is a large commercial fishing (fin fish, crab, shrimp, oysters) industry, which
55
leads to increased fishing pressures. Cypress mulch has also become an increasing trade activity, leading
to increased logging pressure in upper Barataria Basin.
The socio-political-educational perceptions in the Barataria Basin are such that there is a disconnect
between policy and public education and perception of the issues, such as point and non-point sources
of nutrients and pollutants (dumping overboard vessels, littering, sewage treatment in coastal camps),
introduction of non-indigenous species (landscaping, exotic pets, etc. – see Appendix A), logging
(demand for cypress mulch), and development in sensitive coastal areas. In addition, the regulatory
frameworks can be unclear and often unevenly enforced in different management areas. For example,
the current knowledge on maintaining sustainable cypress forests is not consistently applied (USACE,
2005). This frustrates stakeholders and ultimately undermines restoration efforts.
Some tourism and recreation leads to increased urban and coastal development, such as coastal camps,
marinas, etc. These activities can result in increased point and non-point sources of nutrients and
pollutants. Barataria Basin is a popular fishing destination, for both fresh and salt water fishing, and
therefore increased fishing demand is linked to these activities. Increased recreational boating
increases boat traffic damage (wake, grounding, and anchor-related) and dredging for marinas, boat
slips, etc. Some tourist and recreation activities can also introduce non-indigenous plant and animal
species, by transporting plant (e.g., hydrilla) and animal (e.g., live bait) species.

56
Table D1. Table of Drivers (Columns) and Pressures (Rows) for Barataria Basin (B)
Hydrologic Modifications Climate Human-Related Processes
Exploration & navigation
canals
Flood levee & dam
construction
Fresh-water
diversion
Sea Level Rise /
Subsidence
Extreme Weather Events
Vari-ability
Local Population
Size
Trade / Industry
Socio-Political-
Educational Perceptions
Tourism / Recreation
Altered riverine input
B B B B
Altered internal wetland connectivity
B B B B B
Increased nutrients (point and non-point)
B B B B B
Increased pollution (point and non-point)
B B B B B
Increased dredging
B B B
Increased fishing effort
B B B

57
Increased boat traffic (wakes, grounding, and anchoring)
B B B B
Introduction of non-indigenous species
B B B B
Altered coastal biodiversity
B B
Increased urban/coastal development
B B B B B
Increased logging
B B
Redistribution of marsh & barrier island sediment
B B
Decreased land elevation
B B
58
CONCLUSION / NEXT STEPS
The next step is to complete the entire NOAA Driver-Pressure-State-Impact-Response (DPSIR) framework, by
defining the state variables, impacts and regulatory responses for the aforementioned drivers and pressures.
For example, the driver ‘local population size’ can lead to the pressure ‘Increased nutrients (point and non-
point).’ ‘Eutrophication’ is a potential impact from this system pressure (increase of nutrients is a pressure on
a system but does not necessarily lead to eutrophication). The state variable that could be measured to
monitor eutrophication is chlorophyll. To learn more about the dynamics of the eutrophic condition, other
state variables would include nutrients, total organic carbon, algal community composition, dissolved oxygen,
salinity, and temperature. A potential regulatory response would be to reduce nutrient input to the system,
through a combination of policy, implementation (set TMDLs) and enforcement and community education and
outreach (e.g., “no dumping in storm drains”).

59
APPENDIX TO Appendix D
Non-native species in the Barataria Basin
A non-native (non-indigenous, or exotic) species is a plant animal or other biota that is living outside its original
geographic boundary. These species may have been intentional introduced for agriculture, fish and wildlife
management, recreational uses, or accidentally introduced from ship ballast water, “hitchhikers” hidden
within other methods of transportation or materials, or through irresponsible pet owners.
Some non-native species co-exist harmoniously in their new environments but more often introduced species
have negative impacts on existing native population and ecosystems. Non-native examples in Louisiana
include the aquatic plant hydrilla and the zebra mussel; both have negatively affected the local environment
and surface water uses. Below is a list of non-native species in the Barataria Basin (from
http://www.btnep.org).
Terrestrial plants - Chinese Tallow Tree, Purple Loosestrife, Cogon Grass
Aquatic plants - Hydrilla, Water Hyacinth, Alligator Weed, Eurasian Watermilfoil, Water Spangle, Giant
Salvinia, Brazilian Waterweed, Common Salvinia, Parrot Feather, Water Lettuce, Wild Taro
Aquatic animals - Nutria, Australian Spotted Jellyfish, Apple Snails, Brown Mussel, Asian Clam, Zebra Mussels,
Tilapia, Carp (spp.), Rio Grande Cichlid
Insects - Africanized Honeybee, Asian Tiger Mosquito , Formosan Termite, Mexican Boll Weevil, Red Imported
Fire Ant
Mammals - Norway Rat, Feral Hogs
Birds - Monk Parakeet, European Starling, Cattle Egret
Reptiles - Brown Anole

60
REFERENCES
Barras, J. A., J. C. Bernier, and R. A. Morton. 2008. Land area change in coastal Louisiana--A multidecadal perspective (from 1956 to 2006): U.S. Geological Survey Scientific Investigations Map 3019, scale 1:250,000, 14 p. pamphlet, http://pubs.usgs.gov/sim/3019/.
Barrett, B. B. 1971. Cooperative Gulf of Mexico Estuarine Inventory and Study, Louisiana, Phase II, Hydrology and Phase III, Sedimentology. Louisiana Wildlife and Fisheries Commission, New Orleans. 190 pp.
BTNEP. 1992. Comprehensive Conservation Management Plan. Barataria Terrebonne National Estuary Program (online: http://www.btnep.org/home.asp).
Calendar Year 2007 Louisiana TravelsAmerica Visitor Profile Report, March 2008, TNS Report 173472, http://www.latour.lsu.edu/pdfs/TravelsAmerica_LA_2007.pdf
Coleman, J. M., H. H. Roberts, G. W. Stone. 1998. Mississippi River Delta: an Overview. Journal of Coastal Research. 14(3):698-716.
Gagliano, S. M., P. Light, R. Muller, M. Al-Awady. 1973. Water balance in Louisiana estuaries. Hydrologic and Geologic Studies of Coastal Louisiana, Report No. 3. Coastal Resources Unit, Center for Wetland Resources, Louisiana State University, Baton Rouge, LA, 70803. 177 pp.
Geyer, R. A. 1950. The occurrence of pronounced salinity variations in Louisiana coastal waters. Journal of Marine Research IX-2: 100-110.
Inoue, M., D. Park, D. Justic, and W. Wiseman, Jr. 2008. A high-resolution integrated hydrology-hydrodynamic model of the Barataria Basin system. Environmental Modelling and Software, 23:1122-1132.
Kesel, R. H. 1989. The role of the Mississippi River in wetland loss in southeastern Louisiana, U.S.A. Environmental Geology, 13(3): 183-193.
McKenzie, L.S. III, M. W. Wascom, W. R. Keithly, R. E. Emmer, W. H. Hudnall, M. T. C. Johnson, F. Niami, and B. A. Touchet. 1995. Land Use and Socioeconomic Status and Trends in the Barataria-Terrebonne Estuarine System. BTNEP Publ. No. 23, Barataria-Terrebonne National Estuary Program, Thibodaux, Louisiana, 184 pp. plus Appendix.
Sasser, C. E. and J. M. Visser. 1998. LOOP Marine and Estuarine Monitoring Program, 1978-85, Volume 1: Executive Summary. Prepared for The Louisiana Transportation Research Center (LTRC Project No. 97-3IMP, State Project No. 736-99-0449). Coastal Ecology Institute, Louisiana State University, Baton Rouge, LA, 70803-7503. 69 pp.
Sklar, F. H. 1983. Water budget, benthological characterization, and simulation of aquatic material flows in a Louisiana freshwater swamp. Doctoral Dissertation, Department of Marine Sciences, Louisiana State University, Baton Rouge, LA 70803. 280 pp.
Snedden, G. A., J. E. Cable, C. Swarzenski, E. Swenson. 2007. Sediment Loading into a Subsiding Louisiana Deltaic Estuary through a Mississippi River Diversion. Estuarine, Coastal and Shelf Science. 71:181-193.
Swarzenski, C. M. 2003. Surface-water Hydrology of the Gulf Intracoastal Waterway in south-central Louisiana 1996-99. U. S. Geological Survey Professional Paper 1672. U. S. Geological Survey, Box 25286, Federal Center, Denver, CO 80225. 51 pp.
Swenson, E. M., J. E. Cable, B. Fry, D. Justic, A. Das, G. Snedden, C. Swarzenski. 2006. Estuarine flushing times influenced by freshwater diversions. Chapter 33 in V. P. Singh and Y. J. Xu, Coastal Hydrology and Processes. Proceedings of the 25th Anniversary Meeting and International Conference “Challenges in Coastal Hydrology and Water Quality”. Water Resources Publications, LLC, Highland Ranch, Colorado. 509 pp.
Swenson, E. M., D. E. Evers, J. M. Grymes, III. 2004. Brown Marsh Task II.5, Integrative Approach to Understanding the Causes of Salt Marsh Dieback: Analysis of Climate Drivers. Prepared for Coastal Restoration Division, Louisiana Department of Natural Resources, Baton Rouge, Louisiana. DNR

61
Interagency Agreement Number 2512-01-14. Coastal Ecology Institute, School of the Coast and Environment, Louisiana State University, Baton Rouge, LA 70803. 201 pp.
Swenson, E. M. and R. E. Turner. 1998. Past, Present and Probable Future Salinity Variations in the Barataria Estuarine System. Final report to the Coastal Restoration Division of the Louisiana Department of Natural Resources. Coastal Ecology Institute, Baton Rouge, LA 70803. 112 pp. with appendices.
Swenson, E.M. and C. M. Swarzenski. 1995. Water Leels and Salinity in the Barataria-Terrebonne Estuarine System. Part 6 in Reed, D. J. (editor) Status and Trends of Hydrologic Modification, Reduction in Sediment Availability, and Habitat Loss/Modification in the Barataria-Terrebonne Estuarine System. BTNEP Publ. No. 20, Barataria-Terrebonne National Estuary Program, Thibodaux, Louisiana, 184 pp. plus Appendices.
Turner, R. E. and B. Streever. 2002. Approaches to coastal wetland restoration: Northern Gulf of Mexico. SPB Academic Publishing, bv, The Hague, The Netherlands. 147 pp.
US ACE (US Army Corps of Engineers). 2004. Louisiana Coastal Area (LCA) Louisiana - Ecosystem Restoration Study - November 2004,Volume I: LCA Study, Main Report. New Orleans. USACE. http://data.lca.gov/Ivan6/main/main_report_all.pdf
US ACE (US Army Corps of Engineers). 2005. Donaldsonville to the Gulf- Feasibility Study- Hurricane Protection Project-Environmental Workshop Report – January 25, 2005. 25 pp.
Wiseman Wm. J. Jr., E. M. Swenson, F. J. Kelley. 1990. Control of estuarine salinities by coastal ocean salinity. in R. T. Cheng, Editor. Residual Currents and Long-term Transport. Coastal and Estuarine Studies, Volume 38. Sprnger-Verlag, New York. 544 pp.