
Integrated Demand Management
30
1 Assurance for Increasingly Autonomous Systems April 21, 2015 Integrated Demand Management Stakeholder Engagement: Demonstrating Benefits of Submitting Multiple Trajectory Options ARMD/AOSP Technical Seminar July 19, 2018 Nancy Smith Human-Systems Integration Division NASA Ames Research Center
Transcript of Integrated Demand Management

1 Assurance for Increasingly Autonomous Systems April 21, 2015
Integrated Demand Management
Stakeholder Engagement: Demonstrating Benefits of Submitting Multiple Trajectory Options ARMD/AOSP Technical Seminar July 19, 2018
Nancy Smith
Human-Systems Integration Division NASA Ames Research Center

2 Assurance for Increasingly Autonomous Systems April 21, 2015
Integrated Demand Management and Stakeholder Engagement
Integrated Demand Management (IDM) addresses traffic demand/capacity imbalances through coordinated use of two of the FAA’s NextGen Decision Support Systems:
• Traffic Flow Management System (TFMS) and its new Collaborative Trajectory Options Program (CTOP) capability, and
• Time-Based Flow Management (TBFM)
An IDM workshop with the Collaborative Decision Making (CDM) Flow Evaluation Team working group demonstrated the value of stakeholder engagement, both for concept development and stakeholder buy-in.
TBFM TFMS/CTOP

3 Assurance for Increasingly Autonomous Systems April 21, 2015
BACKGROUND

4 Assurance for Increasingly Autonomous Systems April 21, 2015
Motivation

5 Assurance for Increasingly Autonomous Systems April 21, 2015
• Objectives – Coordinate demand across TFMS and TBFM:
• TFMS/CTOP “strategically” manages demand into TBFM
• TBFM “tactically” manages delivery to capacity-limited airport
– Near- to mid-term concept
– Engage stakeholders early and throughout the process
• User Benefits
– Predictability, stability and flexibility of flight schedules and trajectories
TFMS: Traffic Flow Management System TBFM: Time-Based Flow Management CTOP: Collaborative Trajectory Options Program
Integrated Demand Management (IDM)
6 Assurance for Increasingly Autonomous Systems April 21, 2015
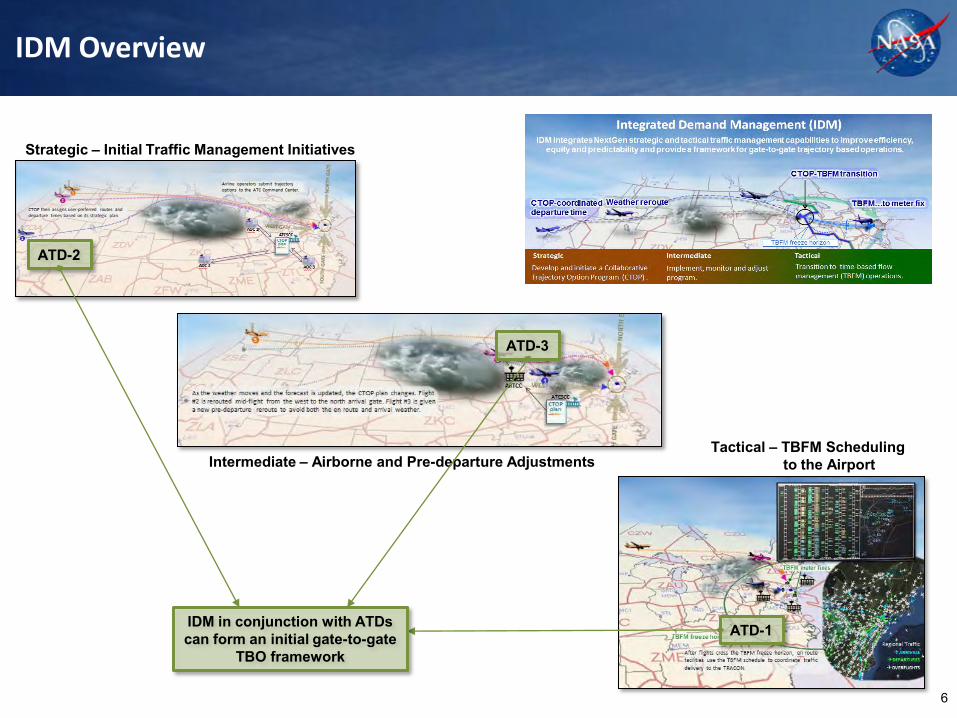
IDM Overview
Strategic – Initial Traffic Management Initiatives
Intermediate – Airborne and Pre-departure Adjustments Tactical – TBFM Scheduling
to the Airport
ATD-2
ATD-3
ATD-1 IDM in conjunction with ATDs can form an initial gate-to-gate
TBO framework

7 Assurance for Increasingly Autonomous Systems April 21, 2015
Build solution
“Stakeholder-Centric” Development
Scope problem
• concept of operations • decisions support tools • Procedures and methods
STAKEHOLDERS FAA, airline operators and others
Meets objectives?
On track?
Tech transfer
• Identify problem • establish requirements • develop use case • propose solution
Need and constraints?
Proposal satisfactory?
Evaluate Conduct human-in-the-loop and fast-time studies to assess progress and
demonstrate feasibility and benefits.

8 Assurance for Increasingly Autonomous Systems April 21, 2015
IDM Operations (1)
Airlines submit flight plans (A) or trajectory options set (B) to Command Center.
Command Center
Command Center plans CTOP for NY airport and alerts airline operators.
Airline B Airline A
1
2 3
Strategic: Collaborative Trajectory Options Program (CTOP)

9 Assurance for Increasingly Autonomous Systems April 21, 2015
IDM Operations (1)
1
3 2
CTOP routes and departure times are assigned for each flight.
Strategic: Collaborative Trajectory Options Program (CTOP)
Airlines submit flight plans (A) or trajectory options set (B) to Command Center.
Command Center
Command Center plans CTOP for NY airport and alerts airline operators.
Airline B Airline A
CTOP plan

10 Assurance for Increasingly Autonomous Systems April 21, 2015
TBFM freeze horizon
TBFM meter fixes
After flights cross the TBFM freeze horizon, en route facilities use the TBFM schedule to coordinate traffic delivery to the TRACON.
1
2
Tactical: Time-Based Flow Management (TBFM)
IDM Operations (2)
Air Traffic Control Centers
3

11 Assurance for Increasingly Autonomous Systems April 21, 2015
IDM PART-TASK EXPERIMENT, AUGUST 2017: BENEFITS OF SUBMITTING MULTIPLE TRAJECTORY OPTIONS

12 Assurance for Increasingly Autonomous Systems April 21, 2015
August 2017 Experiment: Overview
• Research Question
– What happens at different Trajectory Option Set (TOS) submission levels?
• Problem:
– Newark Liberty International Airport (EWR) arrival demand exceeds target capacity
– En route weather limits west flow capacity
• Conditions:
– TOS submission levels: 0%, 25%, 50%, 75%, 100%
• Metrics: Arrival throughput, ground delay
• Scenario Characteristics:
– Target arrival rate is 44 flights/hour
– Arrival demand ~55 flights/hour for 4 hours.
– Heaviest flows from the West and South.
– West gate is limited to 12 flights/hour
– North and South flows share remaining 32 slots

13 Assurance for Increasingly Autonomous Systems April 21, 2015
August 2017 Experiment: Results*
2.3
5.9
10
.7
10
.4
10
.9
3.8
3.1
11
.0
16
.6
18
.6
83
.5
52
.9
25
.5
18
.1
17
.4
0
20
40
60
80
100 0% 25% 50% 75% 100%
TOTA
L G
RO
UN
D D
ELA
Y B
Y A
RR
IVA
L G
ATE
(H
OU
RS)
PERCENTAGE OF FLIGHTS SUBMITTING TRAJECTORY OPTION SETS
N S W N S W N S W N S W N S W
Off-loading traffic from the west flow can substantially reduce ground delay for arrivals on that gate and meet airport capacity if 50% or more flights submit trajectory option sets.
* Hyo-Sang Yoo, C. Brasil, N. Buckley, G. Hodell, S. Kalush, P. U. Lee, N. M. Smith (2018). "Impact of Different Trajectory Option Set Participation Levels within an Air Traffic Management Collaborative Trajectory Option Program." In 18th AIAA Aviation Technology, Integration, and Operations Conference.

14 Assurance for Increasingly Autonomous Systems April 21, 2015
MARCH 2018 WORKSHOP WITH CDM WORKING GROUP

15 Assurance for Increasingly Autonomous Systems April 21, 2015
March 2018 Workshop: What We Did
• Human-in-the-loop simulation conducted with CDM Flow Evaluation Team
• FAA members and airline representatives from United, Delta, American, Southwest and FedEx were asked to role-play in LaGuardia Airport (LGA) simulation similar to August 2017 experiment
• Series of runs were completed with different airlines submitting trajectory option sets, including:
– All airlines submit trajectory options sets
– No airlines submit trajectory options sets
– Subset of airlines – United, Delta, American, Southwest and/or JetBlue – submit trajectory options sets
• After each run, output showing airline-specific impact was provided to participants
• Operators described implications for their company operations

16 Assurance for Increasingly Autonomous Systems April 21, 2015
March 2018 LGA Simulation Demo: Overview (1)
• Objectives
– Explore IDM’s concept of using CTOP to precondition traffic for TBFM when users have different TOS submission capabilities
– Obtain stakeholder feedback on benefits for all users, feasibility and suggestions
• Research Questions
– What happens when different airlines submit Trajectory Option Set (TOS)?
– Who benefits more: TOS submitting airlines? Or non-submitting airlines?
• Problem:
– LaGuardia Airport (LGA) arrival demand exceeds target capacity
– En route weather limits west flow capacity
• Conditions:
– Participants decide who will be “TOS-capable”
• Metrics:
– Ground delay, reroute count, added flight time

17 Assurance for Increasingly Autonomous Systems April 21, 2015
March 2018 LGA Simulation Demo: Overview (2)
• Scenario Characteristics:
– Target arrival rate is 36 flights/hour
– Arrival demand 40-43 flights/hour for 4 hours.
– Heaviest demand from South, then West.
– West gate is limited to 4 flights/hour
– North and South flows share remaining slots
• Approximate traffic distribution by airline:
– Delta: 78 flights (53%)
– American: 34 flights (25%)
– JetBlue: 3 flights (3%)
– Southwest: 10 flights (7%)
– United: 4 flights (5%)
– Others: 11 flights (9%)

18 Assurance for Increasingly Autonomous Systems April 21, 2015
RESULTS

19 Assurance for Increasingly Autonomous Systems April 21, 2015
Results: No-TOS vs. All TOS comparison
Average Arrival Rate: 36
Total flight count: 185
Eligible flights only: 142 Total Ground Delay: 2674 min 44.6 hours
TOS-rerouted flights: 23 Flight Time increase: 298 min 5.0 hours
Ground Delay reduction: 717 min 11.9 hours
28
77
11
14
12
Flights by Assigned FCA
NorthSouthSouth (rerouted from West)WestNorth (rerouted from West)
79, 55%
62, 44%
1, 1%0, 0%
Ground Delay Distributionon-time20-60 min1-2 hours2+ hours
187
30
8
2414 12
0
20
40
60
80
100
South Southfrom W
West Northfrom W
North
min
utes
Delay Averages by Assigned FCAAverage Flight Time IncreaseAverage Ground Delay
Run 1: ALL airlines are TOS Capable (Preliminary Run, 3/14/2018)
ALL AIRLINES
DAL
AAL
JBUSWA
UALOther
Average Arrival Rate: 33
Total flight count: 185
Eligible flights only: 142 Total Ground Delay: 7110 min 118.5 hours
TOS-rerouted flights: 0 Flight Time increase: 0 min 0.0 hours
Ground Delay reduction: 0 min 0.0 hours
Run 2: NO Airlines are TOS Capable (Preliminary Run, 3/14/2018)
28
77
0
37
0
Flights by Assigned FCA
NorthSouthSouth (rerouted from West)WestNorth (rerouted from West)
108, 76%
3, 2%6, 4%
25, 18%
Ground Delay Distributionon-time20-60 min1-2 hours2+ hours
6
179
10
60
120
180
240
300
South Southfrom W
West Northfrom W
North
min
utes
Delay Averages by Assigned FCAAverage Flight Time IncreaseAverage Ground Delay
DAL
AAL
JBUSWA
UALOther
ALL AIRLINES
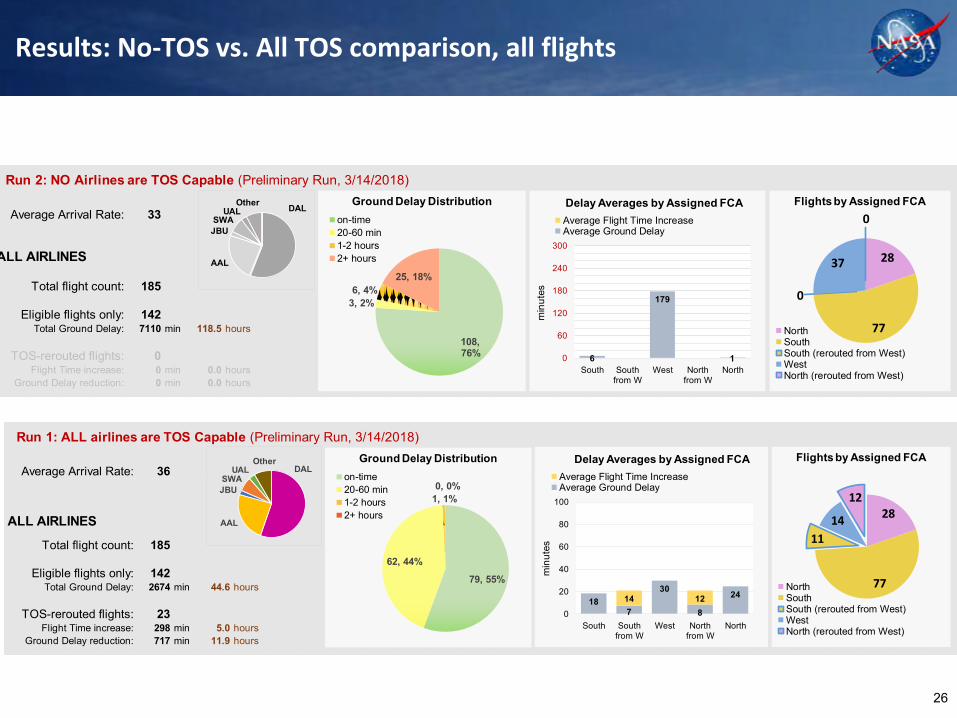
Run 1. No Flights Submit Trajectory Options Sets
Run 2. All Flights Submit Trajectory Options Sets
Throughput: 36 flights/hour Ground Delay (total): 44.6 hours
TOS-reroutes: 23 flights Added flight time (total): 5.0 hours
Throughput: 33 flights/hour Ground Delay (total): 118.5 hours
Average Arrival Rate: 36
Total flight count: 185
Eligible flights only: 142 Total Ground Delay: 2674 min 44.6 hours
TOS-rerouted flights: 23 Flight Time increase: 298 min 5.0 hours
Ground Delay reduction: 717 min 11.9 hours
28
77
11
14
12
Flights by Assigned FCA
NorthSouthSouth (rerouted from West)WestNorth (rerouted from West)
79, 55%
62, 44%
1, 1%0, 0%
Ground Delay Distributionon-time20-60 min1-2 hours2+ hours
187
30
8
2414 12
0
20
40
60
80
100
South Southfrom W
West Northfrom W
Northm
inut
es
Delay Averages by Assigned FCAAverage Flight Time IncreaseAverage Ground Delay
Run 1: ALL airlines are TOS Capable (Preliminary Run, 3/14/2018)
ALL AIRLINES
DAL
AAL
JBUSWA
UALOther
Average Arrival Rate: 33
Total flight count: 185
Eligible flights only: 142 Total Ground Delay: 7110 min 118.5 hours
TOS-rerouted flights: 0 Flight Time increase: 0 min 0.0 hours
Ground Delay reduction: 0 min 0.0 hours
Run 2: NO Airlines are TOS Capable (Preliminary Run, 3/14/2018)
28
77
0
37
0
Flights by Assigned FCA
NorthSouthSouth (rerouted from West)WestNorth (rerouted from West)
108, 76%
3, 2%6, 4%
25, 18%
Ground Delay Distributionon-time20-60 min1-2 hours2+ hours
6
179
10
60
120
180
240
300
South Southfrom W
West Northfrom W
North
min
utes
Delay Averages by Assigned FCAAverage Flight Time IncreaseAverage Ground Delay
DAL
AAL
JBUSWA
UALOther
ALL AIRLINES

20 Assurance for Increasingly Autonomous Systems April 21, 2015
Results: Delta and American, three different conditions
Total Ground Delay: 17.1 hrs Total Ground Delay: 16.6 hrs Run 3: Only Delta submits Trajectory Options Sets
north
south
west
aver
age
del
ay (
min
)
north
south
west
aver
age
del
ay (
min
) Total Ground Delay: 34.4 hrs Total Ground Delay: 6.4 hrs
Run 4: Everyone but Delta submits Trajectory Options Sets
north
south
west
aver
age
del
ay (
min
)
north
south
west av
erag
e d
elay
(m
in)
Total Ground Delay: 43.3 hrs Total Ground Delay: 33.6 hrs
DELTA AIRLINES AMERICAN AIRLINES
Run 1. No airlines submit Trajectory Options Sets
north
south
west north
south
west av
erag
e d
elay
(m
in)
aver
age
del
ay (
min
)

21 Assurance for Increasingly Autonomous Systems April 21, 2015
Summary
• Coordination of two Decision Support Systems to manage demand across multiple constraints
• “Stakeholder-centric” approach
– Ongoing relationships with FAA Operational Concepts, Validation and Requirements Office (AJV-7); CDM Flow Evaluation Team; and TFMS Deployment Team
– Valuable input on concept feasibility, potential benefits, operational concerns, metrics, implementation barriers, etc.
• Workshops in March 2018
– Both the system and airline benefits, especially for TOS “early adopters”
– Addressed key concerns for stakeholders on the cost and benefits of early adoption - has been a key implementation barrier
• IDM concept and procedures are maturing and on track to be completed by the end of its project cycle (FY20/FY21)

22 Assurance for Increasingly Autonomous Systems April 21, 2015
BACK-UP SLIDES

23 Assurance for Increasingly Autonomous Systems April 21, 2015
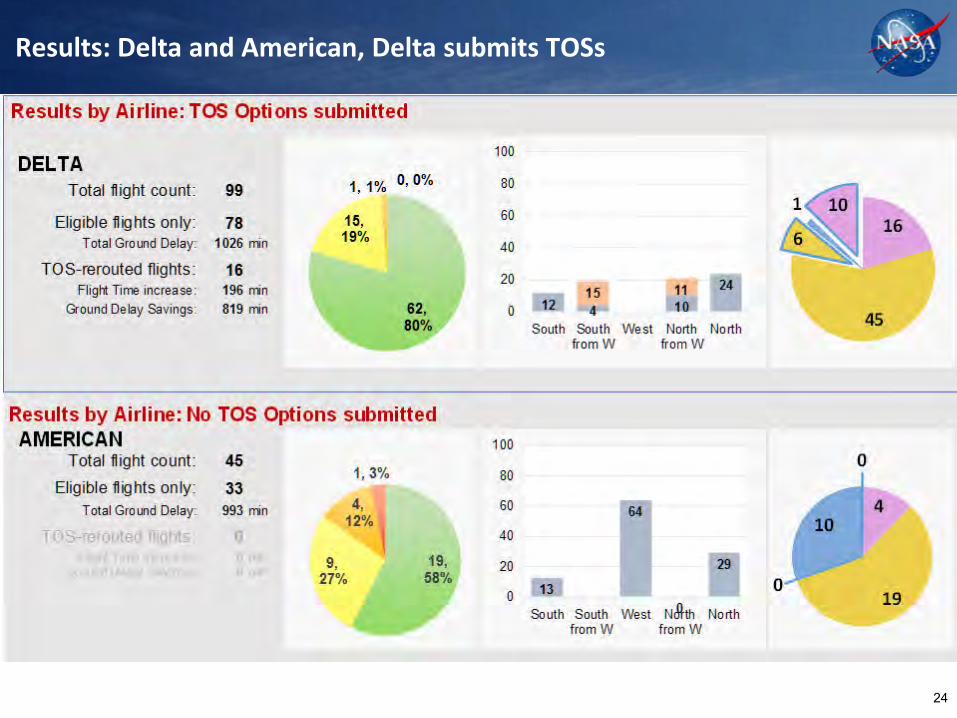
Results: Delta and American, no flights submit TOSs
• MAKE SURE TO POINT OUT EARLY ADOPTER BENEFIT!
24 Assurance for Increasingly Autonomous Systems April 21, 2015
Results: Delta and American, Delta submits TOSs

25 Assurance for Increasingly Autonomous Systems April 21, 2015
Results: Delta and American, all airlines except Delta submit TOSs
26 Assurance for Increasingly Autonomous Systems April 21, 2015
Results: No-TOS vs. All TOS comparison, all flights
Average Arrival Rate: 36
Total flight count: 185
Eligible flights only: 142 Total Ground Delay: 2674 min 44.6 hours
TOS-rerouted flights: 23 Flight Time increase: 298 min 5.0 hours
Ground Delay reduction: 717 min 11.9 hours
28
77
11
14
12
Flights by Assigned FCA
NorthSouthSouth (rerouted from West)WestNorth (rerouted from West)
79, 55%
62, 44%
1, 1%0, 0%
Ground Delay Distributionon-time20-60 min1-2 hours2+ hours
187
30
8
2414 12
0
20
40
60
80
100
South Southfrom W
West Northfrom W
North
min
utes
Delay Averages by Assigned FCAAverage Flight Time IncreaseAverage Ground Delay
Run 1: ALL airlines are TOS Capable (Preliminary Run, 3/14/2018)
ALL AIRLINES
DAL
AAL
JBUSWA
UALOther
Average Arrival Rate: 33
Total flight count: 185
Eligible flights only: 142 Total Ground Delay: 7110 min 118.5 hours
TOS-rerouted flights: 0 Flight Time increase: 0 min 0.0 hours
Ground Delay reduction: 0 min 0.0 hours
Run 2: NO Airlines are TOS Capable (Preliminary Run, 3/14/2018)
28
77
0
37
0
Flights by Assigned FCA
NorthSouthSouth (rerouted from West)WestNorth (rerouted from West)
108, 76%
3, 2%6, 4%
25, 18%
Ground Delay Distributionon-time20-60 min1-2 hours2+ hours
6
179
10
60
120
180
240
300
South Southfrom W
West Northfrom W
North
min
utes
Delay Averages by Assigned FCAAverage Flight Time IncreaseAverage Ground Delay
DAL
AAL
JBUSWA
UALOther
ALL AIRLINES

27 Assurance for Increasingly Autonomous Systems April 21, 2015
Results: No-TOS vs. All TOS comparison
Average Arrival Rate: 36
Total flight count: 185
Eligible flights only: 142 Total Ground Delay: 2674 min 44.6 hours
TOS-rerouted flights: 23 Flight Time increase: 298 min 5.0 hours
Ground Delay reduction: 717 min 11.9 hours
28
77
11
14
12
Flights by Assigned FCA
NorthSouthSouth (rerouted from West)WestNorth (rerouted from West)
79, 55%
62, 44%
1, 1%0, 0%
Ground Delay Distributionon-time20-60 min1-2 hours2+ hours
187
30
8
2414 12
0
20
40
60
80
100
South Southfrom W
West Northfrom W
North
min
utes
Delay Averages by Assigned FCAAverage Flight Time IncreaseAverage Ground Delay
Run 1: ALL airlines are TOS Capable (Preliminary Run, 3/14/2018)
ALL AIRLINES
DAL
AAL
JBUSWA
UALOther
Average Arrival Rate: 33
Total flight count: 185
Eligible flights only: 142 Total Ground Delay: 7110 min 118.5 hours
TOS-rerouted flights: 0 Flight Time increase: 0 min 0.0 hours
Ground Delay reduction: 0 min 0.0 hours
Run 2: NO Airlines are TOS Capable (Preliminary Run, 3/14/2018)
28
77
0
37
0
Flights by Assigned FCA
NorthSouthSouth (rerouted from West)WestNorth (rerouted from West)
108, 76%
3, 2%6, 4%
25, 18%
Ground Delay Distributionon-time20-60 min1-2 hours2+ hours
6
179
10
60
120
180
240
300
South Southfrom W
West Northfrom W
North
min
utes
Delay Averages by Assigned FCAAverage Flight Time IncreaseAverage Ground Delay
DAL
AAL
JBUSWA
UALOther
ALL AIRLINES
Run 1. No Flights Submit Trajectory Options Sets
Run 2. All Flights Submit Trajectory Options Sets
Throughput: 36 flights/hour Ground Delay (total): 44.6 hours
TOS-reroutes: 23 flights Added flight time (total): 5.0 hours
Throughput: 33 flights/hour Ground Delay (total): 118.5 hours
TOS-reroutes: flights Added flight time (total): hours

28 Assurance for Increasingly Autonomous Systems April 21, 2015
Results: No-TOS vs. All TOS comparison
Average Arrival Rate: 36
Total flight count: 185
Eligible flights only: 142 Total Ground Delay: 2674 min 44.6 hours
TOS-rerouted flights: 23 Flight Time increase: 298 min 5.0 hours
Ground Delay reduction: 717 min 11.9 hours
28
77
11
14
12
Flights by Assigned FCA
NorthSouthSouth (rerouted from West)WestNorth (rerouted from West)
79, 55%
62, 44%
1, 1%0, 0%
Ground Delay Distributionon-time20-60 min1-2 hours2+ hours
187
30
8
2414 12
0
20
40
60
80
100
South Southfrom W
West Northfrom W
North
min
utes
Delay Averages by Assigned FCAAverage Flight Time IncreaseAverage Ground Delay
Run 1: ALL airlines are TOS Capable (Preliminary Run, 3/14/2018)
ALL AIRLINES
DAL
AAL
JBUSWA
UALOther
Average Arrival Rate: 33
Total flight count: 185
Eligible flights only: 142 Total Ground Delay: 7110 min 118.5 hours
TOS-rerouted flights: 0 Flight Time increase: 0 min 0.0 hours
Ground Delay reduction: 0 min 0.0 hours
Run 2: NO Airlines are TOS Capable (Preliminary Run, 3/14/2018)
28
77
0
37
0
Flights by Assigned FCA
NorthSouthSouth (rerouted from West)WestNorth (rerouted from West)
108, 76%
3, 2%6, 4%
25, 18%
Ground Delay Distributionon-time20-60 min1-2 hours2+ hours
6
179
10
60
120
180
240
300
South Southfrom W
West Northfrom W
North
min
utes
Delay Averages by Assigned FCAAverage Flight Time IncreaseAverage Ground Delay
DAL
AAL
JBUSWA
UALOther
ALL AIRLINES
Run 1. No Flights Submit Trajectory Options Sets
Run 2. All Flights Submit Trajectory Options Sets
Throughput: 36 flights/hour Ground Delay (total): 44.6 hours
TOS-reroutes: 23 flights Added flight time (total): 5.0 hours
Throughput: 33 flights/hour Ground Delay (total): 118.5 hours
TOS-reroutes: flights Added flight time (total): hours Delay Distribution
by severity by Severity
Delay Distribution by severity
Traffic Distribution
by Flow north
south
west
Traffic Distribution
by Flow
Average Arrival Rate: 33
Total flight count: 185
Eligible flights only: 142 Total Ground Delay: 7110 min 118.5 hours
TOS-rerouted flights: 0 Flight Time increase: 0 min 0.0 hours
Ground Delay reduction: 0 min 0.0 hours
Run 2: NO Airlines are TOS Capable (Preliminary Run, 3/14/2018)
28
77
0
37
0
Flights by Assigned FCA
NorthSouthSouth (rerouted from West)WestNorth (rerouted from West)
108, 76%
3, 2%6, 4%
25, 18%
Ground Delay Distributionon-time20-60 min1-2 hours2+ hours
6
179
10
60
120
180
240
300
South Southfrom W
West Northfrom W
North
min
utes
Delay Averages by Assigned FCAAverage Flight Time IncreaseAverage Ground Delay
DAL
AAL
JBUSWA
UALOther
ALL AIRLINES north
south
west

29 Assurance for Increasingly Autonomous Systems April 21, 2015
Results: Participant Feedback
LGA problem really struck home for working group
Advantages of concept and CTOP itself were immediately apparent
...
29

30 Assurance for Increasingly Autonomous Systems April 21, 2015
Callsign FCA TOS
Option Flight Plan
UAL556 WEST 1 KDEN./.ZIRKL..MCK..LNK.J60.DJB..YNG..ETG.MIP4.KLGA
UAL556 SOUTH 2 KDEN./.PER..RZC..ARG.J46.BNA.J42.BKW.J42.GVE.KORRY4.KLGA
UAL556 NORTH 3 KDEN./.BRYCC..TAYOT..DAYYY..RUBKI..SIKBO..TULEG..RKA.HAARP3.KLGA
UAR4314 WEST 1 KCLE./.FAILS..JFN..ETG.MIP4.KLGA
UAR4314 NORTH 2 KCLE./.FAILS..ERI..JHW..MEMMS..WILET..RKA.HAARP3.KLGA
UAR5706 WEST 1 KORD./.MOBLE..ADIME..GERBS.J146.ETG.MIP4.KLGA
UAR5706 NORTH 2 KORD./.HANKK..EXTOL..RKA.HAARP3.KLGA
UAR5706 SOUTH 3 KORD./.EARND..ELANR..EMMLY..ERECO..IIU.J526.BKW.J42.GVE.KORRY4.KLGA
UAR6256 SOUTH 1 KIAD./.AGARD.KORRY4.KLGA
Main carrier regional flights will be denoted with an R in the call sign. UAL = UAR
Original FCA
TOS List Sample


![Integrated Demand Management: Minimizing Unanticipated ...mid-term concept called Integrated Demand Management (IDM) [1]. The overarching goal of the IDM is to explore more effective](https://static.fdocuments.us/doc/165x107/5ecafbf6e7aa29671b3b295d/integrated-demand-management-minimizing-unanticipated-mid-term-concept-called.jpg)


