Integrated Cost and Schedule Comparative Analysis BART ...
15
BSVII – Independent Comparative Analysis Volume I: Page 1 EXECUTIVE SUMMARY Integrated Cost and Schedule Comparative Analysis BART Silicon Valley Extension Phase II Tunneling Alternatives August 17, 2017 Authors Release Date James J. Brady, Aldea Services Robert J. F. Goodfellow, Aldea Services Alfred Moergeli, Moergeli consulting Philip Sander, RiskConsult Robert Neumann, RiskConsult Martin Entacher, RiskConsult WORKING DRAFT August 11, 2017 FINAL DRAFT August 17, 2017 - - BSV Phase II_ExecSummary_V06_PreFinal_DRAFT.docx Prepared for Final Draft
Transcript of Integrated Cost and Schedule Comparative Analysis BART ...
BSVII – Independent Comparative Analysis Volume I: Page 1
EXECUTIVE SUMMARY
Integrated Cost and Schedule Comparative Analysis
BART Silicon Valley Extension Phase II
Tunneling Alternatives
August 17, 2017
Authors Release Date
James J. Brady, Aldea Services
Robert J. F. Goodfellow, Aldea Services
Alfred Moergeli, Moergeli consulting
Philip Sander, RiskConsult
Robert Neumann, RiskConsult
Martin Entacher, RiskConsult
WORKING DRAFT August 11, 2017
FINAL DRAFT August 17, 2017
- -
BSV Phase II_ExecSummary_V06_PreFinal_DRAFT.docx
Prepared for
Final D
raft

1 Purpose
This summary provides an overview of the results from the Aldea Team’s integrated Schedule & Cost Comparative Analysis of the subsurface portions of the two tunneling options under consideration for the BART Silicon Valley (BSV) Phase II Project. The purpose of our analysis is to facilitate the selection of a preferred tunneling alternative from the two approaches; twin bore vs. single bore tunnel that are being considered. The Aldea team includes experts in risk assessment and management, underground structure engineering and construction, and fire and life safety systems. We performed an independent assessment of risks associated with the two tunneling approaches through interviews with technical experts, stakehold-ers, industry, and peer agencies. The results of our analysis are presented in terms of cost, schedule and risk.
The two options are the Twin Bore (TB) option which constructs two single-track 21-foot diameter sub-way tunnels, similar to other tunnels in the BART system and the Single Bore (SB) option which con-structs a single 45-foot diameter subway tunnel that is designed to carry two tracks within the same tunnel, using a dividing wall between the trackways. This analysis uses probabilistic simulation to calculate the range of uncertainty of both designs based on their current level of completion (TB at 65%, SB at 20%) as well as to differentiate the potential impacts of risk and opportunities to both cost and schedule that were assessed for each method in workshops attended by stakeholders and industry experts.
It must be pointed out here that the figures and information contained in this report are For Decision-
Making Purposes Only. Both the comparative nature of our task (many elements of the complete project were not included in either the cost or schedule analysis due to the differences in design level between the two options) and the comparative risk assessment process (risk assessment for budgetary purposes is a very different task) render this information unsuitable for budgeting, financing, or grant agreements.
2 Definitions
Table 1: Report Summary Definitions
Components Description
Base Cost Base Value with uncertainty estimates to account for variation in unit prices and quantities (Base + Uncertainty). Result is a distri-bution.
Base Value Engineer’s Cost Estimate with escalation removed. Total is a single number.
Engineer’s Cost Estimate Cost estimates provided by VTA from their consulting engineers to construct the work with escalation but without uncertainty.Total is a single number.
Escalation Increase in all cost items for inflation calculated from the basis that all cost estimates are in December 31, 2016 dollars.
Final D
raft

BSVII – Independent Comparative Analysis Volume I: Page 3
Opportunity An Opportunity is an uncertain event or condition that, if it occurs, has a positive impact upon the Project.
P80 Value Value resulting from a cost or time distribution calculation with 80% chance of not being exceeded. Result is a single number.
RIAAT (Software) RIsk Analysis and Administrative Tool, or RIAAT, is an advanced project management software developed and supported by RiskConsult (Aldea Team member), which integrates and links in-formation from cost management, risk management and schedule planning. Used to perform the Quantitative Analysis for this com-parison. https:// www.riskcon.at
Risk A Risk is an uncertain event or condition that, if it occurs, has a negative impact upon the Project.
Sunk Costs Costs that have already been incurred in the development of either option that cannot be recovered.
Unidentified Risk An allowance to account for risks that are not, or could not, be specifically identified in the risk register but may be expected to develop as the project progresses (aka Unknown Risk).
3 Process
3.1 Qualitative Analysis
The comparative assessment process for project cost and schedule first worked to accurately derive compar-ative base costs for both alternatives and normalize the costs to a common date (December 31, 2016 in this case). Next, we used a workshop process, including stakeholders (such as BART, VTA, the City of San Jose) and nationally recognized subject matter experts (SME’s), to identify all risks and uncertainties that might significantly affect the predicted project cost and schedule for both options. The risk assessment workshops were used to:
• Identify all significant potential events and conditions (both risks/threats and opportuni-ties) that could affect project cost and schedule.
• Assess risk impacts and likelihoods. • Develop an integrated cost and schedule risk register. • Develop an integrated analytical cost & schedule risk model to quantify risks to cost and
schedule with a probabilistic approach. • Produce a distribution of probable cost and schedule outcomes for the project. • Identify and discuss mitigation measures for significant risk components and estimate the
potential risk reduction from each mitigation measure together with the residual risk after mitigation.
Final D
raft

• Identify, discuss and quantify potential opportunities and ways to exploit them.
During the workshops, a numerical ranking method was used to quantify the range of each of those impacts using estimates of minimum, most likely, and maximum values for each for cost and schedule risks/oppor-tunities. 127 Total Risks, including 64 specific and 63 generic risks were identified for the Twin Bore option while 121 Total Risks, including 74 specific and 47 generic risks were identified for the Single Bore option.
3.2 Quantitative Analysis Conventional estimates are presented in terms of a single number. This form of estimating is termed “deter-ministic” cost estimating. A superior way of considering budget costs is by use of probabilistic forms of estimating that can consider uncertainties and gives a range of possible outcomes. These uncertainties can be in the form of pure quantity or material uncertainty or in the form of identified and unidentified risks. When these are combined, a full probabilistic cost and schedule distribution can be found.
Two numerical simulation models were developed using RIAAT software to aggregate these impacts in order to obtain risk-based cost and schedule estimates for each of the project options; RIAAT performs numerical simulations to aggregate the contribution of each source of cost and schedule uncertainty to the overall project cost and schedule estimate. The cost impacts of schedule delays including potential changes to the critical path schedule are incorporated in the calculations. The result is an integrated cost and schedule model for the project that includes risk impacts together with the quantified uncertainties in these predic-tions.
The models aggregated the simulation results of the Base+Uncertainty Costs, and Risk Costs. In the models, “Risk” includes both Identified Risk and Unidentified (or Unknown) Risk. The models also include cost elements to calculate the estimated cost impacts of schedule delays resulting from both Owner-caused and Contractor-caused delay risks. The results are presented in terms of probabilistic distribution ranges rather than single value estimates.
Escalation costs have not been included in the comparative analysis because their calculation is typically a financing calculation reserved for evaluating the time-dependent cost of the entire project and the compara-tive analysis was not based on analyzing the entire project (see major items not included below); therefore, presenting the results of an Escalation calculation at this time would be premature and misleading. Further, the schedule (time-related) outcomes of the Comparative Schedule analysis show critical differences in both the Construction period and when subsequent Revenue service will start; any accurate Escalation cost would have to be based upon both of these findings. In sum, the Escalation calculation should be performed for the entire project and should incorporate the durations identified in the risk-dependent schedule. (Note: Any financing calculation should also include estimated income from Revenue service.)
The following work items common to both options were not included in the Comparative Analysis:
• Sunk Costs
• Trackwork
• Control Systems
• BART Vehicles
• Newhall Yard & Shops
Final D
raft
BSVII – Independent Comparative Analysis Volume I: Page 5
• Santa Clara Station (Surface)
• Architectural Finishes and Fit-out work for the three Underground Stations
• All Supporting Engineering for above items
• Operation & Maintenance (O&M) after the first 30 years
In addition, several categories of risks that were identified in the Workshops were not included in the mod-els. These categories are:
• Risks that did not impact cost or schedule
• Risks that equally impacted both options (self-cancelling)
• “Existential” Risks; risks that would have attempted to quantify, in terms of dollars
and/or time, what was fundamentally an assessment upon the very existence of the project
(i.e., “risk that the Project would not receive FTA funding”).
Basis of Comparative Analysis for Both Options
Both Options were modelled using the following basis for comparison:
• Cost Basis adjusted to December 2016
• Basic (or Minimally) Mitigated Risks were used in the model (see below) • Market Forces were Evaluated (Pre-Bid Conditions)
• Optimal Delivery/Contract Model was considered (TB – Design-Bid-Build, SB- Design-
Build)
• Comparisons to be based on P80 Level (80% Probability of not exceeding)
Quantitative Assessment Models using RIAAT
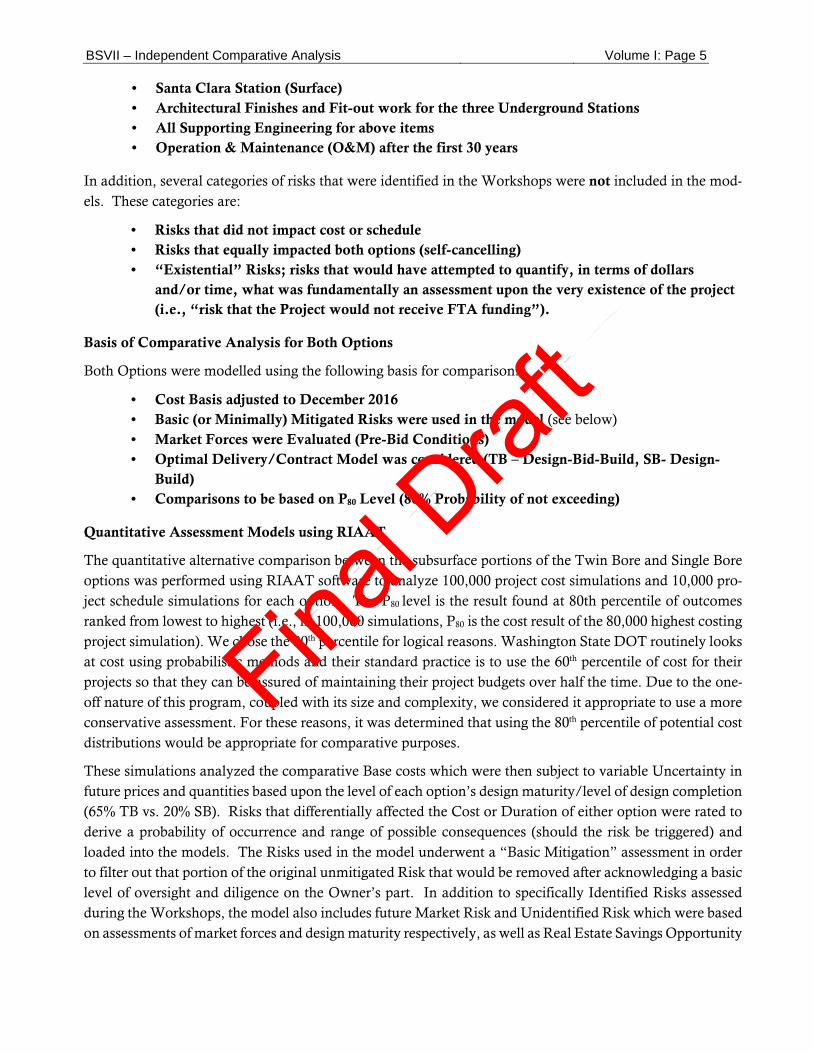
The quantitative alternative comparison between the subsurface portions of the Twin Bore and Single Bore options was performed using RIAAT software to analyze 100,000 project cost simulations and 10,000 pro-ject schedule simulations for each option. The P80 level is the result found at 80th percentile of outcomes ranked from lowest to highest (i.e., in 100,000 simulations, P80 is the cost result of the 80,000 highest costing project simulation). We chose the 80th percentile for logical reasons. Washington State DOT routinely looks at cost using probabilistic methods and their standard practice is to use the 60th percentile of cost for their projects so that they can be assured of maintaining their project budgets over half the time. Due to the one-off nature of this program, coupled with its size and complexity, we considered it appropriate to use a more conservative assessment. For these reasons, it was determined that using the 80th percentile of potential cost distributions would be appropriate for comparative purposes.
These simulations analyzed the comparative Base costs which were then subject to variable Uncertainty in future prices and quantities based upon the level of each option’s design maturity/level of design completion (65% TB vs. 20% SB). Risks that differentially affected the Cost or Duration of either option were rated to derive a probability of occurrence and range of possible consequences (should the risk be triggered) and loaded into the models. The Risks used in the model underwent a “Basic Mitigation” assessment in order to filter out that portion of the original unmitigated Risk that would be removed after acknowledging a basic level of oversight and diligence on the Owner’s part. In addition to specifically Identified Risks assessed during the Workshops, the model also includes future Market Risk and Unidentified Risk which were based on assessments of market forces and design maturity respectively, as well as Real Estate Savings Opportunity
Final D
raft

and a Business Interruption Risk which were based on assessments of the differences in local community impacts provided by each option. Finally, there is Schedule Risk which is calculated by RIAAT based upon Owner-caused delays to achieving the project schedule; both Pre-Award and Post-Award of the Heavy Civil (Tunnel & Shafts) Contract.
One difference between the two options is that Twin Bore was evaluated as a traditional Design-Bid-Build Contract due to the level of design progress (65% Design) while Single Bore (20% Design), was evaluated as a Design-Build Contract in order to investigate the advantages in potential schedule savings that pursuing this type of contract delivery method might provide.
The figures below present the full range of results (P0 to P100) for the simulated Base + Uncertainty Construc-tion Cost (Figure 2), the Construction Program Risk Cost (Figure 3), and Heavy Civil Construction Com-pletion Dates (Figure 4) for both options. P0 is the lowest ranked result from the model’s simulations defin-ing the left end of each curve and the P100 is the highest ranked result defining the right end of each curve.
Figure 1: P0 through P100 Comparison between Single Bore and Twin Bore Alternatives (Construction Base + Uncertainty Cost)
Figure 2: P0 through P100 Comparison between Single Bore and Twin Bore Alternatives (Construction Program Risk Cost)
0%
2%
4%
6%
8%
10%
12%
2.000 2.050 2.100 2.150 2.200 2.250 2.300 2.350 2.400 2.450 2.500 2.550 2.600
Re
lati
ve
Fre
qu
en
cy
Cost in $ Million
Construction Base Cost SB
Construction Base Cost TB
Delta P80 $ 87.5 M
0%
2%
4%
6%
8%
10%
12%
0 150 300 450 600 750 900 1.050 1.200 1.350 1.500 1.650 1.800 1.950 2.100 2.250 2.400
Re
lati
ve
Fre
qu
en
cy
Cost in $ Million
Construction Risk Cost SB
Construction Risk Cost TB
Delta P80 $ 518MFinal D
raft

BSVII – Independent Comparative Analysis Volume I: Page 7
Figure 3: P0 through P100 Completion Dates Heavy Civil Construction Single Bore - Twin Bore Comparison (in Calendar Days)
Top 10 Project Cost Risks
The next set of tables presents the Top 10 Cost Risks for each option. Of note here, is that the top three risks for both options play an outsized roll in the overall risk exposure of their respective options. They are the same three risks but the results and order of rank are not the same. Single Bore is more vulnerable to the forces of both Market Risk and Unidentified Risks though it fares better than Twin Bore for the Costs of Owner Delay. Another important point for consideration is that only one of the top three risks, “Unidenti-fied Construction Risk” is predominantly random; the other two are heavily influenced by the actions taken by the Owner and their Construction and Risk Management Team.
The bullet points below summarize the major impact these top three risks alone represent to their respective options.
• The potential swings in final project cost for the Twin Bore Option range from a possible impact
of $975+ million over the Base Cost (if all three risks occurred to their maximum impact) to ap-
proximately $0 over Base Cost (if all three risks occurred to their minimal impact). • For the Single Bore Option the range for its top three risks varies between potentially $1,775+
million to $440+million over Base Cost.
The two important takeaways from this section are that all risk (and opportunity) cost are only potential costs
and most risks can be greatly mitigated through the efforts of a solid project management team. Clearly,
whichever option is selected, reducing Market Risk and Owner-caused Project Delay will be top prior-
ities for the Project Team.
Final D
raft
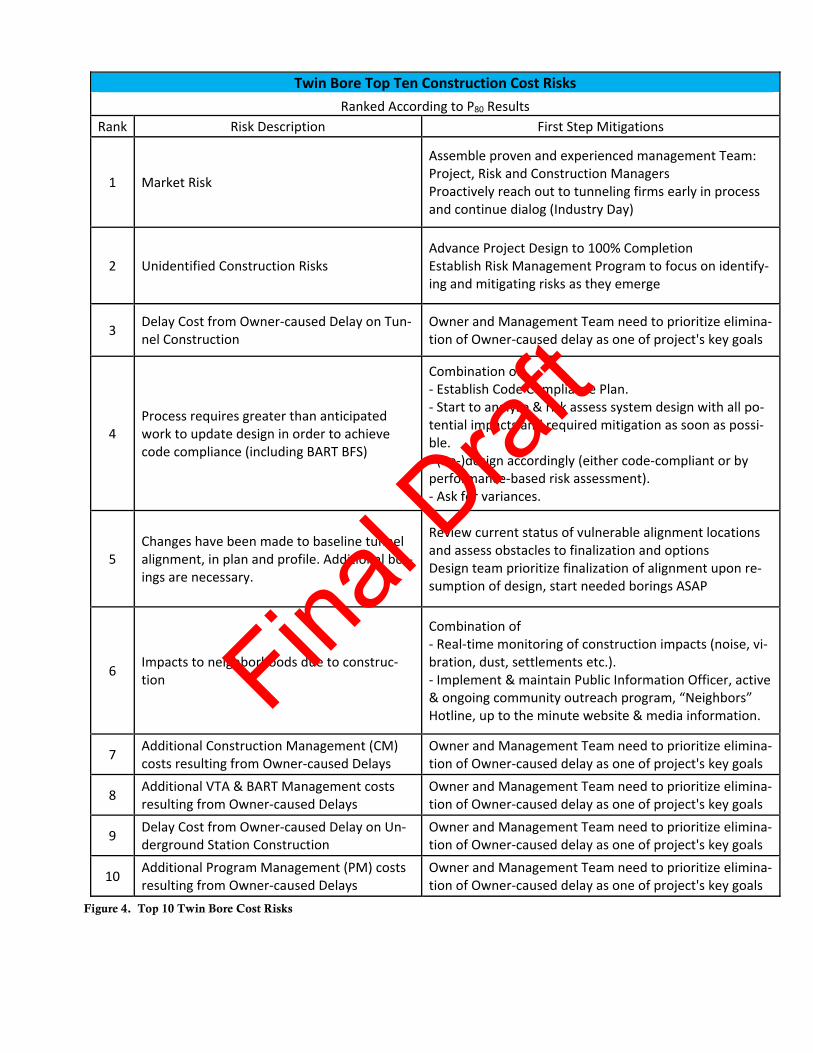
Twin Bore Top Ten Construction Cost Risks
Ranked According to P80 Results
Rank Risk Description First Step Mitigations
1 Market Risk
Assemble proven and experienced management Team: Project, Risk and Construction Managers Proactively reach out to tunneling firms early in process and continue dialog (Industry Day)
2 Unidentified Construction Risks Advance Project Design to 100% Completion Establish Risk Management Program to focus on identify‐ing and mitigating risks as they emerge
3 Delay Cost from Owner‐caused Delay on Tun‐nel Construction
Owner and Management Team need to prioritize elimina‐tion of Owner‐caused delay as one of project's key goals
4 Process requires greater than anticipated work to update design in order to achieve code compliance (including BART BFS)
Combination of ‐ Establish Code Compliance Plan. ‐ Start to analyze & risk assess system design with all po‐tential impacts and required mitigation as soon as possi‐ble. ‐ (Re‐)design accordingly (either code‐compliant or by performance‐based risk assessment). ‐ Ask for variances.
5 Changes have been made to baseline tunnel alignment, in plan and profile. Additional bor‐ings are necessary.
Review current status of vulnerable alignment locations and assess obstacles to finalization and options Design team prioritize finalization of alignment upon re‐sumption of design, start needed borings ASAP
6 Impacts to neighborhoods due to construc‐tion
Combination of ‐ Real‐time monitoring of construction impacts (noise, vi‐bration, dust, settlements etc.). ‐ Implement & maintain Public Information Officer, active & ongoing community outreach program, “Neighbors” Hotline, up to the minute website & media information.
7 Additional Construction Management (CM) costs resulting from Owner‐caused Delays
Owner and Management Team need to prioritize elimina‐tion of Owner‐caused delay as one of project's key goals
8 Additional VTA & BART Management costs resulting from Owner‐caused Delays
Owner and Management Team need to prioritize elimina‐tion of Owner‐caused delay as one of project's key goals
9 Delay Cost from Owner‐caused Delay on Un‐derground Station Construction
Owner and Management Team need to prioritize elimina‐tion of Owner‐caused delay as one of project's key goals
10 Additional Program Management (PM) costs resulting from Owner‐caused Delays
Owner and Management Team need to prioritize elimina‐tion of Owner‐caused delay as one of project's key goals
Figure 4. Top 10 Twin Bore Cost Risks
Final D
raft

BSVII – Independent Comparative Analysis Volume I: Page 9
Single Bore Top Ten Construction Cost Risks
Ranked According to P80 Results
Rank Risk Description First Step Mitigations
1 Unidentified Construction Risks
Advance Project Design to 30% Completion (Design‐Build) Establish Risk Management Program to focus on iden‐tifying and mitigating risks as they emerge
2 Market Risk
Assemble proven and experienced management Team: Project, Risk and Construction Managers Proactively reach out to tunneling firms early in pro‐cess and continue dialog (Industry Day)
3 Delay Cost from Owner‐caused Delay on Tun‐nel Construction
Owner and Management Team need to prioritize elimination of Owner‐caused delay as one of project's key goals
4 Additional Program Management (PM) costs resulting from Owner‐caused Delays
Owner and Management Team need to prioritize elimination of Owner‐caused delay as one of project's key goals
5 Additional Construction Management (CM) costs resulting from Owner‐caused Delays
Owner and Management Team need to prioritize elimination of Owner‐caused delay as one of project's key goals
6 Additional Final Design costs resulting from Owner‐caused Delays
Owner and Management Team need to minimize "scope creep" and Owner‐requested design changes Owner and Management Team need to prioritize elimination of Owner‐caused delay as one of project's key goals
7 Additional VTA & BART Management costs re‐sulting from Owner‐caused Delays
Owner and Management Team need to prioritize elimination of Owner‐caused delay as one of project's key goals
8 BART requires additional Training for O&M Staff to facilitate work in new Single Bore fa‐cilities
VTA must negotiate reasonable training parameters and budget with BART
9 Impacts to neighborhoods due to construc‐tion
Combination of ‐ Proactively Implement & maintain Public Infor‐mation Officer, active & ongoing community outreach program, “Neighbors” Hotline, up to the minute web‐site & media information. ‐ Real‐time monitoring of construction impacts (noise, vibration, dust, settlements etc.)
10 Additional Program Management (PM) costs resulting from Owner‐caused Delays
Owner and Management Team need to prioritize elimination of Owner‐caused delay as one of project's key goals
Figure 5. Top 10 Single Bore Cost Risks
Final D
raft

Top 10 Project Schedule Risks
The final set of tables show the Top 10 Schedule Risks for both options. The results indicate that Single
Bore is less-vulnerable to ground-caused risk (i.e. risk that is more subject to randomness and thus, less
mitigatable through management) and contains several opportunities for shortening schedule that are not
available to Twin Bore.
Twin Bore Top Ten Construction Schedule Risks
Ranked According to P80 Results
Rank
Risk Description First Step Mitigations
1 Process required greater than anticipated work to update design in order to achieve code compliance (including BART BFS)
Combination of ‐ Establish Code Compliance Plan. ‐ Start to analyze & risk assess system design with all potential impacts and required mitigation as soon as possible. ‐ (Re‐)design accordingly (either code‐compliant or by performance‐based risk assessment). ‐ Ask for variances.
2 Redesign of ventilation system required due to need to conform with instantaneous fire evacuation
Combination of ‐ Hi‐level agreement between VTA and BART to ad‐dress instantaneous fire issue. ‐ Reach out to BART's key decision‐makers and in‐clude appropriate staff transparently at all times. ‐ Start to analyze & risk assess instantaneous fire is‐sues with all potential impacts and required mitiga‐tion as soon as possible. ‐ (Re‐)design systems accordingly (either code‐compli‐ant or by performance‐based risk assessment). ‐ Have independent, well‐known and recognized Sub‐ject Matter Experts verify instantaneous fire issues analysis with all potential impacts and required miti‐gation.
3 Impacts to Downtown San Jose neighbor‐hood due to construction
Combination of ‐ Proactively implement & maintain Public Infor‐mation Officer, active & ongoing community outreach program, “Neighbors” Hotline, up to the minute web‐site & media information. ‐ Real‐time monitoring of construction impacts (noise, vibration, dust, settlements etc.)
4 Impacts to Diridon neighborhood due to construction
See #3 above
5 Impacts to Alum Rock neighborhood due to construction
See #3 above
Final D
raft

BSVII – Independent Comparative Analysis Volume I: Page 11
6 Above‐ground ground treatment for cross‐passages more than anticipated in base
Combination of ‐ Review spec and Geo‐information to ensure best practices are being followed (major impact if done poorly) ‐ Plan all ground modification/treatment needs to be performed from the surface where practical ‐ Re‐evaluate current SOP options for ground im‐provement from surface. ‐ Logistical pre‐planning to be emphasized
7 Cut and cover station construction unearths unexpected archeological artifacts at Down‐town San Jose site.
Combination of ‐ Reach out to all AHJ's and best‐performing archeo‐logical teams asap. ‐ Plan for compartmentalized archeological digging sites. ‐ Plan for ("virtual" and physical) workarounds. ‐ Optimize schedules with allowance for archeological digging.
8 Cut and cover station construction unearths unexpected archeological artifacts at Alum Rock site.
See #7 above
9 Changes are made to baseline tunnel align‐ment, in plan and profile. Additional borings are necessary.
Review current status of vulnerable alignment loca‐tions and assess obstacles to finalization and options Design team prioritize finalization of alignment upon resumption of design, start needed borings ASAP
10 TBM Drives from Diridon to Downtown San Jose hit unpredicted man‐made wells during excavation which stops progress of TBM
Combination ‐ Reaching out to TBM manufacturer(s) to work out this issue during design of TBM. ‐ Apply additional ground investigation & pre‐con‐struction surveys to identify potential (man‐made) obstructions. ‐ Use Ground Penetration Radar to localize instruc‐tions before hitting. ‐ Pre‐plan to develop contingencies for this occur‐rence.
Figure 6. Top 10 Twin Bore Schedule Risks
Final D
raft

Single Bore Top Ten Construction Schedule Risks
Ranked According to P80 Results
Rank Risk Description First Step Mitigations
1
The current BART system is a twin bore ver‐sus the proposed VTA single bore (resulting in Higher standard of "proof of design" re‐quired for single bore solution )
Combination of ‐ Hi‐level agreement between VTA and BART that ei‐ther options will be acceptable ‐ Hire facilitator to keep process moving (VTA to pro‐vide to BART) ‐ Educate BART O&M's on advantages of additional storage in SB approach ‐ Reach out to BART's key decision‐makers and include appropriate staff transparently at all times. ‐ Start to analyze & risk assess system compatibility with all potential impacts and required mitigation as soon as possible. ‐ (Re‐)design systems accordingly (either code‐compli‐ant or by performance‐based risk assessment). ‐ Have independent, well‐known and recognized Sub‐ject Matter Experts verify system compatibility analy‐sis with all potential impacts and required mitigation.
2 Redesign of ventilation system required due to need to conform with instantaneous fire evacuation
Combination of ‐ Reach out to all key decision‐makers and include ap‐propriate staff transparently at all times. ‐ Start to analyze & risk assess change of required ge‐ometry issues with all potential impacts and required mitigation as soon as possible. ‐ (Re‐)design stations accordingly (either code‐compli‐ant or by performance‐based risk assessment). ‐ Have independent, well‐known and recognized Sub‐ject Matter Experts verify stations with all potential impacts and required mitigation.
3 Impacts to neighborhoods due to construc‐tion
Combination of ‐ Proactively Implement & maintain Public Information Officer, active & ongoing community outreach pro‐gram, “Neighbors” Hotline, up to the minute website & media information. ‐ Real‐time monitoring of construction impacts (noise, vibration, dust, settlements etc.)
4 Opportunity to save Schedule by starting Trackwork before the end of Heavy Civil Construction [Opportunity]
Investigate further with Pre‐Design Team Vet process/sequencing with Industry Experts Describe conclusions in Design‐Build planning docu‐ments
Final D
raft

BSVII – Independent Comparative Analysis Volume I: Page 13
5 Opportunity to save Schedule by eliminating mid‐point ventillation shafts by using duct work within the larger tunnel [Opportunity]
Investigate further with Pre‐Design Team (both venti‐lation and emergency/maintenance access considera‐tions) Confirm acceptability of results with Industry Experts Describe conclusions in Design‐Build planning docu‐ments
6
TBM Drive from Downtown San Jose to Alum Rosk encounters different ground conditions from the ones assumed during Preliminary Engineering
Combination ‐ Apply additional ground investigation borings in this area. ‐ Pre‐plan to develop contingencies for this occurence.
7 Lawsuits by local businesses around Diridon Station
Combination of ‐ Proactively Implement & maintain Public Information Officer, active & ongoing community outreach pro‐gram, “Neighbors” Hotline, up to the minute website & media information. ‐ Real‐time monitoring of construction impacts (noise, vibration, dust, settlements etc.)
8 Lawsuits by local businesses around Alum Rock Station
See #7 above
9 Lawsuits by local businesses around Down‐town San Jose Station
See #7 above
10 Cut and cover station construction unearths unexpected archeological artifacts at Down‐town San Jose site.
Combination of ‐ Reach out to all AHJ's and best‐performing archeo‐logical teams asap. ‐ Plan for compartmentalized archeological digging sites. ‐ Plan for ("virtual" and physical) workarounds. ‐ Optimize schedules with allowance for archeological digging.
Figure 7. Top 10 Single Bore Schedule Risks/Opportunities
4 Conclusion
The P80 level of comparison was selected by VTA as its organizational risk tolerance level which was to be used in the comparison of results. The P80 level is the result found at the 80th percentile of outcomes ranked from lowest to highest (i.e., in 100,000 simulations, P80 is the cost result of the 80,000 highest costing project simulation). A dashboard summary of the P80 results is presented below.
Final D
raft
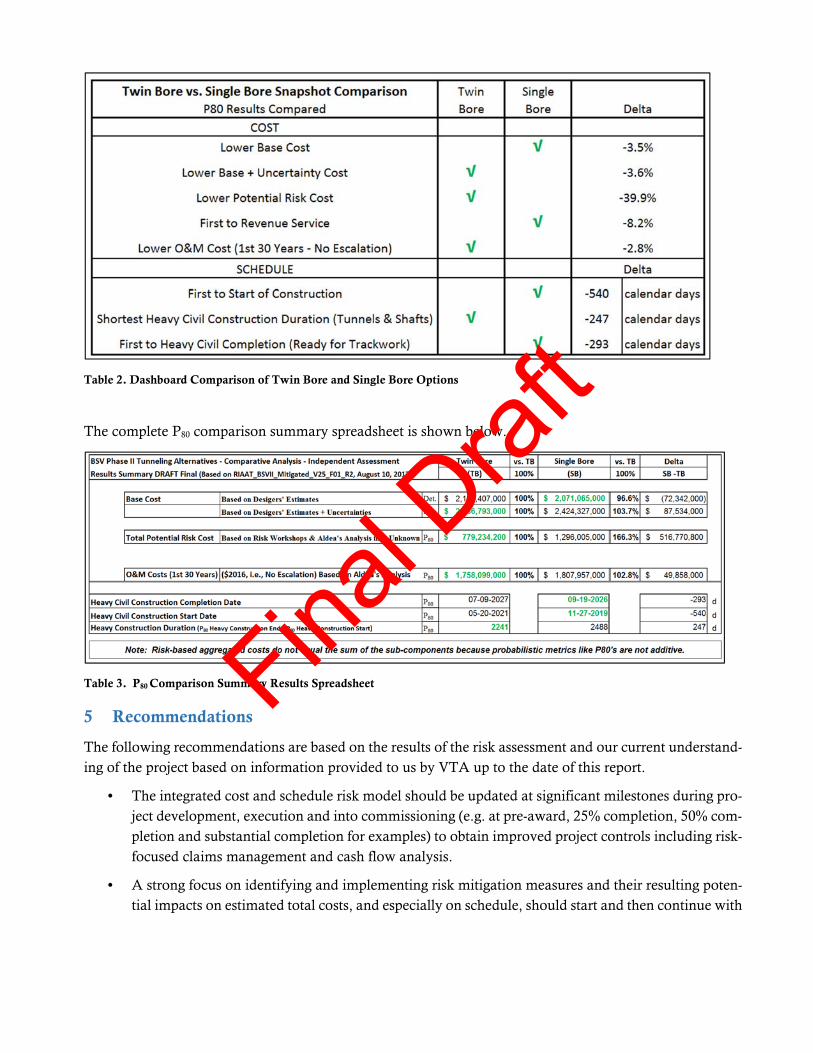
Table 2. Dashboard Comparison of Twin Bore and Single Bore Options
The complete P80 comparison summary spreadsheet is shown below.
Table 3. P80 Comparison Summary Results Spreadsheet
5 Recommendations
The following recommendations are based on the results of the risk assessment and our current understand-ing of the project based on information provided to us by VTA up to the date of this report.
• The integrated cost and schedule risk model should be updated at significant milestones during pro-ject development, execution and into commissioning (e.g. at pre-award, 25% completion, 50% com-pletion and substantial completion for examples) to obtain improved project controls including risk-focused claims management and cash flow analysis.
• A strong focus on identifying and implementing risk mitigation measures and their resulting poten-tial impacts on estimated total costs, and especially on schedule, should start and then continue with
Final D
raft
BSVII – Independent Comparative Analysis Volume I: Page 15
frequent involvement of VTA’s Construction Management (CM) Team and eventually include the contractor.
• Key Risk Indicators should be developed for significant risks and these should be monitored over time to indicate when risk mitigation measures should be started for optimal mitigation.
• The contractor should be required to submit a Risk Register with their bid and then with their base Schedule and update and review that Risk Register with the CM team quarterly.
• Project Cost Controls that include risk components should be implemented to track cost develop-ment and to merge risk management and change order management. This will help VTA identify risks that did not materialize so that any associated contingency funds allocated for these risks can
be released for other uses. It will also give VTA the opportunity to track risks that have materialized and their impacts on the project which will improve its risk management practices for future projects.
Final D
raft