
INTEGRATED COMMUNICATIONS MANAGEMENT OF …
61
This PDF file contains a chapter of: INTEGRATED COMMUNICATIONS MANAGEMENT OF BROADBAND NETWORKS Crete University Press, Heraklio, Greece ISBN 960 524 006 8 Edited by David Griffin Copyright © The ICM consortium, Crete University Press 1996 The electronic version of this book may be downloaded for personal use only. You may view the contents of the files using an appropriate viewer or print a single copy for your own use but you may not use the text, figures or files in any other way or distribute them without written permission of the copyright owners. First published in 1996 by CRETE UNIVERSITY PRESS Foundation for Research and Technology P.O. Box 1527, Heraklio, Crete, Greece 711 10 Tel: +30 81 394235, Fax: +30 81 394236 email: [email protected] Copyright © The ICM consortium, CUP 1996 The ICM consortium consists of the following companies: Alcatel ISR, France Alpha SAI, Greece Ascom Monetel, France Ascom Tech, Switzerland Centro de Estudos de Telecommunicações, Portugal Cray Communications Ltd., United Kingdom (Prime contractor) Danish Electronics, Light & Acoustics, Denmark De Nouvelles Architectures pour les Communications, France Foundation for Research and Technology - Hellas, Institute of Computer Science, Greece GN Nettest AS, Denmark National Technical University of Athens, Greece Nokia Corporation, Finland Queen Mary and Westfield College, United Kingdom Unipro Ltd., United Kingdom University College London, United Kingdom University of Durham, United Kingdom VTT - Technical Research Centre of Finland Downloaded from: http://www.ee.ucl.ac.uk/~dgriffin/papers/book/icmbook.html
Transcript of INTEGRATED COMMUNICATIONS MANAGEMENT OF …

This PDF file contains a chapter of:
INTEGRATED COMMUNICATIONS MANAGEMENTOF BROADBAND NETWORKS
Crete University Press, Heraklio, GreeceISBN 960 524 006 8
Edited by David Griffin
Copyright © The ICM consortium, Crete University Press 1996
The electronic version of this book may be downloaded for personal use only. You may viewthe contents of the files using an appropriate viewer or print a single copy for your own usebut you may not use the text, figures or files in any other way or distribute them withoutwritten permission of the copyright owners.
First published in 1996 byCRETEUNIVERSITY PRESS
Foundation for Research and TechnologyP.O. Box 1527, Heraklio, Crete, Greece 711 10
Tel: +30 81 394235, Fax: +30 81 394236email: [email protected]
Copyright © The ICM consortium, CUP 1996
The ICM consortium consists of the following companies:
Alcatel ISR, FranceAlpha SAI, Greece
Ascom Monetel, FranceAscom Tech, Switzerland
Centro de Estudos de Telecommunicações, PortugalCray Communications Ltd., United Kingdom (Prime contractor)
Danish Electronics, Light & Acoustics, DenmarkDe Nouvelles Architectures pour les Communications, France
Foundation for Research and Technology - Hellas, Institute of Computer Science, GreeceGN Nettest AS, Denmark
National Technical University of Athens, GreeceNokia Corporation, Finland
Queen Mary and Westfield College, United KingdomUnipro Ltd., United Kingdom
University College London, United KingdomUniversity of Durham, United Kingdom
VTT - Technical Research Centre of Finland
Downloaded from: http://www.ee.ucl.ac.uk/~dgriffin/papers/book/icmbook.html

349
Chapter 12
Experimental results
Editors: Dionysis Reisis, Richard LewisAuthors: Panos Georgatsos, Peter Baxedale, Dionysis Reisis
his chapter presents the results of testing and evaluating the ICM TMN func-tional implementation, as the concluding phase of the project. This phase isimportant for two reasons: it validates the functionality of the developed system,
and it shows the improvement in network performance resulting from operation of theTMN.
This chapter is organised as follows: Section 12.1 provides the rationale behind thetests and Section 12.2 introduces the evaluation procedures. Section 12.3 summarisesthe testing performed on real networks. Section 12.4 analyses in detail the tests andevaluation of the VPCM system applied on the ATM simulator. Section 12.5 drawsconclusions from the experimental work performed.
Owing to space constraints only a subset of the tests performed is described here.Further details can be found in ICM Deliverable 21 [12.3].
12.1 Rationale
ICM’s research activities included development of an experimental TMN Testbed, andconcluded with evaluation of the TMN functional implementation. This phase isimportant in many ways. The evaluation results are useful to the people involved in theproject: researchers can quantify the completion of their work; they can also identify
T
INTEGRATED COMMUNICATIONS MANAGEMENT OF BROADBAND NETWORKS
350
the elements of the system which can be improved to lead to more successful realisa-tion of their design. People external to the project will be able to understand the scopeof the utilisation of the system; the proof of the proper system behaviour will encour-age future use of the Testbed beyond the lifetime of the ICM project; measurements ofthe elements’ performance can lead to the development of improved algorithms.
Experience from testing and redesigning can be of great importance to industry andto research institutes, in the future. An overall evaluation of the Testbed will showwhether the architecture and the features of the developed system constitute the basisof future industrial products. Evaluation of a system consists mainly of showing thatthe system performance has been validated. Validation includes: design, execution andanalysis of experiments in order to show that the product has been developed accordingto its specifications.
The evaluation process must be efficient. In this context, the term efficiency has aparticular meaning. It requires the number of tests to be minimised, while retainingconfidence that the functionality and the performance of the system can be accuratelyassessed. This process is quite complex, possibly justifying a project in itself, andrequires an overall testing strategy to be followed. This must be thoroughly designed tolead to successful validation of the implementation.
Validation of the ICM Testbed functional implementation is essentially a systemtesting exercise. Traditionally, this task requires a significant proportion of theresources of a project. A methodical approach and detailed plan are therefore required.Testing is performed by an independent team which performs Black Box Testing, i.e.the test team is not required to know how the system works (the internal processes), thetest team is only required to know what the system does (how it reacts to given stim-uli). The test team is however, supported by system developers.
The test process is broken down into a number of test classes. A complete testingapproach is defined, although it is not expected that all tasks are applicable to the Test-bed. Indeed, they may not all be possible within the constraints of a research project.However, it is considered to be important to identify the tests and consciously decidetheir applicability, rather than risk the omission of key steps in the testing process. Thetest plan addresses the following subjects:
• Test Procedures (e.g. version control, fault reporting, conduct of tests),• Test Classes (e.g. case study tests, functional tests, performance tests),• Test Completion Criteria,• Test Documentation,• Test Results.
12.2 Test considerations
When all the Testbed components are operating together on a network, the conditionsunder which the tests are conducted can affect the results. The following paragraphsidentify some of the conditions which may affect the test results.

EXPERIMENTAL RESULTS
351
12.2.1 Management applications
The Testbed implementation process can be assessed by the ease with which differentapplications can be introduced and tested on it. Clearly, as the effort in the project isfinite, the number of applications produced will be, too. Thus each application pro-duced must be tested as rigorously as possible.
From the Testbed viewpoint, a measure of its usefulness is the effort required tointroduce new applications, so the manpower required should be carefully monitored.Measures should include not only the raw manpower required, but also an assessmentof the experience of the people involved. Is it the first application, or the tenth, thatthey have attempted to implement and integrate?
12.2.2 Network traffic and load
For each application, there will clearly be a need to characterise its performance in arange of network and TMN configurations, under a range of different traffic mixes withdifferent loads. Considering the network, if we have N traffic types from M sourcenodes, transmitting to M-1 destinations, we have an N*M*(M-1) dimensional problemspace for a given topology, with each parameter varying from zero to some definedmaximum and that is without considering the internal network states, such as VPCtopologies and capacities.
Problems can occur due to the fact that realistic traffic cannot be directly scaled, butmay be subject to quantification. For instance, a VCC carrying one video channel cannot be scaled by 10% in a meaningful way, but 500 voice calls can.
One way to minimise the impact of traffic variations is to define typical type mixes,that is, the proportion of voice, video, etc. that are representative for a given topology,and then to scale all traffic by some factor. This corresponds to multiplying all the traf-fic matrix terms by a constant factor. This has the effect of removing N dimensionsfrom the problem, while still giving a wide range coverage for the results. There areproblems in terms of defining one scalable matrix, and there may be a case for morethan one, but even if several are used, the problem space is still simplified.
12.2.3 Topologies
One could attempt to use a very large number (in the case of the simulator) of possiblenetwork topologies to test algorithms and management systems, but with limitedresources, a small representative set is required.
Based on experience of currently installed network technologies, the followingtypes of topology are included in the test scenarios:
1. A fully interconnected network. This is the type of network that is used betweenmajor national cities within a country, where it is assumed that traffic will be ofa generally uniform nature. Much of the uniformity will be a result of thevolume of traffic.
2. A fully interconnected main trunk with peripheral nodes. This type of networktakes account of the minor nodes connected to a main distribution network,usually with multiple connection for resilience.
INTEGRATED COMMUNICATIONS MANAGEMENT OF BROADBAND NETWORKS
352
3. Sparse network with one or more main nodes. This type of network is typical ofprivate networks where the major nodes are usually the companies’ head officesor computer centres, depending on the traffic types in questions.
4. Interconnected island. This type of network is representative of theinterconnections between countries or major centres of population separated bysignificant distances. Within a centre, normally well or fully interconnected,outbound traffic to a remote destination is funnelled onto a few lines.
12.2.4 TMN configuration
The TMN performance for a given network and loading condition should be assessedin several configurations. These should include the minimum practical number of proc-essors, as well as a highly distributed one, if test resources allow. In considering TMNconfigurations, it should be borne in mind that resilience will be important in real net-works, while processing power is rarely a major financial consideration today.
12.3 Experimental results
ICM focused on testing and evaluating its TMN functional implementation: initiallythe basic infrastructure functions of the TMN were tested on LAN FDDI network tech-nology, followed by testing and evaluation of a more complex management system -Virtual Path Connection Management (VPCM). In parallel with the VPCM evaluation,ICM implemented and tested the TMN functionality on a Passive Optical Network(PON). Finally, the project concluded its work with the evaluation of the TMNs withinan Intermediate Virtual Private Network scenario. In the paragraphs below we summa-rise the tests and evaluations of each of the above applications. This is followed bydetailed descriptions of two of the major tests performed on the VPCM system - LoadBalancing (LB) and Bandwidth Distribution (BD).
12.3.1 FDDI
The TMN platform and the fundamental management applications (e.g. monitoring)form the core of the management system and must be subject to tests before relying onthem for complex management applications. During these tests the capabilities of thebasic TMN modules were evaluated in terms of functionality, validity and perform-ance. The main components were: the network including SNMP agents at each node;Q-adaptors; a Network Element Level monitoring OS per network node; a NetworkLevel statistics OS; and a WS-OS.
The main steps followed for the functional testing were:• test each component separately, to ensure it works properly and correctly (capa-
bility),• test the integration of all components with the WS-OS(behaviour),• test the reaction of the system to abnormal situations such as network unavaila-
bility (resolution tests).

EXPERIMENTAL RESULTS
353
For the first of the above steps the statistics generated by the TMN were validatedagainst raw data collected directly from the network. The functional test showed thatthe TMN behaved as expected apart from some minor bugs met in abnormal situations.The TMN components exhibited the majority of the required features for these experi-ments, with the exception of some minor ones that would give more flexibility to themanager (presentation options, the ability to change the moving window size, eventreport post-processing). These requirements were fed back into the design an imple-mentation areas of the project for enhancement in the later prototypes.
Regarding system performance, response times were measured for each TMN com-ponent under different loads. The main conclusion was that the measured responsetimes were acceptable - comparable with a commercially available SNMP system. Themanagement communications overhead was measured in terms of the bandwidthrequired by the TMN and it was demonstrated that the traffic generated by the TMNsystem does not impose a significant load in FDDI networks. Finally the performancetests showed that the monitoring functions of the TMN can follow the traffic character-istics only when properly configured. Parameters such as the EWMA and the samplingintervals significantly affect the quality of the monitored data.
The functional tests demonstrated that the network monitoring system functionedas intended. The performance tests measured how well the TMN achieves its objec-tives in terms of processing speed and communications resources used. Details are pre-sented in ICM Deliverable 12 [12.1].
12.3.2 VPCM
The VPCM TMN system was tested in real and simulated environments. The systemincludes OSs which execute sophisticated algorithms, e.g. Load Balancing and Band-width Distribution. During operation, these OSs interact with the other OSs such as theConfiguration Manager, Route Design and Performance Verification, in order toimprove network performance.
The LB and BD experimental results and evaluation have been chosen to be pre-sented in Section 12.4 in detail, as their tests implicitly exercise the other OSs.
12.3.3 PON
In parallel with the VPCM system testing process, ICM evaluated the TMN systemapplied to the COBRA Passive Optical Network, with the following results:
• The evaluation has shown that it is possible to reuse the ICM TMN componentsto develop a TMN system applied to the management of a network technologywith different management requirements to those of ATM networks.
• Conformance to standards simplifies the task of managing heterogeneous net-works, demonstrated by adoption of SNMP for management within the PON,with a Q-Adaptor providing the interface to the TMN.
• With respect to implementation and deployment, the tools developed within theproject reduced the development time and maximised the reliability of theresulting system.

INTEGRATED COMMUNICATIONS MANAGEMENT OF BROADBAND NETWORKS
354
Finally, we can say that this phase was successfully developed and validated, and dem-onstrated the strengths of the ICM TMN implementation methods and tools, and howthese technologies can be applied in the future.
12.3.4 I-VPN
The goal of the final experiment was to show that the TMN concepts, as developed bythe project, are applicable to inter-domain management and interoperability. Theexperiments were conducted in a Pan-European environment consisting of multiplemanagement domains of different network and service providers. This phase tested theiVPN implementation, using an extended platform which includes support for security(access control and authentication) and inter-domain management. The iVPN systemwas demonstrated in a real Pan-European environment between the ETB and RIA net-works located in Switzerland and Portugal. In addition, it was shown that the ICM sim-ulator provided support for more complex experiments involving CPNs as well asmultiple interconnected networks.
12.4 VPCM experimental results
This section presents the functional validation tests results of the Load Balancing OSand the Bandwidth Distribution OS. The rationale for specifying the tests, the specifictest description and the results of the tests are presented. The tests were designed to becarried out using the ICM ATM simulator.
12.4.1 Load Balancing application tests
The purpose of the Load Balancing (LB) application test is to test and verify the func-tionality (intelligence) of the LB OS in a network environment. The test is performedat a system level with the necessary components of the ICM testbed. The test is carriedout in a variable traffic environment with the purpose to test and verify the functional-ity of the LB OS in all possible traffic conditions in which it might be activated.
It should be noted that the purpose of the test is not the detailed assessment of theperformance of the LB OS, in terms of benefits and costs to the network operation, sen-sitivity, management overhead, scaling and processing time. This test aims at validat-ing the functionality of the LB OS. Performance assessment is regarded as a huge taskand it is not addressed by this work. However, the validation tests may provide indica-tions on the performance of the LB OS.
12.4.1.1 Description of test cases
12.4.1.1.1 Analysis
The essence of the test, is to invoke the LB OS at instances where the network is at agiven state and subsequently to observe the produced actions. These instances shouldcover all (most of) the possible cases in which LB could be activated. The definition of

EXPERIMENTAL RESULTS
355
representative test cases that partition the network state space at LB invocationinstances is the theme of this section. We reason as follows:
The functionality of LB depends on:• the network CoSs and their bandwidth characteristics;• the routing plan;• the network load.
Therefore, the test cases should cover all possible values of the above parameters; aninfinite number of combinations.
However, in order to be able to test the functionality of LB, for each test case weshould be able to know the expected outcome i.e. the actions that LB would produce.The functionality of LB will be tested against the expected actions. For this reason, thetest cases should not be chaotic, but controlled and comprehensive. The approach takenis the following:
We focus on a tagged CoS and a tagged source destination (s-d) pair. This is done inorder to reduce unnecessary complexity. We further focus only on the LB actions arriv-ing at the switches of the tagged SDClassRoute network, rather than observing the LBactions arriving at all switches in the network. For the tagged pair of the tagged CoS,we distinguish test cases, conditioning on the previous parameters as follows:
Test cases regarding network CoSs
We condition on the peak bandwidth of the CoSs. Hence, we partition the networkCoSs into three categories according to whether their peak bandwidth is substantiallylarger, almost the same or substantially smaller than the peak bandwidth of our taggedCoS.
Note that the LB functionality does not depend on whether the network CoSs areCBR or VBR. Therefore, we assume the simplest type, the CBR type. Moreover notethat the LB functionality does not depend on the actual number, given that is greaterthan one, of the CoSs in each category; the results would be similar, if we replaced thenumber of CoSs, say nc, of a particular category of peak bandwidth pb, with a new cat-egory with a single CoS, with peak bandwidth the product of nc and pb. Therefore, thefollowing cases can be considered with respect to the network CoSs:
cases smaller category CoS same category CoS larger category CoS
C000 NO NO NO
C100 YES NO NO
C010 NO YES NO
C001 NO NO YES
C110 YES YES NO
C101 YES NO YES
C011 NO YES YES
C111 YES YES YES
Table 12.1 Test cases for the network CoSs

INTEGRATED COMMUNICATIONS MANAGEMENT OF BROADBAND NETWORKS
356
Test cases regarding routing plan
The routing plan denotes the set of routes for each (s-d) pair and each network CoS.The functionality of LB depends on the following aspects of the routing plan:
• the topology of the routes,• the multiplexing of the CoSs on the routes.
For the tagged (s-d) pair and network CoS, we consider a given set of routes providedthat the following topology constraints are met:
• there are physically different routes as well as routes with common parts,• there are routes with varying number of hops (VPCs up to the destination node),• there is alternatibility not only at the access node but also at the transient nodes
at every hop level.It is believed that with the above constraints the SDClassRoute networks are represent-ative of the route networks that will exist in the future networks. Given the SDClass-Route network of the tagged pair and CoS, and a given set of CoSs, corresponding tothe test cases of the previous table (Table 12.1), further cases can be therefore consid-ered, conditioning on the following parameters:
• For the cases with one extra CoS:• route alternatibility per CoS (1,>1).
• For the cases with two extra CoSs:• route alternatibility per CoS (1, >1),• route sharing (no, partial, total).
• For the case with three extra CoSs:• route alternatibility per CoS (1,>1),• route sharing per two CoSs (no, partial, total),• route sharing per three CoSs (no, partial, total).
In particular, from the many cases that can be found, the cases shown in Table 12.2 toTable 12.4 may be considered.
cases alternatibility
TP:1.1 1
TP:1.2 2
Table 12.2 Test cases for the routing plan: One extra CoS case
cases alternatibility route sharing
TP:2.1.1.N 1 1 NO
TP:2.1.1.T 1 1 TOTAL
TP:2.2.2.P 2 2 PARTIAL
Table 12.3 Test cases for the routing plan: Two extra CoS case
EXPERIMENTAL RESULTS
357
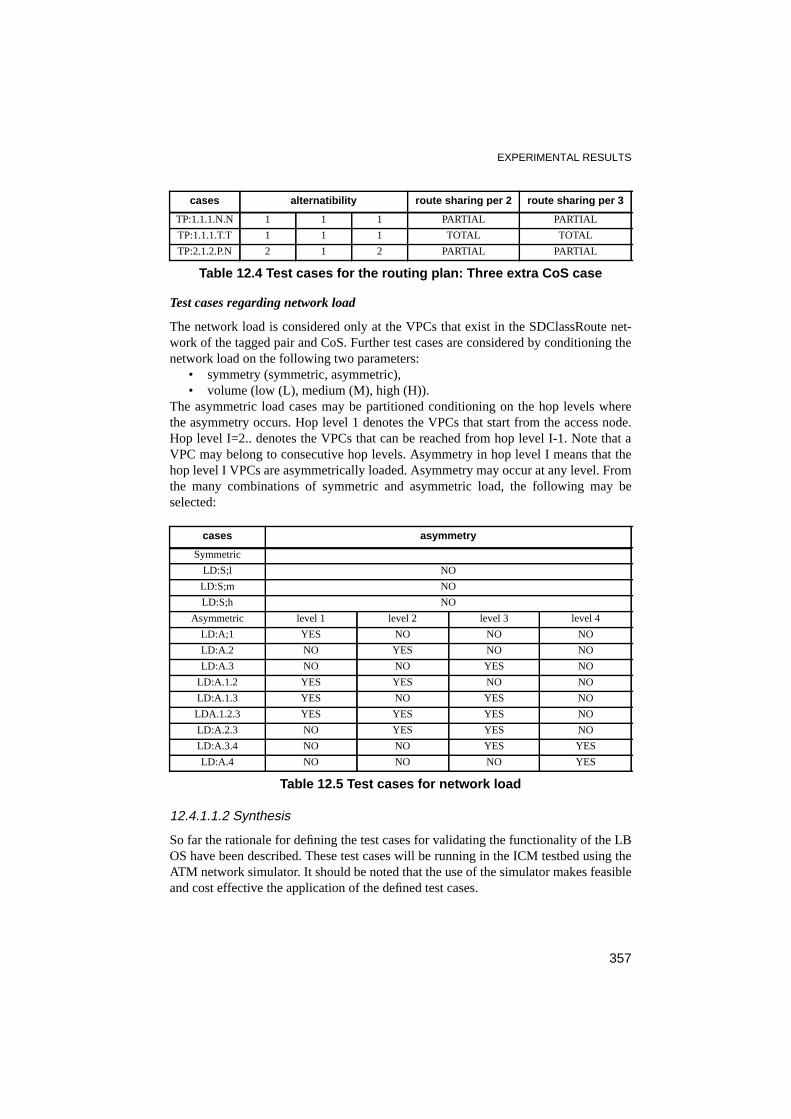
Test cases regarding network load
The network load is considered only at the VPCs that exist in the SDClassRoute net-work of the tagged pair and CoS. Further test cases are considered by conditioning thenetwork load on the following two parameters:
• symmetry (symmetric, asymmetric),• volume (low (L), medium (M), high (H)).
The asymmetric load cases may be partitioned conditioning on the hop levels wherethe asymmetry occurs. Hop level 1 denotes the VPCs that start from the access node.Hop level I=2.. denotes the VPCs that can be reached from hop level I-1. Note that aVPC may belong to consecutive hop levels. Asymmetry in hop level I means that thehop level I VPCs are asymmetrically loaded. Asymmetry may occur at any level. Fromthe many combinations of symmetric and asymmetric load, the following may beselected:
12.4.1.1.2 Synthesis
So far the rationale for defining the test cases for validating the functionality of the LBOS have been described. These test cases will be running in the ICM testbed using theATM network simulator. It should be noted that the use of the simulator makes feasibleand cost effective the application of the defined test cases.
cases alternatibility route sharing per 2 route sharing per 3
TP:1.1.1.N.N 1 1 1 PARTIAL PARTIAL
TP:1.1.1.T.T 1 1 1 TOTAL TOTAL
TP:2.1.2.P.N 2 1 2 PARTIAL PARTIAL
Table 12.4 Test cases for the routing plan: Three extra CoS case
cases asymmetry
Symmetric
LD:S;l NO
LD:S;m NO
LD:S;h NO
Asymmetric level 1 level 2 level 3 level 4
LD:A;1 YES NO NO NO
LD:A.2 NO YES NO NO
LD:A.3 NO NO YES NO
LD:A.1.2 YES YES NO NO
LD:A.1.3 YES NO YES NO
LDA.1.2.3 YES YES YES NO
LD:A.2.3 NO YES YES NO
LD:A.3.4 NO NO YES YES
LD:A.4 NO NO NO YES
Table 12.5 Test cases for network load

INTEGRATED COMMUNICATIONS MANAGEMENT OF BROADBAND NETWORKS
358
For each of the cases C:xxxx (see Table 12.1) and each of the cases TP:xxxxxappropriate networks are defined. The networks differ in the number of CoSs and in theset of routes for each CoS. The test cases LD:xxxx are generated by creating appropri-ate traffic profiles and user groups using these profiles. With these profiles, the loaddeviations corresponding to the defined LD:xxxx cases will be created.
For each experiment, the invocation times of the LB OS are specified together withthe expected actions at each invocation instant. By comparing the actions taken withthose expected at each invocation instant, the functionality of the LB OS is verified.
The configuration of the ICM testbed for the LB application test is as follows:• SimMMI,• Simulation engine,• Simulator’s QA,• NL Configuration Manager OS,• Current Load Model OS,• Route Design OS,• Load Balancing OS,• TMN WS-OS.
12.4.1.2 Description of network experiments
12.4.1.2.1 Network experiment A
Physical topology
The physical topology is shown in Figure 12.1.
Connection and service classes
connection types typemean bandwidth
(Mb/s)peak bandwidth
(Mb/s)
c1 CBR 5 5
c2 CBR 10 10
c3 CBR 2 2
Table 12.6 Supported connection types for experiment A
service classes no of connection types connection type
srv1 1 (forward) c1
srv2 1 (forward) c2
srv3 1 (forward) c3
Table 12.7 Offered services for experiment A

EXPERIMENTAL RESULTS
359
Logical topology
VPC id start nodedestination
nodelinks capacity (Mb/s)
100 1 7 22 50
101 7 8 36 50
102 8 3 46 50
103 8 3 42,48 50
104 1 11 15,9,12 50
105 11 3 28,40 50
106 11 3 26,48 50
107 7 11 24 50
200 7 1 21 50
201 8 7 35 50
202 3 8 45 50
Table 12.8 VPCs for experiment A
Figure 12.1 Reference network physical topology
node1
node0
node6
node4
node10
node5
node2
node3
node9
node8
node11
node7
33
19
13
1
34
45
15
27
32
7
4
43
47
38
25
42
50
5
49
30
18
20
23
44
35
40
39
11
2914
2
8
9
28
6
37
4836
24
16
26
41
17
46
21
12
10
3
31
22

INTEGRATED COMMUNICATIONS MANAGEMENT OF BROADBAND NETWORKS
360
203 3 8 47, 41 50
204 11 1 11, 10, 16 50
205 3 11 39, 27 50
206 3 11 47, 25 50
207 11 7 23 50
route destination node connection types VPCs
R1 3 c1, c3 100, 101, 102
R2 3 c1 100, 101, 103
R3 3 c1 104, 106
R4 3 c1, c2 104, 105
R5 3 c1 100, 107, 105
R6 3 c1 100, 107, 106
Table 12.9 Routes for experiment A
destinationnode
connection type VPC priority
node 1 3 c1 100 2
3 c1 104 1
node 7 3 c1 101 2
3 c1 107 1
node 8 3 c1 102 2
Table 12.10 Initial route selection priorities for experiment A
VPC id start nodedestination
nodelinks capacity (Mb/s)
Table 12.8 VPCs for experiment A
Figure 12.2 SDClassRoute network for (1-3) (s-d) pair andCoSs c1, c2, c3
node3
node8
node11
node7
node1
vpc 104
vpc 100
vpc 107
vpc 102
vpc 103
vpc 106
vpc 105
vpc 101
EXPERIMENTAL RESULTS
361
Traffic definition
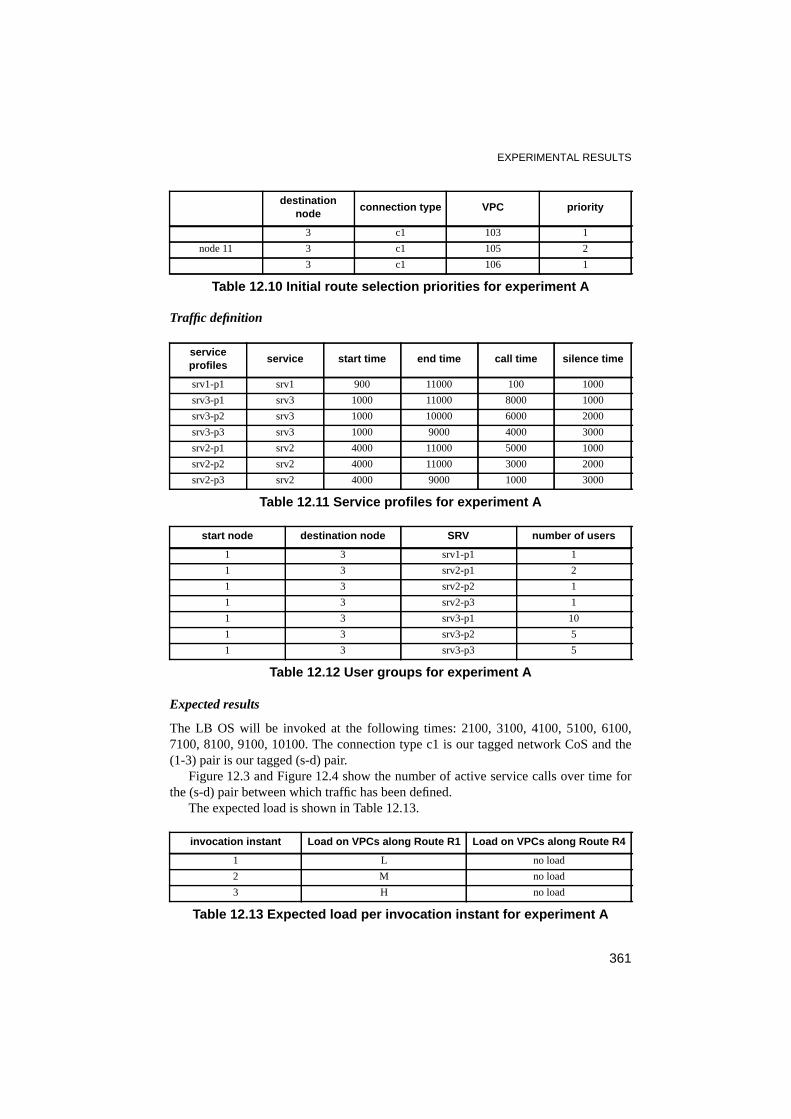
Expected results
The LB OS will be invoked at the following times: 2100, 3100, 4100, 5100, 6100,7100, 8100, 9100, 10100. The connection type c1 is our tagged network CoS and the(1-3) pair is our tagged (s-d) pair.
Figure 12.3 and Figure 12.4 show the number of active service calls over time forthe (s-d) pair between which traffic has been defined.
The expected load is shown in Table 12.13.
3 c1 103 1
node 11 3 c1 105 2
3 c1 106 1
serviceprofiles
service start time end time call time silence time
srv1-p1 srv1 900 11000 100 1000
srv3-p1 srv3 1000 11000 8000 1000
srv3-p2 srv3 1000 10000 6000 2000
srv3-p3 srv3 1000 9000 4000 3000
srv2-p1 srv2 4000 11000 5000 1000
srv2-p2 srv2 4000 11000 3000 2000
srv2-p3 srv2 4000 9000 1000 3000
Table 12.11 Service profiles for experiment A
start node destination node SRV number of users
1 3 srv1-p1 1
1 3 srv2-p1 2
1 3 srv2-p2 1
1 3 srv2-p3 1
1 3 srv3-p1 10
1 3 srv3-p2 5
1 3 srv3-p3 5
Table 12.12 User groups for experiment A
invocation instant Load on VPCs along Route R1 Load on VPCs along Route R4
1 L no load
2 M no load
3 H no load
Table 12.13 Expected load per invocation instant for experiment A
destinationnode
connection type VPC priority
Table 12.10 Initial route selection priorities for experiment A

INTEGRATED COMMUNICATIONS MANAGEMENT OF BROADBAND NETWORKS
362
L: low load (utilisation 20/50) NB: VPCs vpc103 and vpc106 will have no loadM: medium load (utilisation 30/50)H: high load (utilisation 40/50)
The experiments are concerned with traffic of different CoSs between a single (s-d)pair. The SDClassRoute networks have alternatibility 1 (for the other CoSs) or 2 (forthe tagged CoS) in hop levels 1,2 and 3. With these test suites the functionality of LB,particularly regarding to the total route sharing and symmetric or asymmetric load (inhop levels 1, 2 and 3) test aspects, will be verified. The expected results regarding routeselection priority changes for the routes of the tagged CoS, c1, per invocation instantare described next.
At invocation instant 1, the VPCs along route R1 are lightly loaded, whereas theother VPCs carry no load. Since the initial route selection priorities for CoS c1, innodes 1, 7 and 8 suggest selection of the loaded VPCs, it is expected that LB willchange the route selection priorities to suggest the selection of the non-loaded VPCs.Specifically, in node 1, vpc104 will be given a higher priority than vpc100 which is
4 H L
5 H M
6 H H
7 M M
8 L L
9 no load no load
invocation instant Load on VPCs along Route R1 Load on VPCs along Route R4
Table 12.13 Expected load per invocation instant for experiment A
Figure 12.3 Active calls of c3 for the (1-3) pair
21 3 4 5 6 7 8 9 10
10
15
20
calls
20
30
40
offeredbw (Mb/s)
time(x 1000)
Figure 12.4 Active calls of c2 for the (1-3) pair
21 3 4 5 6 7 8 9 10
23
4
calls
2030
40
offeredbw (Mb/s)
time(x1000)

EXPERIMENTAL RESULTS
363
loaded, hence, a change priority action is expected. In node 7, the choice is betweenvpc107 (non-loaded) and vpc101 (loaded). Obviously, a priority change is expected inthis node in favour of vpc107. Similarly, in node 8, LB is expected to change prioritiesso that to suggest VPC vpc103 (non-loaded), rather than VPC vpc102 (loaded). In node11, both vpc106 and vpc105 are non-loaded. VPC105 has been initially set with ahigher priority. However, vpc105 is to be shared by CoSs c1 and c3, whereas VPCvpc106 is to exclusively accommodate traffic from CoS c1. Therefore, it is expectedLB to change priorities in favour of vpc106, as the LB functionality has been designedto take into account the alternatibility of the different CoSs, protecting CoSs with lessalternatibility over CoSs with higher alternatibility.
The load at invocation instances 2 and 3 is similar with the load in the previousinvocation instances but the load on the VPCs along route R1 has increased to medium(instant 2) and to high (instant 3). Obviously, the non-loaded VPCs should be sug-gested for routing. Since this selection preference is already reflected with the currentroute selection priorities, it is expected LB not to determine any action.
At invocation instances 4 and 5, the load on the VPCs along route R1 is the same asin the previous instant and the VPCs along route R4 have light (instant 4) or medium(instant 5) load. At node 1, both vpc100 and vpc104 are loaded but vpc100 has agreater load than vpc104, hence vpc104 should be preferred. Vpc104 already hashigher priority than vpc100 (from the first invocation), therefore no action is expected.In the other nodes, there is a choice between loaded and non-loaded VPCs. Since thenon-loaded VPCs have been suggested for routing from the first invocation instant, it isexpected LB will not take any action.
At invocation instant 6, the VPCs along routes R1 and R4 are all highly loaded. Atnode 1, both vpc100 and vpc104 have the same load; vpc100 is shared between CoSsc1 and c2 and vpc104 is shared by CoSs c1 and c3. However, the bandwidth require-ments of CoS c2 are higher than the bandwidth requirements of CoS c3. The design ofthe LB algorithm, in addition to the load and alternatibility criteria, favours routes thatare shared by lower bandwidth CoSs than routes shared by higher bandwidth CoSs.Therefore, since vpc104 had higher priority than vpc100, it is expected LB to changepriorities so that to favour vpc100. In the other nodes, since there is a choice between anon-loaded VPC and a loaded VPC, the non-loaded VPC should be preferred. Giventhat the priorities as set by the first invocation instant prioritise these non-loaded VPCs,no LB action is expected.
Invocation instances 7, 8 and 9 are similar to the previous invocation instant but theload on the routes has been decreased to medium (instant 7), light (instant 8) and noload at all (instant 9) respectively. Following the arguments presented for the previousinstant, the priorities should remain unchanged. Therefore, no LB action is expected.
The expected LB actions are summarised in Table 12.14.

INTEGRATED COMMUNICATIONS MANAGEMENT OF BROADBAND NETWORKS
364
Results
The results per invocation instant as produced by the actual invocation of the LB OSare presented below:
#file: lb_log.dat#Experiment: lbapltstexp1a-###invocation Instant: 1Sending Update NRT start node EU_1_A-EU1, CoSId 1, Dest EU_1_A-EU3, VPC vpc100, Prio 1 OldPrio 2Sending Update NRT start node EU_1_A-EU1, CoSId 1, Dest EU_1_A-EU3, VPC vpc104, Prio 2 OldPrio 1Sending Update NRT start node EU_1_T-EU7, CoSId 1, Dest EU_1_A-EU3, VPC vpc101, Prio 1 OldPrio 2Sending Update NRT start node EU_1_T-EU7, CoSId 1, Dest EU_1_A-EU3, VPC vpc107, Prio 2 OldPrio 1Sending Update NRT start node EU_1_T-EU8, CoSId 1, Dest EU_1_A-EU3, VPC vpc102, Prio 1 OldPrio 2Sending Update NRT start node EU_1_T-EU8, CoSId 1, Dest EU_1_A-EU3, VPC vpc103, Prio 2 OldPrio 1Sending Update NRT start node EU_1_T-EU11, CoSId 1, Dest EU_1_A-EU3, VPC vpc106, Prio 3 OldPrio 1Sending Update NRT start node EU_1_T-EU11, CoSId 1, Dest EU_1_A-EU3, VPC vpc105, Prio 1 OldPrio 3###invocation Instant: 2###invocation Instant: 3###invocation Instant: 4###invocation Instant: 5###invocation Instant: 6Sending Update NRT start node EU_1_A-EU1, CoSId 1, Dest EU_1_A-EU3, VPC vpc100, Prio 2 OldPrio 1Sending Update NRT start node EU_1_A-EU1, CoSId 1, Dest EU_1_A-EU3, VPC vpc104, Prio 1 OldPrio 2###invocation Instant: 7###invocation Instant: 8###invocation Instant: 9
As it can be seen (see Table 12.14), LB functions as expected.
invocationinstances
node 1 vpcpriority
node 7 vpcpriority
node 8 vpcpriority
node 11 vpcpriority
1 104 2*100 1*
107 2*101 1*
103 2*102 1*
106 2*105 1*
2 as previous as previous as previous as previous
3 as previous as previous as previous as previous
4 as previous as previous as previous as previous
5 as previous as previous as previous as previous
6 100 2*104 1*
as previous as previous as previous
7 as previous as previous as previous as previous
8 as previous as previous as previous as previous
9 as previous as previous as previous as previous
Table 12.14 Expected actions for experiment A

EXPERIMENTAL RESULTS
365
12.4.1.2.2 Network experiment B
Physical topology
As in experiment A (see Figure 12.1).
Connection and service classes
As in experiment A.
Logical topology
VPC id start nodedestination
nodelinks capacity (Mb/s)
100 1 7 22 50
101 7 8 36 50
102 8 3 46 50
103 8 3 42, 48 50
104 1 11 15, 9, 12 50
105 11 3 28, 40 50
106 11 3 26, 48 50
107 7 11 24 50
110 2 8 43 50
111 2 7 33 50
113 8 4 42, 37, 30 50
200 7 1 21 50
201 8 7 35 50
202 3 8 45 50
203 3 8 47,41 50
204 11 1 11, 10, 16 50
205 3 11 39, 27 50
206 3 11 47, 25 50
207 11 7 23 50
210 8 2 44 50
211 7 2 34 50
213 4 8 29, 38, 41 50
Table 12.15 VPCs for experiment B
route destination node CoS VPCs
R1 3 c1 100, 101, 102
R2 3 c1, c2 104, 106
R3 3 c1 104, 207, 101, 102
R4 3 c3 110, 102
R5 4 c3 111, 101, 113
Table 12.16 Routes for experiment B

INTEGRATED COMMUNICATIONS MANAGEMENT OF BROADBAND NETWORKS
366
Traffic definition
destinationnode
connection type VPC priority
node 1 3 c1 100 2
3 c1 104 1
node 11 3 c1 207 2
3 c1 106 1
Table 12.17 Initial route selection priorities for experiment B
serviceprofiles
service start time end time call time silence time
srv1-p1 srv1 900 11000 100 1000
srv3-p1 srv3 1000 3500 1000 1000
srv3-p2 srv3 1000 7000 3000 2000
srv2-p1 srv2 1000 7000 1000 3000
srv2-p2 srv2 3000 7000 2000 1000
Table 12.18 Service profiles for experiment B
start node destination node SRV number of users
1 3 srv2-p1 1
1 3 srv2-p2 3
2 3 srv3-p1 15
2 4 srv3-p2 15
Table 12.19 User groups for experiment B
Figure 12.5 S-DClassRoute networks for (1-3), (2-3), (2-4) (s-d) pairs andCoSs c1, c2, c3
node3
node8
node11
node7
node1
vpc 104
vpc 100
vpc 207
vpc 102
vpc 106
vpc 101
node2
node4
vpc 111
vpc 110
vpc 113

EXPERIMENTAL RESULTS
367
Expected results
The LB OS will be invoked at the following times: 2100, 3100, 4100, 5100, 6100. Theconnection type c1 is our tagged network CoS and the (1-3) pair is our tagged (s-d)pair.
The following figures show the number of active service calls in time for the (s-d)pairs between which traffic has been defined.
Figure 12.6 Active calls of c3 for the (2-3) pair
21 3 4 5 6 7 8 9 10
15
calls
30
offeredbw (Mb/s)
time(x 1000)
Figure 12.7 Active calls of c3 for the (2-4) pair
21 3 4 5 6 7 8 9 10
15
calls
30
offeredbw (Mb/s)
time(x1000)
4
Figure 12.8 Active calls of c2 for the (1-3) pair
21 3 4 5 6 7 8 9 10
calls
40
offeredbw (Mb/s)
time(x1000)
330

INTEGRATED COMMUNICATIONS MANAGEMENT OF BROADBAND NETWORKS
368
The expected load on network resources is shown Table 12.20.
L: low load (utilisation 20/50)M: medium load (utilisation 30/50)H: high load (utilisation 40/50)
The experiments are concerned with traffic of different CoSs between multiple sourcedestination pairs. The SDClassRoute networks have alternatibility 1 (for the otherCoSs) or 2 (for the tagged CoS) in hop levels 1,2. With these test suites the functional-ity of LB, particularly regarding to the total and partial route sharing and asymmetricload (between hop levels 1, 2 and 3) test aspects, will be verified. The expected resultsregarding route selection priority changes for the routes of the tagged CoS, c1, perinvocation instant are described next.
At invocation instant 1, vpc102 which belongs to routes R1 and R3 of the taggedCoS is medium loaded. The priorities in the nodes 1 and 11 have been initially set tosuggest routing over these routes; therefore, LB when invoked should take actions sothat to suggest routing over route R2. In particular the following LB actions areexpected: in node 1 vpc104 should be selected against vpc100, since congestion existsin a remote area of the routes starting with vpc100. For the same reason, in node 11vpc106 should be selected against vpc 207.
Invocation instant 2 is similar to the previous invocation instant, except that vpc101and not vpc102 is medium loaded. VPC101 also belongs to routes R1 and R3 of thetagged CoS. Since in the previous invocation instant, LB changed the priorities so thatto suggest routing over the VPCs of route R2, no LB action is expected at this instant.
In invocation instant 3, vpc101 (belonging to the routes R1 and R3) is still remainsmedium loaded but vpc104 and vpc106 (which both belong to route R2) are nowhighly loaded. The priorities from the previous instant have been set to suggest routingalong route R2. Since LB has been designed so that to suggest routing over less loadedroutes as well as over routes which are shared with lower bandwidth CoSs, it isexpected LB to changes the priorities so that to avoid route R2. In particular, the fol-lowing actions are expected: in node 1 vpc100 should be selected against vpc104 sincevpc104 leads to significantly more congested network areas. Moreover, vpc104 isshared by another CoS, whereas vpc100 is dedicated to routing the tagged CoS traffic.For the same reason, in node 11 vpc106 should be selected against vpc207.
Invocation instant 4 is similar to the previous one, but now the VPCs have the samevolume of traffic. Since LB has been designed to favour routes that are shared by lower
invocation instancesload on VPCs along
route R2load on VPCs along
route R4load on VPCs along
route R5
1 no load M no load
2 no load no load M
3 H no load M
4 M no load M
5 no load no load no load
Table 12.20 Expected load per invocation instant for experiment B

EXPERIMENTAL RESULTS
369
bandwidth CoSs, routing over route R2 should be avoided -route R2 is completelyshared by CoS c2 requiring 10 Mb/s, whereas routes R1 and R3 are partially shared byCoS c3 requiring 2 Mb/s. Therefore, no LB action is expected since routing over routesR1 and R2 has been suggested from the previous invocation instant.
In invocation instant 5, all VPCs are not loaded. Following similar arguments withthe previous instant, no LB action is expected.
The expected LB actions are summarised in Table 12.21.
Results
The results per invocation instant as produced by the actual invocation of the LBOS are presented below:
#file: lb_log.dat#Experiment: lbapltstexp3-###invocation Instant: 1Sending Update NRT start node EU_1_A-EU1, CoSId 1, Dest EU_1_A-EU3, VPC vpc100, Prio 1 OldPrio 2Sending Update NRT start node EU_1_A-EU1, CoSId 1, Dest EU_1_A-EU3, VPC vpc104, Prio 2 OldPrio 1Sending Update NRT start node EU_1_T-EU11, CoSId 1, Dest EU_1_A-EU3, VPC vpc106, Prio 2 OldPrio 1Sending Update NRT start node EU_1_T-EU11, CoSId 1, Dest EU_1_A-EU3, VPC vpc207, Prio 1 OldPrio 2###invocation Instant: 2###invocation Instant: 3Sending Update NRT start node EU_1_A-EU1, CoSId 1, Dest EU_1_A-EU3, VPC vpc100, Prio 2 OldPrio 1Sending Update NRT start node EU_1_A-EU1, CoSId 1, Dest EU_1_A-EU3, VPC vpc104, Prio 1 OldPrio 2Sending Update NRT start node EU_1_T-EU11, CoSId 1, Dest EU_1_A-EU3, VPC vpc106, Prio 1 OldPrio 2Sending Update NRT start node EU_1_T-EU11, CoSId 1, Dest EU_1_A-EU3, VPC vpc207, Prio 2 OldPrio 1###invocation Instant: 4###invocation Instant: 5
As it can be seen (see Table 12.21), LB functions as expected.
invocation instancesnode 1
vpc prioritynode 11
vpc priority
1 104 2*100 1*
106 2*207 1*
2 as previous as previous
3 100 2*104 1*
106 1*207 2*
4 as previous as previous
5 as previous as previous
Table 12.21 Expected actions for experiment B

INTEGRATED COMMUNICATIONS MANAGEMENT OF BROADBAND NETWORKS
370
12.4.1.2.3 Network experiment C
Physical topology
The same as in experiment A (see Figure 12.1).
Connection and service classes
As in experiment A.
Logical topology
VPC id start nodedestination
nodelinks capacity (Mb/s)
100 1 7 22 50
101 7 8 36 50
102 8 3 46 50
103 8 3 42, 48 50
104 1 11 15, 9, 12 50
105 11 3 28, 40 50
106 11 3 26, 48 50
110 2 8 43 50
200 7 1 21 50
201 8 7 35 50
202 3 8 45 50
203 3 8 47, 41 50
204 11 1 11, 10, 16 50
205 3 11 39, 27 50
206 3 11 47, 25 50
210 8 2 44 50
Table 12.22 VPCs for experiment C
route destination node CoS VPCs
R1 3 c1 100, 101, 102
R2 3 c1 104, 106
R3 3 c3 110, 102
Table 12.23 Routes for experiment C
destinationnode
connection type VPC priority
node 1 3 c1 100 2
3 c1 104 1
Table 12.24 Initial route selection priorities for experiment C

EXPERIMENTAL RESULTS
371
Traffic definition
Expected results
The LB OSF will be invoked at the following times: 1050, 1450, 1850, 2250. The con-nection type c1 is our tagged network CoS and the (1-3) pair is our tagged (s-d) pair.
Figures 12.10 and 12.11 show the number of active service calls in time for the (s-d) pairs between which traffic has been defined.
serviceprofiles
service start time end time call time silence time
srv1-p1 srv1 600 2600 800 800
srv1-p2 srv1 800 2600 400 1000
srv3-p1 srv3 600 2600 1200 400
Table 12.25 Service profiles for experiment C
start node destination node service number of users
1 3 srv1-p1 4
1 3 srv1-p2 4
2 3 srv3-p1 10
Table 12.26 User groups for experiment C
Figure 12.9 S-DClassRoute networks for (1-3), (2-3) (s-d) pairsand CoSs c1, c3
node3
node8
node11
node7
node1
vpc 104
vpc 100
vpc 102 vpc 106
vpc 101
node2
vpc 110

INTEGRATED COMMUNICATIONS MANAGEMENT OF BROADBAND NETWORKS
372
The expected load on network resources is shown in the table below.
L: low load (utilisation 20/50)M: medium load (utilisation 30/50)H: high load (utilisation 40/50)
The experiments are concerned with traffic of different CoSs between multiple sourcedestination pairs. The SDClassRoute networks have alternatibility 1 (for the otherCoSs) or 2 (for the tagged CoS) in hop level 1. With these test suites the functionalityof LB, particularly regarding to the partial route sharing and asymmetric load (betweenhop levels 1, 2 and 3) test aspects, will be verified. The expected results regarding routeselection priority changes for the routes of the tagged CoS, c1, per invocation instantare described next.
At invocation instant 1, only vpc102, which belongs to route R1 of the tagged CoS,is lightly loaded. Initially the priorities have been set to suggest routing over route R1.
invocation instances load on VPCs along route R3offered load of tagged CoS
generated by S-D 1-3
1 L no load
2 L L
3 L H
4 no load no load
Table 12.27 Expected load per invocation instant for experiment C
Figure 12.10 Active calls of c3 for the (2-3) pair
10 14 18 22
10
calls
20
offeredbw (Mb/s)
time(x 100)
Figure 12.11 Active calls of c1 for the (1-3) pair
10 14 18 22
8
calls
40
offeredbw (Mb/s)
time(x 100)
420

EXPERIMENTAL RESULTS
373
Since LB has been designed to favour the least congested routes, it is expected to takeactions so that to avoid route R1 which uses vpc102. In particular, it is expected tochange priorities in node 1 so that to favour vpc104 rather than vpc100 which leads tomore congested network areas.
At invocation instant 2, vpc102 is still lightly loaded. A part of route R1 is alsoloaded with the same amount of load; due to load of the tagged CoS, offered by the (1-3) pair, which followed route R2, recommended from the previous invocation instant.However, route R1 is partially used by another CoS, c3, of another (s-d) pair, whichuses that route with alternatibility 1. Since LB favours routes which are exclusivelydedicated to a particular CoS at the expense of routes that are shared by other CoSs, itis expected to favour routing over route R2. Since routing over route R2 has been rec-ommended from the previous invocation instant, no LB action is expected to occur.
At invocation instant 3, the load in route R2 has increased to high. Although routeR2 is not shared by another CoS whereas route R2 is, the load difference between thesetwo routes is expected to prevail, and therefore LB should change the priorities so thatto suggest routing over route R1 (the least congested ones). Specifically, in node 1, theroute selection priorities are expected to change so that to favour vpc100 (leading tothe least congested network area, even if is to create congestion to the route of anotherCoS of another (s-d) pair), than vpc104 (which is already overloaded).
At invocation instant 4, the load on route R2 is still high. In addition, the load onvpc102, part of route R1, is also high. From the previous invocation instant route R1has been set higher priorities that route R1. But because route R1 is to be used byanother CoS of another (s-d) pair, whereas route R2 is not, according to the LB design,it is expected the priorities to change so that to suggest routing over route R2. Specifi-cally, in node 1, the priorities will change so that to favour vpc104 (leading to the ded-icated route R2), rather than vpc100 (leading to a route that affects routes of other (s-d)pair CoSs).
The expected LB actions are summarised in Table 12.28.
invocation instancesnode 1
vpc priority
1 104 2*100 1*
2 as previous
3 100 2*104 1*
4 104 2*100 1*
Table 12.28 Expected actions for experiment C

INTEGRATED COMMUNICATIONS MANAGEMENT OF BROADBAND NETWORKS
374
Results
The results per invocation instant as produced by the actual invocation of the LB OSare presented below:
#file: lb_log.dat#Experiment: lbapltstexp3-###invocation Instant: 1Sending Update NRT start node EU_1_A-EU1, CoSId 1, Dest EU_1_A-EU3, VPC vpc100, Prio 1 OldPrio 2Sending Update NRT start node EU_1_A-EU1, CoSId 1, Dest EU_1_A-EU3, VPC vpc104, Prio 2 OldPrio 1###invocation Instant: 2###invocation Instant: 3Sending Update NRT start node EU_1_A-EU1, CoSId 1, Dest EU_1_A-EU3, VPC vpc100, Prio 2 OldPrio 1Sending Update NRT start node EU_1_A-EU1, CoSId 1, Dest EU_1_A-EU3, VPC vpc104, Prio 1 OldPrio 2###invocation Instant: 4Sending Update NRT start node EU_1_A-EU1, CoSId 1, Dest EU_1_A-EU3, VPC vpc100, Prio 1 OldPrio 2Sending Update NRT start node EU_1_A-EU1, CoSId 1, Dest EU_1_A-EU3, VPC vpc104, Prio 2 OldPrio 1
As it can be seen (see Table 12.28), LB functions as expected.
12.4.1.3 Conclusions on the Load Balancing capability tests
The functionality of LB has been validated in a number of test suites defined in thecourse of different experiments. The test suites considered, cover a significant numberof representative test cases. The rationale behind the definition of representative testcases partitioning the space of network states in which the LB OS might be invoked,has also been presented. Specifically, the test suites considered covered different casesregarding route alternatibility in different hop levels, different cases regarding CoSsthat may use the routes and different cases regarding the supported and different casesregarding route sharing (total, partial).
The functionality of LB has been validated by checking its outcome against theexpected outcome in each test suite.
The results indicate that the LB OS indeed functions correctly according to thedesign specifications of its route selection priority management functionality. In partic-ular, it was shown that for a particular network CoS, LB takes actions so that routescombining the following merits are favoured:
• less load,• higher alternatibility factor regarding the occasions under which the different
CoSs may be using them,• sharing by CoSs with lower total bandwidth requirements.
which indeed constitute the main criteria for prioritising selection of alternative routes.Conclusively, it is believed that LB OS indeed according to its design specifica-
tions.

EXPERIMENTAL RESULTS
375
12.4.2 LB behavioural tests
12.4.2.1 Overview
The purpose of the LB behavioural tests is to verify the performance of the LB OS inthe network by assessing the effect of its actions on network operation.
The effect of LB on network operation is captured in terms of:• connection rejection ratio, and,• deviation of links’ utilisation around mean link utilisation.
For a given network configuration, the performance of LB is assessed, by relativelycomparing network-wide connection rejection ratio, and/or link utilisation deviation asmeasured in the cases where the network employs a TMN system with the LB OS andwhere the network does not employ a TMN system.
Overall assessment of the performance of LB can then be achieved by consolidat-ing the results of its performance per network case, over a number of network configu-rations.
Following the test case decomposition principles presented for the LB functionaltests specification, the different network configurations may be partitioned in terms ofthe following parameters:
• logical topology configuration; and specifically in terms of:• route alternatibility (1, 2,..),• route sharing among different CoSs (complete, partial, none),
• offered network load (uniform among all source-destination pairs, asymmetric).The performance of the LB OS is assessed in both the static and dynamic aspects of itsfunctionality. The static aspect of its functionality is related to the initial assignment ofthe route selection priorities, for the routes that have been defined by the Route DesignOS. The static part of LB functionality may be performed at predicted usage predictionchanges epochs. Initial route selection priority assignment does not take into accountthe dynamics of actual network resource usage, since the newly derived routes may bedefined in terms of newly created VPCs on which no usage record exists as yet. Thedynamic aspect of its functionality is related to the dynamic assignment of the routeselection priorities, according to the actual network load. This part of LB functionalityis performed within the time-frame of network usage predictions, taking into accountthe dynamics of network resource usage. In this case, the performance of LB isassessed as a function of its main operational design variable; the activation interval. Itis reminded that the current design of the LB OS assumes that the LB OS will beinvoked by the TMN operator, either periodically, every specified time-intervals, or atexception.
It is worth noting that the LB behavioural tests show how the developed ICM TMNtestbed can be used to assess the performance of various management functions. Obvi-ously, a prerequisite for such tests is the management functionality under test to com-ply with the Q3 interfaces between the components of the VPCM management system.For instance, the behavioural tests used for the assessing the behaviour of the devel-oped LB OS could well be used for assessing the performance of any other OS comply-ing with the functional and architectural specifications of the LB OSF.

INTEGRATED COMMUNICATIONS MANAGEMENT OF BROADBAND NETWORKS
376
The following section presents the network configurations used and specific experi-ments carried out, for assessing the performance of the developed LB OS.
12.4.2.2 Network experiments description
12.4.2.2.1 Static case: initial assignment of route selection priorities
The network configurations in which the static aspects of the LB functionality will betested are described in the following. All test networks are based on the same VPC net-work and support the same CoSs. They differ in terms of routing plan (admissibleroutes per each CoS) and in terms of traffic generation patterns. As far as the routingplan is concerned, the following cases have been considered: complete and partialroute sharing amongst CoSs of the same source-destination pairs. In either case thealternatibility in the SDClassRoute networks is of the order of 1, 2 and 3. As far as thetraffic generation patterns are concerned, three cases have been considered: asymmet-ric traffic generation amongst the traffic sources, in terms of time-epochs where theload is offered to the network, symmetric traffic generation and bursty traffic genera-tion patterns. The test networks run for various combinations of route selection prioritysettings including the settings resulted from the LB OS and by relatively comparing theconnection rejection ratios per CoS as produced per each priority setting case, theeffect of LB is assessed.
The logical topology (VPC network) of the test networks used is shown inFigure 12.12. All VPCs have capacity of 100 Mb/s. Table 12.29 shows the supportedCoSs.
Based on the logical topology shown in Figure 12.12, two network cases are defined,each having different sets of routes for the supported CoSs. In the first case, networkcase N1, all CoSs share the same routes; complete route sharing. The defined routes areshown in Table 12.30; for a given source-destination pair the defined routes are all pos-sible routes that can be derived from the VPC network (Figure 12.12). The alternatibil-ity in all SDClassRoute networks is of the order of 2 and 3. In the second case, networkcase N2, there is partial route sharing amongst the CoSs. CoS c1 is admitted to routescomprising the VPCs connecting the access nodes to the transit nodes and the VPCsalong the circuit connecting the transit nodes but which do not lie in the circuit con-necting the transit nodes; CoS c2 is admitted to routes comprising the VPCs connectingthe access and transit nodes and the VPCs connecting the transit nodes; CoS c3 is shar-ing all routes of CoSs c1 and c2. The defined routes are shown in Table 12.31. The
CoS TypeMean, Peak bandwidth
(Mb/s)
c1 CBR 5
c2 CBR 10
c3 CBR 2
Table 12.29 Supported CoSs

EXPERIMENTAL RESULTS
377
alternatibility in the SDClassRoute networks is in the order of 1 and 2 for CoSs c1 andc2 and in the order of 1, 2 and 3 for CoS c3.
Routes destination node CoS VPCs
R1 3 c1, c2, c3 101, 222, 121, 108
R2 3 c1, c2, c3 101, 113, 207
R3 3 c1, c2, c3 202, 117, 119, 207
R4 3 c1, c2, c3 101, 216, 117, 119, 207
R5 4 c1, c2, c3 211, 121, 120, 206
R6 4 c1, c2, c3 211, 122, 216, 117, 205
R7 4 c1, c2, c3 212, 216, 117, 205
R8 4 c1, c2, c3 211, 122, 113, 206
Table 12.30 Route definitions for network case N1
Figure 12.12 VPC network for static case

INTEGRATED COMMUNICATIONS MANAGEMENT OF BROADBAND NETWORKS
378
R9 5 c1, c2, c3 210, 122, 216, 103
R10 5 c1, c2, c3 209, 120, 219, 204
R11 5 c1, c2, c3 210, 122, 113, 219, 204
R12 5 c1, c2, c3 209, 221, 122, 113, 219, 204
R13 0 c1, c2, c3 107, 219, 217, 102
R14 0 c1, c2, c3 107, 213, 201
R15 0 c1, c2, c3 208, 120, 213, 201
R16 0 c1, c2, c3 208, 221, 122, 201
R17 1 c1, c2, c3 106, 220, 221, 111
R18 1 c1, c2, c3 106, 213, 112
R19 1 c1, c2, c3 105, 119, 213, 112
R20 1 c1, c2, c3 105, 217, 116, 112
R21 2 c1, c2, c3 104, 119, 213, 222, 110
R22 2 c1, c2, c3 104, 119, 220, 109
R23 2 c1, c2, c3 203, 117, 119, 213, 222, 110
R24 2 c1, c2, c3 203, 116, 222, 110
R25 3 c1, c2, c3 202, 114, 108
R26 3 c1, c2, c3 202, 117, 115, 121, 108
R27 0 c1, c2, c3 208, 214, 102
R28 0 c1, c2, c3 208, 221, 215, 217, 102
R29 4 c1, c2, c3 211, 215, 205
R30 4 c1, c2, c3 212, 216, 114, 120, 206
R31 1 c1, c2, c3 106, 220, 214, 116, 112
R32 1 c1, c2, c3 105, 115, 111
R33 5 c1, c2, c3 210, 215, 204
R34 5 c1, c2, c3 209, 214, 103
R35 2 c1, c2, c3 203, 114, 109
R36 2 c1, c2, c3 104, 115, 110
Routes destination node CoS VPCs
R1 3 c1, c3 101, 222, 121, 108
R2 3 c2, c3 101, 113, 207
R3 3 c1, c3 202, 117, 119, 207
R4 3 c1,c3 101, 216, 117, 119, 207
R5 4 c1, c3 211, 121, 120, 206
R6 4 c1, c3 211, 122, 216, 117, 205
R7 4 c1, c3 212, 216, 117, 205
R8 4 c2, c3 211, 122, 113, 206
R9 5 c1, c3 210, 122, 216, 103
R10 5 c1, c3 209, 120, 219, 204
R11 5 c2, c3 210, 122, 113, 219, 204
Table 12.31 Route definition for network case N2
Routes destination node CoS VPCs
Table 12.30 Route definitions for network case N1

EXPERIMENTAL RESULTS
379
For each of the above network cases, traffic is generated between the following source-destination (s-d) node pairs: node0-node3, node3-node0, node1-node4, node4-node1,node2-node5 and node5-node2. Specifically, for a given (s-d) pair, traffic is generatedaccording to the following pattern:
T(s-d), c(k) = A + 200 * U(s-d) * CRc * k, c=c1,c2,c3, k=1,2,3. (1)
where:A is an initial time period required for the TMN system to initialise the network
simulator in terms of VPCs and routes.U(s-d) is a uniformly distributed random variable in a specified interval which is used
to differentiate traffic generation between different (s-d) pairs.Three cases areconsidered:• U(s-d) uniformly distributed in (0,2),• U(s-d) uniformly distributed in (1,2),• U(s-d) uniformly distributed in (0.9,1.1),with each case corresponding to a different network case.
R12 5 c2, c3 209, 221, 122, 113, 219, 204
R13 0 c1, c3 107, 219, 217, 102
R14 0 c2, c3 107, 213, 201
R15 0 c2, c3 208, 120, 213, 201
R16 0 c1, c3 208, 221, 122, 201
R17 1 c1, c3 106, 220, 221, 111
R18 1 c2, c3 106, 213, 112
R19 1 c2, c3 105, 119, 213, 112
R20 1 c1, c3 105, 217, 116, 112
R21 2 c2, c3 104, 119, 213, 222, 110
R22 2 c1, c3 104, 119, 220, 109
R23 2 c2, c3 203, 117, 119, 213, 222, 110
R24 2 c1, c3 203, 116, 222, 110
R25 3 c2, c3 202, 114, 108
R26 3 c2, c3 202, 117, 115, 121, 108
R27 0 c2, c3 208, 214, 102
R28 0 c2, c3 208, 221, 215, 217, 102
R29 4 c2, c3 211, 215, 205
R30 4 c2, c3 212, 216, 114, 120, 206
R31 1 c2, c3 106, 220, 214, 116, 112
R32 1 c2, c3 105, 115, 111
R33 5 c2, c3 210, 215, 204
R34 5 c2, c3 209, 214, 103
R35 2 c2, c3 203, 114, 109
R36 2 c2, c3 104, 115, 110
Routes destination node CoS VPCs
Table 12.31 Route definition for network case N2

INTEGRATED COMMUNICATIONS MANAGEMENT OF BROADBAND NETWORKS
380
CRc is a variable differentiating traffic generation between different CoSs for a given(s-d) pair. It takes the following values: CRc1 = 1; CRc2 = 0.9; CRc3 = 1.1.
k index corresponding to the traffic generation instances per (s-d).All (s-d) pairs generate the same number of connection requests at each generationinstance; the time of generation differs amongst the (s-d)s and the CoSs (according toformula (1) above). Table 12.32 shows the number of connection requests per CoS andper generation instance. It is assumed that each successful connection call lasts for thewhole duration of the simulation run.
Table 12.33 summarises the different networks defined for the LB static tests whichdiffer in terms of the sets of routes per CoS and the traffic generation pattern.
Each of the above networks will run under various route selection priority settings.Specifically, apart from the route selection priority settings resulted from the LB OS,the following four other settings were considered:1st: all nodes favour the interior VPCs (the VPCs that connect the transit nodes but
which do not lie in the circuit connecting the transit nodes) and then the VPC ofthe shortest.
2nd: all nodes prioritise VPC with the exact reverse priorities of the previous case.3rd: half the transit nodes taken per 3, prioritise VPCs according to the 1st priority
setting and half according to the 2nd priority setting.4th: half the transit nodes taken one-by-one prioritise VPCs according to the 1st pri-
ority setting and half according to the 2nd priority setting.
Generation instance# c1 (CBR 5Mb/s)
reqs# c2 (CBR 10 Mb/s)
reqs#c3 (CBR 2 Mb/s)
reqs
k = 1 6 4 15
k = 2 5 3 12
k = 3 8 4 20
Table 12.32 Connection requests per generation instance and per CoS
Networks Logical topology Traffic generation pattern
N1-A VPCs: as in Figure 12.12Routes: as in Table 12.30
as in formula (1) with Us-d~(0,2)and in Table 12.32
N1-B VPCs: as in Figure 12.12Routes: as in Table 12.30
as in formula (1) with Us-d~(0,2)and in Table 12.32
N1-C VPCs: as in Figure 12.12Routes: as in Table 12.30
as in formula (1) with Us-d~(0,2)and in Table 12.32
N2-A VPCs: as in Figure 12.12Routes: as in Table 12.31
as in formula (1) with Us-d~(0,2)and in Table 12.32
N2-B VPCs: as in Figure 12.12Routes: as in Table 12.31
as in formula (1) with Us-d~(0,2)and in Table 12.32
N2-C VPCs: as in Figure 12.12Routes: as in Table 12.31
as in formula (1) with Us-d~(0,2)and in Table 12.32
Table 12.33 Different network cases for the LB static tests
EXPERIMENTAL RESULTS
381
For each of the above networks the results of the connection rejection ratios per CoSfor each route selection priority setting can be found in Section 12.4.2.3.1.
12.4.2.2.2 Dynamic case: dynamic assignment of route selection priorities
The network configurations in which the dynamic aspects of the LB functionality willbe tested are described in the following. Two different network logical topologies areconsidered, covering different cases regarding route alternatibility and partial routesharing amongst different source-destination pairs. Furthermore, different traffic gener-ation (symmetric or asymmetric) patterns amongst the traffic sources are considered.Each of the test networks run with or without the LB management system and further-more in the former case under various LB invocation periods. By relatively comparingthe produced results for the connection rejection ratios per network case, the LB per-formance was verified and assessed.
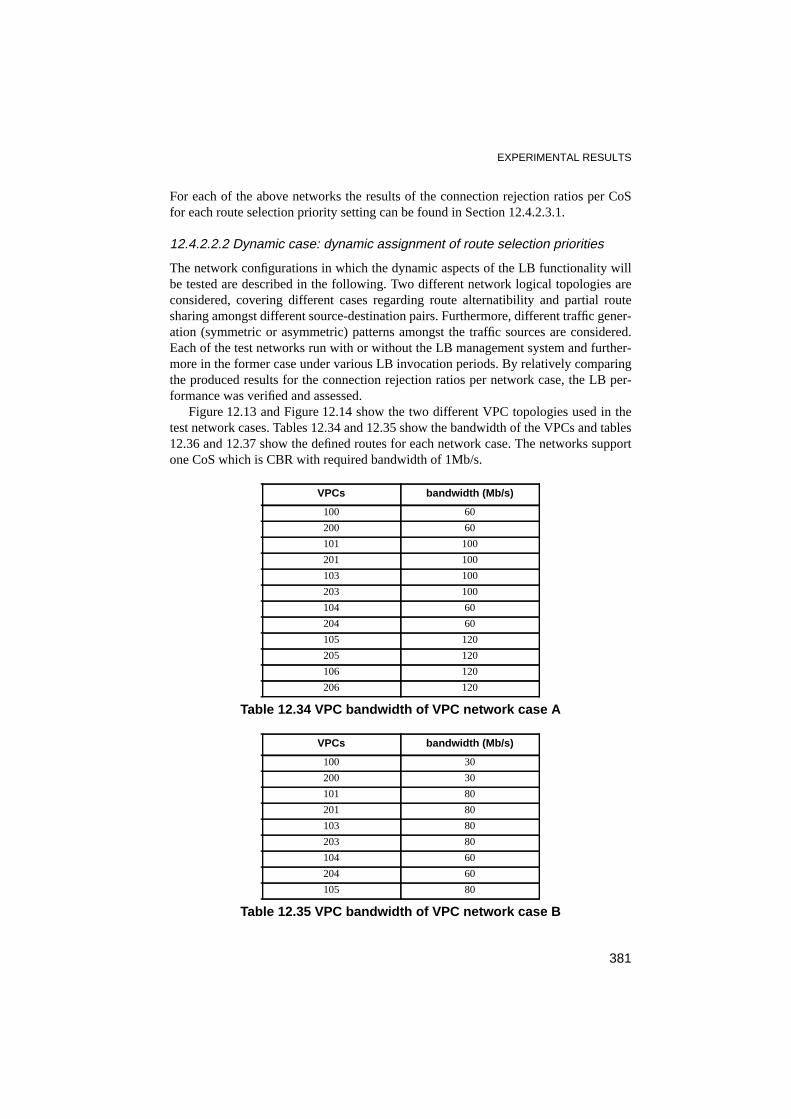
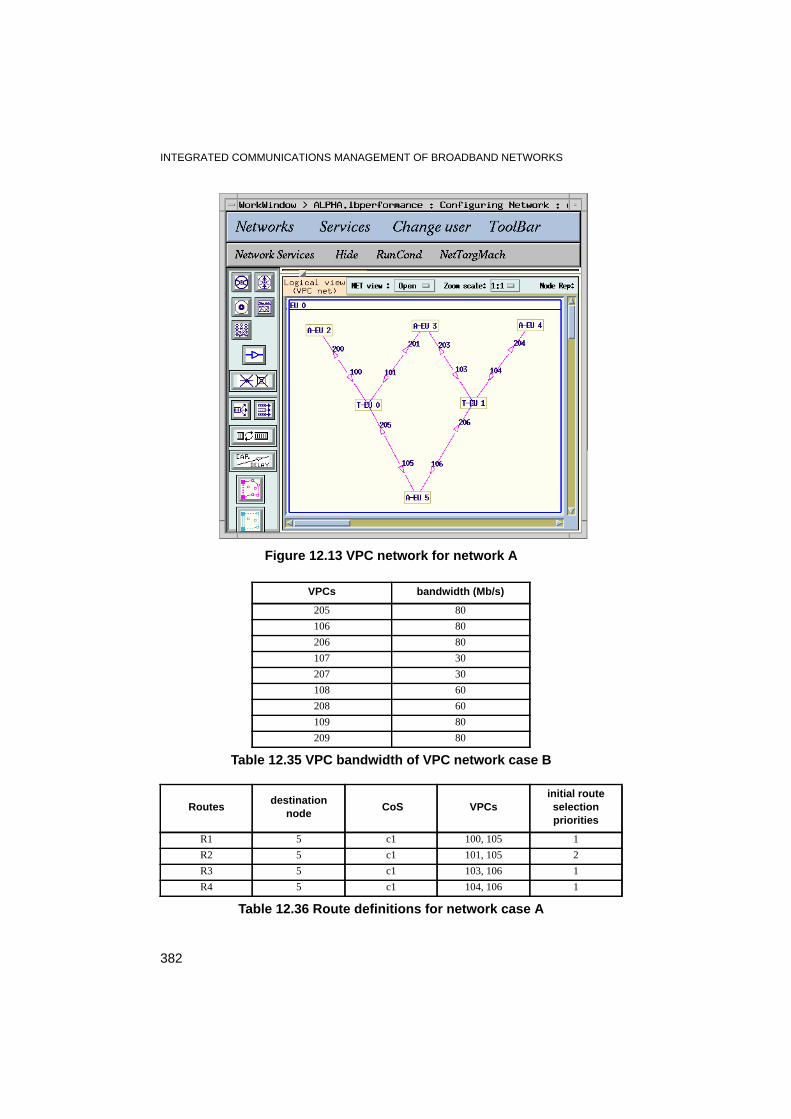
Figure 12.13 and Figure 12.14 show the two different VPC topologies used in thetest network cases. Tables 12.34 and 12.35 show the bandwidth of the VPCs and tables12.36 and 12.37 show the defined routes for each network case. The networks supportone CoS which is CBR with required bandwidth of 1Mb/s.
VPCs bandwidth (Mb/s)
100 60
200 60
101 100
201 100
103 100
203 100
104 60
204 60
105 120
205 120
106 120
206 120
Table 12.34 VPC bandwidth of VPC network case A
VPCs bandwidth (Mb/s)
100 30
200 30
101 80
201 80
103 80
203 80
104 60
204 60
105 80
Table 12.35 VPC bandwidth of VPC network case B
INTEGRATED COMMUNICATIONS MANAGEMENT OF BROADBAND NETWORKS
382
205 80
106 80
206 80
107 30
207 30
108 60
208 60
109 80
209 80
Routesdestination
node CoS VPCs
initial routeselectionpriorities
R1 5 c1 100, 105 1
R2 5 c1 101, 105 2
R3 5 c1 103, 106 1
R4 5 c1 104, 106 1
Table 12.36 Route definitions for network case A
VPCs bandwidth (Mb/s)
Table 12.35 VPC bandwidth of VPC network case B
Figure 12.13 VPC network for network A

EXPERIMENTAL RESULTS
383
Routesdestination
node CoS VPCs
initial routeselectionpriorities
R1 5 c1 100, 105 2
R2 5 c1 107, 109 1
R3 5 c1 101, 105 1
R4 5 c1 108, 109 3
R5 5 c1 103, 106 1
R6 5 c1 104, 106 1
Table 12.37 Route definitions for network case B
Figure 12.14 VPC network for network B

INTEGRATED COMMUNICATIONS MANAGEMENT OF BROADBAND NETWORKS
384
For each of the above network cases traffic is generated from the access nodes 2, 3and 4 to node 5. For a given (s-d) pair, traffic is generated according to the followingpattern:
T(s-d), c(k) = A + GP(s-d) * k, c=c1, k=1,2,3,... (2)
where:A is an initial time period required for the TMN system to initialise the network
simulator in terms of VPCs and routes.GP(s-d)is the connection generation period, used to differentiate traffic generation
between different (s-d) pairs. Three possible values are considered: 300(denoted by 3), 600 (denoted by 2), 900 (denoted by 1) time units. Differentcombinations of GP(s-d)s per the three (s-d) pairs result in different networkcases. For instance, the combination GP(2-5)=2, GP(3-5)=3, GP(4-5)=1 meansthat source node 2 generates traffic every 600 time units, source node 3 every300 time units and source node 4 every 900 time units.
k index corresponding to a traffic generation instance.All (s-d) pairs generate connection requests in bulks of 10 connections at each trafficgeneration epoch. Nodes 2 and 4 generate a total of 50 connections whereas node 3generates a total of 100 connections. The invocation instances per (s-d) pair are asmany it takes for the total number of connection requests to be made taking intoaccount that at a given instant 10 connection requests are generated simultaneously. Itis assumed that each successful connection call lasts for the whole duration of the sim-ulation run.
Table 12.38 summarises the different networks defined for the LB dynamic testswhich differ in terms of logical topology and of traffic generation patterns.
Networks Logical topology Traffic generation pattern
A-111 VPCs: as in Figure 12.13, Table 12.34Routes: as in Table 12.36
as in formula (2) with GP(2-5)=1,GP(3-5)=1, GP(4-5)=1
A-121 VPCs: as in Figure 12.12, Table 12.34Routes: as in Table 12.36
as in formula (2) with GP(2-5)=1,GP(3-5)=2, GP(4-5)=1
A-131 VPCs: as in Figure 12.12, Table 12.34Routes: as in Table 12.36
as in formula (2) with GP(2-5)=1,GP(3-5)=3, GP(4-5)=1
A-311 VPCs: as in Figure 12.12, Table 12.34Routes: as in Table 12.36
as in formula (2) with GP(2-5)=3,GP(3-5)=1, GP(4-5)=1
A-221 VPCs: as in Figure 12.12, Table 12.34Routes: as in Table 12.36
as in formula (2) with GP(2-5)=2,GP(3-5)=2, GP(4-5)=1
A-311 VPCs: as in Figure 12.12, Table 12.34Routes: as in Table 12.36
as in formula (2) with GP(2-5)=3,GP(3-5)=1, GP(4-5)=1
A-321 VPCs: as in Figure 12.12, Table 12.34Routes: as in Table 12.36
as in formula (2) with GP(2-5)=3,GP(3-5)=2, GP(4-5)=1
A-331 VPCs: as in Figure 12.12, Table 12.34Routes: as in Table 12.36
as in formula (2) with GP(2-5)=3,GP(3-5)=3, GP(4-5)=1
B-111 VPCs: as in Figure 12.12, Table 12.35Routes: as in Table 12.37
as in formula (2) with GP(2-5)=1,GP(3-5)=1, GP(4-5)=1
Table 12.38 Different network cases for the LB dynamic tests
EXPERIMENTAL RESULTS
385
Each of the above networks will run with or without a TMN system incorporating theLB OS and further for various LB invocation periods. Specifically, the following LBinvocation periods are considered:LB(1):The LB invocation period is smaller than the smallest traffic generation period
(specifically every 250 time units)LB(2):The LB invocation period is in between the smallest and largest traffic genera-
tion periods (every 500 time units)LB(3):The LB invocation period is greater than the largest traffic generation period
(every 1000 time units)LB(4):The LB invocation period is far greater than the largest traffic generation period
(every 2000 time units)The results can be found in Section 12.4.2.3.2.
12.4.2.3 Results
12.4.2.3.1 Static case: initial assignment of route selection priority
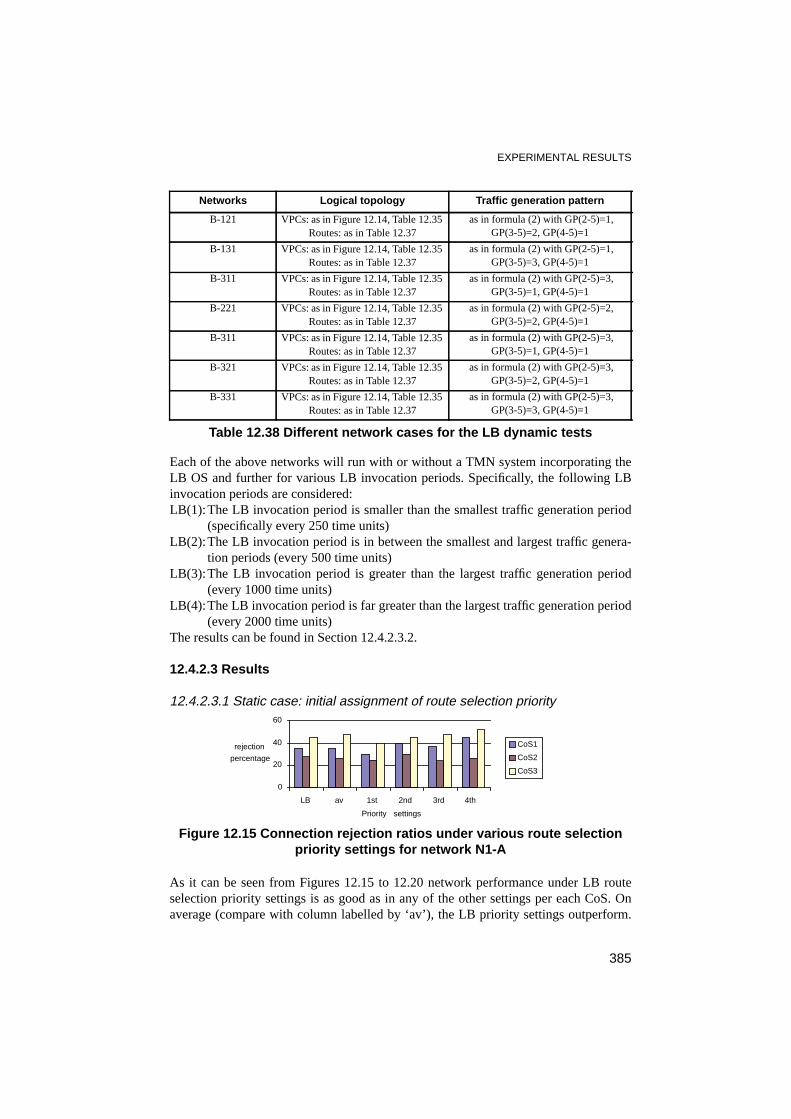
As it can be seen from Figures 12.15 to 12.20 network performance under LB routeselection priority settings is as good as in any of the other settings per each CoS. Onaverage (compare with column labelled by ‘av’), the LB priority settings outperform.
B-121 VPCs: as in Figure 12.14, Table 12.35Routes: as in Table 12.37
as in formula (2) with GP(2-5)=1,GP(3-5)=2, GP(4-5)=1
B-131 VPCs: as in Figure 12.14, Table 12.35Routes: as in Table 12.37
as in formula (2) with GP(2-5)=1,GP(3-5)=3, GP(4-5)=1
B-311 VPCs: as in Figure 12.14, Table 12.35Routes: as in Table 12.37
as in formula (2) with GP(2-5)=3,GP(3-5)=1, GP(4-5)=1
B-221 VPCs: as in Figure 12.14, Table 12.35Routes: as in Table 12.37
as in formula (2) with GP(2-5)=2,GP(3-5)=2, GP(4-5)=1
B-311 VPCs: as in Figure 12.14, Table 12.35Routes: as in Table 12.37
as in formula (2) with GP(2-5)=3,GP(3-5)=1, GP(4-5)=1
B-321 VPCs: as in Figure 12.14, Table 12.35Routes: as in Table 12.37
as in formula (2) with GP(2-5)=3,GP(3-5)=2, GP(4-5)=1
B-331 VPCs: as in Figure 12.14, Table 12.35Routes: as in Table 12.37
as in formula (2) with GP(2-5)=3,GP(3-5)=3, GP(4-5)=1
Networks Logical topology Traffic generation pattern
Table 12.38 Different network cases for the LB dynamic tests
Figure 12.15 Connection rejection ratios under various route selectionpriority settings for network N1-A
0
20
40
60
LB av 1st 2nd 3rd 4th
Priority settings
rejection
percentage
CoS1
CoS2
CoS3

INTEGRATED COMMUNICATIONS MANAGEMENT OF BROADBAND NETWORKS
386
Figure 12.16 Connection rejection ratios under various route selectionpriority settings for network N1-B
0
20
40
60
LB av 1st 2nd 3rd 4th
Priority settings
rejection
percentage
CoS1
CoS2
CoS3
Figure 12.17 Connection rejection ratios under various route selectionpriority settings for network N1-C
0
10
20
30
40
50
LB av 1st 2nd 3rd 4th
Priority settings
rejection
percentage
CoS1
CoS2
CoS3
Figure 12.18 Connection rejection ratios under various route selectionpriority settings for network N2-A
0
10
20
30
40
50
LB av 1st 2nd 3rd 4th
Priority settings
rejection
percentage
CoS1
CoS2
CoS3
Figure 12.19 Connection rejection ratios under various route selectionpriority settings for network N2-B
0
20
40
60
LB av 1st 2nd 3rd 4th
Priority settings
rejection
percentage
CoS1
CoS2
CoS3
Figure 12.20 Connection rejection ratios under various route selectionpriority settings for network N2-C
0
20
40
60
LB av 1st 2nd 3rd 4th
Priority settings
rejection
percentage
CoS1
CoS2
CoS3

EXPERIMENTAL RESULTS
387
The gain in the reduction of blocking probability is greater in the case of symmetric(uniform) traffic generation patterns (see Figures 12.16 and 12.19) and it is becomingsmaller as we are moving to more asymmetric traffic generation cases.
Furthermore, it can be seen that network performance is indeed sensitive to the par-ticular arrangement of route selection priorities per CoS. This observation justifies andfurther advocates the existence of a management functionality as the LB OSF.
It is worth noting that the marginal blocking probability of CoS c2, which has thelargest bandwidth requirements from the other two CoS, is improved best under the LBroute selection priority settings than under any other setting. This is attributed to thefact that the LB algorithm takes into account the bandwidth requirements of the CoSsthat have common routes in the process of prioritising the available routes per CoS. Inthis sense, LB protects the higher bandwidth CoSs at the expense of the lower band-width CoSs when sharing common (parts of) routes. The other route selection prioritysettings treat all CoSs the same. This feature is useful in a multi-class network environ-ment especially when different billing policies apply to different CoSs.
To better highlight this point, we aggregate the marginal connection rejection ratiosof each CoS using weights proportional to the bandwidth requirements of each CoS,namely we consider the following aggregate of the marginal connection rejectionratios:
where Bc, Rc are the mean (or peak or effective) bandwidth requirements, connectionrejection ratio, respectively of CoS c. This aggregate rejection ratio reflects the net-work loss in terms of offered bandwidth; hence, we call it offered bandwidth loss per-centage. Considering that whenever a connection is rejected, the network loses anamount of revenue proportional to the bandwidth requirements of the connection, thepreviously introduced measure is indicative of the losses in network revenue, consider-ing that each CoS is charged only on the basis of its bandwidth requirements (not onthe basis of duration, quality etc.).
Figures 12.21 to 12.26 show the offered bandwidth loss percentage under the vari-ous route selection priority settings, for each of the test networks considered. As it canbe seen LB outperforms the other route selection priority methods. It should be notedthat although there might be a particular route selection priority method performingbetter than the LB method for a specific network (e.g. see Figure 12.21, LB vs ‘1st’),throughout all networks this particular method is not constantly better than the LBmethod. Figure 12.27 summarises the results shown in Figures 12.21 to 12.26, by pro-viding a comparison between the performance, in terms of offered bandwidth loss per-centage, of the LB route selection priority method and the average performance of thefour other priority methods used. As it can be seen LB provides better performancethroughout all networks. The greatest gains are attained in the case of partial routesharing (test network case N2, see also Figures 12.24 to 12.26).
The above results show that the LB functionality indeed contributes positively tonetwork operation especially considering the multi-service nature of the network envi-
BcRcc∑
Bcc∑
-------------------

INTEGRATED COMMUNICATIONS MANAGEMENT OF BROADBAND NETWORKS
388
ronment. Most importantly, through its functionality LB may ‘protect’ certain CoSs byappropriately influencing the routing decisions, which may lead to desired levels ofoverall network optimality. The current implementation of LB takes into account thebandwidth requirements of the different CoSs that might share common parts of routes.The results showed network improvement in terms of lost offered bandwidth. Othercriteria differentiating access of different CoSs to common resources (routes) might beincorporated to its route selection functionality. Therefore, LB offers the network theopportunity to optimise its overall performance according to its business objectives, byadjusting routing between the different CoSs. This is yet another evident proving theneed for a management component with the specifications of the LB OSF.
Another point to observe is that overall network performance improves under par-tial route sharing as opposed to complete route sharing, under any route selection prior-ity setting. The best network performance is achieved under partial route sharing andLB (see Figure 12.27). Moreover the benefits from LB are greater in the case of partialroute sharing (see Figures 12.18 to 12.20 and 12.24 to 12.27) than in the completeroute sharing case (see Figures 12.15 to 12.17 and 12.21 to 12.23). This is attributed tothe fact that the LB functionality takes into account the occasions with which a particu-lar VPC is selected for routing. Note that in the partial route sharing case all SDClass-Route networks have the same alternatibility.
Figure 12.21 Offered bandwidth loss percentage under various routeselection priority settings for network N1-A
0
20
40
LB av 1st 2nd 3rd 4thPriority settings
offeredbandwidth
losspercentage
Figure 12.22 Offered bandwidth loss percentage under various routeselection priority settings for network N1-B
0
20
40
60
LB av 1st 2nd 3rd 4thPriority settings
offeredbandwidth
losspercentage
Figure 12.24 Offered bandwidth loss percentage under various routeselection priority settings for network N2-A
0
20
40
LB av 1st 2nd 3rd 4thPriority settings
offeredbandwidth
losspercentage
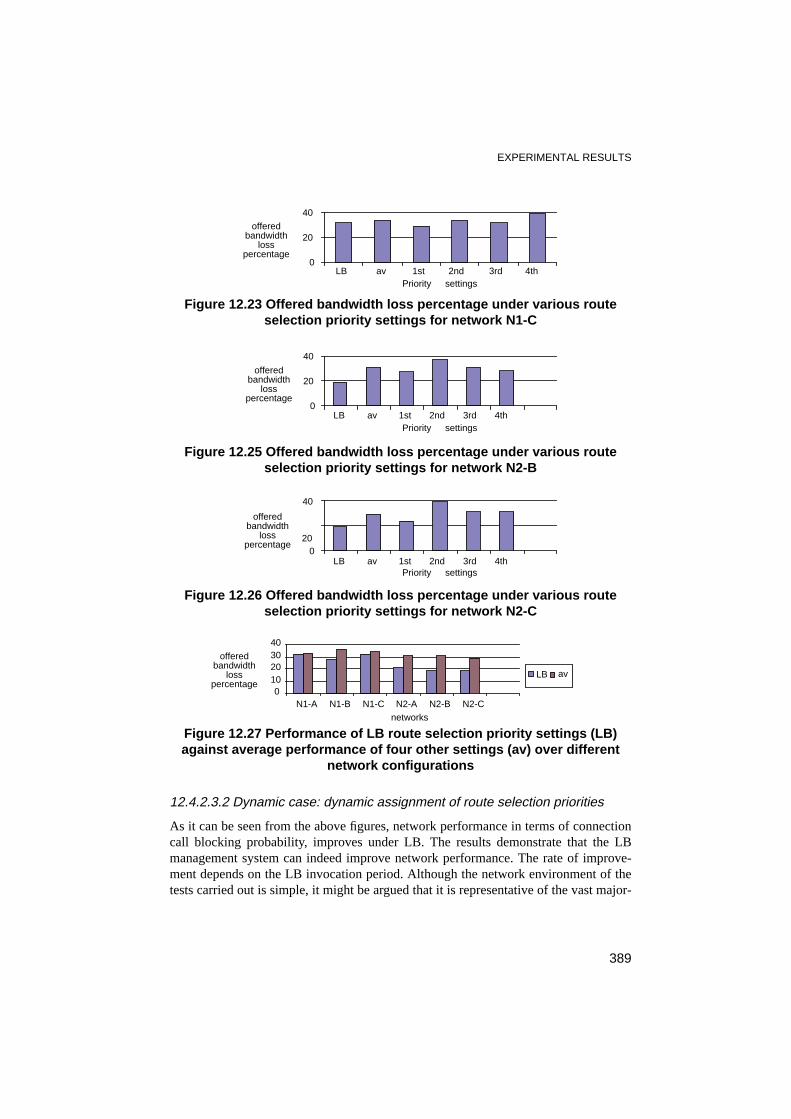
EXPERIMENTAL RESULTS
389
12.4.2.3.2 Dynamic case: dynamic assignment of route selection priorities
As it can be seen from the above figures, network performance in terms of connectioncall blocking probability, improves under LB. The results demonstrate that the LBmanagement system can indeed improve network performance. The rate of improve-ment depends on the LB invocation period. Although the network environment of thetests carried out is simple, it might be argued that it is representative of the vast major-
Figure 12.23 Offered bandwidth loss percentage under various routeselection priority settings for network N1-C
0
20
40
LB av 1st 2nd 3rd 4thPriority settings
offeredbandwidth
losspercentage
Figure 12.25 Offered bandwidth loss percentage under various routeselection priority settings for network N2-B
0
20
40
LB av 1st 2nd 3rd 4thPriority settings
offeredbandwidth
losspercentage
Figure 12.26 Offered bandwidth loss percentage under various routeselection priority settings for network N2-C
020
40
LB av 1st 2nd 3rd 4thPriority settings
offeredbandwidth
losspercentage
Figure 12.27 Performance of LB route selection priority settings (LB)against average performance of four other settings (av) over different
network configurations
010203040
N1-A N1-B N1-C N2-A N2-B N2-Cnetworks
LB av
offeredbandwidth
losspercentage

INTEGRATED COMMUNICATIONS MANAGEMENT OF BROADBAND NETWORKS
390
ity of network cases, as it assumes different alternatabilities and degrees of sharingcommon resources, between different SDClassRoute networks.
The benefits of LB are greater in the test network case B than in the network case B.This indicates that LB improves its performance in cases where all SDClassRoute net-works have more or less the same alternatibility, with its performance being deteriorat-ing as we are moving to cases with significant asymmetry in the alternatibility of thedefined SDClassRoute networks, especially when combined with traffic generationasymmetry in favour of the (s-d) pairs with the highest alternatibility in their SDClass-Route networks. This behaviour is explained in the following paragraphs.
It is worth noting that there is not a particular activation period that offers con-stantly, throughout all networks, the best performance. This indicates that the LBshould be activated asynchronously based on actual network conditions.
Although it is intuitively anticipated better performance in the cases where LB isactivated more frequently as opposed to the cases where it is activated less frequently,the results showed that this is not the general case. This is especially evident in the net-work case B (see Figure 12.29), which has more asymmetry in the alternatibilitybetween the SDClassRoute networks than network case A. This behaviour can beexplained as follows. The frequent invocation of LB results in continuous balancingthe load amongst the alternative routes of certain CoSs; if the load on these alternativeroutes becomes high enough due to traffic from certain source-destination pairs, thiscontinuous refinement blocks the connections between other source-destination pairsthat might use parts of these routes as unique alternatives. This can be clearly seen inthe case of networks B-131 and B-331 in Figure 12.29, where the LB being activatedfaster than even the traffic is generated yields worst performance than the LB beingactivated far less frequent than the traffic is generated. The current implementation of
Figure 12.28 Connection rejection ratios, under various LB invocationfrequencies, for networks A-111 to A-311
0
5
10
15
20
25
A-111 A-121 A-131 A-211 A-221 A-311 A-321 A-331networks
rejectionpercentage LB(1)
LB(2)LB(3)LB(4)no LB
Figure 12.29 Connection rejection ratios, under various LB invocationfrequencies, for networks B-111 to B-331
02468
101214
B-111 B-121 B-131 B-211 B-221 B-311 B-321 B-331networks
rejectionpercentage LB(1)
LB(2)LB(3)LB(4)noLB

EXPERIMENTAL RESULTS
391
LB takes into account the asymmetry in alternatibility that might exists between thedefined SDClassRoute networks; however, the load of the VPCs along the routes pre-vails.
The results indicate that LB should base its functionality on some sort of predic-tions regarding anticipating network usage. These predictions should be made withmedium-term perspective and should refer within the time-frame of the predictionsbased on which the VPC and route networks were built (made by PUM and used byRD). Based on the insight gained from the results, it is believed that LB should utiliseinformation as the following for making its medium-term predictions: actual VPCusage (from the network) for the purpose of deriving increasing or decreasing trends,maximum number of active connections per source-destination pair and per CoS thatthe network should provide so that to guarantee the acceptable blocking probability perCoS (from RD) and actual number of active connections per (s-d) pair and CoS (fromthe network). The latter two measures should allow LB to forecast the anticipating net-work usage from the various traffic sources and therefore make better judgements onthe sharing of routes. These measures are not taken into account by the current specifi-cations of the LB OSF and are suggested as updates to the VPCM architecture.
12.4.2.4 Conclusions on the Load Balancing performance tests
This section presented the results of the tests regarding the performance of the LB OSin the network level. The purpose of these tests was to establish an indication of theeffect of the LB OS in the network, justifying therefore the need for a managementcomponent such the LB component. Moreover, the tests undertaken demonstrated theuse of the developed ICM TMN testbed for testing the functionality and performanceof various TMN systems/functions. Furthermore, these tests as well as the functional(capability) tests, presented in previous sections, served as a means for validating theICM methodologies for specifying, designing and testing management functionality.
The performance of LB was assessed in a number of network configurationsregarding logical topologies and network offered load patterns. LB performance wasassessed in both of its functional modes; static and dynamic. The test cases consideredare not exhaustive of the many different possible network configurations. However, thetests carried out, indicated network performance improvement for networks employinga management system including the LB OS, over networks which do not employ suchmanagement schemes.
Specifically, the following conclusions may be drawn regarding LB performance:• There is indeed scope for route selection management through a management
functional component as the LB OSF, especially considering the multi-servicenature of the network environment. The tests showed network performanceimprovement under LB. Gains in network performance may be obtained interms of connection rejection ratio and network load balancing at link level. In amulti-class environment, LB improves the marginal connection blocking proba-bilities per CoS, in the sense that significantly improves overall network per-formance in terms of the offered bandwidth loss probability. Marginalconnection blocking probability is also improved for some CoSs, especially forthose of higher bandwidth requirements. This behaviour is particularly useful

INTEGRATED COMMUNICATIONS MANAGEMENT OF BROADBAND NETWORKS
392
for guaranteeing acceptable performance in multi-class networks and mostimportantly shows how routing management policies may be used to achievethe business objectives of the network operators.
• The gains in network performance depend on• Route alternatibility.
It was shown that the higher the alternatibility in the routes of the sup-ported network CoSs, the higher the performance gains. This is attributed tothe fact that route alternatibility increases LB management flexibility, there-fore the positive potential of the impact of the routing decisions as influ-enced by the LB OS. However, LB performance deteriorates in cases wherethere is asymmetry in the alternatibility of the defined SDClassRoute net-works, especially combined with asymmetry in traffic generation particu-larly in favour of the (s-d) pairs with the higher alternatibility n theirSDClassRoute networks.
• Route sharing.It was shown that network performance under LB is more improved in
cases where there is partial sharing of the defined routes amongst the sup-ported network CoSs. This is attributed to the fact that the route selectionmanagement algorithm of the developed LB OS takes into account the rout-ing occasions in which the different network CoSs may use the definedroutes; prioritising routes in favour of CoSs using these routes with lessalternatibility as opposed to CoSs using the same routes with higher alter-natibility. Considering the multi-class environment of IBC networks, thisfeature is yet another justification of a management component like LB.
• LB activation epochs.It was shown that LB performance depends primarily on the time epochs
at which it will be activated. The intuitive argument that LB should be acti-vated sufficiently prior to instances where offered network changes, wasshown that it is not generally true. No fair statement can be made regardingthe most appropriate LB activation mechanism. However, this does notmake obsolete the existence of a management component like LB. Associ-ated with this issue is the ‘usual’ problem of routing, namely it is difficult toassess the impact of routing decisions taken at one time, to the future i.e.how can it be guaranteed that routing decisions that seemed ‘good’ at onetime will continue to be ‘good’ for the next period of time. There is a needfor enhancing LB functionality to make some sort of predictions regardingnetwork usage. Based on these predictions route prioritisation and determi-nation of next activation epoch should be made. Note that these predictionsshould refer within the time-frame of the source-destination traffic predic-tions based on which the VPC and route networks were built. From theinsight gained from the results there are two kinds of information that shouldbe utilised in making such predictions: actual VPC usage and actual numberof active connections per (s-d) pair and CoS.
Further tests are required in order to assess in full extent the effect of LB behaviour innetwork operation, gain more insight into its functional aspects and support with moreconfidence the above mentioned conclusions. The preliminary results presented in this

EXPERIMENTAL RESULTS
393
section encourage the undertaking of such tasks. An important dimension of futuretesting is to test LB performance in a more complicated network management environ-ment, involving interactions with other performance management components, likeBD.
12.4.3 Bandwidth Distribution tests
This section presents tests for validating the functionality of the Bandwidth Distribu-tion OSF at a system level. The tests have been designed to be carried out using theATM simulator.
12.4.3.1 Introduction
The purpose of Bandwidth Distribution (BD) application test is to examine and verifythe functionality of the BD OSF in a network environment. We create variable trafficwith the purpose to examine and verify the functionality of BD OSF in all (most of)possible traffic conditions in which the BD OSF might be activated.
It should be noted that the purpose of the test is not the detailed assessment of theperformance of the BD OSF, in terms of benefits and costs to the network operation,sensitivity, management overhead, scaling and processing time. This test aims at vali-dating the functionality of the BD OSF. Performance assessment is regarded as a hugetask and it is not addressed in detail by this work. However, the validation tests mayprovide indications on the performance of the BD OSF.
12.4.3.2 Description of test cases
The functionality of BD depends on:• the load on the VPCs,• the required bandwidth of a VPC,• the allocated bandwidth of a VPC,• the topology of the VPCs.
The functionality of BD does not depend on the particular network CoSs and theirbandwidth characteristics. Rather it depends on their aggregated load on the VPCs andthe variation in their arrival pattern to the VPCs.
The test cases should cover all possible values of the above parameters but toreduce unnecessary complexity, we focus on a limited set of VPCs (tagged VPCs),with different topologies but spanning over common links. Moreover, the allocatedbandwidth and the required bandwidth of the VPCs is assumed to be constant. Creatingpossible combinations of load on the selected VPCs, the functionality of the BD OSFcan be verified, by checking the actions taken against to what is expected. For a givenload situation, the expected BD actions can be deduced following its functional princi-ple of redistributing links’ “spare” bandwidth to the more congested VPCs.

INTEGRATED COMMUNICATIONS MANAGEMENT OF BROADBAND NETWORKS
394
12.4.3.3 Tests and results
Test conditions
The physical topology of the test network used was as described in Section 12.4.1.2.Only two links were used for the tests: link 2 and link 20. These were both assigned abandwidth of 155Mb/s.
The BD OS was run in simulated time. As well as the simulator, the following OSswere also running at the same time as BD: Simulator QAF (Simqaf), ConfigurationManager (CM), Current Load Model (CLM), Load Balancing (LB), Route Design(RD). BD was invoked initially by RD and then periodically every 10 seconds of simu-lated time.
In addition to the above, a data collection manager was developed to acquire theresults of the tests. This manager created the necessary objects in the Simqaf to collectcall statistics and logged selected statistics (including VPC effective and allocatedbandwidths) to a file. These results were then analysed and plotted using a spreadsheetto produce the graphs which follow.
The following test scenarios were used:
VPC Scenario 1:
VPC10 from node1 to node2, using link 20VPC11 from node0 to node2, using link 2 and link 20
VPC Scenario 2:
As for scenario 1, but in addition:VPC12 from node0 to node1 over link 2.
Traffic Scenario 1:
per user, 1Mb/s CBR, call time 5 seconds, silence time 5 seconds.User groups arranged to generate the following:• On VPC10:
time 100-200 seconds 50 users,time 200-300 seconds 100 users,time 300-400 seconds 150 users,time 400-500 seconds 100 users,time 500-600 seconds 50 users.
• On VPC11:time 100-200 seconds 150 users,time 200-300 seconds 100 users,time 300-400 seconds 50 users,time 400-500 seconds 100 users,time 500-600 seconds 150 users.
Traffic Scenario 2:
As for Traffic Scenario 1 but in addition:• on VPC12:
time 100-350 seconds 0 users,time 350-600 seconds 100 users.
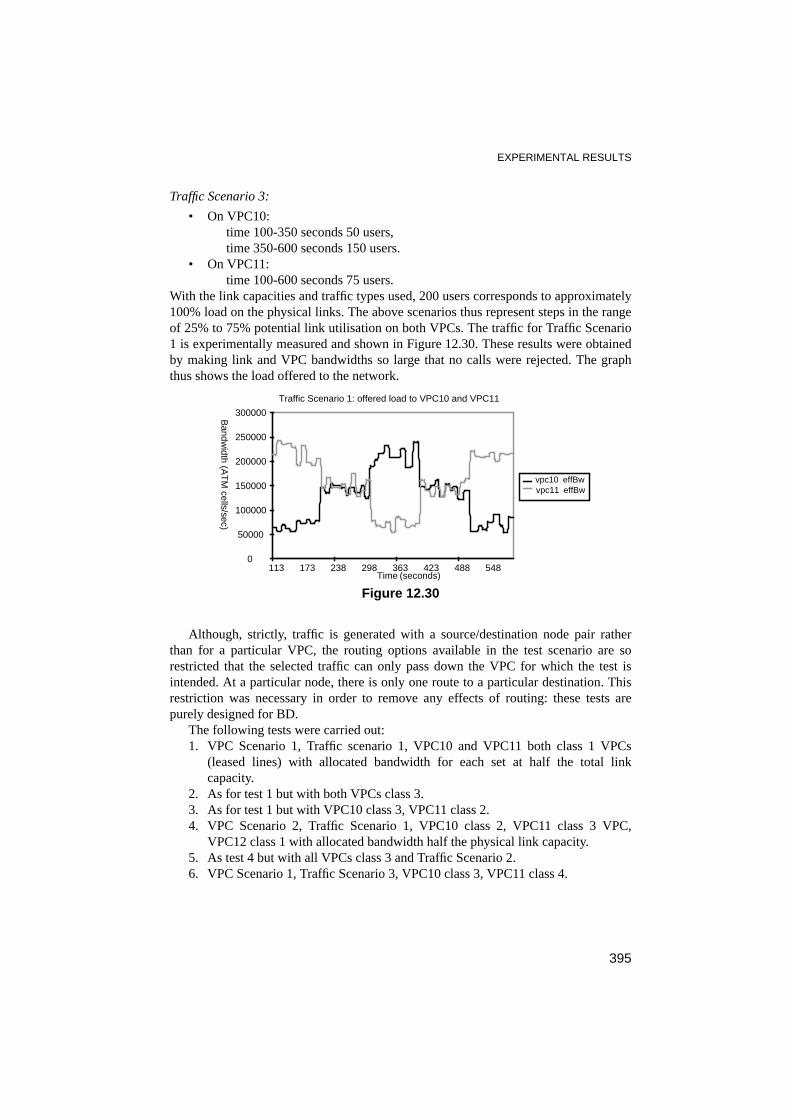
EXPERIMENTAL RESULTS
395
Traffic Scenario 3:
• On VPC10:time 100-350 seconds 50 users,time 350-600 seconds 150 users.
• On VPC11:time 100-600 seconds 75 users.
With the link capacities and traffic types used, 200 users corresponds to approximately100% load on the physical links. The above scenarios thus represent steps in the rangeof 25% to 75% potential link utilisation on both VPCs. The traffic for Traffic Scenario1 is experimentally measured and shown in Figure 12.30. These results were obtainedby making link and VPC bandwidths so large that no calls were rejected. The graphthus shows the load offered to the network.
Although, strictly, traffic is generated with a source/destination node pair ratherthan for a particular VPC, the routing options available in the test scenario are sorestricted that the selected traffic can only pass down the VPC for which the test isintended. At a particular node, there is only one route to a particular destination. Thisrestriction was necessary in order to remove any effects of routing: these tests arepurely designed for BD.
The following tests were carried out:1. VPC Scenario 1, Traffic scenario 1, VPC10 and VPC11 both class 1 VPCs
(leased lines) with allocated bandwidth for each set at half the total linkcapacity.
2. As for test 1 but with both VPCs class 3.3. As for test 1 but with VPC10 class 3, VPC11 class 2.4. VPC Scenario 2, Traffic Scenario 1, VPC10 class 2, VPC11 class 3 VPC,
VPC12 class 1 with allocated bandwidth half the physical link capacity.5. As test 4 but with all VPCs class 3 and Traffic Scenario 2.6. VPC Scenario 1, Traffic Scenario 3, VPC10 class 3, VPC11 class 4.
Figure 12.30
Traffic Scenario 1: offered load to VPC10 and VPC11
0
50000
100000
150000
200000
250000
300000
113 173 238 298 363 423 488 548Time (seconds)
Bandw
idth(A
TM
cells/sec)
vpc10 effBwvpc11 effBw

INTEGRATED COMMUNICATIONS MANAGEMENT OF BROADBAND NETWORKS
396
Test 1 results
For this test, both VPCs are class 1, and according to the algorithm for BD, class 1VPCs should not have their bandwidth changed. The allocated and effective band-widths for VPC10 and VPC11 are shown in Figure 12.31 and Figure 12.32, fromwhich it can be seen that the correct initial value of bandwidth is allocated to the VPCs(180,000 cells/sec) and that the allocated bandwidth has not changed during the testrun for either VPC.
This test shows the correct behaviour of BD for class 1 VPCs.Since the offered load for both VPCs is significantly above the available bandwidth
on the VPCs for some parts of the test, it can be expected that calls are rejected duringthese times. This result is shown in Figure 12.33.
Figure 12.31
Test 1: VPC10 Allocated and Effective Bandwidth
0
20000
40000
60000
80000
100000
120000
140000
160000
180000
200000
108 168 233 293 358 418 483 543 608Time (seconds)
Bandw
idth(A
TM
cells/sec)
vpc10 allocBw
vpc10 effBw
Figure 12.32
Test 1: VPC11 Allocated and Effective Bandwidth
0
20000
40000
60000
80000
100000
120000
140000
160000
180000
200000
108 168 233 293 358 418 483 543 608Time (seconds)
Bandw
idth(A
TM
cells/sec)
vpc11allocBwvpc11effBw

EXPERIMENTAL RESULTS
397
Test 2 results
For this test, both VPCs are set to class 3. According to the BD algorithm, any sparebandwidth on links is distributed equally (as far as is possible) amongst the class 3VPCs on the link. In this case, VPC11 is the only VPC on link 2, but shares link 20with VPC10. We would expect BD to share the total available bandwidth on link 20equally between VPC10 and VPC11. It is not possible to allow VPC11 to use all thespare bandwidth on link 2 because this would leave no spare bandwidth to share withVPC10 on link 20. BD is therefore unable, in this case, to distribute all the availablebandwidth on link 2.
Figure 12.34 and Figure 12.35 show the result of the test. The allocated and effec-tive bandwidths are plotted for each of the VPCs.
It can be seen that initially (time 97 seconds) the total bandwidth available on thelink was shared equally between the two VPCs (at about 180,000 cells/sec). Later, BDhas allocated more bandwidth to a VPC as its load increases, reducing the bandwidth
Figure 12.33
Test 1: VPC10 and VPC11 Rejection Rates
0.00
2.00
4.00
6.00
8.00
10.00
12.00
14.00
108 233 358 483 608Time (seconds)
Rejection
Rate
(persecond)
vpc10 rejection rate
vpc11 rejection rate
Figure 12.34
Test 2: VPC10 Allocated and Effective Bandwidth
0
50000
100000
150000
200000
250000
300000
97 157 222 282 347 407 472 532 597
Time (seconds)
Ban
dwid
th (
AT
M c
ells
/sec
)
vpc10 allocBwvpc10 effBw

INTEGRATED COMMUNICATIONS MANAGEMENT OF BROADBAND NETWORKS
398
available to the other VPC. This is in accordance with the rule that when the effectivebandwidth exceeds an upper threshold value (75% of allocated bandwidth), the allo-cated bandwidth is increased, if possible. This reduces the pool of spare bandwidthavailable for sharing amongst class 3 VPCs.
A further rule for BD is that the allocated bandwidth cannot be reduced below theinitial value allocated to the VPC by Route Design. In this case, the initial allocatedvalue was set at 90,000 cells/sec. It can be seen that this rule is not violated in the test.
This test shows the correct behaviour of BD for class 3 VPCs.The call rejection rates for the two VPCs are plotted in Figure 12.36
The call rejection rates peak when the traffic on a VPC increases faster than the BDalgorithm can deal with. The imposed traffic pattern is in fact rather severe, represent-ing near step functions in load changes.
A reasonable measure of the performance of BD in adapting to changing loads is tocalculate the blocking probability seen with and without BD. This is calculated as:
blocking probability = calls rejected / calls accepted
Figure 12.35
Test 2: VPC11 Allocated and Effective Bandwidth
0
50000
100000
150000
200000
250000
300000
97 157 222 282 347 407 472 532 597Time (seconds)
Ban
dwid
th (
AT
M c
ells
/sec
)
vpc11 allocBwvpc11 effBw
Figure 12.36
Test 2: VPC10 and VPC11 Rejection Rates
0.00
2.00
4.00
6.00
8.00
10.00
12.00
14.00
97 222 347 472 597Time (seconds)
Rejection
Rate
(persecond)
vpc10 rejection rate
vpc11 rejection rate

EXPERIMENTAL RESULTS
399
The values over the whole period of the test (600 seconds) are calculated for bothVPCs for this test and also for the previous test, where BD was effectively preventedfrom distributing bandwidth by virtue of the fact that both VPCs were leased lines(class 1 VPCs). These results are shown below.
It can be seen that when BD distributes bandwidth according to the traffic, a considera-bly improved performance is seen.
Test 3 results
This test is a repeat of the above test, but with VPC10 as a class 2 VPC and VPC11as class 3. The algorithm for BD states that spare bandwidth on a link is to be evenlydistributed amongst class 3 VPCs on the link (but not to class 2 VPCs). Also, when theeffective bandwidth on a class 2 VPC crosses the high (75%) threshold mark, morebandwidth is to be allocated to it, with any remaining then distributed to class 3 VPCs.Only when the low threshold (25%) is crossed will bandwidth be taken back from aclass 2 VPC and become available for class 3 VPCs.
The results are plotted in Figure 12.37, Figure 12.38 and Figure 12.39.
It can be seen that at the start of the test, BD has correctly allocated the requiredbandwidth (90,000 cells/sec) to the class 2 VPC (VPC10) and distributed all theremaining bandwidth to class 3 VPCs, in this case just VPC11. (By good fortune, thishappens to match the traffic quite well at this point in the test.) As the traffic on VPC10increases and crosses the upper threshold (75% of the allocated bandwidth) more band-width is allocated to this VPC, leaving less to be distributed to VPC11. The bandwidthallocated to VPC10 is not then reduced until the effective bandwidth drops below the
VPC test 1 blocking probability test 2 blocking probability
10 0.222 0.109
11 0.363 0.156
Table 12.39
Figure 12.37
Test 3: VPC10 Allocated and Effective Bandwidth
0
50000
100000
150000
200000
250000
300000
102 162 227 287 352 412 477 537 602Time (seconds)
Bandw
idth(A
TM
cells/sec)
vpc10 allocBw
vpc10 effBw

INTEGRATED COMMUNICATIONS MANAGEMENT OF BROADBAND NETWORKS
400
low threshold (25% of allocated bandwidth). This occurs at about time 602 seconds(Figure 12.37). At this time the freed bandwidth on the link is reallocated to VPC11.
This test shows that BD behaves correctly for class 2 VPCs, and that precedence iscorrectly given to class 2 VPCs over class 3 VPCs.
The VCC rejection rates are plotted in Figure 12.39. This shows a consistently lowvalue for the class 2 VPC10 (which has been allocated most of the available band-width). A very high figure is shown for the class 3 VPC11 in the second period of thetest (400 seconds on), where the traffic demand on VPC11 increases substantially, butno bandwidth is available on the link until the bandwidth allocated to the class 2 VPCcan be reduced.
Figure 12.38
Test 3: VPC11 Allocated and Effective Bandwidth
0
50000
100000
150000
200000
250000
300000
102 162 227 287 352 412 477 537 602Time (seconds)
Bandw
idth(A
TM
cells/sec)
vpc11 allocBw
vpc11 effBw
Figure 12.39
Test 3: VPC10 and VPC11 Rejection Rates
0.00
5.00
10.00
15.00
20.00
25.00
102 227 352 477 602Time (seconds)
Rejection
Rate
(persecond)
vpc10 rejection rate
vpc11 rejection rate

EXPERIMENTAL RESULTS
401
Test 4 results
For this test, VPC10 remains a class 2 VPC and VPC11 a class 3 VPC. However, inthis case there is a leased line (VPC12) sharing link 2 with VPC12. The leased line hasbeen allocated half the bandwidth of the link. BD is therefore restricted in how muchbandwidth it can allocate to VPC12 - it is limited by what is available to VPC12 on link2.
The results of this test are plotted in Figures 12.40, 12.41 and 12.42.
Comparing Figures 12.41 and 12.37 it can be seen that the behaviour of BD for theclass 2 VPC (VPC10) is unaffected. (Any differences seen are due to the randomnature of the traffic.) Comparing Figures 12.40 and 12.38, it can be seen that the maxi-mum bandwidth allocated to VPC11 is now reduced, due to the restriction on what isavailable on link 2.
This demonstrates that BD correctly takes into account available bandwidth on allthe links which a VPC traverses when distributing spare bandwidth to a class 3 VPC.
Figure 12.40
Test 4: VPC11 Allocated and Effective Bandwidth
0
50000
100000
150000
200000
250000
300000
102 162 227 287 352 412 477 537 602Time (seconds)
Ban
dwid
th (
AT
M c
ells
/sec
)
vpc11 allocBwvpc11 effBw
Figure 12.41
Test 4: VPC10 Allocated and Effective Bandwidth
0
50000
100000
150000
200000
250000
300000
102 162 227 287 352 412 477 537 602Time (seconds)
Bandw
idth(A
TM
cells/sec)
vpc10 allocBw
vpc10 effBw

INTEGRATED COMMUNICATIONS MANAGEMENT OF BROADBAND NETWORKS
402
The result of this can be seen in much increased reject rates on VPC11 at the start ofthe test (when the traffic demands are high but the bandwidth is restricted).
Test 5 results
For this test, both VPCs are class 3, allowing any spare bandwidth to be distributedevenly between them. There is also now another VPC, also of class 3, (VPC12) sharinglink 2 with VPC11. VPC12 has traffic which is zero for the first half of the test, andrises to about 50% of the link capacity for the second half of the test. BD must there-fore share bandwidth amongst the class 3 VPCs on both link2 and link 20, with one ofthe VPCs being common to both links.
The results of this test are plotted in Figure 12.43, Figure 12.44, Figure 12.45.
It can be seen that BD initially shares the link bandwidth equally between VPC10and VPC11 on link 20 and is also able to share the bandwidth equally between VPC11and VPC12 on link 2. As the effective bandwidth on VPC11 crosses the high threshold,more bandwidth is allocated to it, reducing the spare pool available for both VPC10
Figure 12.42
Test 4: VPC10 and VPC11 Rejection Rates
0.00
5.00
10.00
15.00
20.00
25.00
102 227 352 477 602Time (seconds)
Rejection
Rate
(persecond)
vpc10 rejection rate
vpc11 rejection rate
Figure 12.43
Test 5: VPC12 Allocated and Effective Bandwidth
0
50000
100000
150000
200000
250000
300000
97 222 347 472 597Time (seconds)
Bandw
idth(A
TM
cells/sec)
vpc12 effBw
vpc12 allocBw

EXPERIMENTAL RESULTS
403
Figure 12.44
Test 5: VPC10 Allocated and Effective Bandwidth
0
50000
100000
150000
200000
250000
300000
97 222 347 472 597Time (seconds)
Bandw
idth(A
TM
cells/sec)
vpc10 effBw
vpc10 allocBw
Figure 12.45
Test 5: VPC11 Allocated and Effective Bandwidth
0
50000
100000
150000
200000
250000
300000
97 222 347 472 597Time (seconds)
Bandw
idth(A
TM
cells/sec)
vpc11 effBw
vpc11 allocBw
Figure 12.46
Test 5: VPC10, VPC11 Rejection Rate
0
5
10
15
20
25
97 222 347 472 597Time (seconds)
Rejection
rate(per
second)
vpc10 rejection rate
vpc11 rejection rate
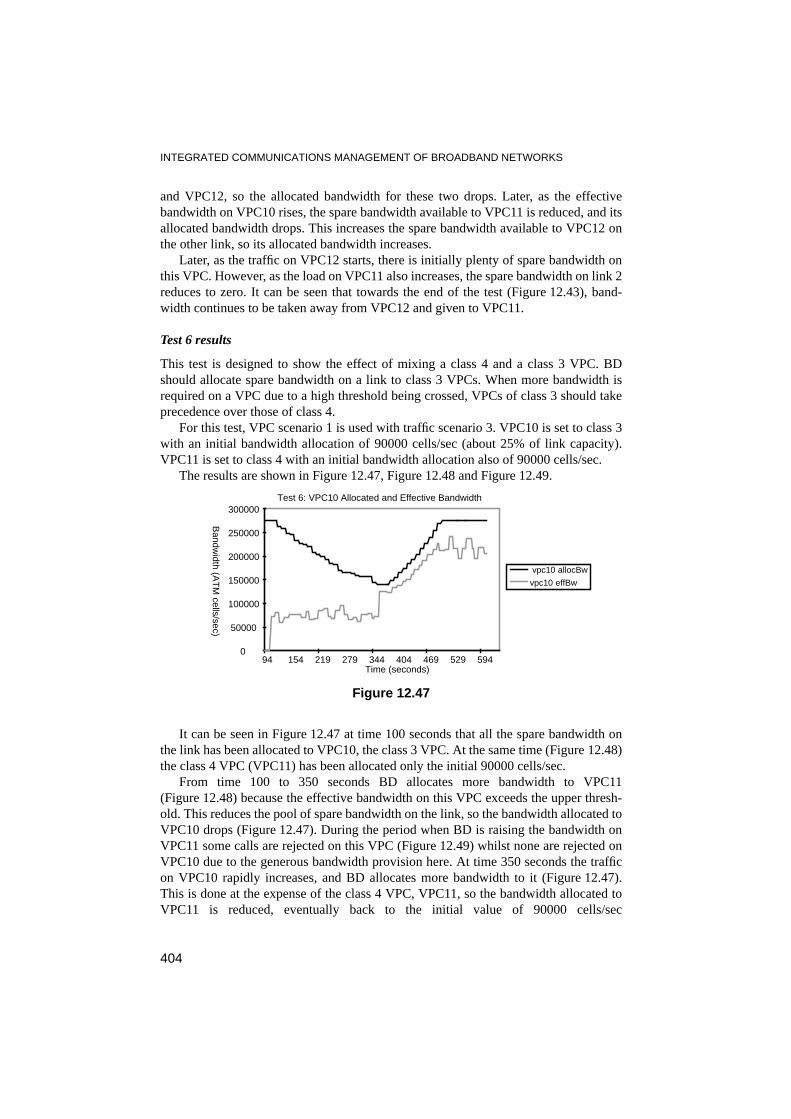
INTEGRATED COMMUNICATIONS MANAGEMENT OF BROADBAND NETWORKS
404
and VPC12, so the allocated bandwidth for these two drops. Later, as the effectivebandwidth on VPC10 rises, the spare bandwidth available to VPC11 is reduced, and itsallocated bandwidth drops. This increases the spare bandwidth available to VPC12 onthe other link, so its allocated bandwidth increases.
Later, as the traffic on VPC12 starts, there is initially plenty of spare bandwidth onthis VPC. However, as the load on VPC11 also increases, the spare bandwidth on link 2reduces to zero. It can be seen that towards the end of the test (Figure 12.43), band-width continues to be taken away from VPC12 and given to VPC11.
Test 6 results
This test is designed to show the effect of mixing a class 4 and a class 3 VPC. BDshould allocate spare bandwidth on a link to class 3 VPCs. When more bandwidth isrequired on a VPC due to a high threshold being crossed, VPCs of class 3 should takeprecedence over those of class 4.
For this test, VPC scenario 1 is used with traffic scenario 3. VPC10 is set to class 3with an initial bandwidth allocation of 90000 cells/sec (about 25% of link capacity).VPC11 is set to class 4 with an initial bandwidth allocation also of 90000 cells/sec.
The results are shown in Figure 12.47, Figure 12.48 and Figure 12.49.
It can be seen in Figure 12.47 at time 100 seconds that all the spare bandwidth onthe link has been allocated to VPC10, the class 3 VPC. At the same time (Figure 12.48)the class 4 VPC (VPC11) has been allocated only the initial 90000 cells/sec.
From time 100 to 350 seconds BD allocates more bandwidth to VPC11(Figure 12.48) because the effective bandwidth on this VPC exceeds the upper thresh-old. This reduces the pool of spare bandwidth on the link, so the bandwidth allocated toVPC10 drops (Figure 12.47). During the period when BD is raising the bandwidth onVPC11 some calls are rejected on this VPC (Figure 12.49) whilst none are rejected onVPC10 due to the generous bandwidth provision here. At time 350 seconds the trafficon VPC10 rapidly increases, and BD allocates more bandwidth to it (Figure 12.47).This is done at the expense of the class 4 VPC, VPC11, so the bandwidth allocated toVPC11 is reduced, eventually back to the initial value of 90000 cells/sec
Figure 12.47
Test 6: VPC10 Allocated and Effective Bandwidth
0
50000
100000
150000
200000
250000
300000
94 154 219 279 344 404 469 529 594Time (seconds)
Bandw
idth(A
TM
cells/sec)vpc10 allocBw
vpc10 effBw

EXPERIMENTAL RESULTS
405
(Figure 12.48). The provision on VPC11 is now insufficient so that the call rejectionrate rises (Figure 12.49).
This test shows that BD correctly allocates spare bandwidth to class 3 VPCs inpreference to class 4 VPCs, after taking into account extra requirements of class 4VPCs due to high threshold crossing of effective bandwidth. It also shows that whenmore bandwidth is required by a class 3 VPC, BD correctly allocates this at theexpense of class 4 VPCs.
12.4.3.4 Conclusions on the Bandwidth Distribution tests
For relatively simple scenarios involving mixes of classes of VPCs over two physicallinks, BD has been shown to behave as specified in the design document. It was not thepurpose of these tests to investigate the efficacy of the algorithms used in BD, althoughsome conclusions can be drawn from the results presented above. Further tests wouldbe required involving more complicated interactions between VPCs of mixed classestraversing multiple links and a wider range of traffic conditions to refine the algorithmsfurther.
Figure 12.48
Test 6: VPC11 Allocated and Effective Bandwidth
0
50000
100000
150000
200000
250000
94 154 219 279 344 404 469 529 594Time (seconds)
Bandw
idth(A
TM
cells/sec)
vpc11 allocBw
vpc11 effBw
Figure 12.49
Test 6: VPC10 and VPC11 Rejection Rates
0.00
5.00
10.00
15.00
20.00
25.00
94 219 344 469 594Time (seconds)
Rejection
Rate
(persecond)
vpc10 rejection rate
vpc11 rejection rate

INTEGRATED COMMUNICATIONS MANAGEMENT OF BROADBAND NETWORKS
406
12.5 Conclusions
This chapter has presented the ICM validation rationale, followed by a summary of thetesting performed and details of two of the test sets performed to validate the ICMTMN functional implementations. The experimental results and their evaluation aimedto show that the TMN system performed as specified, and to show the TMN applica-tions to be able to improve the performance of the managed network.
The following points outline the main conclusions that can be drawn from theresults of the testing work undertaken by ICM:
• The results verify that the developed components of the ICM testbed operateaccording to their functional specifications. Various functional validation testshave been carried out for each of the testbed components, validating their inter-faces, their intelligence and their inter-operation. Functional validation has beenasserted from a number of test cases covering a representative set of networkconfigurations and traffic conditions.
• The results indicate that the management services and components developedby the project can improve network performance in a number of test experi-ments covering representative cases of network configuration and traffic scenar-ios. These preliminary results justify the role of performance managementsystems and advocate research in the area of efficient network managementschemes and algorithms.
• The successful completion of the validation and verification tests not only vali-dates the specific management algorithms employed but also validates the over-all system architecture. Furthermore the ICM approach and methodology tomanagement systems specification, design and implementation (see Chapter 3)is validated.
• Throughout the testing process, the use of network simulation tools was vali-dated and their usefulness and utility in carrying out complex testing tasks wasverified. Their flexibility (in terms of network configurations, traffic scenarios,network functions), portability and scaleability make to possible to define andexecute many different test scenarios which would be infeasible to achieve onreal networks given realistic constraints of time, effort and cost.
• The facilities offered by the ICM management platform were proved to be veryuseful throughout the testing process. In particular, the MIB browser, thegeneric management applications and the CMIS scripting language were inval-uable for testing and debugging purposes.
• The problem of testing and evaluating the performance of management func-tionality is of enormous complexity, beyond that of software system testing.This is due to the complexity and uncertainty of the network environment and iscompounded by the critical role that management plays in network operation.ICM, taking this into account, formulated methods for integrating and testingmanagement functionality. The procedures adopted were validated through thesuccessful completion of the testing activities and although they may not becomplete in several aspects, they outline a general approach to managementsystems testing.

EXPERIMENTAL RESULTS
407
12.6 References
[12.1] RACE R2059 ICM Deliverable 12, “Integration and Validation Principles,”R2059/NTUA/EECS/DR/R/P/012/b1, Dionysis Reisis, editor, October 1994.
[12.2] RACE R2059 ICM Deliverable 18, “ICM TMN Testbed Description,”R2059/CRA/ATG/DS/018/b1, Richard Lewis, editor, December 1995.
[12.3] RACE R2059 ICM Deliverable 21, “Integration, Performance Verificationand Evaluation of Test Results,” R2059/GNN/MIH/DS/P/021/b1, MichaelHansen, editor, December 1995.

INTEGRATED COMMUNICATIONS MANAGEMENT OF BROADBAND NETWORKS
408