INSURTECH SECTOR REPORT - GCA Altium · INSURTECH SECTOR REPORT Q4 2017. Strong sector and product...
27
INSURTECH SECTOR REPORT Q4 2017
Transcript of INSURTECH SECTOR REPORT - GCA Altium · INSURTECH SECTOR REPORT Q4 2017. Strong sector and product...

INSURTECH SECTOR REPORTQ4 2017

Strong sector and product expertise across InsurTechGCA OVERVIEW
Rob FreimanDirectorFinTech
Phone: (212) 999 - 7075Mobile: (973) 229 - 0436 [email protected]
Kegan GreeneVice President
FinTechPhone: (415) 318 - 3686Mobile: (917) 579 - 4838 [email protected]
Steve FletcherManaging DirectorHead of Software
Phone: (415) 318 - 3661Mobile: (415) 518 - [email protected]
Chris GoughManaging Director
M&A/Real Estate TechPhone: (415) 318 - 3658Mobile: (415) 385 - [email protected]
Sean MinnihanManaging Director
Head of FinTechPhone: (212) 999 - 7077Mobile: (917) 364 - 6230
David KruegerVice President
FinTechPhone: (212) 537 - 4534Mobile: (616) 822 - [email protected]
Strategic Investment
We Advised ControlExpert We Advised AWL
Acquired by
Acquired by
We Advised INS Web We Advised INS Web
Acquisition of
We Advised Finanzen.de
Acquired by
Sold
To
We Advised RGI Shareholders
Tender Offer for
Asahi Fire & MarineInsurance Co.
We Advised Asahi (close pending)
Preferred Stock Investmentfrom
Financial Advisor
Sele
ct In
surT
ech
Tran
sact
ions

3
$82 $164 $347 $268
$813
$2,701 $1,682 $2,101
2010 2011 2012 2013 2014 2015 2016 2017
Topic Observations
2017 InsurTech Wrap-Up
EXECUTIVE SUMMARYIntroduction
Financing Volume ($MM)
& Deal Count
Executive Summary
Source: CB Insights.
~$2.1Bn ‘17 Financing Volume
~200 ’17 Transactions
~$5.6Bn ‘17 M&A Volume
~80 ‘17 Transactions
• 2017 was an active year for InsurTech, with >$2Bn in financing volume and >$5.5Bn in M&A volume
• Record high number of financings – nearly 200 – driven by significant European activity
- European deal count grew ~167% to 72 transactions, while North America and Asia remained relatively flat
- That said, since 2015 Europe has contributed <10% of global financing volume
• There has been a 20% increase in financing participation by corporate venture capital (CVC) since 2014, reflecting increased interest in the space
• InsurTech key themes
• Market update and analysis
• Sector and transaction data
We take a deep dive into the numbers to understand what is
driving deal dynamics in the InsurTech sector.
In this report we cover:
67%9%
23%
13 28 4457
82
123174
195
Financing Volume by Geography Since 2015
North AmericaAsiaEurope 12%
32%
Percent of Financings with CVC Participation
20% Growth in CVC Participation
Key Stats
2014 2017

4
Topic Observations
How will the new tax laws impact InsurTech and the broader insurance market?
EXECUTIVE SUMMARYIntroduction (cont’d)
What are some the biggest perceived
risks?
• The new law reduces the corporate tax rate from 35% to 21% and eliminates the corporate alternative minimum tax (AMT), which we expect will benefit domestic carriers, distributors and InsurTech businesses organized as C corps
- InsurTech companies or other businesses organized as “pass-through” entities (i.e., S corps, partnerships, etc.) will similarly benefit from the reduction of individual tax rates
• We expect that improved profitability from these actions will manifest itself in several ways:- In 2018 we may see an increase in carrier reserve development to take advantage of the
associated tax deductions- Longer term, we expect the higher levels of profitability will put downward pressure on
policyholder rates in a highly competitive insurance marketplace- The improvement in profitability will improve ROI on growth initiatives and provide
additional capital to reinvest in carriers’ businesses, including technology and acquisition initiatives
- We expect the rate cut will give strategics even more bargaining power in competitive auctions, making them fiercer competitors for deals vs. private equity firms
• Deferred tax assets (DTAs) result from prior year losses, and their value is commensurate with the tax rate. For startups, carriers or other businesses with material DTAs, the lowered tax rates will require a reduction in the value of the DTA, resulting in an earnings hit
• That said, we don’t expect this alone to curb strategic technology and / or InsurTech investment• Additionally, we don’t expect changes in the carried interest provision (raising tax rates for
investments held for under three years) to have much of an impact on VCs or private equity firms, as they tend to hold investments for more than three years
• Will likely require a repatriation of offshore earnings for businesses with significant international operations
- Chubb cited this as a driver of its $250M one-time earnings increase for 4Q17• The new law reduces the advantages of insurance activity in tax havens (e.g., Bermuda, the
Cayman Islands, etc.), which we expect will impact non-US carriers, foreign reinsurers with US subsidiaries, and US carriers that cede to non-US affiliates
• Longer term, we don’t expect this to curb technology investment; on the contrary, we expect that newly repatriated capital will contribute to continued investment in technology and / or InsurTech businesses
How will new tax rates impact the
various players in the insurance
ecosystem?
What does the shift to a territorial tax
system mean for the industry?
Sources: Novarica Research 2018; The Insurance Journal 2017.
1
2
3
4
• Lower tax rates should benefit domestic carriers, distributors and InsurTech businesses alike
• For businesses with significant international operations, the shift to a territorial tax system will likely require a repatriation of offshore earnings
• Improved profitability and newly repatriated capital should contribute to continued investments in technology
To the right we’ve outlined some key themes to think about now that The Tax Cuts and Jobs Act
has become law.

5
IoT / Telematics
Online DistributionPolicy Management Tools / Software
Innovative / Specialty Insurance
Claims Management Tools / Software
Employee Benefits Admin / InsuranceExchange Technology
Data / Analytics Peer-to-Peer (“P2P”)
Sales, Marketing & Engagement
Customer Origination
Mobile
Distribution / Comparison Health Insurance Carrier Affiliated / New Carriers
Auto Health
Home
EXECUTIVE SUMMARYInsurTech landscape/ ecosystem – selected, representative companies Le
gend
Distribution & CustomerEngagement
Products, Pricing & Underwriting
Data & AnalyticsPolicy Admin, Claims & Back Office
Insurance Value Chain
DISCLAIMER: This is only a representative list and may not include all relevant companies. If your company is not on the list and would like to be added for future publications, kindly shoot us a note at [email protected] and we would be happy to consider.

6
EXECUTIVE SUMMARYMost active InsurTech investors – corporate venture capital
Source: Wall Street Research, Capital IQ, Pitchbook.
CurrentInsurTech
Investments
#7 7 6 6
5 5 5 5 4 3

7
Percent Change(2) Select Q4 Financing Transactions ($MM)
Subsector LTM 3 Years Date Company Selected Investors Amt. Sub-Sector
22% 55%
17% 46%
34% 27%
14% 38%
17% 14%
44% 87%
26% 41%
15% 18%
42% 52%
InsurTech Deal Volume by Stage Aggregate InsurTech Market 26% 42%
S&P 500 19% 30%
12/19/17 $120
12/19/17
11/15/17 $35
Insurance Technology Deal Dashboard(1) Industry Stock Market Performance$2.1 Bn | 195 Deals
LTM InsurTech Financing Volume(1)
Trends in InsurTech
10/12/17 $77
Quarterly InsurTech Financing Activity ($MM)(1)
10/3/17 $36
$30
$783
$398 $230 $271 $283
$985
$312
$521
Q1-16 Q2-16 Q3-16 Q4-16 Q1-17 Q2-17 Q3-17 Q4-17
Benefits Administration/Payroll
Property & Casualty
Health
Insurance Technology
Life
Brokerage & Distribution
Information Services
Financial SaaS
IT & BPO Services
1
2
8
9
7
6
5
4
3
59 64
$6.5$15.4$7.4$6.3$6.1$11.7$13.3
34 3843
38
48
Average Deal Amount ($MM)
45
$11.6
38% 41% 42% 48% 50%
20% 19% 23% 19% 26%18% 16% 15% 10%12%
24% 22% 17% 20% 11%
2013 2014 2015 2016 2017
Seed/Angel Series A Series B Series C+
INSURTECH DEAL DASHBOARD
Notes:Source: CB Insights, Pitchbook. CapIq. GCA Deal Database.Market data as of 12/31/17.(1) Includes private company equity financings.(2) Represents unweighted average, except for S&P 500.
Publicly traded InsurTech companies are up 26% over the LTM period, as compared to 19% for the S&P 500. Q4 2017 financing volume is up ~67% over Q3 2017; however, the number of financings is relatively flat vs. Q3 2017 and Q4 2016
Lege
nd
P&C Life Health Distribution & CustomerEngagement
Products, Pricing & Underwriting
Data & AnalyticsPolicy Admin, Claims & Back Office
Insurance Segment Insurance Value Chain

8
INSURTECH SELECTED PUBLIC COMPANY LANDSCAPESelected InsurTech subsectors and key operating stats ($Bn)
Notes:Source: CapIq.Revenue growth and EBITDA margins shown are median values for comp group.Market data as of 12/31/17.
Benefits Administration/Payroll
Combined Market Cap.: $10217E/16A Rev. Growth: 20%
17E EBITDA Margin: 20%
2Insurance Technology
Combined Market Cap.: $3017E/16A Rev. Growth: 10%
17E EBITDA Margin: 11%
1 Brokerage & Distribution
Combined Market Cap.: $12117E/16A Rev. Growth: 7%17E EBITDA Margin: 22%
3
Property & Casualty
Combined Market Cap.: $42917E/16A Rev. Growth: 5% 17E EBITDA Margin: 12%
4 Life
Combined Market Cap.: $44517E/16A Rev. Growth: 3% 17E EBITDA Margin: 14%
5 Health
Combined Market Cap.: $45517E/16A Rev. Growth: 7%
17E EBITDA Margin: 8%
6
Information Services
Combined Market Cap.: $32717E/16A Rev. Growth: 7% 17E EBITDA Margin: 31%
7 IT & BPO Services
Combined Market Cap.: $58917E/16A Rev. Growth: 11%
17E EBITDA Margin: 17%
8 Financial SaaS
Combined Market Cap.: $10317E/16A Rev. Growth: 19%
17E EBITDA Margin: 19%
9

9
INSURTECH STOCK PRICE PERFORMANCE
3 Year Share Price Performance
LTM Share Price Performance
Notes:Source: CapIq. Market data as of 12/31/17.
InsurTech is in the middle of the pack on an LTM basis, but near the top over the past three years
6) Health1) Insurance Technology 2) Benefits Administration/Payroll
3) Brokerage & Distribution 5) Life4) Property & Casualty 7) Information Services 8) IT & BPO Services 9) Financial SaaS
10
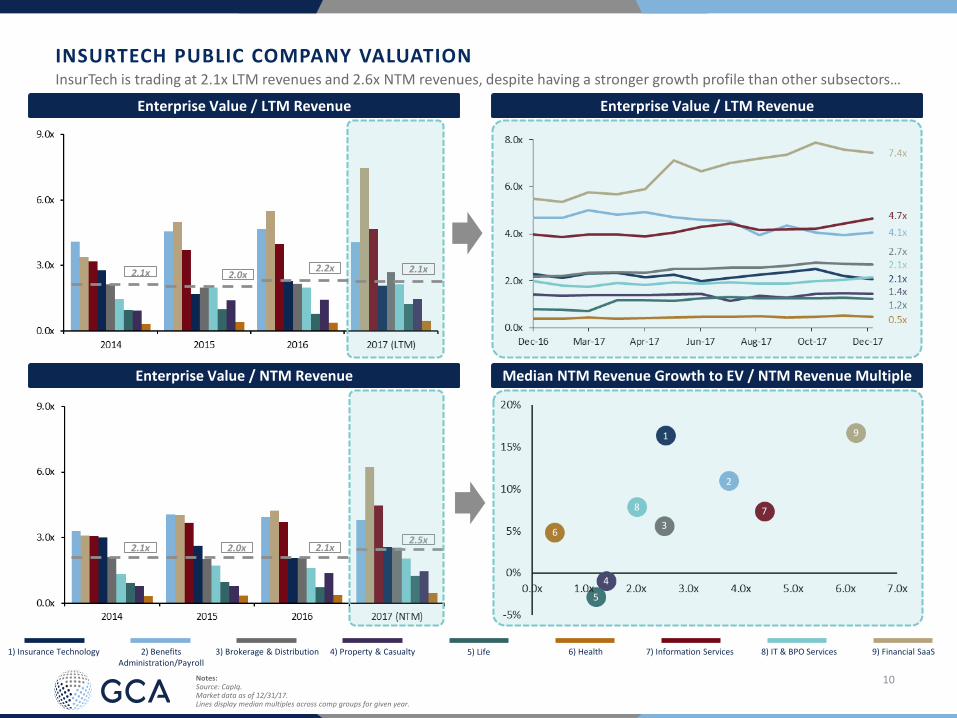
INSURTECH PUBLIC COMPANY VALUATIONInsurTech is trading at 2.1x LTM revenues and 2.6x NTM revenues, despite having a stronger growth profile than other subsectors…
Notes:Source: CapIq.Market data as of 12/31/17.Lines display median multiples across comp groups for given year.
Enterprise Value / LTM RevenueEnterprise Value / LTM Revenue
Median NTM Revenue Growth to EV / NTM Revenue MultipleEnterprise Value / NTM Revenue
1
2
3
45
6
78
9
2.1x 2.0x 2.2x 2.1x
2.1x 2.0x 2.1x2.5x
6) Health1) Insurance Technology 2) Benefits Administration/Payroll
3) Brokerage & Distribution 5) Life4) Property & Casualty 7) Information Services 8) IT & BPO Services 9) Financial SaaS

11
INSURTECH PUBLIC COMPANY VALUATION (CONT’D)…But on an EBITDA basis, InsurTech has performed very well on both an EV/ LTM EBITDA and EV/ NTM EBITDA basis
Notes:Source: CapIq.Market data as of 12/31/17.Lines display median multiples across comp groups for given year.
Enterprise Value / LTM EBITDAEnterprise Value / LTM EBITDA
Median NTM EBITDA Growth to EV / NTM EBITDA MultipleEnterprise Value / NTM EBITDA
1
23
4
5
6 8
7
9
10.2x 9.3x11.5x
13.5x
9.0x 9.2x10.0x
12.3x
6) Health1) Insurance Technology 2) Benefits Administration/Payroll
3) Brokerage & Distribution 5) Life4) Property & Casualty 7) Information Services 8) IT & BPO Services 9) Financial SaaS

12
Long-term growth is not necessarily correlated with public company P/E multiples or PEG ratios(1)
INSURTECH PUBLIC COMPANY VALUATION (CONT’D)
Notes: (1) PEG ratio defined as 2017E price/earnings ratio divided by estimated long-term EPS growth rate.Figures represent medians of sub-sectors.Market data as of 12/31/17.Long-term EPS growth covers last 5 years.
21.7%
15.3%
17.0%
11.0%
11.3%
13.7%
10.4%
10.3%
7.6%
2.4
2.4
2.3
2.2
1.8
1.5
1.6
2.0
1.3
2017 P/E Multiple 2017 PEG Ratio
Long-Term EPS Growth
Life5
Benefits Admin/Payroll2
Financial SaaS9
Information Services7
Insurance Technology1
Health6
IT & BPO Services8
Property & Casualty4
Brokerage & Distribution3
11.2x
18.8x
18.9x
19.9x
21.3x
24.8x
30.7x
30.9x
46.2x
0.0x 5.0x 10.0x 15.0x 20.0x 25.0x 30.0x 35.0x 40.0x 45.0x 50.0x
13
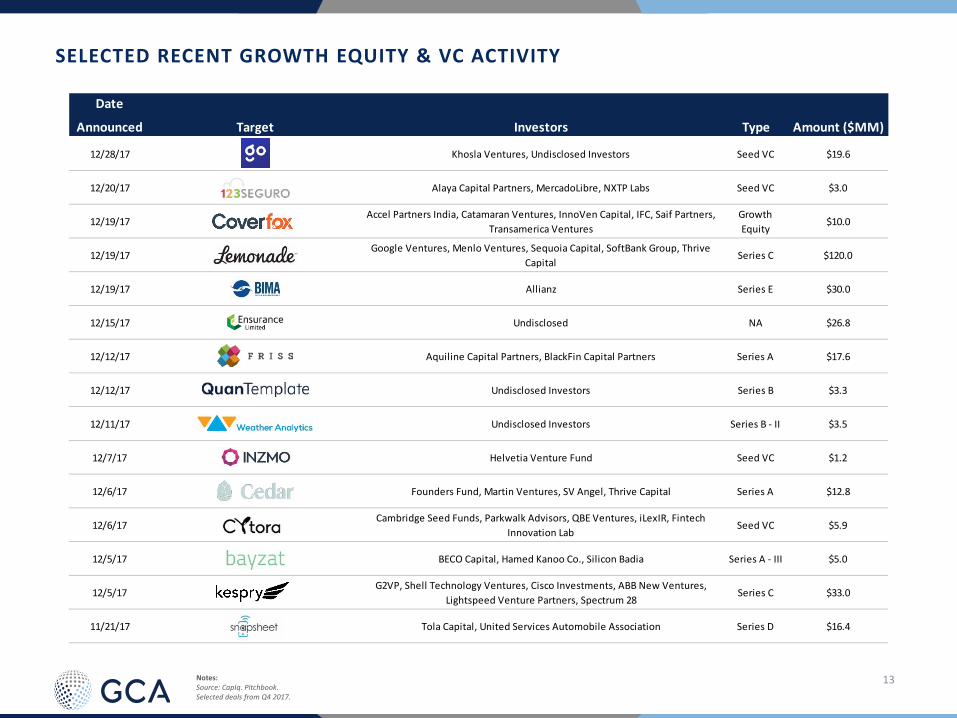
12/28/17 Khosla Ventures, Undisclosed Investors Seed VC $19.6
12/20/17 Alaya Capital Partners, MercadoLibre, NXTP Labs Seed VC $3.0
12/19/17Accel Partners India, Catamaran Ventures, InnoVen Capital, IFC, Saif Partners,
Transamerica VenturesGrowth Equity
$10.0
12/19/17Google Ventures, Menlo Ventures, Sequoia Capital, SoftBank Group, Thrive
CapitalSeries C $120.0
12/19/17 Allianz Series E $30.0
12/15/17 Undisclosed NA $26.8
12/12/17 Aquiline Capital Partners, BlackFin Capital Partners Series A $17.6
12/12/17 Undisclosed Investors Series B $3.3
12/11/17 Undisclosed Investors Series B - II $3.5
12/7/17 Helvetia Venture Fund Seed VC $1.2
12/6/17 Founders Fund, Martin Ventures, SV Angel, Thrive Capital Series A $12.8
12/6/17Cambridge Seed Funds, Parkwalk Advisors, QBE Ventures, iLexIR, Fintech
Innovation LabSeed VC $5.9
12/5/17 BECO Capital, Hamed Kanoo Co., Silicon Badia Series A - III $5.0
12/5/17G2VP, Shell Technology Ventures, Cisco Investments, ABB New Ventures,
Lightspeed Venture Partners, Spectrum 28Series C $33.0
11/21/17 Tola Capital, United Services Automobile Association Series D $16.4
SELECTED RECENT GROWTH EQUITY & VC ACTIVITY
Notes: Source: CapIq. Pitchbook.Selected deals from Q4 2017.
Date
Announced Target Investors Type Amount ($MM)

14
11/20/17 Balderton Capital, LocalGlobe, Undisclosed Angel Investors Series A $8.0
11/16/17 Lightspeed Venture Partners, LocalGlobe, Shlomo Kramer Seed VC $6.0
11/15/17 Hudson Structured Capital Management Series E $15.0
11/15/17 Andreessen Horowitz, CRV, First Round Capital, Foundation Capital Series C $34.6
11/13/17 Oak HC/FT Seed VC $11.5
11/7/17Anthemis Group, ManchesterStory Group, Mr. Cooper, National General
Holdings, Nationwide Mutual Insurance CompanySeries A $7.0
11/4/17 China Broadband Capital Partners, China Capital Group, Shunwei Capital Series B $30.0
10/26/17 Flyover Capital, QBE Ventures Seed VC $3.0
10/25/17 Peterson Ventures, Talis Capital Seed VC $3.2
10/24/17 Accel Partners, Elaia Partners, General Catalyst, Iris Capital Series B $28.0
10/24/17 Barcamper Ventures, Mansutti, Miro Ventures Seed $1.2
10/24/17 Anthemis Group, Baloise Group, Menlo Ventures, Plug and Play Ventures Seed VC $1.0
10/20/17Cyril Vermeulen, Francis Nappez, Frederic Mazzella, Keyrus Innovation Factory,
Kima VenturesSeed $1.2
10/20/17 Venrock Series A $62.0
10/19/17Insight Venture Partners, SaaStr Fund, Point Nine Capital, Dawn Capital,
Salesforce VenturesSeries B $34.0
SELECTED RECENT GROWTH EQUITY & VC ACTIVITY (CONT’D)
Date
Announced Target Investors Type Amount ($MM)
Notes: Source: CapIq. Pitchbook.Selected deals from Q4 2017.

15
10/17/17 Experian Series D $30.0
10/16/17 Amicus Capital Partners Series A $9.2
10/12/17ABG Capital, IDG Ventures India, Info Edge, Intel Capital, Inventus Capital
Partners, MakeSense Technologies, PremjiInvest, Ribbit CapitalSeries E $77.0
10/12/17Nokia Growth Partners, Moody's, AXA Strategic Ventures, Intel Capital, Sequoia
Capital, Google Ventures, Two Sigma VenturesSeries C $28.0
10/11/17 Everest Re Group, Houston International Insurance VC $6.5
10/9/17 K Fund, Sabadell Venture Capital, Seaya Ventures Series A $4.1
10/5/17Benzinga Global Fintech Awards, Foundation Capital, Founder Collective, Highland Capital Partners, Index Ventures, Starr Companies, Two Sigma
Series B $18.5
10/5/17Horizons Ventures, Munich Re/HSB Ventures, Plug and Play Accelerator, Plug
and Play Ventures, Sompo Holdings, Tusk VenturesSeries A $11.6
10/4/17 Davis Capital Partners, Michael Crowe Series A $4.0
10/4/17 Elefund, Moxley Holdings, Sirius International Insurance Group Seed VC $4.3
10/3/17Rakuten Capital, Draper Espirit, Talis Capital, Emery Capital, Rubicon Venture
CapitalSeries A $36.0
10/3/17 Direct Line Insurance Group Series A $2.1
10/3/17 Hambro Perks Seed VC $0.3
10/3/17 Gocompare.com, Taqnia, UAE Exchange Centre Series B $10.0
10/2/17 A-CAP NA $12.0
Median $10.0
SELECTED RECENT GROWTH EQUITY & VC ACTIVITY (CONT’D)
Date
Announced Target Investors Type Amount ($MM)
Notes: Source: CapIq. Pitchbook.Selected deals from Q4 2017.

16
SELECTED M&A ACTIVITY
Notes: Source: CapIq. Pitchbook.
Date Enterprise EV / Revenue EV / EBITDA
Announced Acquirer Target Value ($MM) LTM LTM
1/29/2018 $414 NA NA
1/16/2018 $51 NA NA
1/9/2018 NA NA NA
12/11/2017 $2,178 2.0x NA
12/7/2017 NA NA NA
12/6/2017 NA NA NA
11/30/2017 $280 NA NA
10/18/2017 $2,488 NA NA
10/6/2017 $275 NA NA
10/2/2017 $63 NA NA
9/28/2017 $1,741 1.5x NA
9/21/2017 $3,031 NA NA
9/6/2017 $60 NA NA
8/24/2017 $151 NA NA
8/21/2017 Sequel $324 9.8x 21.3x
8/4/2017 $490 7.5x 49.3x

17
SELECTED M&A ACTIVITY (CONT’D)
Notes: Source: CapIq. Pitchbook.
Date Enterprise EV / Revenue EV / EBITDA
Announced Acquirer Target Value ($MM) LTM LTM
7/27/2017 $107 NA NA
7/27/2017 $919 NA NA
6/8/2017 NA NA NA
5/24/2017 $95 2.4x NA
5/15/2017 NA NA NA
5/8/2017 $560 NA NA
4/27/2017 $115 NA NA
4/6/2017 $50 NA NA
4/4/2017 $225 4.7x NA
3/31/2017 $102 1.3x NA
2/16/2017 $160 3.9x NA
2/9/2017 $50 NA NA
1/9/2017 $150 2.5x NA
Median 2.5x 35.9x

18
SELECTED PUBLIC COMPANY DETAIL
Notes: Source: CapIq. Pitchbook.Multiples based on CapIq Consensus Estimates. Multiples <0 and >100 considered NM.
Bnft
s Adm
in./
Payr
oll
Insu
ranc
e Te
ch.
Brok
erag
e &
Dis
trib
.
($MM, except per share data)Stock EPS Operating Metrics Trading MetricsPrice Equity Enterprise Long Term Revenue Growth EBITDA Growth EBITDA Margin EV / Revenue EV / EBITDA Price / EPS
Company 12/31/17 Value Value Growth PEG 17E/16A NTM 17E/16A NTM 17E 17E 18E 17E 18E 17E 18E
Insurance TechnologyVerisk Analytics, Inc. $96.00 $15,810 $18,546 11% 2.7 7% 9% 4% 14% 49% 8.7x 8.1x 17.8x 16.5x 30.2x 27.2xGuidewire Software, Inc. $74.26 $5,704 $5,143 16% 5.4 26% 19% 30% 11% 21% 9.1x 7.6x 43.4x 39.0x 84.0x 77.8xEbix, Inc. $79.25 $2,493 $2,734 15% 1.7 19% 22% 10% 22% 34% 7.7x 6.4x 22.4x 18.0x 25.4x 22.1xHealthEquity, Inc. $46.66 $2,831 $2,606 34% 2.1 27% 23% 31% 45% 36% 11.5x 9.3x 31.6x 24.7x 70.4x 54.3xCorVel Corporation $52.90 $997 $959 NA NA 3% NA 4% NA 13% 1.8x NM 13.4x NM 31.5x NMBenefitfocus, Inc. $27.00 $844 $910 20% NA 10% 8% NA 46% 7% 3.5x 3.3x 50.0x 34.2x NM NMCrawford & Company $9.62 $536 $713 NA NA 2% 3% 1% 12% 11% 0.6x 0.6x 5.6x 5.0x 12.4x 11.3xSapiens International Corporation N.V. $11.52 $567 $565 5% NA 26% 10% (14%) 60% 10% 2.1x 1.9x 20.1x 12.6x NM 29.5xeHealth, Inc. $17.37 $323 $272 NA NA (9%) 29% NM NA (9%) 1.6x 1.2x NM 35.7x NM NMMajesco $5.37 $196 $204 NA NA (0%) 19% (12%) 126% 4% 1.7x 1.4x 38.0x 16.8x NM 53.7xSymbility Solutions Inc. $0.33 $80 $75 NA NA 19% 14% NM 14% 6% 1.8x 1.6x 29.1x 25.4x NM NM
Median 15% 2.4 10% 16% 4% 22% 11% 2.1x 2.6x 25.7x 21.4x 30.9x 29.5x
Benefits Administration/PayrollAutomatic Data Processing, Inc. $117.19 $51,973 $51,627 11% 2.9 6% 7% (3%) 5% 20% 4.1x 3.8x 19.8x 17.8x 31.0x 28.7xPaychex, Inc. $68.08 $24,453 $24,248 8% 3.6 6% 7% 8% 7% 44% 7.5x 7.0x 17.2x 16.0x 29.6x 25.7xThe Ultimate Software Group, Inc. $218.23 $6,520 $6,391 23% 2.6 20% 18% 16% 16% 23% 6.8x 5.7x 29.8x 23.3x 60.4x 48.1xPaycom Software, Inc. $80.33 $4,680 $4,648 28% 2.3 31% 26% 41% 18% 31% 10.8x 8.6x 35.0x 27.9x 63.8x 52.1xTriNet Group, Inc. $44.34 $3,081 $3,249 NA NA 7% 10% (15%) 18% 6% 1.0x 0.9x 17.1x 14.6x 46.2x 36.0xHealthEquity, Inc. $46.66 $2,831 $2,606 34% 2.1 27% 23% 31% 45% 36% 11.5x 9.3x 31.6x 24.7x 70.4x 54.3xPaylocity Holding Corporation $47.16 $2,477 $2,379 28% 2.5 30% 23% 98% 32% 19% 7.9x 6.4x 42.3x 32.0x 70.4x 55.5xInsperity, Inc. $57.35 $2,391 $2,207 17% 1.5 12% 11% 24% 44% 5% 0.7x 0.6x 12.6x 11.0x 24.3x 21.7xWageWorks, Inc. $62.00 $2,457 $1,810 15% 2.3 32% 11% 35% 76% 30% 3.8x 3.4x 12.4x 10.8x 34.8x 31.6xBenefitfocus, Inc. $27.00 $844 $910 20% NA 10% 8% NA 46% 7% 3.5x 3.3x 50.0x 34.2x NM NMCastlight Health, Inc. $3.75 $502 $420 25% NA 28% 24% NA NA (19%) 3.2x 2.6x NM NM NM NM
Median 22% 2.4 20% 11% 24% 25% 20% 4.1x 3.8x 24.8x 20.6x 46.2x 36.0x
Brokerage & DistributionMarsh & McLennan Companies, Inc. $81.39 $41,538 $45,948 11% 1.9 5% 5% 8% 12% 24% 3.3x 3.2x 13.5x 12.5x 21.4x 19.5xAon plc $134.00 $33,503 $37,179 11% 1.8 (15%) (14%) (7%) 23% 25% 3.7x 3.5x 15.1x 13.2x 20.6x 16.7xWill is Towers Watson Public Limited Company $150.69 $19,897 $23,563 10% 1.7 3% 4% 8% 30% 23% 2.9x 2.8x 12.4x 11.2x 17.9x 15.3xArthur J. Gallagher & Co. $63.28 $11,441 $13,893 13% 1.7 8% 5% 9% 23% 17% 2.3x 2.1x 13.7x 12.1x 21.2x 18.9xBrown & Brown, Inc. $51.46 $7,174 $7,551 11% 2.4 5% 2% 1% 3% 32% 4.1x 3.9x 12.9x 12.5x 27.8x 25.3xJardine Lloyd Thompson Group plc $18.80 $3,970 $4,543 27% 0.9 18% 10% NA 46% 21% 2.5x 2.3x 11.6x 10.3x 23.8x 19.7xMoneysupermarket.com Group PLC $4.81 $2,581 $2,558 10% 2.1 16% 12% 17% 25% 38% 5.6x 5.3x 14.7x 13.6x 21.5x 19.5xQuinStreet, Inc. $8.38 $383 $333 26% NA 8% 11% 180% NM 6% 1.0x 0.9x 16.2x 12.1x NM 61.3xeHealth, Inc. $17.37 $323 $272 NA NA (9%) 6% NA NA (10%) 1.6x 1.4x NM 34.0x NM NMiSelect Limited $1.12 $240 $179 NA NA 19% 14% 26% 35% 15% 1.2x 1.1x 7.6x 6.6x 18.9x 15.7x
Median 11% 1.8 7% 6% 8% 24% 22% 2.7x 2.5x 13.5x 12.3x 21.3x 19.5x

19
SELECTED PUBLIC COMPANY DETAIL (CONT’D)
Notes: Source: CapIq. Pitchbook.Multiples based on CapIq Consensus Estimates. Multiples <0 and >100 considered NM.
Prop
erty
& C
asua
ltyLi
feHe
alth
Property & CasualtyAllianz SE $230.76 $102,912 $113,081 6% 2.2 13% 17% NA 3% 10% 0.8x 0.8x 7.9x 7.7x 12.1x 11.2xChubb Limited $146.13 $67,837 $79,810 6% 3.2 5% (13%) (18%) 36% 18% 2.9x 2.8x 16.1x 11.9x 20.2x 13.5xAmerican International Group, Inc. $59.58 $53,560 $72,391 11% 2.0 (5%) (1%) NM 44% 17% 1.4x 1.5x 8.7x 6.1x 22.2x 11.8xThe Allstate Corporation $104.71 $37,573 $41,033 14% 1.2 3% (14%) 56% (11%) 15% 1.3x 1.2x 8.3x 9.4x 16.7x 14.1xThe Travelers Companies, Inc. $135.64 $37,124 $38,456 10% 1.9 5% (8%) NM 17% 15% 1.5x 1.4x 9.8x 8.4x 19.5x 14.1xThe Progressive Corporation $56.32 $32,756 $33,193 13% 1.7 15% 10% 37% 8% 9% 1.2x 1.1x 13.1x 12.2x 23.5x 19.1xThe Hartford Financial Services Group, Inc. $56.28 $20,076 $21,641 12% 1.5 1% 4% NA 21% 11% 1.2x 1.1x 10.6x 8.8x 17.5x 13.4xCNA Financial Corporation $53.05 $14,386 $15,503 8% 2.0 1% NM 14% 0% 23% 2.4x 2.3x 10.3x 10.3x 16.7x 15.0xMarkel Corporation $1,139.13 $15,825 $14,224 NA NA 6% 10% NM NM 8% 2.4x 2.2x 31.3x 17.8x NM 35.3xCincinnati Financial Corporation $74.97 $12,300 $12,469 2% 11.3 5% 3% (16%) 22% 12% 2.2x 2.1x 18.7x 15.3x 27.9x 24.0xW. R. Berkley Corporation $71.65 $8,727 $9,952 6% 5.2 1% (17%) (11%) 0% 16% 1.6x 1.5x 10.0x 10.0x 29.8x 21.2xAmerican Financial Group, Inc. $108.54 $9,564 $9,044 12% 1.5 3% NM (0%) 8% 23% 2.0x 2.0x 8.8x 8.1x 18.0x 16.1xRSA Insurance Group plc $8.55 $8,612 $8,464 11% 1.4 15% 1% (3%) 11% 10% 0.9x 0.9x 9.5x 8.5x 14.8x 12.5xAssurant, Inc. $100.84 $5,426 $5,393 NA NA (16%) (2%) NM NM 7% 0.9x 0.8x 12.2x 7.5x 27.3x 14.5xAmTrust Financial Services, Inc. $10.07 $1,974 $2,543 NA NA 5% (3%) 0% NM 0% 0.5x 0.4x NM NM 10.4x 7.2x
Median 10% 2.0 5% (1%) (0%) 10% 12% 1.4x 1.4x 10.1x 9.1x 18.8x 14.1x
LifeAXA SA $29.70 $70,842 $85,437 5% 2.1 17% (16%) 12% (2%) 8% 0.7x 0.7x 8.6x 8.9x 9.9x 9.4xMetLife, Inc. $50.56 $53,204 $78,577 14% 0.8 (8%) 0% (14%) 4% 11% 1.2x 1.2x 11.2x 10.8x 11.2x 10.8xZurich Insurance Group AG $304.34 $45,706 $43,137 7% 2.1 2% (23%) (2%) 6% 12% 0.8x 0.8x 6.9x 6.4x 14.9x 12.2xLegal & General Group Plc $3.69 $21,931 $43,130 7% 1.6 4% (29%) 24% (4%) 25% 3.8x 3.5x 15.3x 15.9x 10.9x 11.2xAflac Incorporated $87.78 $34,511 $35,297 NA NA (5%) (3%) NA NA 19% 1.6x 1.6x 8.6x 7.7x 13.0x 12.8xPrudential Financial, Inc. $114.98 $48,836 $34,321 13% 0.8 (1%) (11%) 2% 7% 14% 0.7x 0.7x 4.8x 4.5x 11.0x 9.9xManulife Financial Corporation $20.91 $41,373 $34,036 12% 1.0 17% 54% NM (7%) 13% 0.7x 0.7x 5.7x 6.2x 11.8x 10.5xAmeriprise Financial, Inc. $169.47 $25,070 $27,749 NA NA 3% 1% NA (4%) 26% 2.3x 2.2x 9.0x 8.4x 14.2x 13.2xLincoln National Corporation $76.87 $16,821 $18,960 8% 1.2 4% 6% NA NA 14% 1.3x 1.3x 9.1x NM 10.0x 9.7xPrincipal Financial Group, Inc. $70.56 $20,375 $18,782 10% 1.4 11% (5%) NA NA 19% 1.4x 1.4x 7.0x NM 13.5x 12.5xAEGON N.V. $6.38 $13,154 $1,195 6% 1.2 11% (52%) NA NA 14% 0.0x 0.0x 0.3x NM 7.8x 8.0xAviva plc $6.85 $27,464 ($14,249) 6% 1.5 (12%) 31% 22% 9% 6% NM NM NM NM 9.4x 9.1xSun Life Financial Inc. $41.37 $25,317 ($29,673) NA NA 3% 18% NA NA 14% NM NM NM NM 12.6x 11.9x
Median 8% 1.3 3% (3%) 7% 1% 14% 1.2x 1.2x 8.6x 8.1x 11.2x 10.8x
HealthUnitedHealth Group Incorporated $220.46 $213,641 $229,843 15% 1.5 9% 9% 13% 13% 9% 1.1x 1.0x 13.2x 11.3x 22.1x 20.4xAetna Inc. $180.39 $58,838 $60,355 11% 1.8 (4%) (3%) 9% 3% 10% 1.0x 1.0x 9.7x 9.1x 18.4x 18.0xCigna Corporation $203.09 $50,072 $51,589 15% 1.3 4% 4% 16% 7% 11% 1.3x 1.2x 11.1x 10.0x 19.6x 17.8xAnthem, Inc. $225.01 $57,774 $48,647 11% 1.8 5% 2% 17% 17% 6% 0.5x 0.5x 8.5x 7.2x 18.8x 17.4xHumana Inc. $248.07 $34,625 $21,239 13% 1.7 (3%) 5% 15% 47% 7% 0.4x 0.4x 5.6x 5.2x 21.3x 20.5xCentene Corporation $100.88 $17,409 $17,307 17% 1.2 18% 27% 8% 6% 4% 0.4x 0.3x 9.9x 6.4x 20.2x 17.7xWellCare Health Plans, Inc. $201.11 $8,954 $4,752 16% 1.5 19% 14% (2%) 20% 4% 0.3x 0.3x 6.9x 4.9x 24.3x 23.2xAEGON N.V. $6.38 $13,154 $1,195 6% 1.2 11% NM NA NM 14% 0.0x 0.0x 0.3x NM 7.8x 8.0x
Median 14% 1.5 7% 5% 13% 13% 8% 0.5x 0.5x 9.1x 7.2x 19.9x 17.9x
($MM, except per share data)Stock EPS Operating Metrics Trading MetricsPrice Equity Enterprise Long Term Revenue Growth EBITDA Growth EBITDA Margin EV / Revenue EV / EBITDA Price / EPS
Company 12/31/17 Value Value Growth PEG 17E/16A NTM 17E/16A NTM 17E 17E 18E 17E 18E 17E 18E

20
SELECTED PUBLIC COMPANY DETAIL (CONT’D)
Notes: Source: CapIq. Pitchbook.Multiples based on CapIq Consensus Estimates. Multiples <0 and >100 considered NM.
Info
rmat
ion
Serv
ices
($MM, except per share data)Stock EPS Operating Metrics Trading MetricsPrice Equity Enterprise Long Term Revenue Growth EBITDA Growth EBITDA Margin EV / Revenue EV / EBITDA Price / EPS
Company 12/31/17 Value Value Growth PEG 17E/16A NTM 17E/16A NTM 17E 17E 18E 17E 18E 17E 18EInformation ServicesRELX PLC $23.50 $47,005 $53,545 9% 2.4 18% 8% 19% 24% 35% 5.3x 5.1x 15.3x 14.6x 21.6x 20.1xS&P Global Inc. $169.40 $43,197 $44,453 14% 1.8 5% 6% 14% 10% 48% 7.5x 7.0x 15.5x 14.5x 25.5x 23.4xThomson Reuters Corporation $43.69 $31,012 $37,392 9% 1.9 2% 3% 8% 41% 30% 3.3x 3.2x 11.0x 10.5x 17.7x 16.7xMoody's Corporation $147.61 $28,208 $32,859 10% 2.6 14% 11% 19% 9% 48% 8.0x 7.3x 16.8x 15.2x 24.9x 22.7xExperian plc $22.11 $20,074 $23,539 9% 2.8 (5%) 7% (1%) 7% 36% 5.5x 4.9x 15.4x 14.5x 24.7x 21.1xIHS Markit Ltd. $45.15 $17,872 $21,932 13% 1.7 30% 4% 40% 32% 39% 6.1x 5.8x 15.8x 14.5x 22.0x 20.5xNielsen Holdings plc $36.40 $12,965 $20,750 8% 1.7 4% 4% 5% 22% 31% 3.2x 3.1x 10.2x 10.1x 13.6x 14.1xVerisk Analytics, Inc. $96.00 $15,810 $18,546 11% 2.7 7% 9% 4% 14% 49% 8.7x 8.1x 17.8x 16.5x 30.2x 27.2xWolters Kluwer N.V. $52.21 $14,682 $17,272 8% 2.4 18% 6% 22% 10% 27% 3.2x 3.2x 11.9x 11.6x 19.3x 18.1xEquifax Inc. $117.92 $14,160 $16,551 11% 1.8 6% 2% 8% 3% 36% 4.9x 4.8x 13.6x 13.5x 19.9x 19.9xGartner, Inc. $123.15 $11,164 $13,884 17% 2.1 37% 30% 53% 119% 21% 4.1x 3.5x 19.9x 16.6x 35.7x 30.6xMSCI Inc. $126.54 $11,397 $12,676 18% 1.8 10% 12% 16% 16% 52% 10.0x 9.0x 19.2x 16.9x 33.1x 28.0xTransUnion $54.96 $10,024 $12,144 12% 2.5 12% 10% 17% 23% 39% 6.3x 5.8x 16.3x 14.6x 29.5x 25.9xInforma plc $9.76 $8,037 $10,072 6% 2.6 41% 14% 45% 23% 34% 4.3x 4.2x 12.8x 12.1x 15.6x 14.7xNews Corporation $16.21 $9,449 $7,958 17% 2.1 1% 1% 0% 17% 11% 1.0x 1.0x 8.5x 8.3x 36.7x 30.5xFactSet Research Systems Inc. $192.76 $7,539 $7,860 11% 2.3 11% 9% 14% 10% 37% 6.2x 5.7x 16.7x 16.7x 25.6x 22.7xThe Dun & Bradstreet Corporation $118.41 $4,376 $5,627 7% 2.5 3% 3% 2% 21% 29% 3.2x 3.1x 11.2x 10.7x 16.5x 16.0xCoreLogic, Inc. $46.21 $3,806 $5,455 11% 1.8 (5%) (0%) (5%) 22% 26% 3.0x 2.9x 11.5x 11.2x 19.8x 18.5xFair Isaac Corporation $153.20 $4,595 $5,164 16% 1.9 5% 5% 10% 19% 24% 5.4x 5.1x 22.6x 19.4x 30.9x 27.0xMorningstar, Inc. $96.97 $4,124 $4,005 NA NA 7% 4% (7%) 12% 27% 4.7x 4.5x 17.2x 15.3x 41.3x 34.1xAcxiom Corporation $27.56 $2,185 $2,246 13% NA 6% 12% 15% 18% 20% 2.4x 2.1x 11.8x 10.1x NM 53.0xEuromoney Institutional Investor PLC $17.64 $1,892 $2,113 8% 2.2 15% 13% 18% 17% 27% 3.6x 3.6x 13.6x 13.0x 16.9x 16.1xcomScore, Inc. $28.50 $1,632 $1,518 NA NA 11% 11% 35% 32% 14% 3.2x 2.9x 23.4x 17.7x 14.5x 11.5xNational Research Corporation $56.06 $1,373 $1,339 NA NA 8% 8% 10% 6% 33% 11.3x 10.5x 34.5x 31.3x 63.7x 59.0xForrester Research, Inc. $44.20 $794 $661 14% 2.7 2% 4% (3%) 12% 12% 2.0x 1.9x 17.3x 15.0x 36.5x 30.1x
Median 11% 2.2 7% 7% 14% 17% 31% 4.7x 4.5x 15.5x 14.5x 24.8x 22.7x

21
SELECTED PUBLIC COMPANY DETAIL (CONT’D)
Notes: Source: CapIq. Pitchbook.Multiples based on CapIq Consensus Estimates. Multiples <0 and >100 considered NM.
IT &
BPO
Ser
vice
s
($MM, except per share data)Stock EPS Operating Metrics Trading MetricsPrice Equity Enterprise Long Term Revenue Growth EBITDA Growth EBITDA Margin EV / Revenue EV / EBITDA Price / EPS
Company 12/31/17 Value Value Growth PEG 17E/16A NTM 17E/16A NTM 17E 17E 18E 17E 18E 17E 18EIT & BPO ServicesInternational Business Machines Corporation $153.42 $142,035 $176,279 (0%) (222.6) (2%) (0%) 1% 22% 24% 2.2x 2.2x 9.2x 8.9x 11.1x 11.0xAccenture plc $153.09 $94,406 $90,749 10% 2.5 7% 9% 4% 15% 16% 2.6x 2.3x 15.5x 13.5x 25.5x 22.7xTata Consultancy Services Limited $42.32 $81,016 $75,299 10% 2.1 10% 7% 7% 6% 27% 4.0x 3.7x 15.0x 14.0x 20.5x 18.8xCognizant Technology Solutions Corporation $71.02 $41,877 $37,987 14% 1.4 10% 10% 15% 18% 21% 2.6x 2.3x 12.5x 10.8x 19.1x 16.3xDXC Technology Company $94.90 $27,072 $32,926 11% 1.4 168% 20% 220% 26% 20% 1.6x 1.4x 8.4x 6.7x 14.3x 11.3xInfosys Limited $16.33 $35,479 $31,864 8% 2.0 9% 7% 6% 4% 27% 2.9x 2.8x 10.9x 10.5x 16.4x 15.7xCapgemini SE $118.74 $19,347 $21,808 8% 2.2 16% 8% 12% 17% 13% 1.4x 1.4x 10.6x 10.0x 16.7x 15.6xWipro Limited $4.91 $23,776 $21,312 9% 1.9 7% 3% 11% 9% 21% 2.5x 2.4x 11.6x 11.6x 17.2x 16.8xNTT Data Corporation $11.89 $16,673 $20,016 8% 3.7 29% 6% 15% 10% 14% 1.1x 1.1x 7.6x 7.2x 31.3x 26.7xHCL Technologies Limited $13.95 $19,423 $18,672 12% 1.1 19% 9% 15% 7% 22% 2.4x 2.2x 10.6x 9.9x 14.0x 13.7xCGI Group Inc. $54.46 $15,445 $16,863 16% 1.1 10% 4% 8% 14% 18% 1.9x 1.9x 10.7x 10.1x 18.3x 16.7xAtos SE $145.71 $15,258 $14,868 10% 1.4 24% 11% 31% 11% 13% 1.0x 0.9x 7.4x 7.1x 14.7x 13.5xNomura Research Institute, Ltd. $46.52 $11,094 $10,467 9% 3.1 13% 7% 9% 7% 20% 2.6x 2.5x 12.7x 11.9x 27.5x 25.7xGenpact Limited $31.74 $6,127 $6,904 10% 1.9 6% 6% 7% 8% 17% 2.5x 2.4x 15.2x 13.8x 19.8x 17.9xTech Mahindra Limited $7.90 $7,716 $6,561 15% 1.0 13% 5% (2%) 1% 14% 1.4x 1.3x 10.2x 8.9x 14.8x 13.8xCapita plc $5.42 $3,607 $6,476 15% 0.6 (5%) (9%) (6%) (14%) 13% 1.1x 1.1x 8.7x 8.5x 8.5x 8.2xEPAM Systems, Inc. $107.43 $5,674 $5,185 20% 1.6 25% 23% 24% 55% 18% 3.6x 2.9x 20.1x 16.2x 31.4x 25.7xConduent Incorporated $16.16 $3,400 $4,994 NA NA (6%) (3%) 5% 9% 11% 0.8x 0.9x 7.5x 6.9x 20.0x 15.0xPresidio, Inc. $19.17 $1,758 $2,656 9% 1.7 NA 6% NA 9% 8% 0.9x 0.9x 11.1x 10.6x 15.1x 14.1xSyntel, Inc. $22.99 $1,905 $2,184 9% 1.4 (7%) (5%) (18%) (10%) 25% 2.4x 2.4x 9.6x 9.4x 12.2x 12.7xWNS (Holdings) Limited $40.13 $2,021 $1,916 14% 3.1 23% 5% 16% 70% 18% 2.8x 2.5x 15.1x 11.6x 43.2x 27.2xMphasiS Limited $11.43 $2,207 $1,871 8% 2.4 9% 7% (5%) 6% 15% 1.9x 1.7x 12.4x 10.9x 18.7x 15.9xExlService Holdings, Inc. $60.35 $2,048 $1,845 14% 1.7 11% 9% 10% 38% 17% 2.4x 2.2x 14.1x 12.5x 23.0x 21.1xLuxoft Holding, Inc. $55.70 $1,870 $1,815 NA NA 18% 18% 3% 78% 15% 2.1x 1.7x 13.4x 10.5x 19.9x 16.3xGlobant S.A. $46.46 $1,631 $1,596 NA NA 26% 22% 0% 48% 16% 3.9x 3.3x 24.5x 19.2x 35.7x 29.8xHexaware Technologies Limited $5.34 $1,584 $1,516 13% 1.6 19% 12% 24% 15% 17% 2.5x 2.2x 14.4x 13.1x 20.2x 19.0xMindtree Limited $9.56 $1,567 $1,470 14% 1.6 8% 8% (9%) 9% 12% 1.8x 1.6x 14.2x 11.9x 22.6x 20.1xVirtusa Corporation $44.08 $1,294 $1,161 21% 1.4 19% 16% 81% 49% 7% 1.2x 1.1x 17.1x 12.1x 29.8x 22.3xPersistent Systems Limited $11.26 $901 $785 14% 1.3 15% 10% 15% 15% 16% 1.7x 1.5x 10.5x 8.9x 17.5x 14.9xPerficient, Inc. $19.07 $666 $728 NA NA (0%) 11% 9% 54% 14% 1.5x 1.4x 10.4x 9.2x 15.8x 13.7x
Median 10% 1.6 11% 8% 9% 13% 17% 2.1x 2.0x 11.3x 10.5x 18.9x 16.3x

22
SELECTED PUBLIC COMPANY DETAIL (CONT’D)
Notes: Source: CapIq. Pitchbook.Multiples based on CapIq Consensus Estimates. Multiples <0 and >100 considered NM.
Fina
ncia
l Saa
S
($MM, except per share data)Stock EPS Operating Metrics Trading MetricsPrice Equity Enterprise Long Term Revenue Growth EBITDA Growth EBITDA Margin EV / Revenue EV / EBITDA Price / EPS
Company 12/31/17 Value Value Growth PEG 17E/16A NTM 17E/16A NTM 17E 17E 18E 17E 18E 17E 18EFinancial SaaSIntuit Inc. $157.78 $40,336 $40,434 15% 2.3 12% 10% 9% 32% 37% 7.4x 6.8x 20.1x 18.5x 34.7x 31.3xWorkday, Inc. $101.74 $21,365 $19,628 34% 3.1 35% 25% 91% 24% 16% 9.2x 7.4x 58.7x 47.4x 104.9x 95.1xThe Sage Group plc $10.79 $11,653 $12,643 10% 2.7 19% 11% 16% 19% 30% 5.5x 4.9x 18.2x 16.8x 26.6x 23.2xSS&C Technologies Holdings, Inc. $40.48 $8,333 $10,447 17% 1.3 10% 7% 13% 23% 41% 6.2x 5.9x 15.1x 13.6x 21.0x 18.5xPaycom Software, Inc. $80.33 $4,680 $4,648 28% 2.3 31% 26% 41% 18% 31% 10.8x 8.6x 35.0x 27.9x 63.8x 52.1xXero Limited $22.36 $3,071 $3,013 NA NA 33% 48% NA NA (11%) 11.9x 8.0x NM 55.2x NM NMEnvestnet, Inc. $49.85 $2,209 $2,418 15% 2.6 18% 16% 21% 27% 18% 3.6x 3.1x 20.1x 15.7x 38.3x 30.5xPaylocity Holding Corporation $47.16 $2,477 $2,379 28% 2.5 30% 23% 98% 32% 19% 7.9x 6.4x 42.3x 32.0x 70.4x 55.5xAlfa Financial Software Holdings PLC $7.23 $2,169 $2,143 NA NA 18% 17% 15% 18% 47% 17.9x 15.3x 37.9x 32.1x 0.6x 0.4xFinancial Engines, Inc. $30.30 $1,919 $1,721 15% 1.5 13% 7% 18% 6% 33% 3.6x 3.4x 10.9x 10.2x 22.1x 21.0xCoupa Software Incorporated $31.22 $1,719 $1,499 NA NA 36% 23% NA NA (7%) 8.3x 6.7x NM NM NM NMQ2 Holdings, Inc. $36.85 $1,536 $1,447 26% NA 29% 23% NA NA 5% 7.5x 6.0x NM 72.1x NM NMBlucora, Inc. $22.10 $1,019 $1,288 17% 0.9 10% 6% 6% 26% 20% 2.6x 2.4x 12.9x 11.0x 15.9x 13.2xBenefitfocus, Inc. $27.00 $844 $910 20% NA 10% 8% NA 46% 7% 3.5x 3.3x 50.0x 34.2x NM NM
Median 17% 2.3 19% 17% 17% 24% 19% 7.4x 6.2x 20.1x 27.9x 30.7x 26.9x

23
A leading independent, global investment bankGCA OVERVIEW
San Francisco I New York I Manchester I London I Milan I Zurich I Frankfurt I Munich I Tel Aviv I Mumbai I New Delhi I Singapore I Shanghai I Osaka I Tokyo
GLOBAL
Global reach with 15 offices in 10 key markets, with deep local roots to ensure hands-on support for our clients
TECH FOCUS
Leading technology advisor with strong networks in key tech hubs globally
GROWTHCOMPANIES
Expert advisor for cross-border transactions – ~33% of our deals involve cross-border outcomes
CROSS-BORDER
Strong expertise in advising growth companies and leading corporations in capital raising and M&A
400+
Over 400 M&A bankers and growth company experts in the U.S., Europe, and Asia
350+
Over 350 deals closed over the last 3 years

24
Selected FinTech experienceGCA OVERVIEW
We Advised TSYS
Acquisition of
We Advised Vindicia
Acquired by
We Advised Edo
Acquired byStrategic Investment
We Advised ControlExpert
Financial Advisor
Growth Investment
Sale of
Financial Advisor
to
Payments
Banking & Lending Tech Payments
Insurance Technology Payments Payments
We Advised Hitachi
Acquired by
We Advised GP Net
Financial Advisor
Growth Investment
We Advised CHX
Acquired by
Investor Group led by Casin Group
We Advised Blucora
Acquisition of
We Advised AWL
Acquired by Preferred Stock Investmentfrom
Financial Advisor
Payments
Investment Technology Insurance Technology Insurance Technology
Payments
Payments
Liquidity Venues
Acquired by
We Advised INS WebWe Advised TrustedID
Acquired by
We Advised Simple
Acquired by
We Advised Capsilon
Growth Investmentfrom
We Advised Skyslope
Majority sale to
Information Services Insurance Technology
Real Estate Tech
Banking & Lending Tech
Real Estate Tech
We Advised Commissions Inc
Acquired by
We Advised INS Web
Acquisition of
We Advised Finanzen.de
Acquired by
Insurance Technology
Real Estate Tech
Insurance Technology
Real Estate Tech
Payments
We Advised Market Leader
Acquired by
We Advised Radius
Financing from
Payments
Acquisition of
We Advised TSYS
The above transactions represent a compilation of past and current deals that GCAentities, including GCA Advisors, LLC, GCA Corporation and GCA Altium, have advised on.
Acquired byGrowth InvestmentFor Blockchain Technology
Financial Advisor
Information Services
Acquired by
We Advised WorkMarket
Financial SaaS
Sold
To
We Advised RGI Shareholders
Insurance Technology
Tender Offer for
Asahi Fire & MarineInsurance Co.
We Advised Asahi (close pending)
Insurance Technology
25
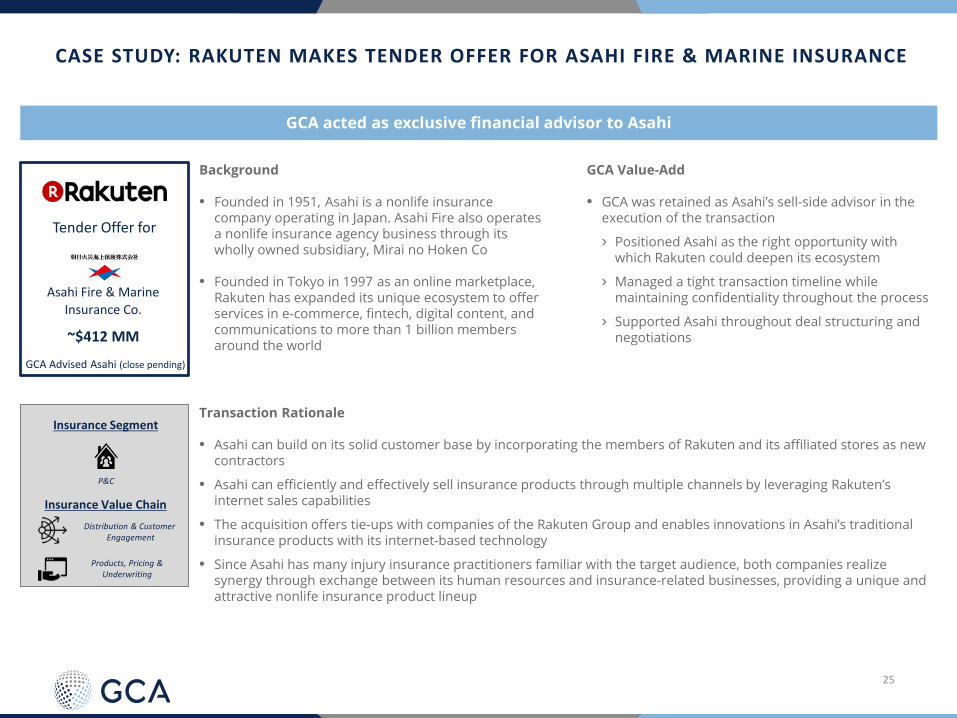
CASE STUDY: RAKUTEN MAKES TENDER OFFER FOR ASAHI FIRE & MARINE INSURANCE
GCA acted as exclusive financial advisor to Asahi
GCA Value-Add
• GCA was retained as Asahi’s sell-side advisor in the execution of the transaction
› Positioned Asahi as the right opportunity with which Rakuten could deepen its ecosystem
› Managed a tight transaction timeline while maintaining confidentiality throughout the process
› Supported Asahi throughout deal structuring and negotiations
Background
• Founded in 1951, Asahi is a nonlife insurance company operating in Japan. Asahi Fire also operates a nonlife insurance agency business through its wholly owned subsidiary, Mirai no Hoken Co
• Founded in Tokyo in 1997 as an online marketplace, Rakuten has expanded its unique ecosystem to offer services in e-commerce, fintech, digital content, and communications to more than 1 billion members around the world
Transaction Rationale
• Asahi can build on its solid customer base by incorporating the members of Rakuten and its affiliated stores as new contractors
• Asahi can efficiently and effectively sell insurance products through multiple channels by leveraging Rakuten’s internet sales capabilities
• The acquisition offers tie-ups with companies of the Rakuten Group and enables innovations in Asahi’s traditional insurance products with its internet-based technology
• Since Asahi has many injury insurance practitioners familiar with the target audience, both companies realize synergy through exchange between its human resources and insurance-related businesses, providing a unique and attractive nonlife insurance product lineup
Insurance Segment
Insurance Value Chain
P&C
Products, Pricing & Underwriting
Distribution & CustomerEngagement
Asahi Fire & Marine Insurance Co.
Tender Offer for
~$412 MM
GCA Advised Asahi (close pending)

26
CASE STUDY: SALE OF RGI TO CORSAIR CAPITAL
GCA acted as exclusive financial advisor to the shareholders of RGI
GCA Value-Add
• GCA was selected as exclusive sell-side financial advisor due to our extensive experience in advising growing and profitable software companies, our expertise within the insurance space, and our broad network of contacts among global tech-focused private equity firms
Background
• RGI is the European market leader in the insurance software vertical, with 200+ installations serving 100+ clients
• RGI offers a state-of-the-art policy administration software suite with multi-country capabilities, suitable for all-tier insurers across verticals
Transaction Details
• Shareholders decided to sell RGI after having successfully completed the acquisition of France-based Kapia Solutions (September 2016), which provided RGI an integrated platform to cover life insurance clients
• RGI shareholders retained GCA to lead a structured sale process
• GCA ran a highly competitive process, approaching a targeted group of tech-focused global financial investors and a limited number of strategic buyers
• GCA supported RGI throughout all transaction phases, setting up all marketing documentation, coordinating business plan and VDD reports preparation, managing an in-depth due diligence process, helping with legal / financing documents, and handling SPA and management incentive plan negotiations
• Corsair Capital emerged as the fastest and most committed bidder
Sold
P&C
Data & Analytics
Policy Admin, Claims & Back Office
Insurance Segment
Insurance Value Chain
To
GCA Advised RGI Shareholders
Life Health

27
CASE STUDY: SALE OF CONTROLEXPERT TO GENERAL ATLANTIC
GCA acted as exclusive financial advisor to the shareholders of ControlExpert
GCA Value-Add
• GCA was retained as sell-side advisor to provide support in the preparation and execution of the transaction to the Company and its shareholders:
› Channeled strong inbound interest from numerous strategic buyers and financial sponsors
› Managed a tight transaction timeline while maintaining confidentiality throughout the process
› Coordinated due diligence work streams
Background
• ControlExpert is a disruptive technology service provider to the auto insurance industry and Europe’s largest InsurTech company
• The Company serves a broad blue-chip customer base of more than 100 enterprise accounts, including ~90% of all German auto insurances, as well as major leasing/fleet management companies and automotive OEMs
• ControlExpert’s cutting-edge technology allows more efficient organization of a traditionally very lengthy, costly and prone-to-fraud claims handling process
Transaction Details
• ControlExpert sought a strategic partner with an international footprint and relevant industry experience to accelerate its future growth in existing and new markets
• The shareholders were aiming to realize a valuation which reflects ControlExpert‘s strong growth, significant market potential and competitive positioning
• General Atlantic emerged as the preferred potential partner and was able to move swiftly during the due diligence phase
• The transaction was signed in May 2017 and closed June 2017
Strategic Investment
GCA Advised ControlExpert
Insurance Segment
Insurance Value Chain
P&C
Data & Analytics
Policy Admin, Claims & Back Office