INSURANCE SECTOR - databank.com.lb Sector Annual Report 2007.pdf · 4 Insurance sector | AnnuAl...
46
Republic of Lebanon Ministry of Economy & Trade INSURANCE CONTROL COMMISSION INSURANCE SECTOR ANNUAL REPORT 2007
Transcript of INSURANCE SECTOR - databank.com.lb Sector Annual Report 2007.pdf · 4 Insurance sector | AnnuAl...

Republic of LebanonMinistry of Economy & Trade
INSURANCE CONTROL COMMISSION
INSURANCE SECTORANNUAL REPORT
2007


Insurance sector | AnnuAl RepoRt 07 3
Minister’s note (Initial Text) 4
Head of ICC’s note 5
List of companies 6
Sectors Progress Report 2001-2007 7
Revenues, Costs, Assets & Equities Evolution (Graphs) 8
Life vs. Non Life Premiums & Claims Evolution (Graphs) 9
Consolidated Profit & Loss 10-11
Consolidated liabilities 13
Breakdown of Assets, Investments and Liabilities (Graphs) 14
Equities & Premiums Distribution (Graphs) 15
Premiums, Expenses and workforce Distribution (Graphs) 16
Ratio Analysis and Averages 2007 17
Life vs. Non Life Comparative P&L, Ratios 2007 (Graphs) 18-19
Condensed P&L + Ratios 2007 (Graphs) 20-21
Commissions & Ceded Premiums by Branch (Graph) 22
Profits & Expenses by Branch (Graph) 23
Premiums & Claims Distribution and market shares by Branch (Graphs) 24-38
Taxation on Insurance by Branch 39
Consolidated Profit & Loss (Leb Pounds) - Arabic - 40-41
Consolidated Assets & Liabilities (Leb Pounds) - Arabic - 42-43
Forewords - Minister’s & ICC Head (Translation) - Arabic - 44-45
Contents

Insurance sector | AnnuAl RepoRt 074
I am very happy to present this first report on statistics and financial figures relative to the Lebanese Insurance sector that the Insurance Control Commission will issue annually from now on. Although somewhat late, this first issue concerns the information for year 2007. The 2008 report will be issued shortly after, in order to keep-up with a regular and timely pace of report issuing from then on. The insurance sector is a vital sector to the Lebanese economy and the ministry of Economy and Trade is working actively to help in its development. Indeed, the activity of insurance is not only important at the social level, but in addition a well performing and reliable insurance sector can act as leverage to the national economy through its savings and investment aspects as well as through the potential insurance to major projects. This objective cannot be met effectively without a proper regulation and supervision of this sector, since as one of the three arms of the financial sector, with banking and securities, it holds the interest of a large number of Lebanese citizens and policyholders at hand. At about 3 percent of GDP, the Lebanese insurance sector has the highest penetration level in the Middle East and North Africa. Yet compared to world averages there is still a long way ahead of us. In the shadow of a stable and growing economy, our sector has still a significant growth potential. This potential, however, can only be attained through a sector that has gained in maturity, competence, and in reliability as to the respect of its engagement towards policyholders and entitled beneficiaries. The responsibility of the Ministry of Economy and the Government as a whole towards the insurance industry is to ensure that proper codes of conducts are brought into force, and appropriate legislations are passed, such as a new insurance sector supervision law, and eventually the development of a coherent insurance code composed of a set of laws encompassing the review of contracts law and compulsory insurances act. The ministry’s most urgent task is, presently, to continue supporting the effective development of the Insurance Control Commission that acts as the guardian of a healthy Insurance Sector. The statistics and financial information presented in this report is the first step towards increased and sustained transparency in the insurance sector’s information from which everyone will benefit in the future.
Minister’s note
Mohamad SafadiMinister of Economy and Trade

Insurance sector | AnnuAl RepoRt 07 5
This first statistical report on the state of the Lebanese Insurance sector is in a way a duty of the Insurance Control Commission’s to return back to the sector information that will help improve the understanding of this sector and the transparent reporting of companies.
Indeed, it is through transparent reporting on the sector that its credibility will grow, as transparency is one of the pillars of confidence building. In addition, through the improved understanding of where the sector stands as a whole, provided by these statistics, and through the possibility for each company to gauge itself with respect to the sector and other companies, it will be possible to design better strategies that can only help the sector improve and grow.
The Lebanese insurance sector, despite the politically turbulent years the country has been going through continued to grow at a regular pace since year 2001 until 2007. Indeed, Total written premium almost doubled growing by about 90% during that period. Total assets more than doubled growing by 240%, Total equity grew by 202% while profits increased by 241%.
Despite the political instability that has prevented passing legislation that allows ICC to grow more rapidly, the Insurance Control Commission, has oriented its action, in the last few years in a number of directions, and was capable of number of achievements:
1/ Concentrating the supervision effort on the financial side with more than 100 big four audit firms inspection mission sub-contracted in order to ensure proper supervision despite the limited size of the Commission’s human resources. This action resulted in a significant clean-up of insurers balance sheet with several dozen of million dollars of recapitalizations.2/ Reorganizing the ICC with the creation of a Market Conduct department, in addition to the existing financial supervision department. The Market Conduct department is responsible for ensuring proper relations between the Insurance companies and the policyholders and encompassing both the intermediaries and the experts.3/ Developing legislation with a major rewriting of the insurance law project, the passage of new decrees on admitted assets and reserves and a total review of the internal bylaws of the ICC.4/ Consolidating the experience of ICC staff.5/ Finally, effective involvement at the international level, in order to improve cooperation, competencies as well as to represent Lebanon. ICC is presently member of the Implementation Committee and the Governance subcommittee of the International Association of Insurance Supervisors (IAIS) and Vice Chairman of the Regional Coordination subcommittee of the IAIS. In addition, Lebanon is Vice-Chairman and founding member of the Arab Forum of Insurance Regulators and Controllers (AFIRC), whose objective is to bring together Arab Insurance commissioners in order to improve both the level of inspectors’ competencies and the cooperation between supervisors.
Head of iCC note
Walid GenadryHead of Insurance Control Commission

Insurance sector | AnnuAl RepoRt 076
Company Comp.Life+UnitL
Life Fire Marine General * Credit Agri- TotalReg. # Unit-Linked Accidents culture by Co.
Arabia 2 1 1 1 1 1 5Cie. Lib. d'Ass. 10 1 1 1 1 4
ALICO 30 1 1 2Union Nationale 49 1 1 1 1 1 5Libano-Suisse 77 1 1 1 1 4
MEARCO 91 1 1 1 3Al-Mashreq 98 1 1 1 1 1 5Commercial 101 1 1 1 1 4
SNA 104 1 1 1 1 4Phenicienne 112 1 1 1 1 4
Nisr 115 1 1 1 3Fidelity 121 1 1 1 1 4Berytus 138 1 1 1 1 4Bankers 139 1 1 1 1 1 5
Overseas 145 1 1 1 3Arope 153 1 1 1 1 1 5AXA 156 1 1 1 1 4
Libano-Arabe 158 1 1 1 1 4UCA 159 1 1 1 1 4
Byblos 160 1 1 1 3North Insurance 166 1 1 1 1 1 5
Essalam 167 1 1 1 3Cumberland 169 1 1 1 1 4
Assurex 171 1 1 1 1 1 5United Assurance 172 1 1 1 3
Compass 175 1 1 1 1 4Medgulf 179 1 1 1 1 1 5Amana 183 1 1 1 1 1 5Security 193 1 1 1 1 4Adonis 194 1 1 1 1 4
Arab life 200 1 1 1 1 4The Capital 201 1 1 1 1 4
Continental trust 204 1 1 1 3UFA 206 1 1 1 1 1 5
Credit Libanais 208 1 1 1 1 4Liberty 213 1 1 1 3Bahria 214 1 1 2Victoire 217 1 1 1 1 4
ATI 220 1 1 1 1 4Leaders 222 1 1 1 3Horizon 223 1 1
Fajr el-khaleej 226 1 1 1 1 4Confidence 227 1 1 1 1 4ALIG Life 230 1 1
AUG 234 1 1 2ALIG 235 1 1 1 3Trust 240 1 1 1 1 4
Bancassurance 241 1 1Sogecap 243 1 1
LCI 245 1 1AIG 246 1 1 1 3
Trust Life 247 1 1Scottish Life 248 1 1
Zurich 249 1 1 1 336 46 45 47 13 0 187
Licenced Insurance Branches by Company
* General Accidents include: Medical, Motor, WC & PA, Civil Liability, Engineering and Miscellaneous
Total by Branch

Insu
ranc
e se
ctor
| An
nuAl
Rep
oRt
077
2001 2002 2003 2004 2005 2006Total Written Premiums * 409,420,000 455,678,000 516,309,000 582,782,000 629,775,000 661,823,000
Total Claims Paid 226,265,000 194,270,000 217,952,000 246,026,000 261,663,000 247,388,000 Total Ceded Premiums 113,266,000 129,326,000 137,417,000 130,877,000 141,831,000 141,708,000
Total Net Profits 19,602,000 25,189,000 25,451,000 6,862,000 33,208,000 51,215,000
Written Premiums (Non Life) 312,131,000 331,631,000 380,424,000 408,466,000 441,919,000 459,283,000 Claims Paid (Non Life) 201,063,000 168,209,000 184,794,000 208,162,000 224,585,000 212,931,000
Ceded Premiums (Non Life) 90,308,000 104,640,000 115,000,000 113,290,000 120,287,000 112,160,000
Written Premiums (Life & U-L) 97,289,000 124,047,000 135,885,000 174,316,000 187,856,000 202,540,000 Claims Paid (Life & U-L) 25,202,000 26,061,000 33,158,000 37,864,000 37,078,000 34,457,000
Ceded Premiums (Life & U-L) 22,958,000 24,686,000 22,417,000 17,587,000 21,544,000 29,548,000
Total Assets 795,534,000 838,887,000 998,605,000 1,246,345,000 1,413,920,000 1,555,184,000
Unearned Premiums Reserves 249,435,000 302,925,000 393,934,000 589,284,000 678,479,000 789,431,000 Outstanding Claims Reserves 59,579,000 65,286,000 72,800,000 87,095,000 93,687,000 124,025,000
Total Technical Reserves 309,014,000 368,211,000 466,734,000 676,379,000 772,166,000 913,456,000
Total Owners' Equity 222,774,000 236,188,000 268,990,000 274,273,000 318,780,000 373,196,000
Total Capitals 158,100,000 161,319,000 184,739,000 193,588,000 214,492,000 225,755,000
Licensed Companies (Life only) 3 5 5 5 5 5Licensed Co's (Non Life only) 18 19 18 18 18 18Licensed Co's (Life+Non Life) 40 35 34 33 32 31All Licensed Co's (any Branch) 61 59 57 56 55 54
Insurance Sector Consolidated Progress Report 2001 to 2007 (in US Dollars)
2007776,255,000 320,136,000 145,744,000 47,220,000
503,330,000 260,312,000 112,712,000
272,925,000 59,824,000 33,032,000
1,901,581,000
1,019,064,000 134,305,000
1,153,369,000
448,742,000
253,739,000
5183154

Insurance sector | AnnuAl RepoRt 078
-
100,000,000
200,000,000
300,000,000
400,000,000
500,000,000
600,000,000
700,000,000
800,000,000
900,000,000
2,001 2,002 2,003 2,004 2,005 2,006 2,007
US
Do
llars
Year
Major Insurance Revenues and Costs Evolution
Total Written Premiums
Total Claims Paid
Total Ceded Premiums
Total Net Profits
-
200,000,000
400,000,000
600,000,000
800,000,000
1,000,000,000
1,200,000,000
1,400,000,000
1,600,000,000
1,800,000,000
2,000,000,000
2,001 2,002 2,003 2,004 2,005 2,006 2,007
US
Do
llars
Year
Assets and Equities Evolution
Total Assets
Total Technical Reserves
Total Owners' Equity
Total Capitals

Insurance sector | AnnuAl RepoRt 07 9
-
50,000,000
100,000,000
150,000,000
200,000,000
250,000,000
300,000,000
350,000,000
2,001 2,002 2,003 2,004 2,005 2,006 2,007
US
Do
llars
Year
Life vs. Non-Life claims Evolution
Total Claims Paid
Claims Paid (Non Life)
Claims Paid (Life & U-L)
-
100,000,000
200,000,000
300,000,000
400,000,000
500,000,000
600,000,000
700,000,000
800,000,000
900,000,000
2,001 2,002 2,003 2,004 2,005 2,006 2,007
US
Do
llars
Year
Life vs. Non-Life Premiums Evolution
Total Written Premiums
Written Premiums (Non Life)
Written Premiums (Life & U-L)

Insurance sector | AnnuAl RepoRt 0710 Insurance sector | AnnuAl RepoRt 07 11
Insurance Sector Consolidated Profit & Loss Statement - 2007 Branch II Branch III
Life Unit-Linked Fire Transportation Motor Compulsory
Premiums and similar revenues 171,821,624 92,444,871 47,530,368 24,537,118 35,867,184 Written premiums 183,580,581 92,502,644 44,980,965 22,697,679 40,439,972
Net Premiums 175,316,037 92,234,543 33,040,023 15,495,170 24,381,026 Cost of policy 2,971,092 47,677 4,049,090 2,261,770 4,942,415 Policy Fees 5,293,452 220,424 7,891,853 4,940,739 11,116,532
Change in unearned premium reserve (8,658,821) - (2,620,125) (813,032) (4,097,401) Returned / cancelled Premiums (2,827,765) (116,434) (281,940) (169,810) (555,308) Others (including accepted premiums) (272,371) 58,661 5,451,467 2,822,281 79,921
Net investment income (Life and Non-Life) 22,747,326 12,375,144 2,256,028 1,470,686 2,162,456 Investment income 24,428,563 14,103,410 2,420,092 1,537,883 2,685,583 Realized gains 51,405 44,355 60,568 22,525 51,793 Realized losses (278,382) (400) (9,561) (3,663) (27,906) Investment expenses (1,454,260) (1,772,220) (215,071) (86,059) (547,014)
Net investment income (Unit-linked) - Unrealized gains/losses - 6,824,333 - - - Claims expenses/ benefits (41,330,289) (21,680,023) (11,317,203) (7,787,866) (13,867,436)
claims paid (38,700,317) (21,123,401) (22,025,549) (5,532,411) (12,507,142) Change in outstanding claims reserve (1,946,724) (556,621) 10,082,986 (2,323,962) (1,344,744) Change in IBNR reserve (638,121) - 237,797 53,820 21,675 Change in Loss adjustment expenses reserve (45,126) - 387,563 14,687 (37,224)
Change in technical reserves (on gross basis) (69,784,140) (69,232,924) (186,480) (24,439) (1,033,611) Change in mathematical reserve (Life & Unit-linked) (45,716,620) (69,232,924) - - - Change in other technical reserve (24,067,520) - (186,480) (24,439) (1,033,611)
Policyholders' dividend (95,824) (569,175) - - - Net reinsurance income (10,036,353) (1,539,142) (13,574,449) (4,413,341) (276,904)
Premiums ceded (31,343,337) (1,688,687) (32,931,345) (12,549,626) (1,032,326) local (3,011,721) - (5,572,868) (1,024,319) (437,804) foreign (28,331,616) (1,688,687) (27,358,477) (11,525,307) (594,522)
Reinsurance benefit paid 13,303,905 10,000 20,437,273 3,735,999 374,347 Reinsurance share of changes in unpaid claims and technical reserves 672,600 35,469 (8,231,352) 1,546,291 276,792 Commission paid by the reinsurer 6,727,231 87,737 7,045,815 2,768,080 87,580 Others 603,248 16,340 105,160 85,914 16,701
General insurance expense (34,772,530) (18,614,225) (17,950,588) (9,191,662) (18,960,280) Acquisition cost (18,293,683) (12,647,208) (8,494,752) (4,343,848) (9,684,165) Administration cost (12,437,376) (5,499,930) (6,586,069) (3,226,889) (7,565,849) Taxes licenses and associated fees (1,669,001) (329,542) (282,527) (143,275) (234,471) Other expenses (2,372,469) (137,545) (2,587,241) (1,477,650) (1,475,794)
Net Income Life, Non-Life, and Unit-linked 38,549,815 8,860 6,757,676 4,590,496 3,891,409 Extraordinary net income 480,001 - 338,866 124,626 1,194,703
Extraordinary income 534,882 - 460,218 191,129 1,261,459 Extraordinary expense (54,881) - (121,352) (66,503) (66,756)
Income tax 2,720,084 1,256,882 976,503 391,946 399,088 Net income after tax 36,309,731 (1,248,022) 6,120,039 4,323,175 4,687,024
102,037,484 23,211,948 47,343,888 24,512,679 34,833,573 (41,330,289) (21,680,023) (11,317,203) (7,787,866) (13,867,436) (18,293,683) (12,647,208) (8,494,752) (4,343,848) (9,684,165) (10,036,353) (1,539,142) (13,574,449) (4,413,341) (276,904) (16,478,846) (5,967,017) (9,455,836) (4,847,814) (9,276,115) 23,227,327 19,199,477 2,594,894 1,595,311 3,357,159
-41% -93% -24% -32% -40%-18% -54% -18% -18% -28%-10% -7% -29% -18% -1%-16% -26% -20% -20% -27%-50% -100% -53% -50% -41%-84% -180% -90% -87% -95%23% 83% 5% 7% 10%
Branch I
Financial Income Ratio: Invest.Results/Earned Gr. Prem's
Calculated Relevant Parameters
Net Accounting Ratio: Loss Ratio + Re- Insurance RatioCombined Ratio: (Loss+Comm.+Re-Ins.+Expense) Ratios
Loss Ratio: Claims Incurred/Earned Gross PremiumsCommission Ratio: Acquisition cost/Earned Gr. PremiumsRe-Insurance Ratio: RE-Ins. Results/Earned Gr. Premiums Expense Ratio: Other General Expenses/Earned Gr. Prem's
Relevant Ratios
Other General ExpensesInvestment Results
Earned Gross PremiumsClaims IncurredCommissions or Acquisition CostRe-Insurance Results
Branch VMotor Non- Compulsory
Health Accidents Civil Laibility Engineering Miscellaneous Credit
103,229,982 184,530,643 36,987,047 9,607,743 7,171,254 25,099,257 1,554,639 740,381,730 111,271,109 186,770,282 35,700,746 9,017,236 5,755,792 23,761,794 1,114,903 757,593,703 72,590,689 145,995,858 28,392,293 6,502,145 4,564,225 17,242,120 807,359 616,561,488 13,171,641 14,832,842 1,962,744 684,561 301,615 2,287,996 137,583 47,651,026 25,508,778 25,941,582 5,345,709 1,830,530 889,952 4,231,678 169,961 93,381,189
(12,691,056) (5,756,009) (565,412) (285,876) (569,764) (273,355) 457,858 (35,872,993) (452,983) (462,318) (123,236) (38,279) (93,753) (91,239) - (5,213,064)
5,102,911 3,978,688 1,974,949 914,662 2,078,979 1,702,057 (18,122) 23,874,083 5,974,189 6,758,166 3,164,112 463,503 329,914 1,091,930 154,337 58,947,791 6,257,964 6,996,723 3,239,294 476,358 361,546 1,203,850 172,149 63,883,413
192,957 321,375 34,027 15,790 18,465 23,752 2,164 839,175 (39,225) (14,076) (812) (2,478) (846) (14,998) (4,579) (396,926)
(437,507) (545,856) (108,397) (26,167) (49,251) (120,674) (15,396) (5,377,872) - - - - - - - 6,824,333
(66,227,848) (137,534,578) (16,784,822) (2,381,701) (2,503,136) (4,224,662) 395,447 (325,244,117) (61,974,175) (137,679,058) (11,317,208) (2,233,053) (1,898,359) (4,903,500) (241,610) (320,135,783) (4,185,279) 31,249 (4,717,207) (328,985) (576,695) 119,932 512,101 (5,233,948)
(34,152) 9,406 (738,951) 188,833 (12,439) 515,367 103,132 (293,635) (34,242) 103,826 (11,456) (8,496) (15,644) 43,539 21,823 419,249
(2,059,873) (141,292) (54,553) (48,690) 47,140 29,492 - (142,489,371) - - - - - - - (114,949,544)
(2,059,873) (141,292) (54,553) (48,690) 47,140 29,492 - (27,539,827) - - - - - - - (664,999)
(3,295,908) (1,693,510) 9,431 (2,513,512) (2,308,760) (8,655,260) (668,575) (48,966,284) (5,553,138) (32,956,851) (6,160,363) (3,165,479) (5,225,065) (12,802,624) (335,425) (145,744,265) (2,264,399) (2,636,874) (454,774) (872,066) (945,871) (1,433,502) - (18,654,196) (3,288,739) (30,319,978) (5,705,589) (2,293,413) (4,279,194) (11,369,122) (335,425) (127,090,069) 1,101,902 25,292,526 3,661,735 160,981 1,194,284 2,645,639 191,315 72,109,906
439,410 2,345,469 1,131,441 183,599 710,005 (795,144) (720,777) (2,406,197) 599,517 3,586,773 1,362,720 305,139 1,009,317 2,062,092 196,312 25,838,312 116,401 38,573 13,897 2,248 2,699 234,777 - 1,235,960
(52,302,205) (48,132,782) (18,662,020) (4,086,557) (2,225,288) (9,571,168) (970,921) (235,440,226) (23,984,348) (17,555,838) (9,783,520) (1,740,347) (764,484) (4,790,831) (154,259) (112,237,283) (20,791,345) (20,872,447) (7,807,086) (1,736,555) (770,946) (3,847,943) (752,511) (91,894,945)
(651,235) (844,401) (189,467) (67,149) (40,026) (176,666) (50,271) (4,678,030) (6,875,278) (8,860,096) (881,946) (542,506) (649,832) (755,728) (13,881) (26,629,967)
(14,681,664) 3,786,647 4,659,194 1,040,786 511,124 3,769,587 464,927 53,348,857 1,623,415 210,308 204,340 165,549 26,826 102,020 79,088 4,549,741 2,038,667 885,204 274,352 211,123 55,521 151,478 78,503 6,142,535 (415,252) (674,897) (70,012) (45,573) (28,695) (49,458) 585 (1,592,794)
1,411,529 2,322,717 501,405 137,609 99,312 437,948 22,918 10,677,940 (14,469,778) 1,674,238 4,362,129 1,068,727 438,638 3,433,660 521,097 47,220,658
101,170,108 184,389,351 36,932,494 9,559,053 7,218,394 25,128,749 1,554,639 597,892,359 (66,227,848) (137,534,578) (16,784,822) (2,381,701) (2,503,136) (4,224,662) 395,447 (325,244,117) (23,984,348) (17,555,838) (9,783,520) (1,740,347) (764,484) (4,790,831) (154,259) (112,237,283) (3,295,908) (1,693,510) 9,431 (2,513,512) (2,308,760) (8,655,260) (668,575) (48,966,284)
(28,317,857) (30,576,944) (8,878,500) (2,346,210) (1,460,804) (4,780,337) (816,663) (123,202,943) 7,597,604 6,968,473 3,368,451 629,053 356,740 1,193,950 233,425 70,321,865
-65% -75% -45% -25% -35% -17% 25% -54%-24% -10% -26% -18% -11% -19% -10% -19%-3% -1% 0% -26% -32% -34% -43% -8%-28% -17% -24% -25% -20% -19% -53% -21%-69% -76% -45% -51% -67% -51% -18% -63%-120% -102% -96% -94% -97% -89% -80% -102%
8% 4% 9% 7% 5% 5% 15% 12%
TOTALGeneral Accidents (Branch IV)
(in US. Dollars)

Insurance sector | AnnuAl RepoRt 0712
Insurance Sector Consolidated Assets2007 2006
Unpaid capital 2,487,562 -
Intangible assets 1,395,283 2,059,691
Investments 1,134,097,881 911,442,865
Land and real estate 150,370,111 134,283,770
Investment in subsidiaries and associates 63,126,341 47,536,423
Loans 25,235,025 27,326,602
Debt securities and other fixed income securities 228,028,828 197,970,272
Equity and other variable income shares 131,946,657 61,401,292
Funds held under reinsurance treaties 472,576 483,525
Cash and short-term investments 526,032,587 433,529,208
Short-term investments 298,742,547 236,229,124
Cash 142,154,134 106,661,523
Cash deposit under ICC (Guarantees) 85,135,907 90,638,561
Accrued investment income 8,885,757 8,911,773
Unit-linked contracts investments 309,857,524 230,089,033
Real estate investments (Unit-Linked) 1,048,199 909,542
Equity and other variable income shares (Unit-Linked) 292,821,373 218,923,336
Bonds and other fixed income securities (Unit-Linked) 15,987,953 10,256,155
Reinsurance share in technical reserves (Life) 68,101,724 67,947,135
Reinsurance share in technical reserves (Non-Life) 79,105,158 79,591,851
Receivable under direct business: 132,038,094 126,564,017
Past due premiums 16,603,845 22,577,018
Other amounts receivable under direct business 54,163,091 48,948,824
Amounts due from agents 61,271,158 55,038,175
Receivable under reinsurance contrats 26,507,396 24,303,615
Amounts recoverabe from reinsurers 19,984,534 17,246,233
Commissions and expense allowances due 1,508,564 1,558,472
Refunds due - -
Other amounts receivable under reinsurance contracts 5,014,299 5,498,910
Other assets 34,747,964 33,008,676
Operating fixed assets 29,522,994 27,956,006
Other assets 5,224,970 5,052,670
Other receivables 68,770,673 72,783,364
Salaries 886,581 482,774
3,354 -
Link account of subsidiaries 26,399,648 33,903,650
Other amounts receivables 39,055,663 35,776,193
Shareholder's Account 2,425,428 2,620,748
Adjustment items 44,471,408 35,563,214
Deferred Acquisiton Costs 40,236,810 30,569,896
Other Adjustment items 438,815 989,387
Earned but unbilled premiums 1,343,496 1,544,663
Prepaid expenses 2,452,288 2,459,267
TOTAL ASSETS 1,901,580,667 1,583,737,798
In US Dollars
Income tax recoverable

Insurance sector | AnnuAl RepoRt 07 13
Insurance Sector Consolidated Liabilities 2007 2006
Shareholders' equity 448,741,846 364,659,022 Paid up Capital 253,738,609 218,070,284 Reserves (Legal and General) 60,760,293 58,294,583 Balance carried forward 45,047,809 23,406,938 Profit and loss (Current year result) 47,220,658 50,006,325 Other reserves 41,974,481 14,880,891
Debt and other fixed income securities valuation reserve 27,419,151 799,045 Equity and other variable income shares valuation reserves (1,681,641) 3,403,592 Fixed assets revaluation reserves 11,732,082 5,272,533 Other reserves 4,504,889 5,405,722
Low priority debts 2,350,652 6,704,376 Subordinated debt 16,350 2,016,770 Shareholder's Account 2,334,302 4,687,606
Life Technical reserves (on gross basis) 499,176,793 418,914,011 Mathematical reserve (Life) 419,000,576 373,283,955 Outstanding claims reserve (Life) 19,299,198 16,198,948 IBNR (Incurred But Not Reported) reserve (Life) 1,801,972 1,201,523 Loss adjustment expenses reserve (Life) 203,464 162,117 Policyholders' dividend reserve (Life) 1,103,260 438,261 Other technical reserve (Life) 57,768,323 30,182,981 Additional technical reserve (Unit-linked) - -
Non-Life Technical reserves (on gross basis) 344,977,889 315,420,458 Unearned premium reserve (Non-Life) 227,034,952 191,161,958 Outstanding claims reserve (Non-Life) 101,104,221 99,527,144 IBNR (Incurred But Not Reported) reserve (Non-Life) 9,745,790 10,052,604 Loss adjustment expenses reserve (Non-Life) 2,220,026 2,680,622 Policyholders' dividend reserve (Non-Life) - - Other technical reserve (Non-Life) 1,654,535 2,822,674 Premium Deficiency Reserve 3,218,366 2,095,743
Unit-Linked technical reserve 309,214,102 239,424,557 Provision for risks and charges* 22,507,667 19,906,085 Debt for funds held under reinsurance treaties 14,064,950 12,004,447 Liabilities under direct & Indirect business 12,944,785 9,967,469
Liabilities under Direct business 8,774,606 6,591,923 Liabilities under Indirect Business 4,170,179 3,375,546
Liabilities under reinsurance contracts 51,420,277 46,164,824 Debts 48,274,144 41,635,187
Borrowed money 6,749,083 3,740,381 Bank debts 33,436,035 31,437,840 Other debts 8,089,027 6,456,966
Other liabilities 137,080,226 110,405,040 Salaries 58,943 109,939 Tax due (state, social security, public collectivities) 37,520,820 33,740,708 Link accounts of subsidiaries 41,550,859 35,602,582 Other creditors 57,949,605 40,951,811
Adjustment items 10,827,800 8,784,762 TOTAL LIABILITIES 1,901,580,667 1,583,737,798
In US Dollars

Insurance sector | AnnuAl RepoRt 0714
Unpaid capital 0%
Intangible assets 0%
Investments 60%
Unit-linked contracts investments
16%
Reinsurance share in technical reserves (Life)
4%
Reinsurance share in technical reserves (Non-
Life) 4%
Receivable under direct business:
7%
Receivable under reinsurance contrats
1%
Other assets 2%
Other receivables 4%
Adjustment items 2%
Insurance Sector Assets Structure (2007)
Land and real estate 10% Investment in subsidiaries and
associates 4%
Loans 2%
Debt securities and other fixed income securities
16%
Equity and other variable income shares
9%
Funds held under reinsurance treaties
0%
Cash and short-term investments
37%
Accrued investment income 1%
Real estate investments (Unit-Linked)
0%
Equity and other variable income shares (Unit-Linked)
20%
Bonds and other fixed income securities (Unit-Linked)
1%
Insurance Sector Investment Structure (2007)
Shareholders' equity 24%
Low priority debts 0%
Life Technical reserves (on gross
basis) 25% Non-Life
Technical reserves (on gross basis)
18%
Unit-Linked technical reserve
16%
Provision for risks and charges*
1%
Debt for funds held under reinsurance
treaties 1%
Liabilities under direct & Indirect business
1%
Liabilities under reinsurance contracts
3% Debts
3%
Other liabilities 7%
Adjustment items 1%
Liabilities Structure (2007)

Insurance sector | AnnuAl RepoRt 07 15
Solvency %50%94%45%77%-2%58%
Company Category Nbr. of Co's Tot. Equity $ Tot. Prem's $Above 20M Equity 6 187,219,507 374,905,74610M to 20M Equity 8 120,104,631 127,258,7025M to 10M Equity 11 77,894,728 173,762,2631.5M to 5M Equity 21 63,919,375 82,648,213Under 1.5M Equity 8 -396,395 17,679,799
Total 54 448,741,846 776,254,723
Equity, Premiums and Solvency by Company Category
0
5
10
15
20
25
Above 20M Equity
10M to 20M Equity
5M to 10M Equity
1.5M to 5M Equity
Under 1.5M Equity
Nu
mb
er o
f C
om
pan
ies
Concentration of Companies per Equity Category
-50,000,000
0
50,000,000
100,000,000
150,000,000
200,000,000
250,000,000
300,000,000
350,000,000
400,000,000
Above 20M
Equity
10M to 20M
Equity
5M to 10M Equity
1.5M to 5M Equity
Under 1.5M Equity
US
Do
llars
Consolidated Equities and Premiums per Category
Tot. Equity $
Tot. Prem's $

Insurance sector | AnnuAl RepoRt 0716
Adm. Cost $/Employee
30,427 39,091 30,005 39,115
** 42,232** 33,497
** Some Company declared values were found illogical and were not accounted for in the Average.
Written Administration Number of Premiums Company Group Premiums Expenses US$* Employees $/Employee
1st 10 Largest Employers 443,932,740 40,619,967 1,335 332,534 2nd 10 Largest Employers 165,506,442 23,259,147 595 278,162 3rd 10 Largest Employers 67,887,153 10,120,149 337 201,276 4th 10 Largest Employers 76,569,489 7,471,055 191 400,887 Remaining 14 Companies 22,358,899 10,424,628 102 219,205
Total 776,254,723 91,894,945 2,560 303,225
* Admnistrative Expenses include Payroll, Rents, CNSS, Telecom, EDL…...
Premiums & Administrative Expenses per Employee by Company Group
Top 10 Employers
1,335 empl. 53%
2nd 10 Largest Employers
595 empl. 23%
3rd 10 Largest Employers
337 empl. 13%
4th 10 Largest Employers
191 empl. 7%
Rem.14 Co's, 102 empl. 4%
Work Force Distribution
1st 10 Largest Employers
44%
2nd 10 Largest Employers
25%
3rd 10 Largest Employers
11%
4th 10 Largest Employers
8%
Remaining 14 Companies
12%
Administrative Expenses Distribution

Insurance sector | AnnuAl RepoRt 07 17
LEBANESE INSURANCE SECTOR - 2007 RATIO ANALYSIS & AVERAGES
1) Change in Gross Writings*: 2006 2007 Change % Life+ Unit linked $ 182,067,000 $ 272,925,000 + 49.9%** Non-Life $ 479,756,000 $ 503,330,000 + 4.9% Total $ 661,823,000 $ 776,255,000 + 17.3% * Gross Writings or Written Premiums are Net Premiums + Charges + Fees + Accepted Re-Insurance Premiums – Net of Cancellations and Discounts. ** The sharp increase in Life premiums is due to the fact that large amounts of Unit Linked writings that used to be treated as ‘payables’ or Non-Life premiums in previous years have newly been reported as Life Unit Linked premiums in 2007. 2) Change in Equity 2007 / 2006: $ 448,742,000 - $ 373,196,000 = + 20.2%
$ 373,196,000 3) Return on Assets: Net Income = $ 47,220,000 = 2.5% Assets $ 1,901,581,000 4) Return on Equity: Net Income = $ 47,220,000 = 10.5% Equity $ 448,742,000 5) Solvency: Equity = $448,742,000 = 57.7% (Legal Minimum: 10%) Gross Premiums $776,255,000 6) Technical Reserves / Equity = $ 1,153,369,000 = 257% (Industry normal: < 350%) $ 448,742,000 7) Claims Adequacy: Claims Outstanding = $120,403,000 = 26.8% (Ind.normal < 20%) Equity $448,742,000 8) Net Re-Insurance Cost = (Ceded Premiums) + Re-Ins share of Claims + Re-Ins share in change of reserves + Re-Ins Commissions = ($ 48,966,000) i.e. (6.3%) of Premiums. 9) Industry Averages: Av. Company Premiums Av. Company Claims - Total Portfolio $776,225,000 = $14,375,000 $320,136,000 = $5,928,000 54 Co's 54 Co's - Life Portfolio $272,925,000 = $7,798,000 $59,824,000 = $1,709,000 35 Co's 35 Co's
- Non-Life Portfolio $503,300,000 = $10,271,000 $260,312,000 = $5,312,000 49 Co's 49 Co's Av. Company Assets Av. Company Reserves Av. Company Equity $1,901,581,000 = $35,214,462 $1,153,369,000 = $21,359,000 $448,742,000 = $8,310,000 54 Co's 54 Co's 54 Co's 10) Changes since 2001: 2001 2007 % Change - Number of Active Companies 61 54 - 11% - Gross Written Premiums $409,420,000 $776,255,000 + 90% - Average Company Premiums $6,712,000 $14,375,000 + 114% - Claims Paid $226,265,000 $320,136,000 + 41% - Average Company Claims $3,709,000 $5,928,000 + 60% - Total Assets $795,534,000 $1,901,581,000 + 139% - Average Company Assets $13,042,000 $35,214,000 + 170% - Technical Reserves $309,014,000 $1,153,369,000 + 273% - Average Co. Tech. Reserves $5,066,000 $21,359,000 + 322%

Insurance sector | AnnuAl RepoRt 0718
Branch
AccountLife+Unit -
LinkedNon-Life
1 Gross premiums (Incl. accepted)* 272,925,317 503,329,406 Share of Portfolio 35% 65%
33,032,024 112,712,241 Re-insured Ratio = 2/1 -12% -22%
59,823,718 260,312,065 Claims / Premiums = 3/1 -22% -52%4 Reinsurance benefit paid 13,313,905 58,796,001 Re-Insurance share of claims = 4/3 22% 23%5 Change in Technical Reserves ** 150,819,410 35,722,484
30,940,891 81,296,392 Insurance Commission Rate = 6/1 -11% -16%7 Re-Insurance Commission Income 7,434,555 19,639,717 Re-Insurance Commission Rate = 7/2 23% 17%
8 Gross Insurance Profits 19,057,735 91,721,942 Gross Insurance Profit Margin = 8/1 7% 18% 9 Net Investment Income 42,426,804 27,895,061 Investment Income/Premiums = 9/1 16% 6% 10 Fixed Expenses and Overheads 22,445,863 100,757,079 Fixed Exp's & Ovrhd's/Premiums = 10/1 -8% -20%11 Income tax 3,976,966 6,700,974
12 Net Income After Tax 35,061,709 12,158,949 Net Profit Margin = 12/1 13% 2%*Gross Premiums are net of Cancellations and include Accepted Re-Insurance Premiums
3 Claims paid
6 Acquisition cost (Brokerage Commissions)
** Change in Technicai Reserves is net of Re-Insurance share.
Life vs. Non-Life Condensed P&L + Ratios (in US Dollars)
2 Ceded Premiums
-
100,000,000
200,000,000
300,000,000
400,000,000
500,000,000
600,000,000
Life+Unit -Linked Non-Life
US
. D
ollars
Life vs. Non-Life Revenues
Gross Premiums
Re-Ins. Share of Claims
Re-Ins. Commissions.
Investments Profits
Total
776,254,723 100%145,744,265 -19%
320,135,783 -41%72,109,906 23%
186,541,894 112,237,283 -14%27,074,273 19%
110,779,676 14%
70,321,865 9%
123,202,943 -16%10,677,940
47,220,658 6%
Life vs. Non-Life Condensed P&L + Ratios (in US Dollars)

Insurance sector | AnnuAl RepoRt 07 19
-
50,000,000
100,000,000
150,000,000
200,000,000
250,000,000
300,000,000
Life+Unit -Linked Non-Life
US
Do
llars
Life vs. Non-Life Costs
Ceded Premiums
Claims Paid
Change in Tech. Reserves
Broker's Commissions
Fixed Overhead's
-
20,000,000
40,000,000
60,000,000
80,000,000
100,000,000
120,000,000
Life+Unit -Linked Non-Life Total
US
Do
llars
Life & Non-Life Profits
Gross Insurance Profits
Net Oprating Profits

Insurance sector | AnnuAl RepoRt 0720
Branch
Account 1 Gross premiums (Incl. accepted) 180,480,446 92,444,871 50,150,493 25,350,150 Share of Portfolio 23% 12% 6% 3% 2 Ceded Premiums (31,343,337) (1,688,687) (32,931,345) (12,549,626) Re-insured Ratio = 2/1 -17% -2% -66% -50%
(38,700,317) (21,123,401) (22,025,549) (5,532,411) Claims / Premiums = 3/1 -21% -23% -44% -22%
13,303,905 10,000 20,437,273 3,735,999 Re-Insurance share of claims = 4/3 34% 0% 93% 68%5 Change in Technical Reserves * (80,496,158) (70,323,252) (329,611) (1,546,634)
(18,293,683) (12,647,208) (8,494,752) (4,343,848) Insurance Commission Rate = 6/1 -10% -14% -17% -17%7 Re-Insurance Commission Income 7,330,479 104,076 7,150,975 2,853,994 Re-Insurance Commission Rate = 7/2 23% 6% 22% 23%
8 Gross Insurance Profits 32,281,335 (13,223,600) 13,957,484 7,967,623 Gross Insurance Margin = 8/1 18% -14% 28% 31% 9 Net Investment Income 23,227,327 19,199,477 2,594,894 1,595,311 Investment Income/Premiums = 9/1 13% 21% 5% 6% 10 Fixed Expenses and Overheads (16,478,846) (5,967,017) (9,455,836) (4,847,814) Fixed Exp's & Ovrhd's/Premiums = 10/1 -9% -6% -19% -19%11 Income tax (2,720,084) (1,256,882) (976,503) (391,946)
12 Net Income After Tax 36,309,731 (1,248,022) 6,120,039 4,323,175 Net Profit Margin = 12/1 20% -1% 12% 17%
** Number of Licenced Brokers: Agents-974, Individual Brokers-112, Corporate Brokers-245.
Consolidated and Condensed
* Change in Technicai Reserves is net of Re-Insurance share.
3 Claims paid
4 Reinsurance benefit paid
6 Acquisition cost (Brokerage Commissions)**
FireUnit-LinkedLife Transportation
Life, 180,480,446
(23%)
Unit-Linked, 92,444,871 , (12%)
Fire, 50,150,493 , (6%)
Transportation, 25,350,150 , (3%) Motor
Compulsory, 39,964,585 , (5%)
Motor Non- Compulsory,
115,921,038 , (15%)
Health, 190,286,652 ,
(26%)
Accidents, 37,552,458 , (5%)
Miscellaneous, 25,372,611 , (3%)
Others (Eng. Credit, PL) , 18,731,418 , (2%)
Gross Premiums (US Dollars) & (%) Share by Branch

Insurance sector | AnnuAl RepoRt 07 21
39,964,585 115,921,038 190,286,652 37,552,458 25,372,611 18,731,418 776,254,723 5% 15% 25% 5% 3% 2% 100%
(1,032,326) (5,553,138) (32,956,851) (6,160,363) (12,802,624) (8,725,969) (145,744,265) -3% -5% -17% -16% -50% -47% -19%
(12,507,142) (61,974,175) (137,679,058) (11,317,208) (4,903,500) (4,373,021) (320,135,783) -31% -53% -72% -30% -19% -23% -41%
374,347 1,101,902 25,292,526 3,661,735 2,645,639 1,546,581 72,109,906 3% 2% 18% 32% 54% 35% 23%
(6,214,514) (18,565,193) (3,407,351) (4,956,138) (360,170) (342,874) (186,541,894) (9,684,165) (23,984,348) (17,555,838) (9,783,520) (4,790,831) (2,659,090) (112,237,283) -24% -21% -9% -26% -19% -14% -14%
104,282 715,918 3,625,347 1,376,617 2,296,869 1,515,715 27,074,273 10% 13% 11% 22% 18% 17% 19%
11,005,067 7,662,004 27,605,426 10,373,582 7,457,995 5,692,760 110,779,676 28% 7% 15% 28% 29% 30% 14%3,357,159 7,597,604 6,968,473 3,368,451 1,193,950 1,219,217 70,321,865 8% 7% 4% 9% 5% 7% 9%
(9,276,115) (28,317,857) (30,576,944) (8,878,500) (4,780,337) (4,623,676) (123,202,943) -23% -24% -16% -24% -19% -25% -16%(399,088) (1,411,529) (2,322,717) (501,405) (437,948) (259,839) (10,677,940) 4,687,024 (14,469,778) 1,674,238 4,362,129 3,433,660 2,028,462 47,220,658
12% -12% 1% 12% 14% 11% 6%
Profit & Loss Report + Ratios (in US Dollars)
TOTALOthers (Eng. Credit, PL)
Accidents MiscellaneousMotor Compulsory
Motor Non- Compulsory
Health
Life (38,700,317)
12%
Unit-Linked (21,123,401)
7% Fire
(22,025,549) 7%
Transportation (5,532,411)
2% Motor Compulsory (12,507,142)
4%
Motor Non- Compulsory (61,974,175)
19%
Health (137,679,058)
42%
Accidents (11,317,208)
4%
Miscellaneous (4,903,500)
3%
Others (Eng. Credit, PL) (4,373,021)
1%
Claims paid (US Dollars) & (%) Share by Branch

Insurance sector | AnnuAl RepoRt 0722
Life; (18,293,683)
Unit-Linked; (12,647,208)
Fire; (8,494,752)
Transportation; (4,343,848)
Motor
Compulsory; (9,684,165)
Motor Non- Compulsory; (23,984,348)
Health; (17,555,838)
Accidents; (9,783,520)
Miscellaneous; (4,790,831)
Others (Eng. Credit, PL) ; (2,659,090)
Brokerage Commissions Paid by Branch (in US Dollars) & (%) Share by Branch (Number of licenced Brokers: Agents 974, Indiv. Brokers 112, Corporate Brokers 245)
Life; (31,343,337),
Unit-Linked; (1,688,687),
Fire; (32,931,345),
Transportation; (12,549,626), Motor Compulsory; (1,032,326),
Motor Non- Compulsory; (5,553,138),
Health; (32,956,851),
Accidents; (6,160,363),
Miscellaneous; (12,802,624),
Others (Eng. Credit, PL) ; (8,725,969),
Ceded Premiums (US Dollars) & (%) Share by Branch
9%
4%
22%
4%
1%
9%
22%
1%
22%
6%

Insu
ranc
e se
ctor
| An
nuAl
Rep
oRt
0723
(40,000,000)
(30,000,000)
(20,000,000)
(10,000,000)
-
10,000,000
20,000,000
30,000,000
40,000,000
US
Do
llars
Branches
Insurance Profits, Investment Profits, General Expenses and Net Profits by Branch
Insurance Profits
Investment Profits
General Expenses
Net Profits

Insurance sector | AnnuAl RepoRt 0724
Companies Premiums Share of Claims Share ofRanks* US $ Premiums US $ Claims
Top 10 Co's 245,821,401 90% 52,615,466 88%
2nd 10 Co's 20,698,561 8% 5,477,037 9%
Rem. 15 Co's 6,405,354 2% 1,731,216 3%
All 35 Co's 272,925,317 100% 59,823,719 100%
LIFE & UNIT-LINKED Portfolio Distribution.
* Companies are ranked according to Premiums
-
50,000,000
100,000,000
150,000,000
200,000,000
250,000,000
300,000,000
Top 10 Co's 2nd 10 Co's Rem. 15 Co's All 35 Co's
Life + Unit-Linked Portfolio Distribution
Premiums US $
Claims US $
Top 10 Co's 90%
2nd 10 Co's 8%
Rem. 15 Co's 2%
Life + Unit-Linked Premiums Distribution
Top 10 Co's 88%
2nd 10 Co's 9%
Rem. 15 Co's 3%
Life + Unit-Linked Claims Distribution

Insurance sector | AnnuAl RepoRt 07 25
Share of Share ofCompanies-Ranks * Premiums ($) Claims ($) Premiums ClaimsTop 10 Companies 309,596,846 176,919,351 61.51% 67.96%
2nd 10 Co's 115,584,139 53,964,387 22.96% 20.73%3rd 10 Co's 53,730,357 19,930,334 10.67% 7.66%
Rem. 19 Co's 24,418,063 9,497,992 4.85% 3.65%All 49 Companies 503,329,405 260,312,064 100.00% 100.00%
NON-LIFE Portfolio Distribution
* Companies are ranked according to Premiums
-
100,000,000
200,000,000
300,000,000
400,000,000
500,000,000
600,000,000
Top 10 Companies 2nd 10 Co's 3rd 10 Co's Rem. 19 Co's All 49 Companies
Non-Life Portfolio Distribution
Premiums ($)
Claims ($)
Top 10 Companies 61%
2nd 10 Co's 23%
3rd 10 Co's 11%
Rem. 19 Co's
5%
Non-Life Premiums Market Shares
Top 10 Companies 68%
2nd 10 Co's 21%
3rd 10 Co's 8%
Rem. 19 Co's 3%
Non-Life Claims Market Shares
Insurance sector | AnnuAl RepoRt 0726
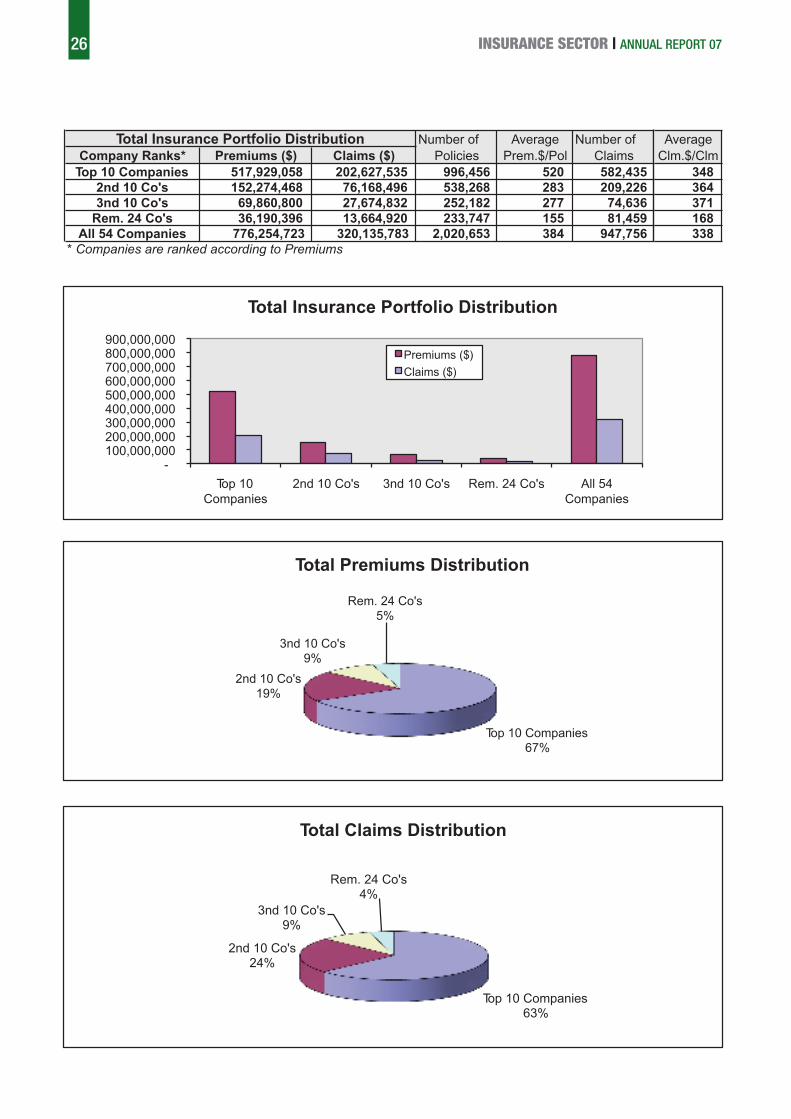
Number of Average Number ofCompany Ranks* Premiums ($) Claims ($) Policies Prem.$/Pol Claims
Top 10 Companies 517,929,058 202,627,535 996,456 520 582,435 2nd 10 Co's 152,274,468 76,168,496 538,268 283 209,226 3nd 10 Co's 69,860,800 27,674,832 252,182 277 74,636
Rem. 24 Co's 36,190,396 13,664,920 233,747 155 81,459 All 54 Companies 776,254,723 320,135,783 2,020,653 384 947,756
Total Insurance Portfolio Distribution
* Companies are ranked according to Premiums
Top 10 Companies 67%
2nd 10 Co's 19%
3nd 10 Co's 9%
Rem. 24 Co's 5%
Total Premiums Distribution
Top 10 Companies 63%
2nd 10 Co's 24%
3nd 10 Co's 9%
Rem. 24 Co's 4%
Total Claims Distribution
- 100,000,000 200,000,000 300,000,000 400,000,000 500,000,000 600,000,000 700,000,000 800,000,000 900,000,000
Top 10 Companies
2nd 10 Co's 3nd 10 Co's Rem. 24 Co's All 54 Companies
Total Insurance Portfolio Distribution
Premiums ($)
Claims ($)
AverageClm.$/Clm 348 364 371 168 338

Insurance sector | AnnuAl RepoRt 07 27
Company Ranks* Premiums Claims Number of Average Number of AverageUS $ US $ Policies Prem.$/Pol Claims
Claim$/Clm
Top 10 Companies 154,844,028 31,492,064 169,439 914 16,029 1,965 2nd 10 Co's 19,231,064 5,477,037 26,219 733 807 6,787
Rem. 15 Co's 6,405,354 1,731,216 30,909 207 3,298 525 Total 180,480,446 38,700,317 226,567 797 20,134 1,922
Life Premiums & Claims Distribution
* Companies are ranked according to Premiums
Top 10 Companies
86%
2nd 10 Co's 11%
Rem. 15 Co's 3%
Life Premiums Distribution
Top 10 Companies
81%
2nd 10 Co's 14%
Rem. 15 Co's 5%
Life Claims Distribution

Insurance sector | AnnuAl RepoRt 0728
Company Premiums Claims Number of Average Number ofRanks* US $ US $ Policies Prem.$/Pol. Claims
Top 3 Companies 89,291,277 21,088,150 49,331 1,810 1,716 Rem. 4 Co's 3,153,595 35,252 4,466 706 2
Total 92,444,871 21,123,401 53,797 1,718 1,718
Unit-Linked premiums & claims Distribution
NB: Insurance Companies Licenced to Underwrite Unit-Linked Risks: 36 Companies.* Companies are ranked according to Premiums
Top 3 Companies
97%
Rem. 4 Co's 3%
Unit-Linked Premiums Distribution
Top 3 Companies
100%
Rem. 4 Co's 0%
Unit-Linked Claims Distribution
AverageClaim$/Clm.
12,289 17,626 12,295

Insurance sector | AnnuAl RepoRt 07 29
Company Premiums US$ Claims Nbr.of Av.Prem.
$/Pol. Nbr. of Av. Claim Ranks US$ US$ Policies $/Pol Claims $/Claim
Top 10 Companies 32,177,766 18,170,756 133,780 241 1,267 24,641 2nd 10 Co's 12,604,843 3,219,536 22,851 552 350 19,729
Rem. 23 Co's 5,367,884 635,257 9,102 590 218 5,728 Total 50,150,493 22,025,549 165,733 303 1,835 12,003
Fire Premiums & Claims Distribution
* Companies are ranked according to Premiums
Top 10 Companies
64%
2nd 10 Co's 25%
Rem. 23 Co's 11%
Fire Premiums Distribution
Top 10 Companies
82%
2nd 10 Co's 15%
Rem. 23 Co's 3%
Fire Claims Distribution

Insurance sector | AnnuAl RepoRt 0730
Premiums $ Claims $Nbr.of Pol's
Prem. $/Pol.
Nbr of Clms
Average $/Claim
Top 10 Companies 15,890,872 3,312,360 30,899 514 1,926 1,720 2nd 10 Co's 6,268,942 1,373,087 18,944 331 876 1,567
Rem. 24 Co's 3,190,335 846,965 10,000 319 263 3,220 Total 25,350,150 5,532,411 59,843 424 3,065 1,805
Transportation Premiums & Claims Distribution
* Companies are ranked according to Premiums
Top 10 Companies 63%
2nd 10 Co's 25%
Rem. 24 Co's 12%
Transportation Premiums Distribution
Top 10
Companies
60%
2nd 10 Co's
25%
Rem. 24 Co's
15%
Transportation Claims Distribution
CompaniesRanks*

Insurance sector | AnnuAl RepoRt 07 31
Premiums US$ Claims US$
Nbr.of Pol's
Premium $/Pol.
Nbr of Clms
Average $/Claim
Top 10 Companies 17,168,172 3,054,735 333,300 51.51 2,470 1,237 2nd 10 Co's 7,365,037 1,834,186 137,773 53.46 27,155 68 3rd 10 Co's 4,324,961 935,417 95,202 45.43 715 1,308
Rem. 13 Co's 1,663,933 710,148 38,209 43.55 196 3,623 Total 30,522,104 6,534,487 604,484 50.49 30,536 *650
* Some Company declared figures were found illogical and not accounted for in the average* Companies are ranked according to Premiums
Motor Compulsory Premiums & Claims Distribution.
Top 10 Companies
56% 2nd 10 Co's 24%
3rd 10 Co's 14%
Rem. 13 Co's 6%
Motor Compulsory Premiums Distribution
Top 10 Companies
47%
2nd 10 Co's 28%
3rd 10 Co's 14%
Rem. 13 Co's 11%
Motor Compulsory Claims Distribution
CompaniesRanks*

Insurance sector | AnnuAl RepoRt 0732
Top 10 Companies 61%
2nd 10 Co's 22%
3rd 10 Co's 12%
Rem. 15 Co's 5%
Motor Non-Compulsory Claims Distribution
Premiums $ Claims $ Nbr.of Pol'sPrm. $/Pol Nbr of ClmsTop 10 Companies 75,135,153 41,519,943 256,337 293 105,986
2nd 10 Co's 29,263,830 15,275,616 196,042 149 47,118 3rd 10 Co's 15,006,827 7,914,706 88,805 169 22,975
Rem. 15 Co's 5,957,709 3,249,914 54,057 110 28,637 Total 125,363,519 67,960,179 595,241 211 204,716
Motor Non-Compulsory Premiums & Claims Distribution
* Companies are ranked according to Premiums
Top 10 Companies
60%
2nd 10 Co's 23%
3rd 10 Co's 12%
Rem. 15 Co's 5%
Motor Non- Compulsory Premiums Distribution
Av. $/Clm392324344113332
Company Ranks*

Insurance sector | AnnuAl RepoRt 07 33
Company Premiums Claims Number of Average Number ofRanks* US $ US $ Policies Prem.$/Pol Claims
Top 10 Companies 154,531,268 113,221,787 73,726 2,096 520,648 2nd 10 Co's 25,859,545 17,698,892 23,258 1,112 55,209
Rem. 23 Co's 9,895,840 6,758,379 10,005 989 25,352 Total 190,286,652 137,679,058 106,989 1,779 601,209
Medical Premiums & Claims Distribution
* Companies are ranked according to Premiums
Top 10 Companies 81%
2nd 10 Co's 14%
Rem. 23 Co's 5%
Medical Premiums Distribution
Top 10 Companies
82%
2nd 10 Co's 13%
Rem. 23 Co's 5%
Medical Claims Distribution
Average$/Clm.
217 321 267 229

Insurance sector | AnnuAl RepoRt 0734
Top 10
Companies
64%
2nd 10 Co's
23%
Rem 36 Co's
13%
Accidents Claims Distribution
Company Ranks* Premiums $ Claims $ Nbr.of Pol'sPrem. $/Pol.
Nbr of Clms Av $/Claim
Top 10 Companies 27,850,413 7,222,140 133,300 209 24,691 293 2nd 10 Co's 6,031,753 2,575,784 7,300 826 11,648 221 Rem 36 Co's 3,670,292 1,519,285 7,853 467 8,129 187
Total 37,552,458 11,317,208 148,453 253 44,468 255
Accidents Premiums & Claims Distribution
* Companies are ranked according to Premiums
Top 10 Companies 74%
2nd 10 Co's 16%
Rem 36 Co's 10%
Accidents Premium Distribution
Insurance sector | AnnuAl RepoRt 07 35
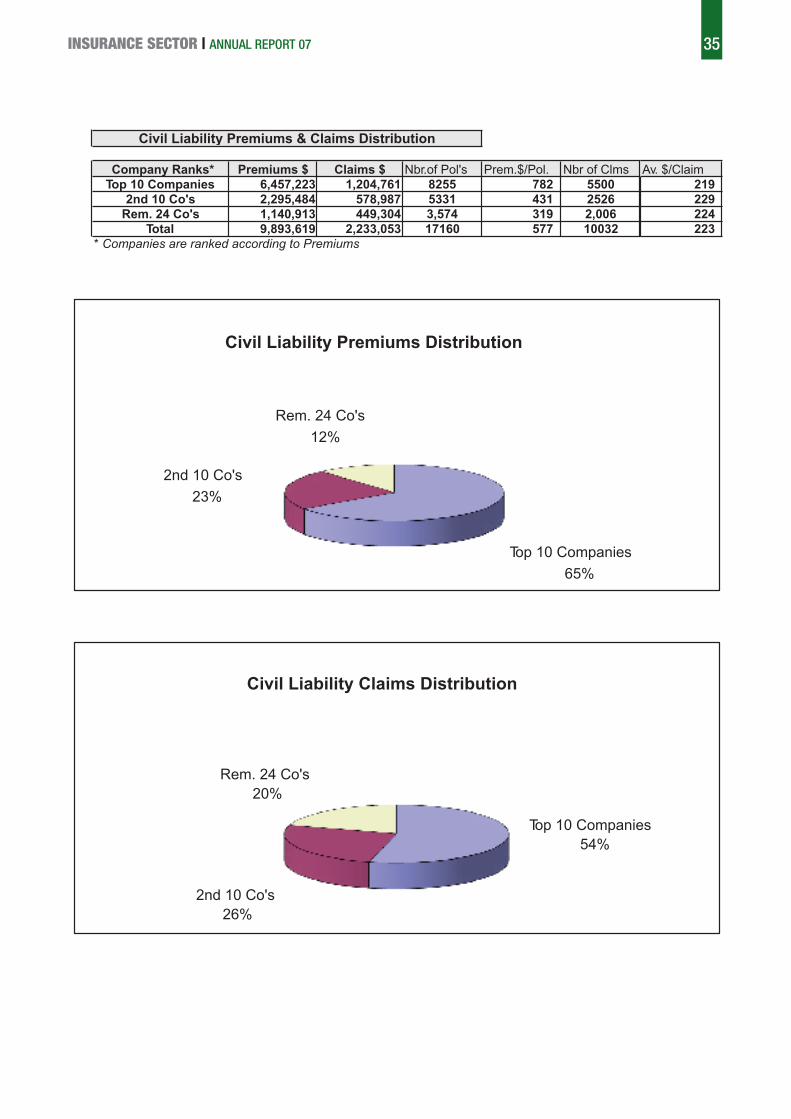
Company Ranks* Premiums $ Claims $ Nbr.of Pol's Prem.$/Pol. Nbr of ClmsTop 10 Companies 6,457,223 1,204,761 8255 782 5500
2nd 10 Co's 2,295,484 578,987 5331 431 2526Rem. 24 Co's 1,140,913 449,304 3,574 319 2,006
Total 9,893,619 2,233,053 17160 577 10032
Civil Liability Premiums & Claims Distribution
* Companies are ranked according to Premiums
Top 10 Companies
65%
2nd 10 Co's
23%
Rem. 24 Co's
12%
Civil Liability Premiums Distribution
Top 10 Companies 54%
2nd 10 Co's 26%
Rem. 24 Co's 20%
Civil Liability Claims Distribution
Av. $/Claim 219 229 224 223

Insurance sector | AnnuAl RepoRt 0736
Top 5 Companies
76%
2nd 5 Co's
8%
3rd 5 Co's
11%
Rem. 11 Co's
5%
Engineering Claims Distribution
Company Ranks* Premiums $ Claims $ Nbr of Pol's Prem. $/Pol. Nbr of ClmsTop 5 Companies 4,621,533 1,437,331 1288 3,588 157
2nd 5 Co's 1,723,973 153,997 104 16,577 533rd 5 Co's 968,569 207,679 396 2,446 135
Rem. 11 Co's 426,943 99,352 148 2,885 111Total 7,741,018 1,898,359 1936 3,998 456
Engineering Premiums & Claims Distribution
* Companies are ranked according to Premiums
Top 5 Companies 60%
2nd 5 Co's 22%
3rd 5 Co's 12%
Rem. 11 Co's 6%
Engineering Premiums Distribution
Av $/Claim 9,155 2,906 1,538 895 4,163

Insurance sector | AnnuAl RepoRt 07 37
Top 10 Companies
74%
2nd 10 Co's 15%
Rem. 23 Co's 11%
Miscellaneous Claims Distribution
Av $/Claim 413 618 264 407
Company Ranks* Premiums $ Claims $ Nbr.of Pol's Prem.$/Pol. Nbr of ClmsTop 10 Companies 18,042,806 3,610,133 38,065 474 8,735
2nd 10 Co's 5,276,401 734,994 10318 511 1189Rem. 23 Co's 2,053,405 558,372 10,759 191 2,116
Total 25,372,611 4,903,500 59,142 429 12,040
Miscellaneous Premiums & Claims Distribution
* Companies are ranked according to Premiums
Top 10 Companies 71%
2nd 10 Co's 21%
Rem. 23 Co's 8%
Miscellaneous Premiums Distribution

Insurance sector | AnnuAl RepoRt 0738
Top 3 Companies
61%
Other 6 Co's
39%
Credit Claims Distribution
Company Premiums Claims Number of Average Number of AverageRanks* (US$) (US$) Policies Prem.$/Pol. Claims $/Claim
Top 3 Companies 979,504 146,247 120 8163 285 513Other 6 Co's 117,277 95,363 9 13031 140 681
Total 1,096,781 241,610 129 8502 425 568
NB: Insurance Companies Licenced to Underwrite Credit Risks: 13 Companies.
Credit Premiums & Claims Distribution
* Companies are ranked according to Premiums
Top 3 Companies 89%
Other 6 Co's 11%
Credit Premiums Distribution

Insu
ranc
e se
ctor
| An
nuAl
Rep
oRt
0739
Branch I Branch II Branch III Branch V
Life Medical Motor+Others Fire Marine Credit
Based on Gross Written PremiumsProportional Stamps 0% 5% 5% 5% 3% 5%Municipal Tax 0% 6% 6% 6% 6% 6%Income Tax ( 15%) of ( 5%)=0.75% (5%)=0.75% (6%)=0.9% (12%)=1.8% (7%)=1.05% (10%)=1.5%ICC Audit Fees * 0.2% 0.2% 0.2% 0.2% 0.2% 0.2%Total % on Gross W. Premiums 0.95% 11.95% 12.10% 13% 10.25% 12.70% 8.00%Gross Written Premiums 2007 276,080,000 186,770,000 225,949,000 44,981,000 22,698,000 1,115,000 757,593,000Paid on Gross W. Premiums 2007 2,623,000 22,319,000 27,340,000 5,848,000 2,327,000 142,000 60,599,000
Based on Ceded PremiumsIncome Tax ( 15% of 15% ) 2.25% 2.25% 2.25% 2.25% 2.25% 2.25% 2.25%Premiums Ceded (foreign) in 2007 30,020,000 30,320,000 27,532,000 27,358,000 11,525,000 335,000 127,090,000Paid on Ceded Premiums 2007 675,000 682,000 619,000 616,000 259,000 8,000 2,859,000
Fixed StampsL.L.2000 per Policy 1.33/Pol 1.33/Pol 1.33/Pol 1.33/Pol 1.33/Pol 1.33/Pol 1.33/PolNbr of Policies 2007 (approx) 282,000 107,000 1,427,000 166,000 60,000 2,042,000Fixed Stamps amount 2007 (approx) 375,000 142,000 1,898,000 221,000 80,000 2,716,000
Total Taxes & Stamps Imposed 2007 3,673,000 23,143,000 29,857,000 6,685,000 2,666,000 150,000 66,174,000 % of Gross Written Premiums 2007 1.33% 12.39% 13.21% 14.86% 11.75% 13.45% 8.73%
* With a Minimum Fee of LL.2,000,000 / Branch / Company
Branch IV (Accidents)TOTAL
TAXATION ON INSURANCE BY BRANCH Bases, Rates and Estimated Amounts 2007 in US$

Insurance sector | AnnuAl RepoRt 0740 Insurance sector | AnnuAl RepoRt 07 41
ح�ساب الأرباح و اخل�سائر املجّمع لقطاع التاأمني لعام 2007 )1000 لرية لبنانية(
نقلحريقوحد�ت �إ�ستثمارحياة
حو�دث عامة
�ملجموعقرو�ض�إ�ست�سفاءمركبات غري �إلز�ميمركبات �إلز�مي
طو�رق عمل و
حو�دث �سخ�سيةغري هاهند�سيةم�سوؤولية مدنية
1,116,125,457 2,343,619 37,837,130 10,810,666 14,483,672 55,757,973 278,179,944 155,619,197 54,069,779 36,989,706 71,652,029 139,360,643 259,021,099 اإيرادات الأق�ساط
1,142,072,508 1,680,716 35,820,904 8,676,856 13,593,484 53,818,874 281,556,200 167,741,197 60,963,258 34,216,751 67,808,805 139,447,736 276,747,726 الأق�ساط املكتتبة
929,466,443 1,217,094 25,992,496 6,880,570 9,801,983 42,801,382 220,088,756 109,430,464 36,754,396 23,358,968 49,807,834 139,043,574 264,288,926 �سايف الأق�ساط
71,833,922 207,407 3,449,154 454,684 1,031,976 2,958,836 22,360,509 19,856,250 7,450,691 3,409,618 6,104,003 71,873 4,478,921 ر�سوم اإ�سدار البوال�ص
140,772,143 256,216 6,379,254 1,341,602 2,759,525 8,058,656 39,106,935 38,454,484 16,758,171 7,448,165 11,896,968 332,289 7,979,879 توابع الأق�ساط
)54,078,537( 690,222 )412,082( )858,919( )430,959( )852,358( )8,677,184( )19,131,767( )6,176,833( )1,225,645( )3,949,839( - )13,053,173( األتغري يف موؤونات الأق�ساط
)7,858,694( - )137,543( )141,332( )57,705( )185,778( )696,944( )682,871( )837,127( )255,989( )425,024( )175,524( )4,262,856( األأق�ساط املرجتعة اأو امللغاة
35,990,181 )27,319( 2,565,850 3,134,061 1,378,853 2,977,235 5,997,873 7,692,638 120,480 4,254,589 8,218,087 88,432 )410,599( غريها )مبا فيه اأق�ساط اإعادة ال�سمان الواردة(
88,863,794 232,663 1,646,084 497,345 698,731 4,769,898 10,187,935 9,006,090 3,259,903 2,217,059 3,400,963 18,655,530 34,291,594 نتائج �لتوظيفات )حياة و غري �حلياة(
96,304,245 259,514 1,814,803 545,030 718,109 4,883,235 10,547,559 9,433,881 4,048,516 2,318,358 3,648,289 21,260,890 36,826,059 اإيرادات التوظيفات
1,265,056 3,262 35,806 27,836 23,804 51,295 484,473 290,883 78,078 33,957 91,307 66,865 77,493 األأرباح املحققة
)598,365( )6,903( )22,609( )1,275( )3,735( )1,224( )21,220( )59,131( )42,069( )5,522( )14,413( )603( )419,662( اأخل�سائر املحققة
)8,107,142( )23,209( )181,916( )74,246( )39,446( )163,408( )822,878( )659,542( )824,623( )129,734( )324,220( )2,671,622( )2,192,297( م�ساريف التوظيفات
10,287,682 - - - - - - - - - - 10,287,682 - نتائج �لتوظيفات )وحد�ت �إ�ستثمار( - غري حمققة
)490,305,506( 596,136 )6,368,678( )3,773,478( )3,590,414( )25,303,120( )207,333,376( )99,838,482( )20,905,160( )11,740,208( )17,060,683( )32,682,634( )62,305,410(اأعباء احلوادث و التعوي�سات
)482,604,692( )364,227( )7,392,026( )2,861,776( )3,366,327( )17,060,692( )207,551,181( )93,426,069( )18,854,516( )8,340,110( )33,203,515( )31,843,527( )58,340,728( األتعوي�سات املدفوعة
)7,890,177( 771,993 180,797 )869,367( )495,944( )7,111,189( 47,108 )6,309,308( )2,027,202( )3,503,372( 15,200,102 )839,107( )2,934,687( التغري يف اإحتياطي احلوادث
)IBNR( األتغري يف اإحتياطي احلوادث )442,655( 155,472 776,915 )18,753( 284,666 )1,113,968( 14,180 )51,485( 32,674 81,133 358,479 - )961,968(
632,018 32,899 65,635 )23,583( )12,808( )17,271( 156,517 )51,620( )56,116( 22,141 584,251 - )68,027( األتغري يف اإحتياطي اأعباء ت�سوية احلوادث
)214,802,726( - 44,459 71,064 )73,401( )82,239( )212,997( )3,105,259( )1,558,168( )36,842( )281,119( )104,368,632( )105,199,592(األتغري يف الإحتياطي الفني )اإجمايل(
)173,286,437( - - - - - - - - - - )104,368,632( )68,917,805( األتغري يف الإحتياطي احل�سابي )حياة-اإ�ستثمار(
)41,516,289( - 44,459 71,064 )73,401( )82,239( )212,997( )3,105,259( )1,558,168( )36,842( )281,119( - )36,281,787( األتغري يف الإحتياطيات الفنية الأخرى
)1,002,486( - - - - - - - - - - )858,032( )144,454(اأن�سبة اأرباح حاملي البوال�ص
)73,816,673( )1,007,876( )13,047,805( )3,480,455( )3,789,120( 14,217 )2,552,966( )4,968,581( )417,433( )6,653,112( )20,463,482( )2,320,256( )15,129,803(نتائج عمليات �إعادة �ل�سمان
)219,709,480( )505,653( )19,299,956( )7,876,786( )4,771,960( )9,286,746( )49,682,453( )8,371,356( )1,556,231( )18,918,560( )49,644,002( )2,545,695( )47,250,081( األأق�ساط املتنازل عنها
)28,121,201( - )2,161,004( )1,425,901( )1,314,640( )685,571( )3,975,087( )3,413,581( )659,989( )1,544,160( )8,401,099( - )4,540,169( يف لبنان
)191,588,279( )505,653( )17,138,952( )6,450,885( )3,457,320( )8,601,175( )45,707,366( )4,957,775( )896,242( )17,374,400( )41,242,904( )2,545,695( )42,709,912( يف اخلارج
108,705,683 288,408 3,988,301 1,800,384 242,679 5,520,065 38,128,482 1,661,118 564,328 5,632,018 30,809,188 15,075 20,055,637 األتعوي�سات املدفوعة من معيدي ال�سمان
)3,627,342( )1,086,571( )1,198,680( 1,070,333 276,775 1,705,647 3,535,794 662,411 417,264 2,331,034 )12,408,763( 53,469 1,013,944 ح�سة معيدي ال�سمان من تغري الإحتياطي الفني
38,951,256 295,940 3,108,604 1,521,545 459,997 2,054,301 5,407,061 903,771 132,028 4,172,880 10,621,566 132,263 10,141,301 عمولت واردة من معيدي ال�سمان
1,863,210 - 353,926 4,069 3,389 20,950 58,149 175,475 25,178 129,516 158,529 24,632 909,397 غريها
)354,926,141( )1,463,664( )14,428,536( )3,354,621( )6,160,485( )28,132,994( )72,560,169( )78,845,575( )28,582,622( )13,856,430( )27,060,512( )28,060,944( )52,419,588(م�ساريف عمومية
)169,197,704( )232,545( )7,222,178( )1,152,460( )2,623,573( )14,748,656( )26,465,425( )36,156,405( )14,598,879( )6,548,351( )12,805,838( )19,065,666( )27,577,728( عمولت مدفوعة و تكاليف اإنتاج
)138,531,630( )1,134,410( )5,800,774( )1,162,201( )2,617,857( )11,769,182( )31,465,214( )31,342,952( )11,405,518( )4,864,535( )9,928,499( )8,291,145( )18,749,344( م�ساريف اإدارية
)7,052,131( )75,783( )266,325( )60,338( )101,226( )285,622( )1,272,935( )981,737( )353,465( )215,986( )425,909( )496,784( )2,516,019( ر�سوم و �سرائب
)40,144,676( )20,926( )1,139,260( )979,621( )817,828( )1,329,534( )13,356,595( )10,364,481( )2,224,760( )2,227,558( )3,900,266( )207,349( )3,576,497( م�ساريف اأخرى
80,423,402 700,878 5,682,653 770,520 1,568,985 7,023,735 5,708,370 )22,132,609( 5,866,299 6,920,172 10,187,197 13,356 58,113,846 �سايف اإيرادات اللإ�ستثمار
6,858,734 119,225 153,795 40,441 249,565 308,042 317,039 2,447,298 1,801,014 187,873 510,840 - 723,601 �سايف الإيرادات من خارج اللإ�ستثمار
9,259,872 118,344 228,353 83,698 318,267 413,586 1,334,445 3,073,290 1,901,649 288,126 693,778 - 806,334 اإيرادات من خارج اللإ�ستثمار
)2,401,137( 881 )74,558( )43,257( )68,702( )105,544( )1,017,407( )625,992( )100,635( )100,253( )182,938( - )82,733( م�ساريف من خارج اللإ�ستثمار
)16,096,994( )34,549( )660,206( )149,713( )207,445( )755,868( )3,501,496( )2,127,880( )601,625( )590,859( )1,472,078( )1,894,749( )4,100,527(�سريبة �لدخل
71,185,142 785,554 5,176,242 661,247 1,611,106 6,575,910 2,523,914 )21,813,190( 7,065,689 6,517,186 9,225,959 )1,881,393( 54,736,919 األنتيجة - �سايف الربح اأو )اخل�سارة( بعد ال�سريبة

Insurance sector | AnnuAl RepoRt 0742
)لرية لبنانية 1000(ح�ساب املوجودات املجّمع لقطاع التاأمني
20072006
- 3,750,000 ر�ساميل غري مدفوعة
3,104,985 2,103,389 اأ�سول غري مادية
1,374,000,119 1,709,652,556 األتوظيفات
202,432,783 226,682,942 اأرا�سي و عقارات
71,661,158 95,162,958 �سركات تابعة اأو �سقيقة
41,194,853 38,041,800 قرو�ص
298,440,184 343,753,458 �سندات و اأوراق مالية ذات املردود الثابت
92,562,448 198,909,586 م�ساركات و اأ�سهم ذات املردود املتحرك
728,914 712,408 اإيداعات موقوفة حتت اإتفاقيات اإعادة التاأمني
653,545,282 792,994,126 النقد والتوظيفات الق�سرية الأمد
356,115,405 450,354,389 توظيفات ق�سرية الأمد
160,792,246 214,297,357 نقد و ح�سابات م�سرفية جارية
136,637,631 128,342,379 ودائع جممدة حتت كفالت لوزارة الإقت�ساد
13,434,498 13,395,279 اإيرادات م�ستحقة على التوظيفات
346,859,217 467,110,218 التوظيفات املرتبطة بعقود وحدات الإ�ستثمار
1,371,134 1,580,159 توظيفات عقارية
330,026,929 441,428,220 م�ساركات و اأ�سهم ذات املردود املتحرك
15,461,154 24,101,839 �سندات و اأوراق مالية ذات املردود الثابت
102,430,305 102,663,349 ح�سة معيدي ال�سمان يف الإحتياطي الفني )حياة(
119,984,715 119,251,025 ح�سة معيدي ال�سمان يف الإحتياطي الفني )غرياحلياة(
190,795,255 199,047,427 ذمم مدينة عائدة لعمليات �ل�سمان
34,034,855 25,030,297 اأق�ساط م�ستحقة
73,790,352 81,650,860 ذمم مدينة اأخرى على امل�سمونني
82,970,048 92,366,270 ذمم مدينة على املندوبني و خمتلف الو�سطاء
36,637,699 39,959,899 ذمم مدينة عائدة لعمليات �إعادة �ل�سمان
25,998,696 30,126,684 مبالغ بر�سم الإ�سرتداد من معيدي ال�سمان
2,349,397 2,274,160 عمولت و بدلت من معيدي ال�سمان
- - مرجتعات
8,289,607 7,559,055 ذمم مدينة اأخرى عائدة لعمليات اإعادة ال�سمان
49,760,580 52,382,556 موجودات اأخرى
42,143,679 44,505,914 اأ�سول ثابتة اإ�ستثمارية
7,616,900 7,876,642 اأ�سول اأخرى
109,720,922 103,671,790 ذمم مدينة اأخرى
727,781 1,336,520 اأجور م�ستخدمني
- 5,056 �سريبة دخل بر�سم الإ�سرتداد
51,109,752 39,797,469 ح�سابات ال�سركات ال�سقيقة و التابعة
53,932,611 58,876,412 ح�سابات مدينة اأخرى
3,950,777 3,656,333 ح�سابات امل�ساهمني
53,611,545 67,040,647 ح�سابات �لت�سوية
46,084,119 60,656,990 عمولت و تكاليف اإنتاج موؤجلة
1,491,501 661,513 ح�سابات خمتلفة بر�سم الت�سوية
2,328,580 2,025,320 اأق�ساط مكت�سبة قيد الإ�سدار
3,707,345 3,696,824 اأعباء حمت�سبة م�سبقًا
2,387,484,731 2,866,632,855 �إجمايل �ملوجود�ت

Insurance sector | AnnuAl RepoRt 07 43
)لرية لبنانية 1000(ح�ساب املطلوبات املجّمع لقطاع التاأمني
20072006
549,723,475 676,478,333 األر�ساميل اخلا�سة
328,740,953 382,510,953 األر�ساميل املدفوعة
87,879,084 91,596,141 األإحتياطيات القانونية و النظامية
35,285,959 67,909,571 نتائج �سابقة مدورة
75,384,535 71,185,142 نتيجة ال�سنة احلالية
22,432,944 63,276,529 األإحتياطيات الأخرى
1,204,560 41,334,370 اإحتياطي تقييم ال�سندات و الأوراق املالية ذات املردود الثابت
5,130,915 )2,535,074( اإحتياطي تقييم امل�ساركات والأ�سهم ذات املردود املتحرك
7,948,344 17,686,114 اإحتياطي اإعادة تخمني الأ�سول الثابتة
8,149,125 6,791,120 اإحتياطيات اأخرى
10,106,847 3,543,607 ديون غري ذات اأولوية
3,040,281 24,648 ديون ثانوية
7,066,566 3,518,960 ح�سابات امل�ساهمني
631,512,872 752,509,015 األإحتياطي الفني لفرع احلياة )اإجمايل(
562,725,563 631,643,368 املوؤونات احل�سابية )حياة(
24,419,914 29,093,541 موؤونات حوادث حتت الت�سوية )حياة(
1,811,295 2,716,472 موؤونات حوادث حا�سلة و لكن غري م�سرح عنها - IBNR )حياة(
244,392 306,722 موؤونات م�ساريف ت�سوية احلوادث )حياة(
660,679 1,663,165 موؤونات اأن�سبة اأرباح حاملي البوال�ص )حياة(
45,500,844 87,085,747 موؤونات فنية اأخرى )حياة(
- - موؤونات فنية اإ�سافية )مرتبطة بوحدات اإ�ستثمار(
475,496,340 520,054,168 األإحتياطي الفني لغري فرع احلياة )اإجمايل(
288,176,652 342,255,189 موؤونات الق�ساط )غري احلياة(
150,037,169 152,414,613 موؤونات حوادث حتت الت�سوية )غري احلياة(
15,154,301 14,691,779 موؤونات حوادث حا�سلة غري م�سرح عنها -IBNR )غري احلياة(
4,041,037 3,346,689 موؤونات م�ساريف ت�سوية احلوادث )غري احلياة(
- - موؤونات اأن�سبة اأرباح حاملي البوال�ص )غري احلياة(
4,255,180 2,494,211 موؤونات فنية اأخرى )غري احلياة(
3,159,332 4,851,687 اإحتياطي العجز يف الأق�ساط
360,932,520 466,140,259 األإحتياطي الفني للتاأمني املرتبط بوحدات الإ�ستثمار
30,008,423 33,930,308 موؤونات ملواجهة الأخطار و الأعباء
18,096,703 21,202,913 اإيداعات موقوفة حتت اإتفاقيات اإعادة التاأمني
15,025,959 19,514,264 ذمم الإ�ستثمار الدائنة
9,937,324 13,227,719 ذمم دائنة عن العمليات املبا�سرة
5,088,635 6,286,545 ذمم دائنة عن العمليات الغري مبا�سرة
69,593,472 77,516,067 ذمم دائنة عائدة لعمليات اإعادة التاأمني
62,765,045 72,773,272 ديون
5,638,625 10,174,242 اأموال م�ستدانة
47,392,544 50,404,822 ديون م�سرفية
9,733,876 12,194,208 ديون اأخرى
166,435,597 206,648,441 مطلوبات اأخرى
165,733 88,856 اأجور م�ستخدمني
50,864,117 56,562,636 �سرائب متوجبة )حكومة، �سمان اإجتماعي، اإ�سرتاكات عامة(
53,670,892 62,637,919 ح�ساب ال�سركات ال�سقيقة و املرتبطة
61,734,855 87,359,029 ذمم دائنة اأخرى
13,243,028 16,322,908 ح�سابات �لت�سوية
2,387,484,731 2,866,632,855 اإجمايل املطلوبات

Insurance sector | AnnuAl RepoRt 0744
التاأمني يف واأعمال قطاع اأو�ساع الول عن والإح�سائي املايل التقرير ان هذا
اإلتزامًا منها جتاه هذا القطاع مببداأ ال�سمان لبنان ت�سدره جلنة مراقبة هيئات
�سفافية املعلومات و�سعيًا اىل حت�سني الإتطلع واملعرفة لدى ال�سركات.
فالإعلن ال�سفاف عن اأو�ساع قطاع التاأمني ل بد ان يزيد من م�سداقيته، اإذ اأن
ال�سفافية هي من اأهم دعائم الثقة. كما ان ال�سورة الأو�سح والأ�سمل التي تعطيها
هذه الإح�ساءات عن القطاع �ست�سمح لكل �سركة ان تقي�ص نف�سها بغريها وان ت�سع
اإ�سرتاتيجية عمل اأف�سل، مما لن ينعك�ص اإّل اإيجابًا على اأداء القطاع ومنوه.
اإ�ستقرار الّل �سنني عرب ومنوه تطوره وا�سل قد اللبناين التاأمني قطاع ان
2007 �سهدت 2001 و ال�سيا�سي التي مّر فيها هذا البلد. فالفرتة الزمنية ما بني
الإجمايل حجمها زاد فقد املوجودات اما باملئة. 90 بحوايل الكتتابات يف منوًا
بن�سبة 240 باملئة والأموال اخلا�سة بن�سبة 202 باملئة و الأرباح ال�سافية بن�سبة 241
باملئة.
القوانني مرور اأخرت التي م�ستقرة الغري ال�سيا�سية الأو�ساع من فبالرغم
الآيلة اىل تو�سيع اللجنة، فقد اقدمت هذه اللجنة يف ال�سنني الأخرية املا�سية على
اإجنازات عدة يف اأكرث من اجتاه.
1( الرتكيز على امتام اعمال الرقابة املالية بتلزمي اكرث من 100 مهمة مراقبة
يف النق�ص عن للتعوي�ص الكربى، الألربعة التدقيق ملكاتب الآن حتى ميدانية
اإ�سلح اإىل العمل هذا اأدى وقد اللجنة. لدى الذاتية الب�سرية املوارد حجم
ملحوظ يف ميزانيات عدد من ال�سركات واإىل اإعادة ر�سملتها بع�سرات املليني
من الدولرات.
2( اإعادة تنظيم اللجنة جلهة اإن�ساء ق�سم اإ�سافـي اىل جانب ق�سم الرقابة املالية
هو ق�سم اأو وحدة الرقابة ال�سلوكية املناط به املحافظة على العلقات ال�سليمة بني
ال�سامنني وامل�سمونني مبا ي�سمل ذلك من مهنّيي ال�سمان كاخلرباء والو�سطاء.
3( العمل على تطوير القوانني اخلا�سة بالتاأمني باإعادة �سياغة م�سروع قانون
وو�سع واملوؤونات الفنية باملوجودات اخلا�سة املرا�سيم واإنفاذ القطاع، تنظيم
نظام داخلي جديد للجنة الرقابة.
4( بناء وتدعيم اخلربة لدى م�ستخدمي اللجنة.
5( واأخريًا، امل�ساركة الفعلية يف املحافل الدولية بهدف الإفادة من تعاونها لتطوير
الكفاءات اللبنانية واإثبات وجودها. فلجنتنا هي اليوم ع�سو يف جلنتي التطبيق
واحلوكمه لدى اجلمعية الدولية ملراقبي التاأمني )IAIS( وت�سغل من�سب نائب
موؤ�س�ص ع�سو هو لبنان ان كما اجلمعية. لهذه القطرية التن�سيق جلنة رئي�ص
من�سب وي�سغل )AFIRC( العرب التاأمني على وامل�سرفني املراقبني ملنتدى
وتر�سيخ العرب املراقبني �سمل جلمع املنتدى هذا اقيم وقد لرئي�سه. النائب
التعاون فيما بينهم بهدف تطوير م�ستوى الكفاءة واملعرفة لدى اجلميع.
كلمة رئي�ض �للجنة
وليد جنادري
رئي�ص جلنة مراقبة هيئات ال�سمان
Insurance sector | AnnuAl RepoRt 07 45
ي�سعدين ان اقدم هذه الن�سرة الوىل للتقرير ال�سنوي املايل والإح�سائي عن اعمال
قطاع التاأمني يف لبنان الذي اعدته جلنة مراقبة هيئات ال�سمان والذي �ست�سدره
�سنويًا من الآن و�ساعدًا.
ولو جاء هذا الإ�سدار الول متاأخرًا بع�ص ال�سيء عن �سنة 2007، فاإن تقرير �سنة 2008
. �سيتبعه بعد وقت ق�سري على اأن ي�سار لحقًا اىل الإلتزام بالنمط والتوقيت املنا�سبنينْ
لي�ص يف اأهمية، له من ملا الرتويج لإمنائه وينبغي التاأمني هو قطاع حيوي فقطاع
املجال الإجتماعي فح�سب، بل واي�سًا على �سعيد الإقت�ساد الوطني، اذ انه، باإدائه
بف�سل الإقت�ساد، لهذا ومن�سطًا حمفذًا عامًل ي�سكل ال�سليم، وو�سعه اجليد
الكربى امل�ساريع تاأمني عمليات وفر�ص يبتكرها التي والإ�ستثمار التوفري برامج
املراقبة بفعل اإل عليه والإبقاء الو�سع ذلك اإىل الو�سول ميكن ول يخلقها. التي
اإىل جانب امل�سارف والأ�سواق املالية، امل�ستمرة والإ�سراف اجلّدي على ما يعترب،
املواطنني من كبري عدد م�سالح عن امل�سوؤولة الثلثة، املايل القطاع اأركان اأحد
وحاملي البوال�ص.
الن�سبة وهذه اللبناين الإقت�ساد حجم من باملئة 3 حوايل التاأمني �سناعة ت�سّكل
هي الأعلى بني بلدان ال�سرق الأو�سط و�سمايل افريقيا. امنا باملقارنة مع املعدلت
اقت�ساد ويف ظل ليقطعها، اأ�سواط امامه زال ما عندنا التاأمني فقطاع العاملية،
النمو هذا و�سي�سبح للتطور. كبرية وطاقة للنمو وا�سعة جمالت ونام، م�ستقر
والكفاءة الن�سوج يكفيه من ما القطاع يكت�سب التطورممكنني فقط عندما وهذا
وامل�سداقية جلهة احرتام جميع التزاماته بحقوق امل�سمونني وامل�ستفدين.
على التاأمني، قطاع جتاه ككل الدولة ودور والتجارة القت�ساد وزارة دور يقوم
فر�ص اإحرتام اأ�سول املهنة وتطبيق قواعدها وال�سعي اىل اجناز القوانني التنظيمية
و�سع حينه، ويف التاأمني، قطاع على للإ�سراف جديد قانون مثل لها، ال�ساحلة
اأحكام قانون كامل ومتما�سك للتاأمني ي�ستمل على جمموعة قواعد واأعراف تعالج
املوجبات والعقود و�سروط التاأمينات الإلزامية.
فاملهمة الكرث احلاحًا على الوزارة حاليًا هي موا�سلة الدعم الفعلي لتطوير جلنة
مراقبة هيئات ال�سمان املناط بها واجب ال�سهر على �سلمة القطاع و�سحته.
اأوىل التقرير هي مبثابة خطوة الواردة يف هذا املالية واملعلومات ان الح�ساءات
من ذلك ملا يف م�ستمر، ب�سكل واإعتمادها التاأمني قطاع فـي ال�سفافية زيادة نحو
م�سلحة جلميع املعنيني على املدى الطويل.
كلـــــمـــــة �لوزيـــــــــر
حممد ال�سفدي
وزير الإقت�ساد والتجارة

Insurance sector | AnnuAl RepoRt 0746
45 عربي كلمة الوزير )ترجمة(
44 " كلمة رئي�ص اللجنة )ترجمة(
42-43 " جممع املوجودات واملطلوبات - لرية لبنانية
40-41 " جممع الأرباح واخل�سائر - لرية لبنانية
39 اإنكليزي �سرائب ور�سوم التاأمني - بح�سب الفروع
24-38 " ع اأق�ساط وحوادث التاأمني توزُّ
23 " املداخيل وامل�ساريف - بح�سب الفروع
22 " العمولت املدفوعة والأق�ساط املتنازل عنها - بح�سب الفروع )ر�سم بياين(
20-21 " ملخ�ص ح�ساب الأرباح واخل�سائر - 2007 )ر�سوم بيانية(
18-19 " مقارنة اأرباح وخ�سائر فروع احلياة بغري احلياة )ر�سوم بيانية(
17 " حتليل اإقت�سادي لقطاع التاأمني مع درا�سة الن�سب والعمولت
16 " توّزع الأق�ساط وامل�ساريف وامل�ستخدمني على ال�سركات )ر�سوم بيانية(
15 " توّزع روؤو�ص الأموال والأق�ساط على ال�سركات )ر�سوم بيانية(
14 " تفا�سيل املوجودات والتوظيفات واملطلوبات )ر�سوم بيانية(
13 " جممع املطلوبات
12 " جممع املوجودات
10-11 " جممع ح�ساب الأرباح واخل�سائر )دولر اأمريكي(
9 " تطور اأق�ساط وتعوي�سات احلياة وغري احلياة )ر�سوم بيانية(
8 " تطور املداخيل وامل�ساريف واملوجودات وروؤو�ص الأموال )ر�سوم بيانية(
7 " جدول تطور قطاع التاأمني من 2001 اىل 2007
6 " لئحة ال�سركات وفروعها املرخ�سة
5 " كلمة رئي�ص اللجنة )الن�ص الأ�سا�سي(
4 " كلمة الوزير )الن�ص الأ�سا�سي(
فــهــر�ســت


قطــاع التـــأمین…ƒ````æ``````````°ùdG ô`````jô```````≤àdG
2007
á«`````````fÉ``````æÑ∏dG á```````jQƒ```¡``ª÷G
IQÉ``````````éàdGh OÉ````°ü````àbE’G IQGRh
¿Éª°†dG äÉÄ«g áÑbGôe áæ÷