Insurance in the Obama Era: The Road Ahead in the Post-Crisis World NCCI Annual Issues Symposium...
34
Insurance in the Obama Era: The Road Ahead in the Post-Crisis World NCCI Annual Issues Symposium Orlando, FL May 6, 2010 Robert P. Hartwig, Ph.D., CPCU, President & Economist Insurance Information Institute 110 William Street New York, NY 10038 Tel: 212.346.5520 Cell: 917.453.1885 [email protected]
-
Upload
magnus-hood -
Category
Documents
-
view
218 -
download
0
Transcript of Insurance in the Obama Era: The Road Ahead in the Post-Crisis World NCCI Annual Issues Symposium...

Insurance in the Obama Era: The Road Ahead in the
Post-Crisis World
NCCI Annual Issues SymposiumOrlando, FLMay 6, 2010
Robert P. Hartwig, Ph.D., CPCU, President & EconomistInsurance Information Institute 110 William Street New York, NY 10038
Tel: 212.346.5520 Cell: 917.453.1885 [email protected] www.iii.org

2
Reasons for Optimism in the Overall P/C Insurance Industry & Workers Comp Line
Economic Recovery is Self-Sustaining: No Double Dip Recession
Era of Mass Exposure Destruction Has Ended, Including WC Payroll Loss
No Secondary Spike in Unemployment or Swoon in Payrolls/WC Exposure But wage growth remains sluggish
Exposure Growth Will Begin in Earnest in 2nd Half 2010, Accelerate in 2011
Increase in Demand for Commercial Insurance is in its Earliest Stages and Will Accelerate in 2011, Including Workers Compensation
P/C Insurance Industry Will See Growth in 2011 for the First Time Since 2006
Investment Environment Is/Remains Much More Favorable Volatility, however, will persist and yields remain low
Both are critical issues in long-tailed lines like workers comp
P/C Insurance Industry Capacity as of 3/31/10 Has Recovered 100%+ of the Capital Lost During the Financial Crisis As of 12/31/09 capacity was within 2% of pre-crisis high
Financial Strength & Ratings of Global (Re)Insurance Industries Remained Strong Throughout the Financial Crisis in Sharp Contrast With Banks
Insurers Have Avoided (So Far) the Most Draconian Outcomes in Financial Services Reform Legislation
Source: Insurance Information Institute.

3
The Economic Storm
What the Financial Crisis and Recession Mean for the Industry’s
Exposure Base, Growth and Profitability

4
Real GDP Growth*
* Estimates/Forecasts from Blue Chip Economic Indicators.Source: US Department of Commerce, Blue Economic Indicators 4/10; Insurance Information Institute.
2.9
%
0.1
%
4.8
%
4.8
%
-0.2
%
-0.7
%
1.5
%
-2.7
%
-5.4
%
-6.4
%
-0.7
%
2.2
%
5.6
%
2.9
%
3.0
%
2.8
%
3.0
%
3.0
%
3.2
%
3.2
%
3.3
%
3.7
%
0.8
%
1.6
%
2.5
% 3.6
%
3.1
%
-8%
-6%
-4%
-2%
0%
2%
4%
6%
8%
2
00
0
2
00
1
2
00
2
2
00
3
2
00
4
2
00
5
2
00
6
07
:1Q
07
:2Q
07
:3Q
07
:4Q
08
:1Q
08
:2Q
08
:3Q
08
:4Q
09
:1Q
09
:2Q
09
:3Q
09
:4Q
10
:1Q
10
:2Q
10
:3Q
10
:4Q
11
:1Q
11
:2Q
11
:3Q
11
:4Q
Commercial Lines Exposure Base Was Hit Hard, Including Workers Compand Will Be Slow to Come Back
Real GDP Growth (%)
Recession began in Dec. 2007. Economic toll of credit
crunch, housing slump, labor market contraction has
been severe but modest recovery is underway
The Q1:2009 decline was the steepest since the Q1:1982 drop of 6.4%
Economic growth up sharply in Q4:09 with rebuilding of inventories and stimulus.
More moderate growth expected in 2010/11

5
Real GDP Growth vs. Real P/CPremium Growth: Modest Association
Sources: A.M. Best, US Bureau of Economic Analysis, Blue Chip Economic Indicators, 4/10; Insurance Information Institute
4.3
%1
8.6
%2
0.3
%5
.8%
0.3
%-1
.6%
-1.0
%-1
.8%
-1.0
%3
.1%
1.1
%0
.8%
0.4
%0
.6%
-0.4
%-0
.3%
1.6
% 5.6
%1
3.7
%7
.7%
1.2
%-2
.9%
-0.5
%-3
.8%
-4.4
%-3
.8%
-3.7
%
5.2
%-0
.9%
-7.4
%-6
.5% -1
.5%
1.8
%
-10%
-5%
0%
5%
10%
15%
20%
25%
78
79
80
81
82
83
84
85
86
87
88
89
90
91
92
93
94
95
96
97
98
99
00
01
02
03
04
05
06
07
08
09
10
E
Re
al N
WP
Gro
wth
-4%
-2%
0%
2%
4%
6%
8%
Re
al G
DP
Gro
wth
Real NWP Growth Real GDP
P/C Insurance Industry’s Growth is Influenced Modestlyby Growth in the Overall Economy
Real GDP Growth vs. Real P/C (%)

6
Regional Differences Will Significantly Impact P/C Markets and Growth Opportunities in WC
Recovery in Some Areas Will Begin Years Ahead of Others
and Speed of Recovery Will Differ by Orders of Magnitude

7
State Economic Growth Varied Tremendously in 2008
US Bureau of Economic Analysis
Highest Quintile
Fourth Quintile
Third Quintile
Second Quintile
Lowest Quintile
Far West0.6
Rocky Mountain2.2
Southwest1.7
Plains2.0 Great Lakes
-0.4
New England1.0
Mideast1.3
Southeast0.0
US = 0.7
WA2.0
OR1.6
CA0.4
NV-0.6
ID0.0
MT1.8
WY4.4
UT1.4 CO
2.9
AZ-0.6 NM
2.0
TX2.0
OK2.7
KS2.2
NE1.3
SD3.5
ND7.3 MN
2.0
IA2.1
MO1.3
WI0.7
IL0.3
MI-1.5
IN-0.6
OH-0.7
NY1.6
PA1.1
NJ0.6
MD1.3
DE-1.6
DC3.0VA
1.3
WV2.5
KY-0.1
NC0.1
SC0.6
TN0.5
AR0.7
LA0.3
MS1.7
AL0.7
GA-0.6
FL-1.6
AK-2.0
HI0.7
ME1.4
NH1.8
VT1.7 MA
1.9
RI-0.9CT
-0.4
Mountain, Plains States Growing the Fastest
Percent Change in Real GDP by State, 2007–2008

8
Fastest Growing States in 2008:Plains, Mountain States Lead
2.1% 2.0%
7.3%
4.4%
3.5%2.9% 2.7% 2.5%
0%
1%
2%
3%
4%
5%
6%
7%
8%
ND WY SD CO OK WV IA TX, MN,NM, WA
Source: US Bureau of Economic Analysis; Insurance Information Institute.
Real State GDP Growth (%)
Natural Resource and Agricultural States Have Done Better Than Most Others Recently, Helping Insurance Exposure in Those Areas

9
Slowest Growing States in 2008: Diversity of States Suffering
Source: US Bureau of Economic Analysis; Insurance Information Institute.
States in the North, South, East and West All Represented Among Hardest Hit, But for Differing Reasons
Real State GDP Growth (%)
-0.9%
-1.5%-1.6% -1.6%
-1.7%
-2.0%
-0.1%
-0.4%-0.6% -0.6% -0.6% -0.6%
-2.5%
-2.0%
-1.5%
-1.0%
-0.5%
0.0%KY CT AZ GA IN NV RI MI DE FL OH AK

10
Labor Market Trends
Massive Job Losses Sapped the Workers Comp Exposure Base, but Improvements Are on the Horizon

11
Unemployment and UnderemploymentRates: Beginning to Improve in 2010
2
4
6
8
10
12
14
16
18
Jan 00 Jan 01 Jan 02 Jan 03 Jan 04 Jan 05 Jan 06 Jan 07 Jan 08 Jan 09 Jan 10
Traditional Unemployment Rate U-3
Unemployment + Underemployment Rate U-6
Mar10
10.1% Oct 2009 unemployment rate (U-3) was
the highest monthly rate since 1983.
Peak rate in the last 30 years: 10.8% in Nov -
Dec 1982
Stood at 9.7% in Mar. 2010.
Source: US Bureau of Labor Statistics; Insurance Information Institute.
U-6 went from 8.0% in March
2007 to 17.5% in Oct 2009; Stood at 16.9% in Mar.
2010
January 2000 through March 2010, Seasonally Adjusted (%)
Recession ended in
November 2001
Unemployment kept rising for
19 more months
Recession began in
December 2007
12
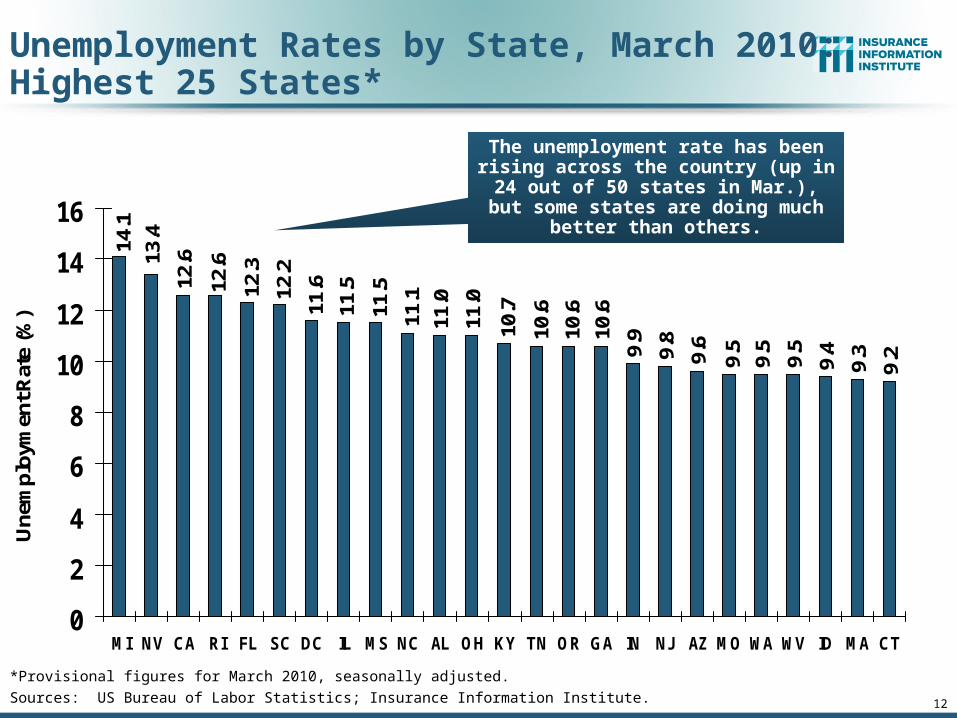
Unemployment Rates by State, March 2010:Highest 25 States*
10.6
9.911
.0
10.6
10.6
10.7
9.5
9.5
9.5
9.29.6
9.3
9.49.8
11.612
.3
11.0
11.1
11.5
11.512
.2
13.4
12.6
12.6
14.1
0
2
4
6
8
10
12
14
16
MI NV CA RI FL SC DC IL MS NC AL OH KY TN OR GA IN NJ AZ MO WA WV ID MA CT
Une
mpl
oym
ent R
ate
(%)
*Provisional figures for March 2010, seasonally adjusted.
Sources: US Bureau of Labor Statistics; Insurance Information Institute.
The unemployment rate has been rising across the country (up in 24 out of 50 states in Mar.), but some states are
doing much better than others.

13
6.9
6.8
6.6
6.57.
07.17.
47.
4
4.85.0
6.57.
27.3
4.0
6.9
8.28.
7
7.7
7.8
7.98.
28.69.
0
8.8
8.89.
2
0
2
4
6
8
10
DE PA NM WI NY AK ME TX CO AR MD MN VA WY UT MT NH LA HI IA OK VT KS NE SD ND
Une
mpl
oym
ent R
ate
(%)
Unemployment Rates By State, March 2010: Lowest 25 States*
*Provisional figures for March 2010, seasonally adjusted.Sources: US Bureau of Labor Statistics; Insurance Information Institute.
The unemployment rate has been rising across the country (up in 24 out of 50 states in Mar.), but some states are
doing much better than others.

14
US Unemployment Rate
4.5
%
4.5
%
4.6
%
4.8
%
4.9
% 5.4
% 6.1
%
6.9
%
8.1
%
9.3
%
9.6
% 10
.0%
9.7
%
9.7
%
9.6
%
9.3
%
9.1
%
8.9
%
8.6
%
9.4
%
4.0%
5.0%
6.0%
7.0%
8.0%
9.0%
10.0%
11.0%
07
:Q1
07
:Q2
07
:Q3
07
:Q4
08
:Q1
08
:Q2
08
:Q3
08
:Q4
09
:Q1
09
:Q2
09
:Q3
09
:Q4
10
:Q1
10
:Q2
10
:Q3
10
:Q4
11
:Q1
11
:Q2
11
:Q3
11
:Q4
Rising unemployment eroded payrolls
and workers comp’s exposure base.
Unemployment likely peaked at 10% in late 2009.
* = actual; = forecastsSources: US Bureau of Labor Statistics; Blue Chip Economic Indicators (4/10); Insurance Information Institute
2007:Q1 to 2011:Q4F*
Unemployment forecasts are being
revised downward for the first time in years
15
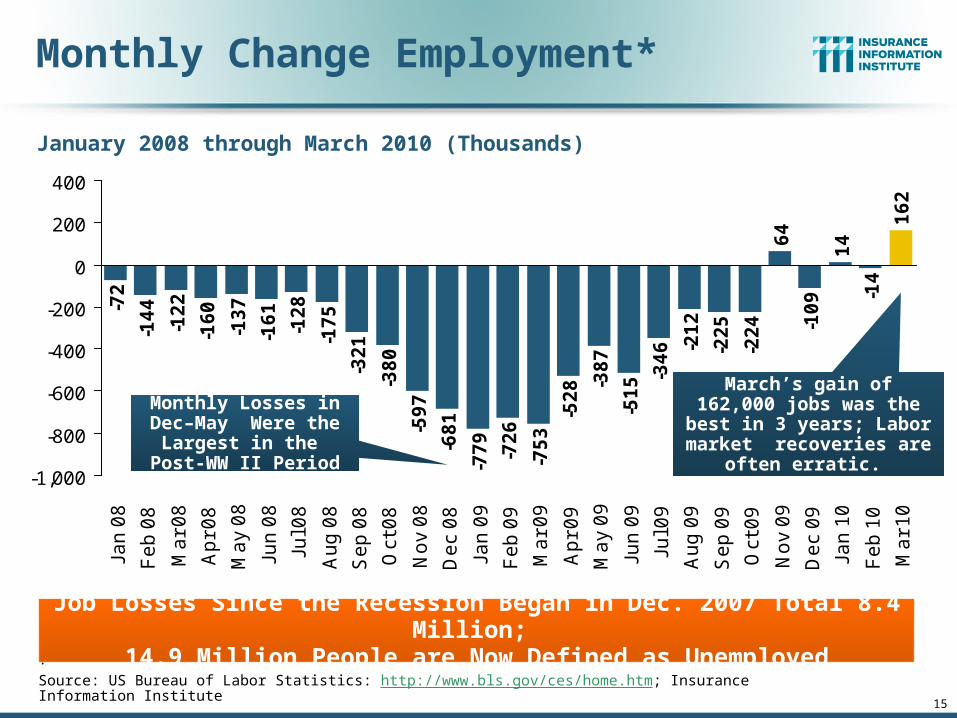
Monthly Change Employment*-7
2
-14
4
-12
2
-16
0
-13
7
-16
1
-12
8
-17
5
-32
1
-38
0
-59
7
-68
1
-77
9
-72
6
-75
3
-52
8 -38
7
-51
5 -34
6 -21
2
-22
5
-22
4
64
-10
9
14
-14
16
2
-1,000
-800
-600
-400
-200
0
200
400
Jan
08
Fe
b 0
8
Ma
r 0
8
Ap
r 0
8
Ma
y 0
8
Jun
08
Jul 0
8
Au
g 0
8
Se
p 0
8
Oct
08
No
v 0
8
De
c 0
8
Jan
09
Fe
b 0
9
Ma
r 0
9
Ap
r 0
9
Ma
y 0
9
Jun
09
Jul 0
9
Au
g 0
9
Se
p 0
9
Oct
09
No
v 0
9
De
c 0
9
Jan
10
Fe
b 1
0
Ma
r 1
0
Monthly Losses in Dec–May Were the
Largest in the Post-WW II Period
.Source: US Bureau of Labor Statistics: http://www.bls.gov/ces/home.htm; Insurance Information Institute
Job Losses Since the Recession Began in Dec. 2007 Total 8.4 Million; 14.9 Million People are Now Defined as Unemployed
January 2008 through March 2010 (Thousands)
March’s gain of 162,000 jobs was the best in 3 years;
Labor market recoveries are often erratic.
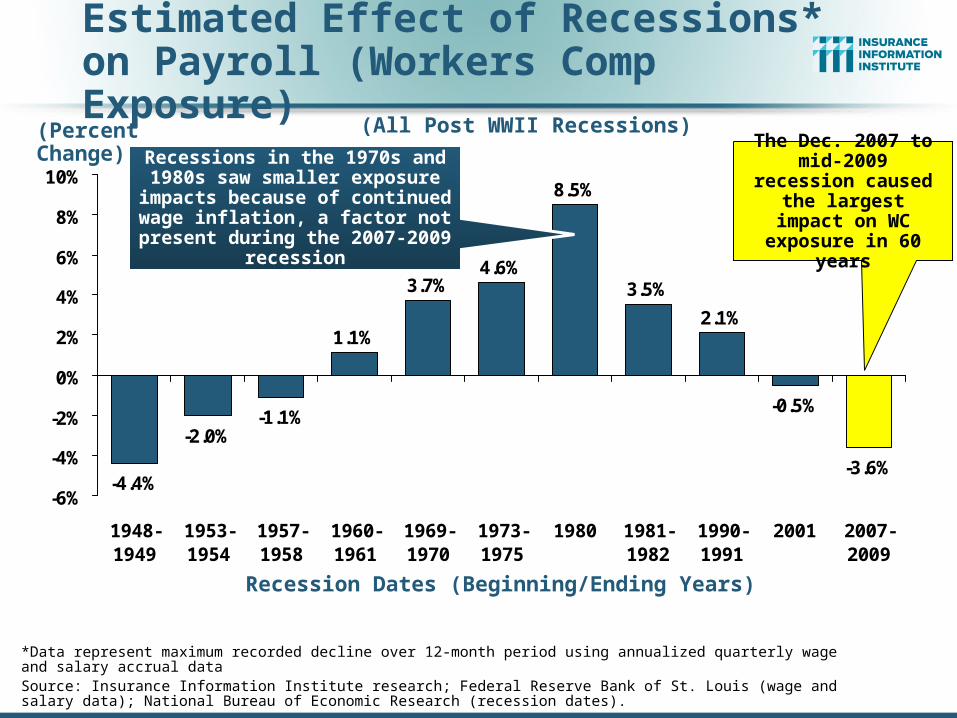
Estimated Effect of Recessions* on Payroll (Workers Comp Exposure)
*Data represent maximum recorded decline over 12-month period using annualized quarterly wage and salary accrual dataSource: Insurance Information Institute research; Federal Reserve Bank of St. Louis (wage and salary data); National Bureau of Economic Research (recession dates).
-4.4%
-2.0%-1.1%
1.1%
3.7%4.6%
8.5%
3.5%
2.1%
-0.5%
-3.6%
-6%
-4%
-2%
0%
2%
4%
6%
8%
10%
1948-1949
1953-1954
1957-1958
1960-1961
1969-1970
1973-1975
1980 1981-1982
1990-1991
2001 2007-2009
Recessions in the 1970s and 1980s saw smaller exposure impacts
because of continued wage inflation, a factor not present
during the 2007-2009 recession
The Dec. 2007 to mid-2009 recession
caused the largest impact on WC
exposure in 60 years
(Percent Change)
(All Post WWII Recessions)
Recession Dates (Beginning/Ending Years)

17
Wage & Salary Disbursement (Private Employment) vs. WC NWP ($ Billions)
Wage & Salary Disbursements (Payroll Base) vs. Workers Comp Net Written Premiums
* Average Wage and Salary data as of 10/1/2009. Shaded areas indicate recessionsSource: US Bureau of Economic Analysis; Federal Reserve Bank of St. Louis at http://research.stlouisfed.org/fred2/series/WASCUR ; I.I.I. Fact Books
Weakening Payrolls Have Eroded $2B+ in Workers Comp Premiums
7/90-3/91 3/01-11/01 12/07-?
$0
$1,000
$2,000
$3,000
$4,000
$5,000
$6,000
$7,000
89 90 91 92 93 94 95 96 97 98 99 00 01 02 03 04 05 06 07 08 09*
$0
$5
$10
$15
$20
$25
$30
$35
$40
$45
Wage & SalaryDisbursements
WC NPW

Where Will the Growth in WC Exposure Come From?
18
Industry and Occupation Growth Analysis

19
Fastest Growing Occupations, 2008–2018:Health/Science/Tech Dominate
Sources: US Bureau of Labor Statistics: Occupational Outlook Handbook, 2010-2011 Edition; Insurance Information Institute
OccupationsPercent change
Number of
new jobs(in thousands)
Wages (May 2008 median) Education/training category
Biomedical engineers 72 11.6 $ 77,400 Bachelor's degree
Network systems and data communications analysts
53 155.8 71,100 Bachelor's degree
Home health aides 50 460.9 20,460 Short-term on-the-job training
Personal and home care aides 46 375.8 19,180 Short-term on-the-job training
Financial examiners 41 11.1 70,930 Bachelor's degree
Medical scientists, except epidemiologists
40 44.2 72,590 Doctoral degree
Physician assistants 39 29.2 81,230 Master's degree
Skin care specialists 38 14.7 28,730 Postsecondary vocational award
Biochemists and biophysicists 37 8.7 82,840 Doctoral degree
Athletic trainers 37 6.0 39,640 Bachelor's degree
Physical therapist aides 36 16.7 23,760 Short-term on-the-job training
Dental hygienists 36 62.9 66,570 Associate degree
Veterinary technologists and technicians
36 28.5 28,900 Associate degree
Dental assistants 36 105.6 32,380 Moderate-term on-the-job training
Computer software engineers, applications
34 175.1 85,430 Bachelor's degree
Medical assistants 34 163.9 28,300 Moderate-term on-the-job training
Physical therapist assistants 33 21.2 46,140 Associate degree
Veterinarians 33 19.7 79,050 First professional degree
Self-enrichment education teachers
32 81.3 35,720 Work experience in a related occupation
Compliance officers, except agriculture, construction, health and safety, and transportation
31 80.8 48,890 Long-term on-the-job training
SOURCE: BLS Occupational Employment Statistics and Division of Occupational Outlook
WC exposure growth will be the fastest in the health, science and tech areas

20
Occupations with Largest Numerical Growth, 2008–2018: Health, Services Dominate
Sources: US Bureau of Labor Statistics: Occupational Outlook Handbook, 2010-2011 Edition; Insurance Information Institute
Dollar growth in WC exposures should grow the most (at current rate levels) in the health and services industries
Occupations
Number of
new jobs(in thousands) Percent change
Wages (May 2008 median) Education/training category
Registered nurses 581.5 22 $ 62,450 Associate degree
Home health aides 460.9 50 20,460 Short-term on-the-job training
Customer service representatives 399.5 18 29,860 Moderate-term on-the-job training
Combined food preparation and serving workers, including fast food
394.3 15 16,430 Short-term on-the-job training
Personal and home care aides 375.8 46 19,180 Short-term on-the-job training
Retail salespersons 374.7 8 20,510 Short-term on-the-job training
Office clerks, general 358.7 12 25,320 Short-term on-the-job training
Accountants and auditors 279.4 22 59,430 Bachelor's degree
Nursing aides, orderlies, and attendants
276.0 19 23,850 Postsecondary vocational award
Postsecondary teachers 256.9 15 58,830 Doctoral degree
Construction laborers 255.9 20 28,520 Moderate-term on-the-job training
Elementary school teachers, except special education
244.2 16 49,330 Bachelor's degree
Truck drivers, heavy and tractor-trailer
232.9 13 37,270 Short-term on-the-job training
Landscaping and groundskeeping workers
217.1 18 23,150 Short-term on-the-job training
Bookkeeping, accounting, and auditing clerks
212.4 10 32,510 Moderate-term on-the-job training
Executive secretaries and administrative assistants
204.4 13 40,030 Work experience in a related occupation
Management analysts 178.3 24 73,570 Bachelor's or higher degree, plus work experience
Computer software engineers, applications
175.1 34 85,430 Bachelor's degree
Receptionists and information clerks
172.9 15 24,550 Short-term on-the-job training
Carpenters 165.4 13 38,940 Long-term on-the-job trainingSOURCE: BLS Occupational Employment Statistics and Division of Occupational Outlook

21
Is Workers Compensation Claim Severity at Risk of Accelerating?
Inflation Trends:Could Rising Deficits, Bailouts &
Stimulus Spark Inflation?

22
Annual Inflation Rates(CPI-U, %), 1990–2011F
2.8 2.6
1.51.9
3.3 3.4
1.3
2.5 2.3
3.0
3.8
2.8
3.8
-0.4
2.1 1.9
2.92.4
3.23.0
5.14.9
-1.0
0.0
1.0
2.0
3.0
4.0
5.0
6.0
90 91 92 93 94 95 96 97 98 99 00 01 02 03 04 05 06 07 08 09 10F11F
Sources: US Bureau of Labor Statistics; Blue Chip Economic Indicators, Apr. 10, 2010 (forecasts).
There is So Much Slack in the US Economy That Inflation Should Not Be a Concern Through 2010/11, but Depreciation of Dollar is Concern Longer Run
Annual Inflation Rates (%) Inflation peaked at 5.6% in August 2008 on high energy and commodity crisis. The recession and the collapse of the
commodity bubble have reduced inflationary pressures

WC Insurers Experience Inflation More Intensely than 2009 CPI Suggests
Source: Bureau of Labor Statistics; Insurance Information Institute.
2.7%
1.8%
6.9%
3.0% 3.0%3.4%
3.1%3.4%
0%
2%
4%
6%
8%
Overall CPI "Core" CPI HospitalServices
Physicians'Services
DentalServices
PrescriptionDrugs
Medical CareCommodities
Medical CPI
(Percent increase Dec 08 to Dec 09)
Healthcare Costs Are a Major WC Insurance Cost Driver. They AreLikely to Increase Faster than the CPI for the Next Few Years, at Least
23
Excludes Food and Energy
Inpatient Services Rose 6.7%;
Outpatient Services Rose 7.4%

P/C Insurance Financial Performance
24
A Resilient Industry in Challenging Times

P/C Net Income After Taxes1991–2009 ($ Millions)
$14,1
78
$5,8
40
$19,3
16
$10,8
70
$20,5
98
$24,4
04 $36,8
19
$30,7
73
$21,8
65
$3,0
46
$30,0
29
$62,4
96
$3,0
43
$28,3
11
-$6,970
$65,7
77
$44,1
55
$20,5
59
$38,5
01
-$10,000
$0
$10,000
$20,000
$30,000
$40,000
$50,000
$60,000
$70,000
$80,000
91 92 93 94 95 96 97 98 99 00 01 02 03 04 05 06 07 08 09
2005 ROE*= 9.6% 2006 ROE = 12.7% 2007 ROE = 10.9% 2008 ROE = 0.3% 2009 ROAS1 = 5.8%
* ROE figures are GAAP; 1Return on avg. surplus. Excluding Mortgage & Financial Guaranty insurers yields a 7.3% ROAS for 2009 and 4.4% for 2008. 2009 net income was $34.5 billion and $20.8 billion in 2008 excluding M&FG.Sources: A.M. Best, ISO, Insurance Information Institute
P-C Industry profits for full-year 2009 were up sharply from 2008, but are still well
below pre-crisis levels

Property/Casualty Insurance Industry Investment Gain: 1994–20091
$35.4
$42.8$47.2
$52.3
$44.4
$36.0
$45.3$48.9
$59.4$55.7
$64.0
$31.7
$39.0
$58.0
$51.9$56.9
$0
$10
$20
$30
$40
$50
$60
$70
94 95 96 97 98 99 00 01 02 03 04 05* 06 07 08 09
Investment Gains Fell by 50% In 2008 Due to Lower Yields,Poor Equity Market Conditions. In 2009, the Lower Realized Capital Losses
Helped Offset Lower Investment Income
1 Investment gains consist primarily of interest, stock dividends and realized capital gains and losses.* 2005 figure includes special one-time dividend of $3.2B.Sources: ISO; Insurance Information Institute.
($ Billions)

A 100 Combined Ratio Isn’t What ItOnce Was: 90-95 is Where It’s At Now
Combined Ratio / ROE
* 2009/2008 figures are return on average statutory surplus. 2008 and 2009 figures exclude mortgage and financial guaranty insurersSource: Insurance Information Institute from A.M. Best and ISO data
97.5
100.6 100.1 100.7
92.6
99.3101.0
7.3%
9.6%
15.9%
14.3%
12.7%
4.4%
8.9%
80
85
90
95
100
105
110
1978 1979 2003 2005 2006 2008* 2009*0%
3%
6%
9%
12%
15%
18%
Combined Ratio ROE*
Combined Ratios Must Be Lower in Today’s DepressedInvestment Environment to Generate Risk Appropriate ROEs
Combined ratio of about 100 generated a 6% ROE in 2009, 10%
in 2005 and16% in 1979

29
Reduction in Combined Ratio Necessary to Offset 1% Decline in Investment Yield to Maintain Constant ROE, by Line*
*Based on 2008 Invested Assets and Earned Premiums**US domestic reinsurance only.Source: A.M. Best; Insurance Information Institute.
Lower Investment Earnings Place a Greater Burden on Underwriting Performance
-3.1%-3.3%-3.3%-3.7%
-4.3%
-5.2%-5.7%
-7.3%
-1.8%-1.8%-2.0%
-3.6%
-1.9%-2.1%
-8.0%
-7.0%
-6.0%
-5.0%
-4.0%
-3.0%
-2.0%
-1.0%
0.0%
The long-tailed nature of workers comp means that it is more sensitive to changes in
investment yield

30
-10%
-5%
0%
5%
10%
15%
20%
25%
71 72 73 74 75 76 77 78 79 80 81 82 83 84 85 86 87 88 89 90 91 92 93 94 95 96 97 98 99 00 01 02 03 04 05 06 07 08 09
10F
Strength of Recent HardMarkets by NWP Growth
(Percent)1975-78 1984-87 2000-03
Shaded areas denote “hard market” periodsSources: A.M. Best (historical and forecast), ISO, Insurance Information Institute
Net Written Premiums Fell 0.7% in 2007 (First Decline Since 1943) by 2.0% in 2008, and 3.7% in 2009, the First 3-Year Decline Since 1930-33
During the Great Depression. Expected decline of 1.6% in 2010.
Good News
P/C insurance industry should
see positive growth in 2011
for the first time since 2006

P/C Insurer Impairments, 1969–2009p8
15
12
71
19
34
91
31
21
99
16
14
13
36
49
31 3
45
04
85
56
05
84
12
91
61
23
11
8 19
49 50
47
35
18
14 15
71
1
5
0
10
20
30
40
50
60
70
69
70
71
72
73
74
75
76
77
78
79
80
81
82
83
84
85
86
87
88
89
90
91
92
93
94
95
96
97
98
99
00
01
02
03
04
05
06
07
08
09
p
Source: A.M. Best; Insurance Information Institute.
The Number of Impairments Varies Significantly Over the P/C Insurance Cycle, With Peaks Occurring Well into Hard Markets
5 of the 11 are Florida companies (1 of these
5 is a title insurer)

Capacity/Capital/PolicyholderSurplus (US)
32
Shrinkage During Crisis, but Not Enough to Trigger Hard Market
Capacity Has Been 100% Restored to Pre-Crisis Levels

33
Policyholder Surplus, 2006:Q4–2009:Q4
Source: ISO, AM Best.
($ Billions)
$487.1$496.6
$512.8$521.8
$478.5
$455.6
$437.1
$463.0
$490.8
$511.5$505.0
$515.6$517.9
$380
$400
$420
$440
$460
$480
$500
$520
$540
06:Q4 07:Q1 07:Q2 07:Q3 07:Q4 08:Q1 08:Q2 08:Q3 08:Q4 09:Q1 09:Q2 09:Q3 09:Q4
Capacity Peaked at $521.8 as of 9/30/07
Declines Since 2007:Q3 Peak
08:Q2: -$16.6B (-3.2%) 08:Q3: -$43.3B (-8.3%) 08:Q4: -$66.2B (-12.9%)09:Q1: -$84.7B (-16.2%)
09:Q2: -$58.8B (-11.2%)09:Q3: -$31.8B (-5.9%)09:Q4: -$2.5B (-0.5%)
Capacity as of 12/31/09 was just 2.0% below the 2007 peak and will likely set a new record in 2010

34
U.S. P/C Insurance-RelatedM&A Activity, 1988–2009
$2$5
$19
$1 $0
$20
$0
$9
$35
$14$16
$4
$56
$31
$8$12
$2$3 $3 $5$6
$40
$0
$10
$20
$30
$40
$50
$60
88 89 90 91 92 93 94 95 96 97 98 99 00 01 02 03 04 05 06 07 08 09
Tra
ns
ac
tio
n V
alu
e (
$ B
illio
n)
0
20
40
60
80
100
120
140
Nu
mb
er o
f Tra
ns
ac
tion
s
Transaction Values
Number of Transactions
Note: U.S. Company was the acquirer and/or target.
Source: Conning Research & Consulting.
2010: No Mega Deals So Far, Despite Record Capital, Slow Growth and Improved
Financial Market Conditions
$ Value of Deals Down 78% in 2009, Volume Up 7%

www.iii.org
Thank you for your timeand your attention!
Twitter: twitter.com/bob_hartwig
Insurance Information Institute Online: