15.835: Entrepreneurial Marketing Session 6 Demand Forecasting.
1
Insurance Application: marketing DB, forecasting model andcluster design. An integrated strategy used at the marketingdepartment of Reale Mutua Assicurazioni in Turin, a majorinsurance company in italy.
Abstract
The application concerns: budget definition of insurance agencies and agencies performance-based segmentation. The paper will discuss the facility of building a marketing DB directlylinked to the core of business mission. Some advantages will be illustrated in terms of parsimonyand robustness of the forecasting model. A dynamic and self correcting estimation process willbe presented. The same DB will be then accessed to establish a well defined clusters among theagencies in terms of local commercial opportunities. The absence of data redundancy will beoutlined. The problem of upgrading such data and procedures will be focused. Of particularinterest is the use of Enterprise Miner™ in the estimation process. As a final step aphilosophical point of view will be offered to the discussion: data warehouse and data mining,empty words or a new industrial approach?
Translating customer needs into faisable objects: marketing DB
The starting point of each DB project is the exact identification of requested information. Inother terms the Data Base scope has to be well established in advance, in such a way that theapplied procedures will run in a “natural” way. That is without efforts or ad hoc adaptation.When we are faced to customer we have to do with a list of things listed in the natural language.In the case of study the list is: market, income, saving, financial, customer identification,revenue, turnover, earning, possible clients, clients over the time, clients prospect, location ,economic life, territorial aspects, etc.The first impression is that all the listed words have only a casual order, although they havecertainly something in common. Furthermore the implied information are on different analysislevels: individual, agency, local administrative unit level. Also different are the informationsources (some are public, some private, other stored by the customer) and different are thecollection methods and supports.This dispersion make us many difficulties and sometime is impossible to get important results.Often this appends because the conceptual framework is very poor. For this reason the dataappear to be collected at random, without robust links among them.The solution we propose to order all the information is to move from ahead to the data. Thissolution is not original. In facts since origins IT workers are used to think first of all to the outputand only in a second time to the input. For example one may think to a simple assignmentinstruction: often the output field comes first(on the left of the equal sign) and then the inputfield (on the right of the equal sign). Let me show you a prehistoric program code as an example(Cfr. B.W.Kernighan, D.M. Ritchie, The C programming language, p. 101):
strcpy (s, t) /* copy t to s; pointer version 3 */char *s, *t;{ while (*s++ = *t++) ;}
Also think ahead is our keyword and in this context its meaning is: first of all think to the projectgoal , and if the goal does not exist try to find out a plausible one. Then start to collect thenecessary and only the necessary information, to get this goal. In our case we stated that thegoal of our system is the core mission of an insurance company: earning money by sellinginsurance products. So all the information that help us to predict customer behaviour or agenciesearnings is useful and must be taken in consideration. All other information, not related or
2
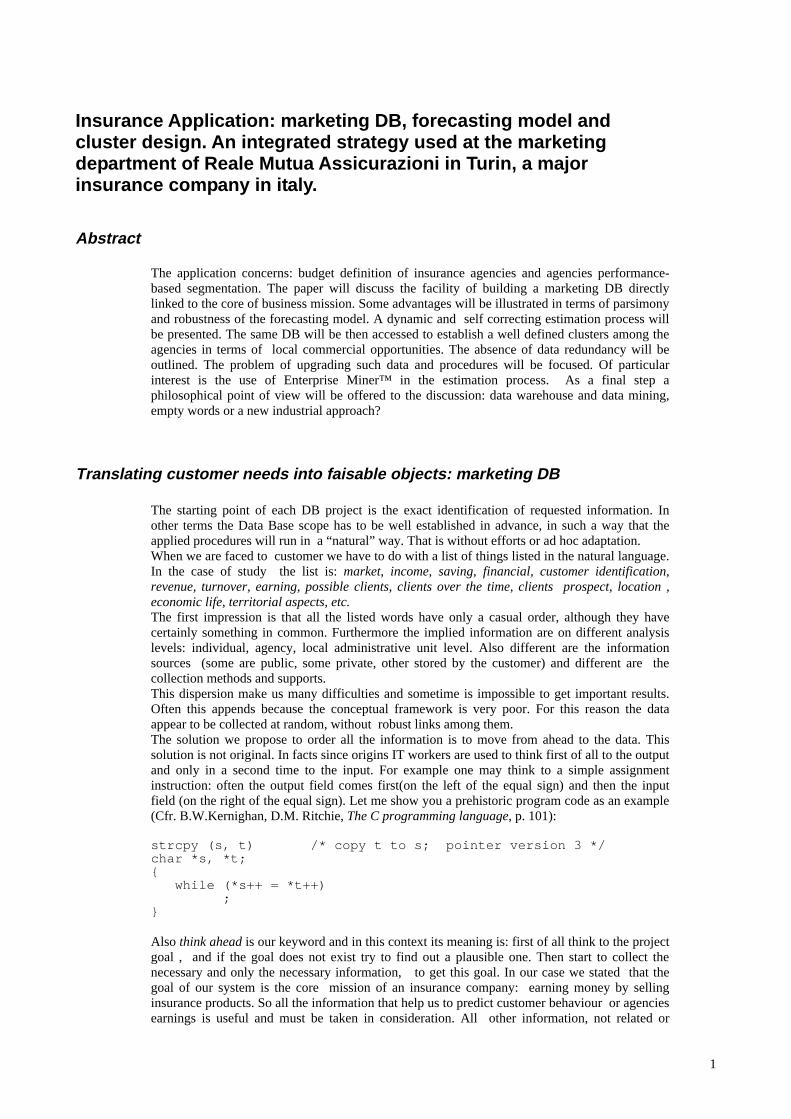
weakly related to our goal, does not enter in the marketing DB. The figure in TAB. 1 shows anexample of variables pertinent to DB.
TAB. 1 – An example of DB variables at the territorial level
3
Outline of the entire project
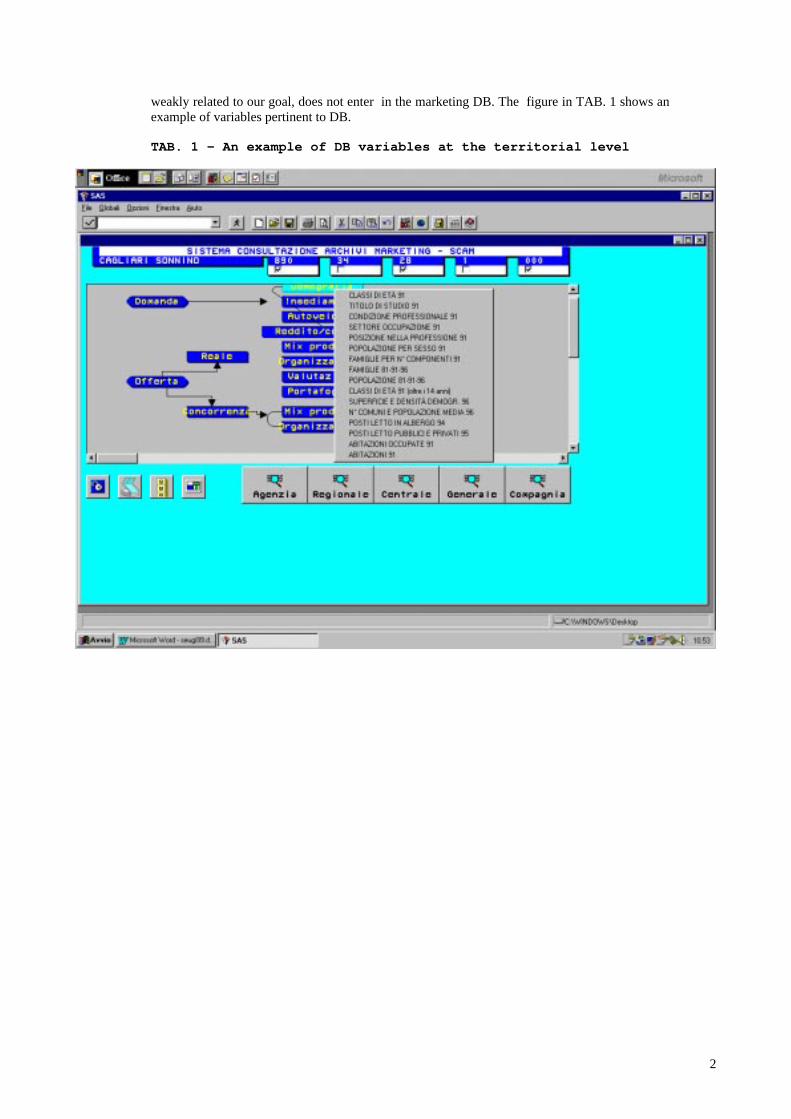
The entire project consists of three main modules and three support tools plus a simple DBMS,used for maintenance purposes. Forecasting model, client behaviour segmentation, agenciescluster are the main modules while the other modules form the system user interface: a browser,a table delivering system and an intranet based viewer. The DBMS has many things in commonwith a DATA WHAREHOUSE, although at the moment is written using traditional SAS™tools, SAS/AF™ by the way. The other part of the system are written using SAS/STAT™,SAS/INSIGHT™ and SAS/GRAPH™ (Forecasting Model, Agencies Cluster and ClientSegmentation), and SAS/IntrNet™ (System Viewer).
TAB. 2 – The Insurance Application
The core of the system is the DBMS serving all project modules. If we take the earnings as themodel dependent variable and the company core mission as the object of our project, we maythink the DBMS as an entity at which the other modules look from their specific point of view.
ClientSegmentation
AgenciesCluster
ForecastingModel
Browser
IntranetViewer
DeliveringSystem
4
The budget forecasting model
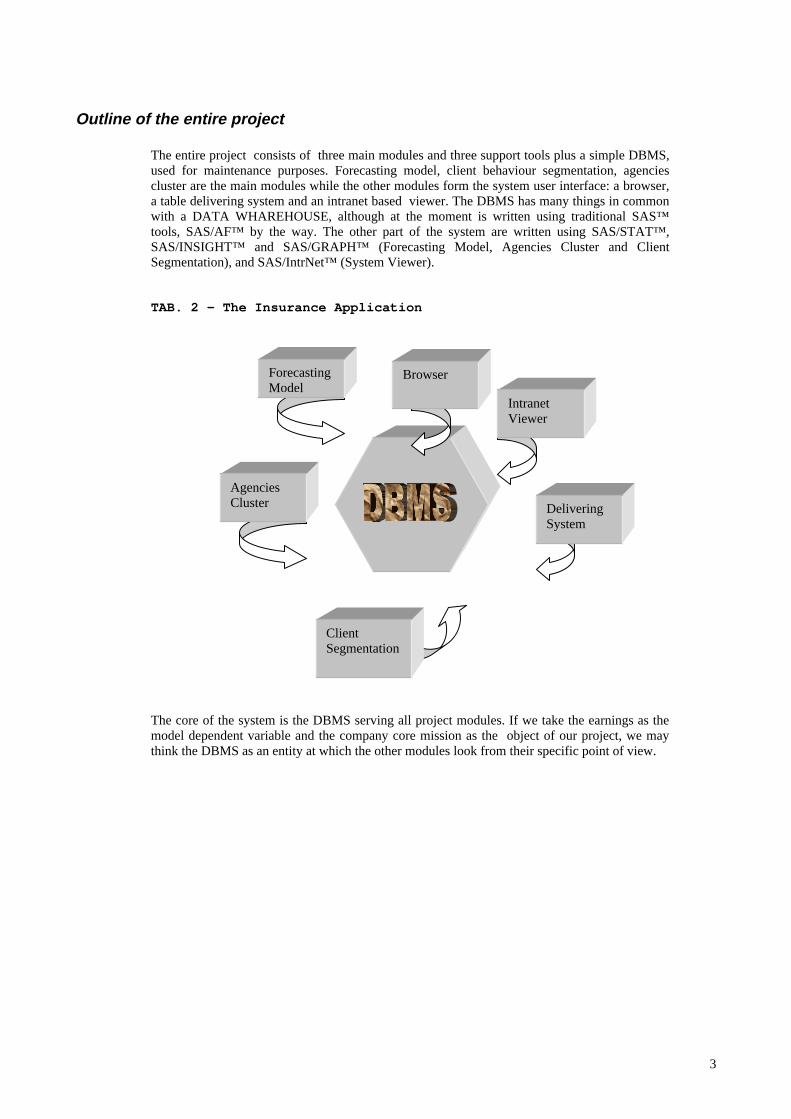
The aim of the model is to determine the budget that has to be assigned for the year t+1 to theagencies, taken as the company operating units. The model works at the agency level (theagencies are the observations) and has three order of independent variables: dimension of Agencyat time t, the trend of earnings in the last k years, the local context in which they operate.Technically speaking a set of regression models has been carried out in order to estimate theparameters for the forecasting model. It has been tested over the past and the simulation resultshave been confronted with the earnings of the proper period. In 1998 the model performed well:we got an error of 1 0/000 over the entire amount of earnings, with slight variations among thedifferent insurance product branches.
TAB. 3 –Estimated and real earnings of the whole insurance company per product branch
0
20
40
60
80
100
120
rca
rcg
ard
infortuni
furto
incendio
malattie
vita
total
5
The agencies clusters
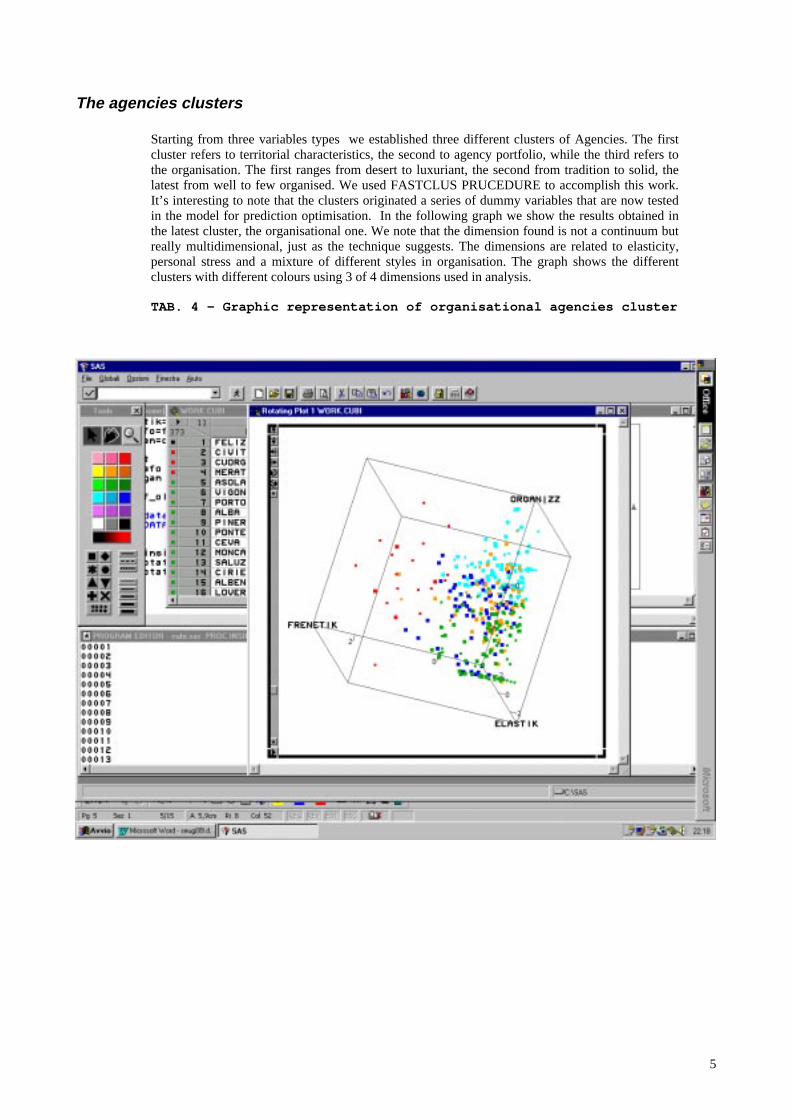
Starting from three variables types we established three different clusters of Agencies. The firstcluster refers to territorial characteristics, the second to agency portfolio, while the third refers tothe organisation. The first ranges from desert to luxuriant, the second from tradition to solid, thelatest from well to few organised. We used FASTCLUS PRUCEDURE to accomplish this work.It’s interesting to note that the clusters originated a series of dummy variables that are now testedin the model for prediction optimisation. In the following graph we show the results obtained inthe latest cluster, the organisational one. We note that the dimension found is not a continuum butreally multidimensional, just as the technique suggests. The dimensions are related to elasticity,personal stress and a mixture of different styles in organisation. The graph shows the differentclusters with different colours using 3 of 4 dimensions used in analysis.
TAB. 4 – Graphic representation of organisational agencies cluster
6
The customer segmentation
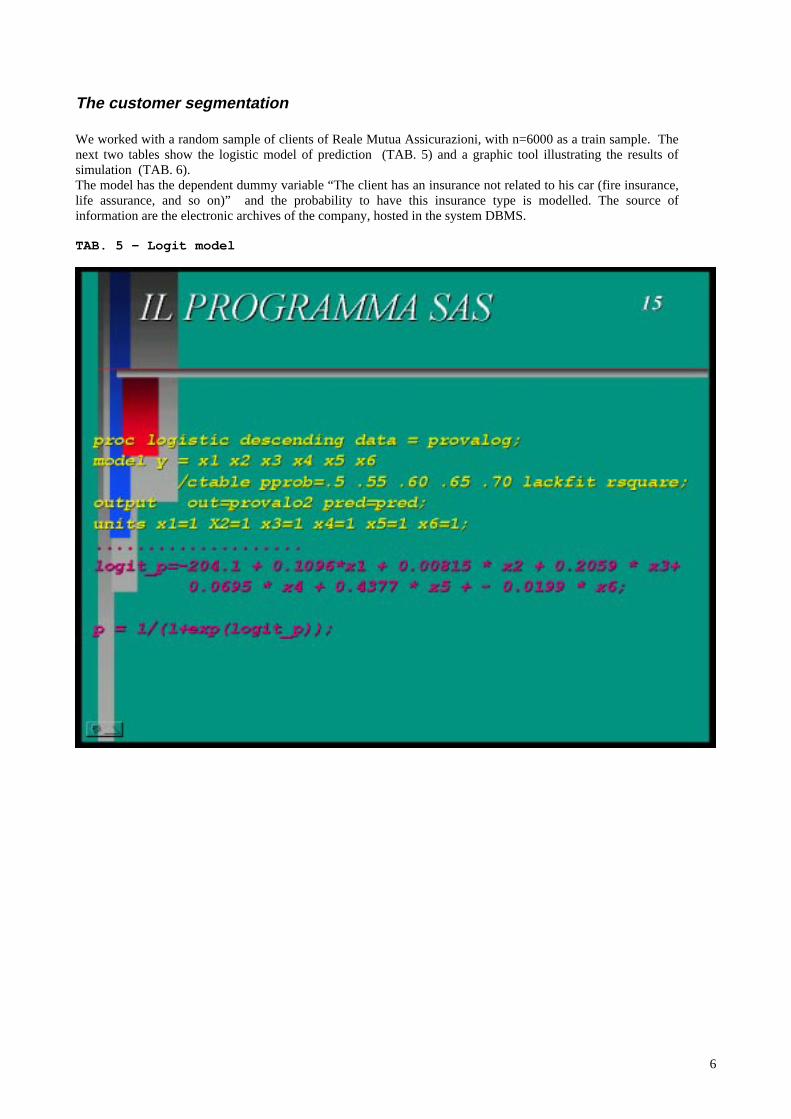
We worked with a random sample of clients of Reale Mutua Assicurazioni, with n=6000 as a train sample. Thenext two tables show the logistic model of prediction (TAB. 5) and a graphic tool illustrating the results ofsimulation (TAB. 6).The model has the dependent dummy variable “The client has an insurance not related to his car (fire insurance,life assurance, and so on)” and the probability to have this insurance type is modelled. The source ofinformation are the electronic archives of the company, hosted in the system DBMS.
TAB. 5 - Logit model
7
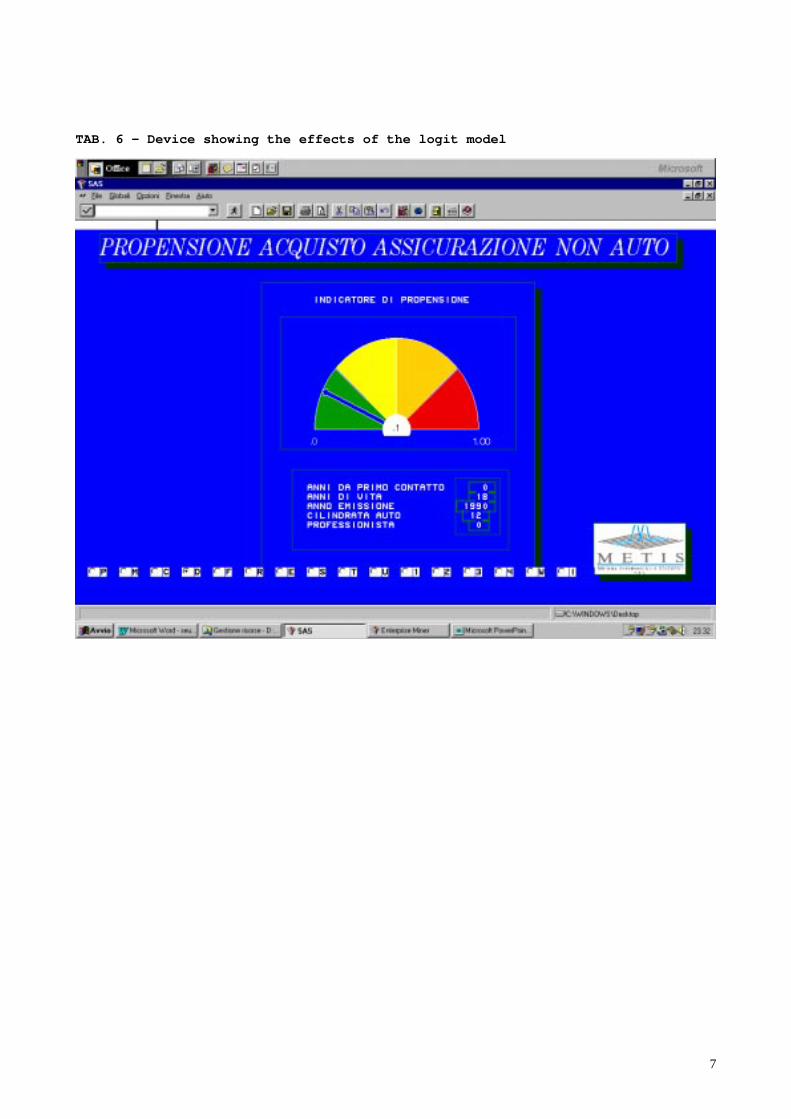
TAB. 6 – Device showing the effects of the logit model
8
The browser
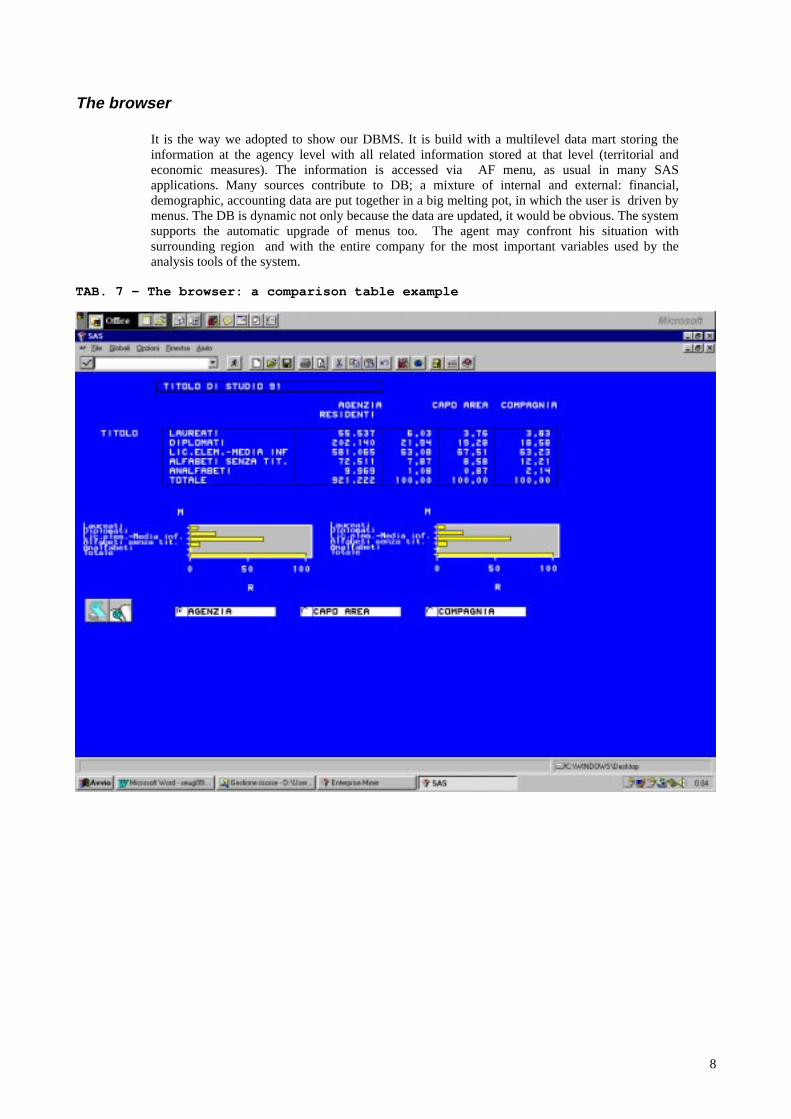
It is the way we adopted to show our DBMS. It is build with a multilevel data mart storing theinformation at the agency level with all related information stored at that level (territorial andeconomic measures). The information is accessed via AF menu, as usual in many SASapplications. Many sources contribute to DB; a mixture of internal and external: financial,demographic, accounting data are put together in a big melting pot, in which the user is driven bymenus. The DB is dynamic not only because the data are updated, it would be obvious. The systemsupports the automatic upgrade of menus too. The agent may confront his situation withsurrounding region and with the entire company for the most important variables used by theanalysis tools of the system.
TAB. 7 – The browser: a comparison table example
9
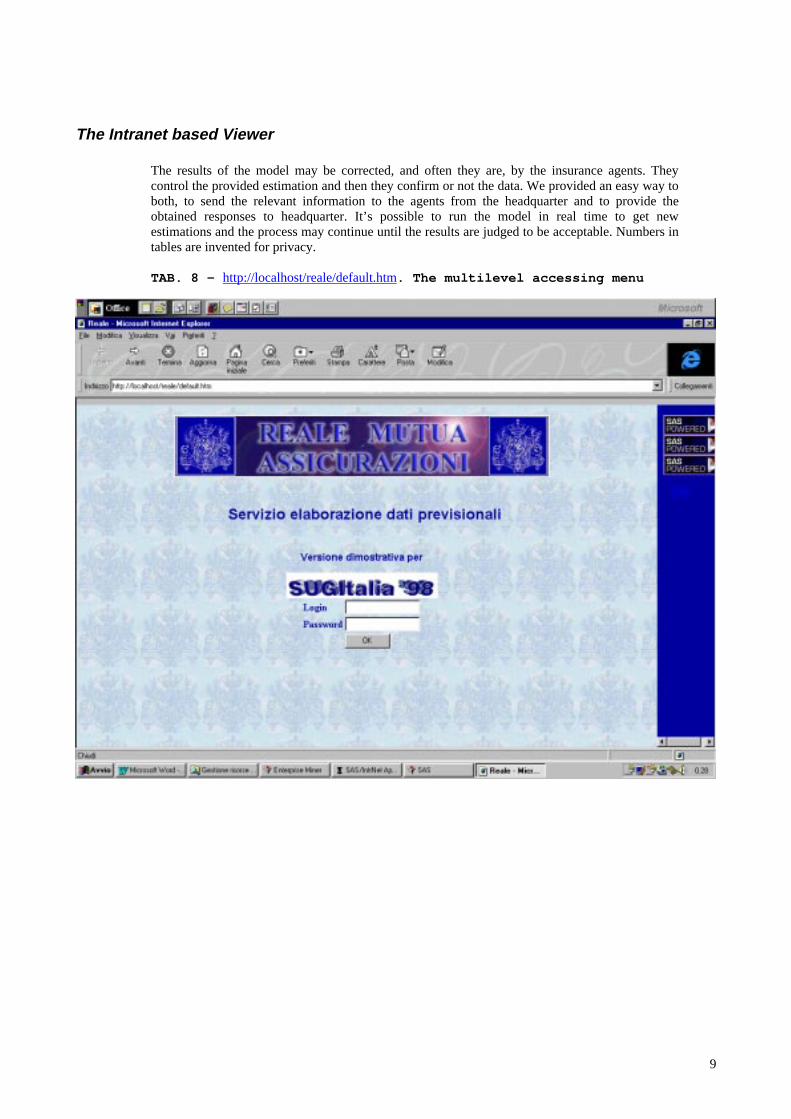
The Intranet based Viewer
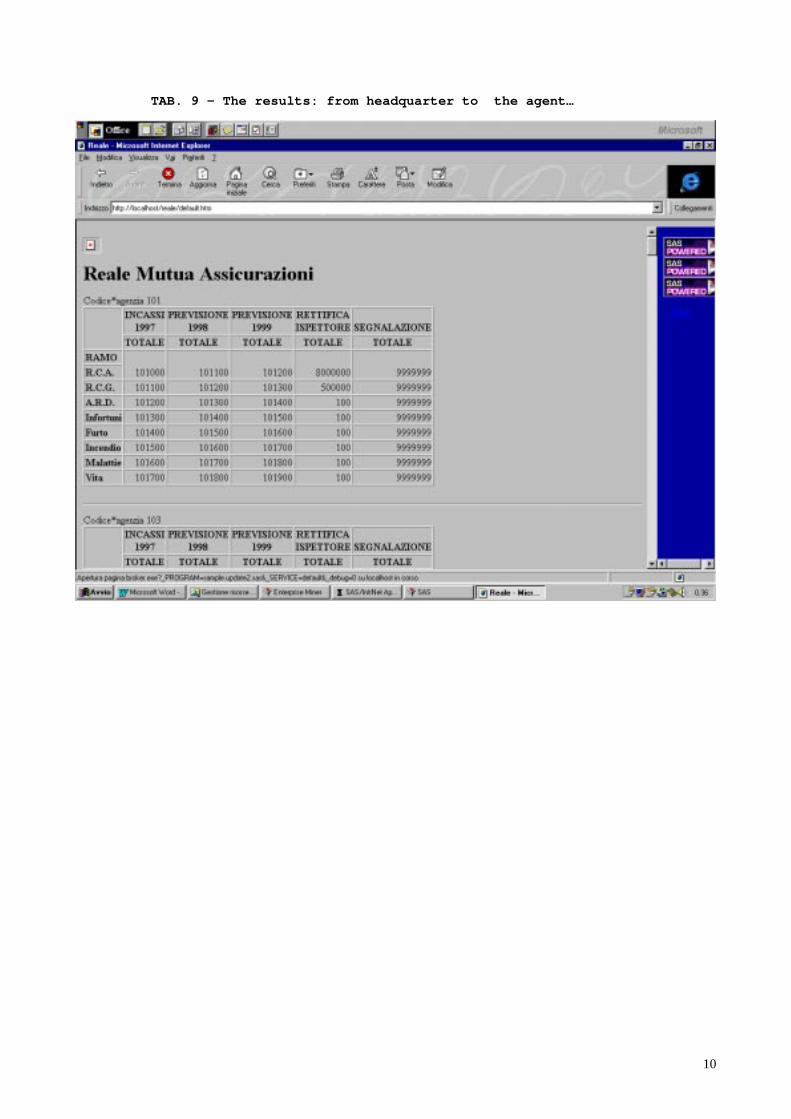
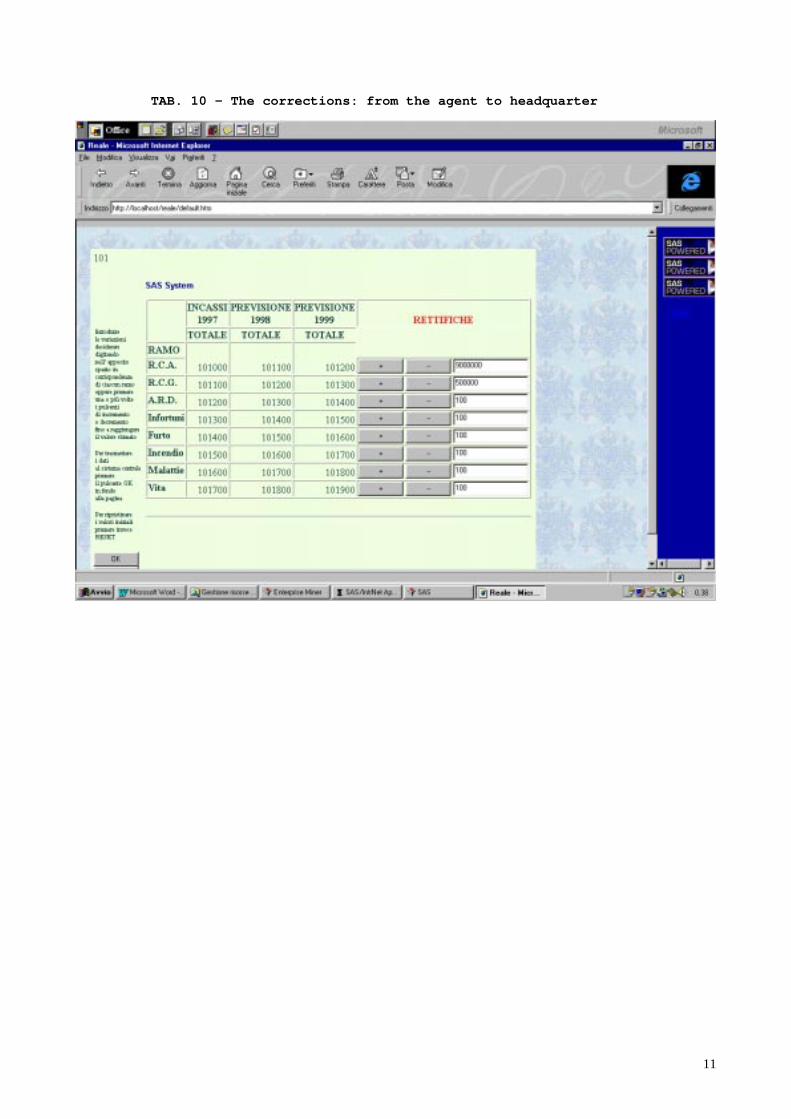
The results of the model may be corrected, and often they are, by the insurance agents. Theycontrol the provided estimation and then they confirm or not the data. We provided an easy way toboth, to send the relevant information to the agents from the headquarter and to provide theobtained responses to headquarter. It’s possible to run the model in real time to get newestimations and the process may continue until the results are judged to be acceptable. Numbers intables are invented for privacy.
TAB. 8 – http://localhost/reale/default.htm. The multilevel accessing menu
10
TAB. 9 – The results: from headquarter to the agent…
11
TAB. 10 – The corrections: from the agent to headquarter
12
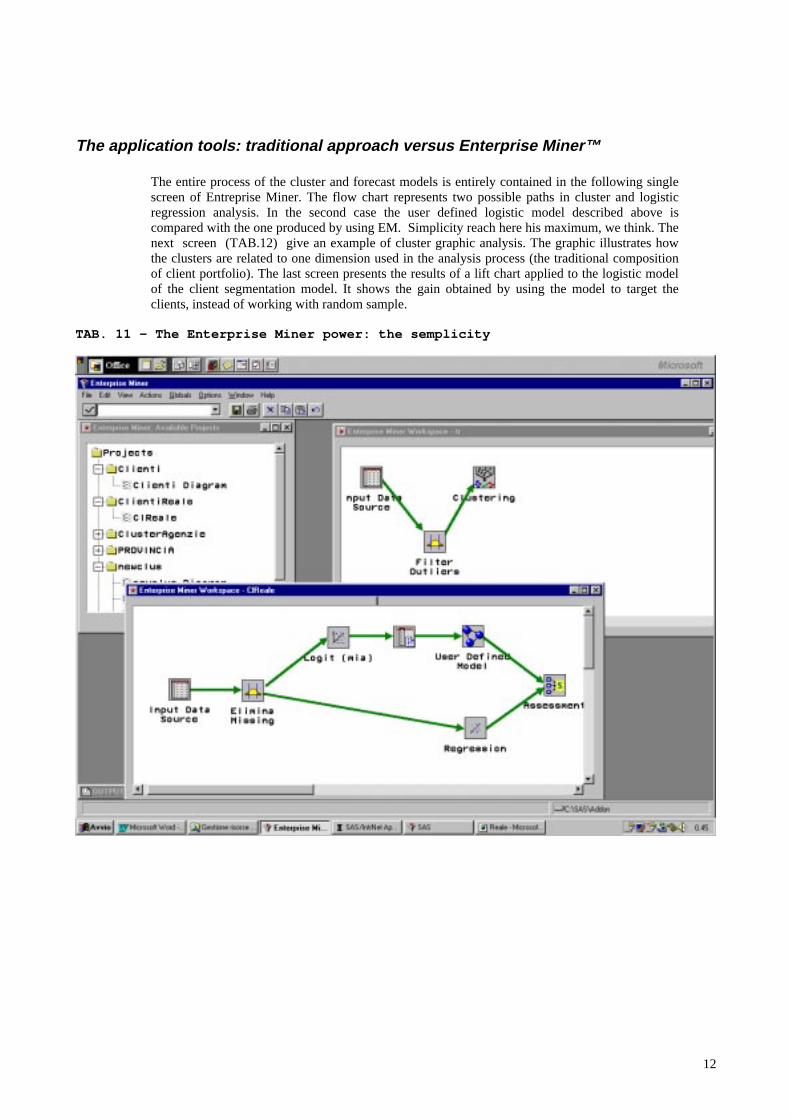
The application tools: traditional approach versus Enterprise Miner™
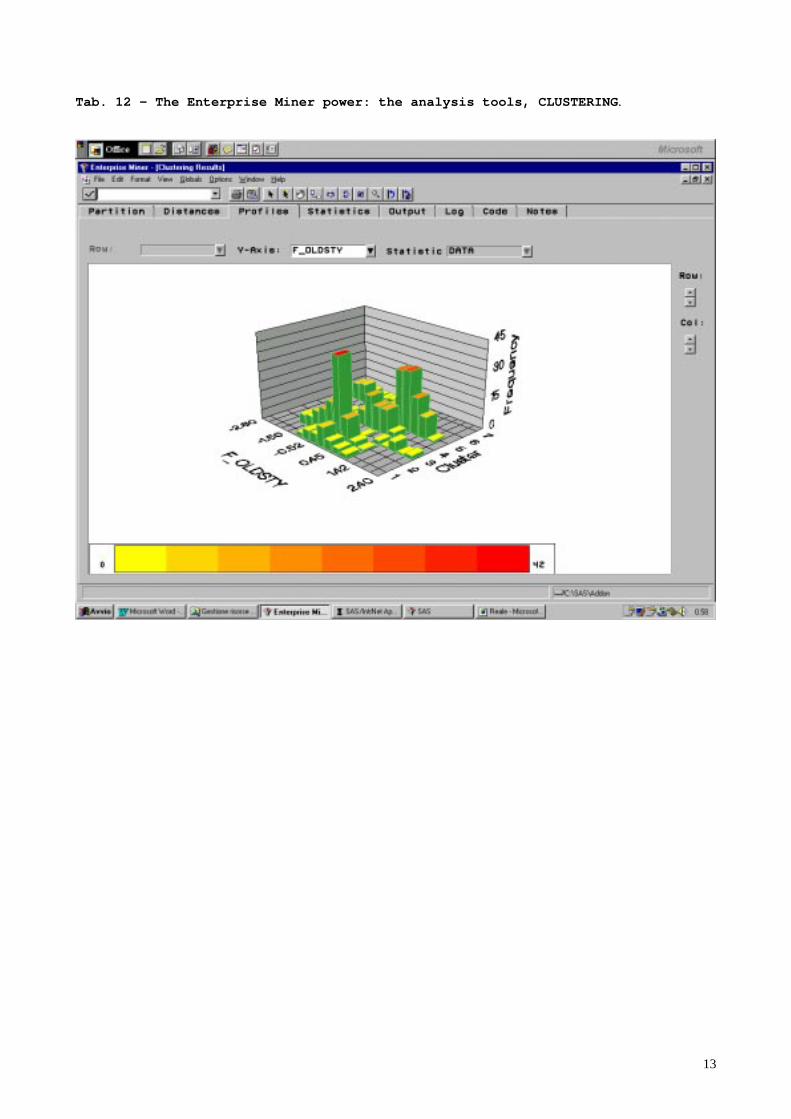
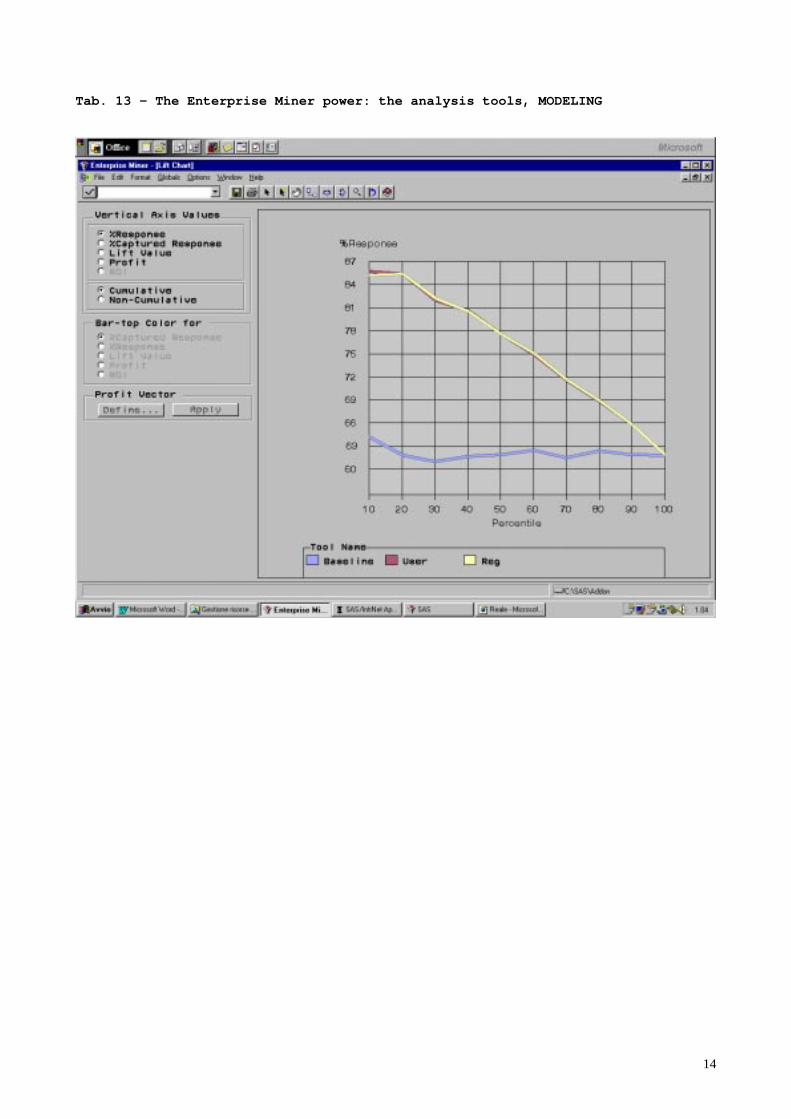
The entire process of the cluster and forecast models is entirely contained in the following singlescreen of Entreprise Miner. The flow chart represents two possible paths in cluster and logisticregression analysis. In the second case the user defined logistic model described above iscompared with the one produced by using EM. Simplicity reach here his maximum, we think. Thenext screen (TAB.12) give an example of cluster graphic analysis. The graphic illustrates howthe clusters are related to one dimension used in the analysis process (the traditional compositionof client portfolio). The last screen presents the results of a lift chart applied to the logistic modelof the client segmentation model. It shows the gain obtained by using the model to target theclients, instead of working with random sample.
TAB. 11 – The Enterprise Miner power: the semplicity
13
Tab. 12 – The Enterprise Miner power: the analysis tools, CLUSTERING .
14
Tab. 13 – The Enterprise Miner power: the analysis tools, MODELING

15
It would be interesting to use Enterprise Miner flow chart schema for all the analysis processes illustrated in this paper.It’s what we want to show you now, during the remaining time of this presentation…
16
Data Warehouse and Data Mining, empty words or a new industrial approach?
Sometimes it appends that changing the dimensions of work, changes the way we work. Whenprocedures becomes more and more complicated, absorbing many more resources than before, weare faced to this problem: how we can continue to work maintaining the quality of our products?Historically this question had different answers depending on the type of work. If for example wetake in account the automotive industry we discover soon that, after the early times wherecraftsmen made the cars, the taylorism, with his labour division in chain was the preferredsolution. This solution had many advantages over the past: the cars became less expensive and thequantity of production increased. In more recent times the extensive use of robotics permitted toovercame the chain by more efficient solutions. In these example one thing must be pointed out:the ability to build efficient tools for production is sometimes most important than the knowledgeof the specific product. To build a Stradivari Violin is not enough to play good music, but themusic sounds better if a Stradivari Violin is used.We must think to EM as a tool to do statistic in an industrial environment, as a robot of statisticalanalysis. We have a lot of data to be analysed, often we have the right tools (DATAWHAREHOUSE) to get the right ones too, and so the most important question now becomes: howcan we do the right statistics in the right time? EM, with his powerful capabilities is one possibleanswer to this question. In this way we may continue to preserve quality in the quantity world.Last but not least do not forget that a Stradivari do not play well if there are not good musicians.
Acknowledgements
I am grateful to many persons in Reale Mutua Assicurazioni. Particularly I would like to thank Dr.Oreste Porreca, the marketing director, and Dr. Daniela Bianco, that worked with me for thisproject.