Insulin Resistance and Metabolic Syndrome Thomas Repas D.O. Diabetes, Endocrinology and Nutrition...
120
Insulin Insulin Resistance and Resistance and Metabolic Metabolic Syndrome Syndrome Thomas Repas D.O. Thomas Repas D.O. Diabetes, Endocrinology and Nutrition Center, Affinity Diabetes, Endocrinology and Nutrition Center, Affinity Medical Group, Neenah, Wisconsin Medical Group, Neenah, Wisconsin Member, Inpatient Diabetes Management Committee, St. Member, Inpatient Diabetes Management Committee, St. Elizabeth’s Hospital, Appleton, WI Elizabeth’s Hospital, Appleton, WI Member, Diabetes Advisory Group, Wisconsin Diabetes Member, Diabetes Advisory Group, Wisconsin Diabetes Prevention and Control Program Prevention and Control Program Website: www.endocrinology-online.com Website: www.endocrinology-online.com
-
Upload
samson-beasley -
Category
Documents
-
view
213 -
download
0
Transcript of Insulin Resistance and Metabolic Syndrome Thomas Repas D.O. Diabetes, Endocrinology and Nutrition...

Insulin Resistance and Insulin Resistance and Metabolic SyndromeMetabolic Syndrome
Thomas Repas D.O.Thomas Repas D.O.Diabetes, Endocrinology and Nutrition Center, Affinity Medical Group, Neenah, WisconsinDiabetes, Endocrinology and Nutrition Center, Affinity Medical Group, Neenah, Wisconsin
Member, Inpatient Diabetes Management Committee, St. Elizabeth’s Hospital, Appleton, WIMember, Inpatient Diabetes Management Committee, St. Elizabeth’s Hospital, Appleton, WIMember, Diabetes Advisory Group, Wisconsin Diabetes Prevention and Control Program Member, Diabetes Advisory Group, Wisconsin Diabetes Prevention and Control Program
Website: www.endocrinology-online.comWebsite: www.endocrinology-online.com

Overview
• Epidemic of Type 2 Diabetes
• Why is Type 2 DM on the Rise?
• CV Risks of Type 2 DM
• Metabolic Syndrome
• Diagnostic Criteria
• Pathophysiology
• Treatment Options
• Conclusion

Harris MI. In: Harris MI et al, eds. Diabetes in America. Bethesda, MD: USDHHS-NIH; 1995:DHHS Publication No. (NIH) 95-1468
Rubin RJ et al. J Clin Endocrinol Metab. 1994;78:809A
• Prevalence: 17 million Americans
– 1 in every 17 people (>90% type 2 diabetes)
– 1/3 undiagnosed
• Incidence: >1 million new cases diagnosed yearly
– >2000 cases diagnosed each day
Type 2 diabetes in children and adolescents
• Related to our society’s Obesity
Age
Growth of ethnic populations with high prevalence
Physical activity
Diabetes Mellitus in the US

Top Ten Causes of Death in U.S. 2000
1. Heart Disease
2. Cancer
3. Cerebrovascular Disease
4. COPD
5. Accidents
6. Diabetes
7. Pneumonia & Influenza
8. Alzheimer's Disease
9. Kidney Disease
10. Sepsis

No Data <4% 4%-6% 6%-8% 8%-10% >10%
Diabetes and Gestational Diabetes Trends Among Adults in the U.S., BRFSS 1990
Mokdad AH, Ford ES, Bowman BA, et al. Prevalence of obesity, diabetes, and other obesity-related health risk factors, 2001. JAMA 2003 Jan 1;289(1).

Diabetes and Gestational Diabetes Trends Among Adults in the U.S., BRFSS 1991-92
Mokdad AH, Ford ES, Bowman BA, et al. Prevalence of obesity, diabetes, and other obesity-related health risk factors, 2001. JAMA 2003 Jan 1;289(1).

Diabetes and Gestational Diabetes Trends Among Adults in the U.S., BRFSS 1993-94
Mokdad AH, Ford ES, Bowman BA, et al. Prevalence of obesity, diabetes, and other obesity-related health risk factors, 2001. JAMA 2003 Jan 1;289(1).

Diabetes and Gestational Diabetes Trends Among Adults in the U.S., BRFSS 1995-96
Mokdad AH, Ford ES, Bowman BA, et al. Prevalence of obesity, diabetes, and other obesity-related health risk factors, 2001. JAMA 2003 Jan 1;289(1).

Diabetes and Gestational Diabetes Trends Among Adults in the U.S., BRFSS 1995
Mokdad AH, Ford ES, Bowman BA, et al. Prevalence of obesity, diabetes, and other obesity-related health risk factors, 2001. JAMA 2003 Jan 1;289(1).

Diabetes and Gestational Diabetes Trends Among Adults in the U.S., BRFSS 1997-98
Mokdad AH, Ford ES, Bowman BA, et al. Prevalence of obesity, diabetes, and other obesity-related health risk factors, 2001. JAMA 2003 Jan 1;289(1).

Diabetes and Gestational Diabetes Trends Among Adults in the U.S., BRFSS 1999
Mokdad AH, Ford ES, Bowman BA, et al. Prevalence of obesity, diabetes, and other obesity-related health risk factors, 2001. JAMA 2003 Jan 1;289(1).

Diabetes and Gestational Diabetes Trends Among Adults in the U.S., BRFSS 2000
Mokdad AH, Ford ES, Bowman BA, et al. Prevalence of obesity, diabetes, and other obesity-related health risk factors, 2001. JAMA 2003 Jan 1;289(1).

No Data <4% 4%-6% 6%-8% 8%-10% >10%
Diabetes and Gestational Diabetes Trends Among Adults in the U.S., BRFSS 2001
Mokdad AH, Ford ES, Bowman BA, et al. Prevalence of obesity, diabetes, and other obesity-related health risk factors, 2001. JAMA 2003 Jan 1;289(1).

Emerging Epidemic of Type 2 Diabetes in Children and Adolescents
• Type 2 diabetes is a growing epidemic in US children and adolescents, especially among minorities1,2
– African-American youth accounted for 70%–75% of type 2 diabetes in Ohio and Arkansas studies3,4
– 31% of Mexican-Americans <17 yr in California study had type 2 diabetes5
1Fagot-Campagna A et al. J Pediatr. 2000;136:6642Rosenbloom A et al. Diabetes Care. 1999;22:3453Pinhas-Hamiel O et al. J Pediatr. 1996;128:6084Pihoker C et al. Clin Pediatr. 1998;37:975Neufeld N et al. Diabetes Care. 1998;21:80

12.1
14.5
17.4
10
11
12
13
14
15
16
17
18
19
20
2002 2010 2020
Diabetes Care 26(3):917-932, 2003
Projections of US Population with Projections of US Population with Diagnosed Diabetes (millions)Diagnosed Diabetes (millions)
44% Increase by 202044% Increase by 2020

0
10
20
30
40
50
60
70
80
Esti
mate
d p
r evale
nce (
million
s)
Estimates of Diabetes Estimates of Diabetes Prevalence in World RegionsPrevalence in World Regions
2025202519951995 20002000
Africa Americas EasternMediterranean
Europe SoutheastAsia
WesternPacific
WHO Report 1997. World Health Organization. Geneva;1997.

Why is Type 2 Diabetes on the Why is Type 2 Diabetes on the rise?rise?

Link Between Obesity and Type 2 Diabetes:Link Between Obesity and Type 2 Diabetes:Nurses’ Health StudyNurses’ Health Study
Colditz GA, et al. Ann Intern Med. 1995;122:481-486.
0
20
40
60
80
100
120
<22 22-22.9
23-23.8
24-24.9
25-26.9
27-28.9
29-30.9
31-32.9
33-34.9
>35
BMI (kg/m2)
Age
-Adj
uste
d Re
lativ
e Ri
sk

Obesity Trends* Among U.S. AdultsBRFSS, 1985
Source: Mokdad A H, et al. J Am Med Assoc 1999;282:16, 2001;286:10.

Obesity Trends* Among U.S. AdultsBRFSS, 1986
Source: Mokdad A H, et al. J Am Med Assoc 1999;282:16, 2001;286:10.

Obesity Trends* Among U.S. AdultsBRFSS, 1987
Source: Mokdad A H, et al. J Am Med Assoc 1999;282:16, 2001;286:10.

Obesity Trends* Among U.S. AdultsBRFSS, 1988
Source: Mokdad A H, et al. J Am Med Assoc 1999;282:16, 2001;286:10.

Obesity Trends* Among U.S. AdultsBRFSS, 1989
Source: Mokdad A H, et al. J Am Med Assoc 1999;282:16, 2001;286:10.

Obesity Trends* Among U.S. AdultsBRFSS, 1990
Source: Mokdad A H, et al. J Am Med Assoc 1999;282:16, 2001;286:10.

Obesity Trends* Among U.S. AdultsBRFSS, 1991
Source: Mokdad A H, et al. J Am Med Assoc 1999;282:16, 2001;286:10.

Obesity Trends* Among U.S. AdultsBRFSS, 1992
Source: Mokdad A H, et al. J Am Med Assoc 1999;282:16, 2001;286:10.

Obesity Trends* Among U.S. AdultsBRFSS, 1993
Source: Mokdad A H, et al. J Am Med Assoc 1999;282:16, 2001;286:10.

Obesity Trends* Among U.S. AdultsBRFSS, 1994
Source: Mokdad A H, et al. J Am Med Assoc 1999;282:16, 2001;286:10.

Obesity Trends* Among U.S. AdultsBRFSS, 1995
Source: Mokdad A H, et al. J Am Med Assoc 1999;282:16, 2001;286:10.

Obesity Trends* Among U.S. AdultsBRFSS, 1996
Source: Mokdad A H, et al. J Am Med Assoc 1999;282:16, 2001;286:10.

Obesity Trends* Among U.S. AdultsBRFSS, 1997
Source: Mokdad A H, et al. J Am Med Assoc 1999;282:16, 2001;286:10.

Obesity Trends* Among U.S. AdultsBRFSS, 1998
Source: Mokdad A H, et al. J Am Med Assoc 1999;282:16, 2001;286:10.

Obesity Trends* Among U.S. AdultsBRFSS, 1999
Source: Mokdad A H, et al. J Am Med Assoc 1999;282:16, 2001;286:10.

Obesity Trends* Among U.S. AdultsBRFSS, 2000
Source: Mokdad A H, et al. J Am Med Assoc 1999;282:16, 2001;286:10.

Obesity Trends* Among U.S. AdultsBRFSS, 2001
Source: Mokdad A H, et al. J Am Med Assoc 1999;282:16, 2001;286:10.
CV Risks of Type 2 DiabetesCV Risks of Type 2 Diabetes

40
15 13 1310
4 5
0
10
20
30
40
50
Perc
en
t of
death
s
Geiss LS, et al. In: Diabetes in America.
National Institutes of Health;1995.
Causes of Death in Causes of Death in People With DiabetesPeople With Diabetes
Isch
emic
hear
t di
seas
e
Oth
er h
eart
dise
ase
Dia
bete
s
Mal
igna
nt
neop
lasm
s
Cere
brov
ascu
lar
dise
ase
Pneu
mon
ia/
influe
nza
All ot
her

Hospitalization Costs for Chronic Hospitalization Costs for Chronic Complications of Diabetes in the USComplications of Diabetes in the US
American Diabetes Association. Economic Consequences of Diabetes Mellitusin the US in 1997. Alexandria, VA: American Diabetes Association, 1998:1-14.
Total costs 12 Total costs 12 billion US $billion US $
CVD accounts CVD accounts for 64% of for 64% of total coststotal costs
OthersOthersOphthalmic Ophthalmic diseasedisease
CardiovascularCardiovasculardiseasedisease
Renal Renal diseasedisease
NeurologicNeurologic disease disease
PeripheralPeripheral vascular vascular disease disease

0.0
1.0
2.0
3.0
4.0
5.0
6.0
Hospitalization for MI Has Not DeclinedHospitalization for MI Has Not Declined
Hospitalization for MI (per 1,000)*
* Age-adjusted
1987 1989 1990 19921988 1993 19941991
Rosamond WD et al. N Engl J Med 1998;339:861-867.©1998 Massachusetts Medical Society. All rights reserved.
Men
Women

Copyright © 1993 American Diabetes Association. From Diabetes Care. 1993;16:434-444. Reprinted with permission from the American Diabetes Association.
*Age adjusted.
140
120
100
80
60
40
20
00 1 2 3
Number of Risk Factors
NondiabeticDiabetic
CV
D D
ea
th R
ate
* p
er 1
0,0
00
Pe
rso
n-Y
ear
s
CVD Death Rates Are Higher CVD Death Rates Are Higher
in Patients With Diabetesin Patients With Diabetes

Seven-year incidence in a Finnish-based cohort.*P<.001Haffner SM, et al. N Engl J Med. 1998;339:229-234.
Type 2 Diabetes is a Cardiovascular Risk Type 2 Diabetes is a Cardiovascular Risk FactorFactor
Fat
al o
r N
onfa
tal M
I
0
10
20
30
40
50
Nondiabetic Subjects (n=1373)
Type 2 Diabetic Subjects (n=1059)
3.5%
20.2%18.8%*
45.0%*No Prior MI
Prior MI
Diabetes and prior myocardial infarction (MI) carry the same mortality risk


Matthaei, et al. Endocrine Reviews 21(6): 585-618.

New Definition of Impaired New Definition of Impaired Fasting GlucoseFasting Glucose
In 11/03, The Expert Committee on the In 11/03, The Expert Committee on the Diagnosis and Classification of Diabetes Mellitus Diagnosis and Classification of Diabetes Mellitus redefined IFG as being 100-125 mg/dlredefined IFG as being 100-125 mg/dl
It is estimated that this will increase the numbers It is estimated that this will increase the numbers of adults with “prediabetes” by approximately of adults with “prediabetes” by approximately 20%20%
The Expert Committee on the Diagnosis and Classification of Diabetes Mellitus. . Diabetes Care VOLUME 26, NUMBER 11, 11/03.

Pathophysiology of Type 2 DiabetesPathophysiology of Type 2 Diabetes
Saltiel AR, Olefsky JM. Saltiel AR, Olefsky JM. DiabetesDiabetes. 1996;45:1661-1669.. 1996;45:1661-1669.
Peripheral TissuesPeripheral Tissues(Muscle)(Muscle)
GlucoseGlucose
LiverLiver
Impaired insulin Impaired insulin secretionsecretion
Increased glucose Increased glucose productionproduction
Receptor +Receptor +postreceptor defectspostreceptor defects
InsulinInsulinresistanceresistance
PancreasPancreas

Typical Diagnosis of Diabetes
Severity of Glucose Intolerance
Years to Decades
Normal Blood Normal Blood GlucoseGlucose
Natural History of Type 2 DiabetesNatural History of Type 2 Diabetes
Risk of Macrovascular ComplicationsRisk of Macrovascular Complications
Insulin Insulin ResistanceResistance
IGTIGT
Insulin SecretionInsulin Secretion
Postprandial GlucosePostprandial Glucose
Risk of Microvascular ComplicationsRisk of Microvascular Complications
Fasting Blood GlucoseFasting Blood Glucose
Frank Frank DiabetesDiabetes
NGTNGT
Worsens with Time

Risk of Major CHD Event Associated with Insulin Risk of Major CHD Event Associated with Insulin Quintiles in Nondiabetic Subjects: Quintiles in Nondiabetic Subjects: Helsinki Helsinki
Policemen StudyPolicemen Study
0.70
0.75
0.80
0.85
0.90
0.95
1.00
Years5 10 200 15 25
Pyorala M et al. Circulation 1998;98:398-404.©1998 Lippincott Williams & Wilkins.
Log rank:Overall P = .001Q5 vs. Q1 P < .001
Q1
Q2
Q3
Q4Q5P
roport
ion w
ithout
Majo
r C
HD
Event
0

Honolulu Heart StudyHonolulu Heart Study
0
10
20
30
40
50
60
CH
D R
isk
pe
r 1
00
0
Fatal CHD Total CHD
CHD Risk40-114 mg/dl
115-133 mg/dl
134-156 mg/dl
157-189 mgdl
190-532 mg/dl
Donahue RP, et al. 1987;36:689-692.
12 year age-adjusted incidence of fatal/total CHDBy 1 hour post challenge serum glucose

Relation of Fasting Glucose to Risks Relation of Fasting Glucose to Risks of MIof MI
People without Diabetes or IGTPeople without Diabetes or IGT
0.9
2.8
4.2
0
0.5
1
1.5
2
2.5
3
3.5
4
4.5
Od
ds
Ra
tio
fo
r M
I
<81 82-93 94-114 >114
Fasting Glucose
Gerstien HC, et al. J AM Coll Cardiology. 1999;33:612-619.

Risk for all Cause Mortality and Glycemic Risk for all Cause Mortality and Glycemic
Control:Control: Think Continuum, Not ThresholdThink Continuum, Not Threshold
0
1
2
3
4
5
6
All
Ca
us
e M
ort
alit
y*
%
<5 5-5.4 5.4-6.9 >7 Known DM
HgbA1C*Age-Adjusted. Adapted from: Khaw, et al. BMJ. 2001; 222:1.
EPIC-Norfolk StudyEPIC-Norfolk Study

Type 2 Diabetes: Elevated Postprandial Glucose Occurs at All Levels of Glycemic Control
HgbAIC (%) Mean FBG Mean 2-hr PPG
<6 116 208
6-6.9 132 233
7-7.9 172 315
8-8.9 205 371
>9 278 432
NHANES III: Third National Health and Nutrition Examination Survey. 1988-1994. National Center for Health Statistics, Hyattsville, Md

Metabolic SyndromeMetabolic Syndrome

Metabolic and Cardiovascular Risk Factors That Cluster Together
• Hyperinsulinemia/ insulin resistance
• High triglycerides• Low HDL• Increased apolipoprotein B• Small, dense LDL cholesterol• Increased fibrinogen• Increased plasminogen
activator inhibitor-1 • Increased blood viscosity
• Endothelial dysfunction• Elevated c-reactive protein• Microalbuminuria• Increased uric acid• Elevated systolic & diastolic
blood pressure• Absent nocturnal decreases in
BP & HR• Increased LVH• Premature atherosclerosis• CVA
McFarlane SI, et al. Insulin Resistance and Cardiovascular Disease. McFarlane SI, et al. Insulin Resistance and Cardiovascular Disease. J Clin Endocrinol Metab. J Clin Endocrinol Metab. 2001; 86 (2) : 713-718. 2001; 86 (2) : 713-718.

The Metabolic SyndromeThe Metabolic Syndrome
Prothrombotic StateProthrombotic State HypertensionHypertension
DyslipidemiaDyslipidemia
Insulin ResistanceInsulin Resistance

EnvironmentEnvironmentGeneticsGenetics
Bogardus C, et al. Endocrinol Metab. 1985;11:E286-E291 Roberts K, et al. Nutr Rev. 2000 May;58(5):154-160.
Etiology of Metabolic SyndromeEtiology of Metabolic SyndromeEtiology of Metabolic SyndromeEtiology of Metabolic Syndrome
• The metabolic syndrome results from a complex The metabolic syndrome results from a complex interplay of two important factors:interplay of two important factors:
• The metabolic syndrome results from a complex The metabolic syndrome results from a complex interplay of two important factors:interplay of two important factors:

Kalff KG, et al. Aviat Space Environ Med. 1999 Dec;70(12):1223-1226.Hansen BC. Ann N Y Acad Sci. 1999 Nov 18;892:1-24.
Prevalence of Metabolic Syndrome
– Approximately 20% to 30% of the middle-aged population in highly industrialized countries has the metabolic syndrome
– By the year 2010, the number of people with the metabolic syndrome in the US could rise to between 50 and 75 million

Risks of Metabolic SyndromeRisks of Metabolic Syndrome
19
40
34
51
0
10
20
30
40
50
60
No Metabolic Syndrome Metabolic Syndrome
Carotid Stenosis
Carotid Atherosclerosis
Five year Progression of Carotid Atherosclerosis and Coronary Heart DiseaseFive year Progression of Carotid Atherosclerosis and Coronary Heart Disease
3
8
0
1
2
3
4
5
6
7
8
9
No Metabolic Syndrome Metabolic Syndrome
No Metabolic Syndrome
Metabolic Syndrome
Bonora, et al. Diabetes Care, 26,4 4/03. 1251-
Bruneck StudyBruneck Study
Diagnosis of Metabolic SyndromeDiagnosis of Metabolic Syndrome

Diagnostic Criteria
Three expert groups have devised criteria for diagnosis of metabolic syndrome:
–WHO
–NCEP ATP III
–AACE

Alberti & Zimmet WHO 1998 Diabetic Medicine.
IGT/IFG or IGT/IFG or type 2 diabetestype 2 diabetes
Central ObesityCentral ObesityBMIBMI > 30 kg/m²> 30 kg/m²
MicroalbuminuriaMicroalbuminuriaUAE UAE 20 µg min 20 µg min
Insulin resistanceInsulin resistance(glucose uptake below(glucose uptake belowlowest quartile)lowest quartile)
Triglycerides > 150 Triglycerides > 150 mg/dlmg/dl& & HDL-Ch HDL-Ch << 35 mg/dl 35 mg/dl
Blood pressureBlood pressure 160/90 mmHg160/90 mmHg
METABOLIC SYNDROMEMETABOLIC SYNDROME
The Metabolic Syndrome: The Metabolic Syndrome: WHO criteriaWHO criteria

Metabolic Syndrome Factors That Cluster with Microalbuminuria
• Central Obesity• Insulin Resistance• Decreased HDL• Elevated Triglycerides• Small, Dense LDL• Systolic Hypertension• Absent normal nocturnal
decrease in BP or HR• Salt Sensitivity• Male sex; postmenopausal or
diabetic status in women
• Increased cardiovascular oxidative stress
• Endothelial dysfunction• Abnormal
Coagulation/fibrinolytic profiles
• LVH• Hyperuricemia• Elevated levels of c-reactive
protein and other inflammatory markers
McFarlane SI, et al. Insulin Resistance and Cardiovascular Disease. J Clin Endocrinol Metab. 2001; 86 (2) : 713-718.

Adult Treatment Panel IIIAdult Treatment Panel III
Risk FactorRisk Factor Waist CircumferenceWaist Circumference
TriglyceridesTriglycerides HDL CholesterolHDL Cholesterol Blood PressureBlood Pressure Fasting Blood GlucoseFasting Blood Glucose
LevelLevel >40 in (m) >35 in (f)>40 in (m) >35 in (f) >150 mg/dl>150 mg/dl <40 (m) <50 (f)<40 (m) <50 (f) >130/85>130/85 >110>110
Dysmetabolic Syndrome = 3 out of 5Dysmetabolic Syndrome = 3 out of 5
ATP III, Nat. Chol. Ed. Program, NIH

Major criteria•Insulin resistance (denoted by hyperinsulinemia relative to glucose levels) Insulin resistance (denoted by hyperinsulinemia relative to glucose levels) or or •Acanthosis Nigricans Acanthosis Nigricans •Central Obesity (waist circumference > 102 cm for men and >88 cm for Central Obesity (waist circumference > 102 cm for men and >88 cm for women) women) •Dyslipidemia (HDL cholesterol <45 mg/dl for women, HDL cholesterol Dyslipidemia (HDL cholesterol <45 mg/dl for women, HDL cholesterol <35mg/dl for men, or triglycerides >150 mg/dl) <35mg/dl for men, or triglycerides >150 mg/dl) •Hypertension Hypertension •Impaired fasting glucose or Type 2 diabetes Impaired fasting glucose or Type 2 diabetes •HyperuricemiaHyperuricemia
Minor Features•Hypercoagulability Hypercoagulability •Polycystic ovary syndrome Polycystic ovary syndrome •Vascular endothelial dysfunction Vascular endothelial dysfunction •Microalbuminuria Microalbuminuria •Coronary heart diseaseCoronary heart disease
The CDC does not require that a given number of components of Dysmetabolic Syndrome X be present when using ICD-9-CM diagnosis code 277.7. The code may be used if in the professional opinion of the physician Dysmetabolic Syndrome X is present
AACE Criteria for Dysmetabolic Syndrome X

Clinical Exam Findings Suggesting Clinical Exam Findings Suggesting Insulin ResistanceInsulin Resistance

Acanthosis NigricansAcanthosis Nigricans

Skin TagsSkin TagsSkin TagsSkin Tags

Polycystic Ovarian Syndrome:Polycystic Ovarian Syndrome:•Menstrual irregularitiesMenstrual irregularities•HyperandrogenismHyperandrogenism•Insulin resistanceInsulin resistance
Please note the central obesity, hirsutism, acne, and acanthosis nigricans in this patient.Please note the central obesity, hirsutism, acne, and acanthosis nigricans in this patient.

Close up of facial hirsutism in 17 year old female with PCOSClose up of facial hirsutism in 17 year old female with PCOSClose up of facial hirsutism in 17 year old female with PCOSClose up of facial hirsutism in 17 year old female with PCOS

Typical polycystic ovaries. Multiple small follicular Typical polycystic ovaries. Multiple small follicular cysts are apparent in the cut section. cysts are apparent in the cut section. Typical polycystic ovaries. Multiple small follicular Typical polycystic ovaries. Multiple small follicular cysts are apparent in the cut section. cysts are apparent in the cut section.

Pathophysiology of Insulin Resistance Pathophysiology of Insulin Resistance andand
Metabolic SyndromeMetabolic Syndrome

The Metabolic SyndromeThe Metabolic Syndrome
Prothrombotic StateProthrombotic State HypertensionHypertension
DyslipidemiaDyslipidemia
Insulin ResistanceInsulin Resistance
DyslipidemiaDyslipidemia

DyslipidemiaDyslipidemia

Diabetic DyslipidemiaDiabetic Dyslipidemia TriglyceridesTriglycerides HDLHDL Small, Dense LDLSmall, Dense LDL LDL-C may be “normal”LDL-C may be “normal”

Adipose Tissue
LiverLiver
Remnants (to liver)
VLDLVLDLHDL
Reduced Lipoprotein LipaseReduced Lipoprotein Lipase
TGTG
TGTG
Accelerated FFAAccelerated FFA
Accelerated TGAccelerated TG
Decreased HDL2
HepaticLipaseHepaticLipase
CECE
CETPCETPCETPCETP
CECE
LDL
TG-Rich LDL
Hepatic LipaseHepatic Lipase
SDLDL
Insulin ResistanceInsulin ResistancePostprandial Lipid MetabolismPostprandial Lipid Metabolism
TG-RichHDL

Lipoprotein Classes and InflammationLipoprotein Classes and Inflammation
Doi H et al. Circulation 2000;102:670-676; Colome C et al. Atherosclerosis 2000;149:295-302; Cockerill GW et al. Arterioscler Thromb Vasc Biol 1995;15:1987-1994.
HDLHDLLDLLDLChylomicrons,Chylomicrons,VLDL, and VLDL, and
their catabolic their catabolic remnantsremnants
> 30 nm> 30 nm 20–22 nm20–22 nm
Potentially proinflammatoryPotentially proinflammatory
9–15 nm9–15 nm
Potentially anti- Potentially anti- inflammatoryinflammatory
0
10
20
30
40
50
60
HD
L-C
(m
g/d
L)
Non-obese Obese
Hyperinsulinemic
Normoinsulinemic
0
10
20
30
40
50
60
HD
L-C
(m
g/d
L)
Non-obese Obese
Hyperinsulinemic
Normoinsulinemic
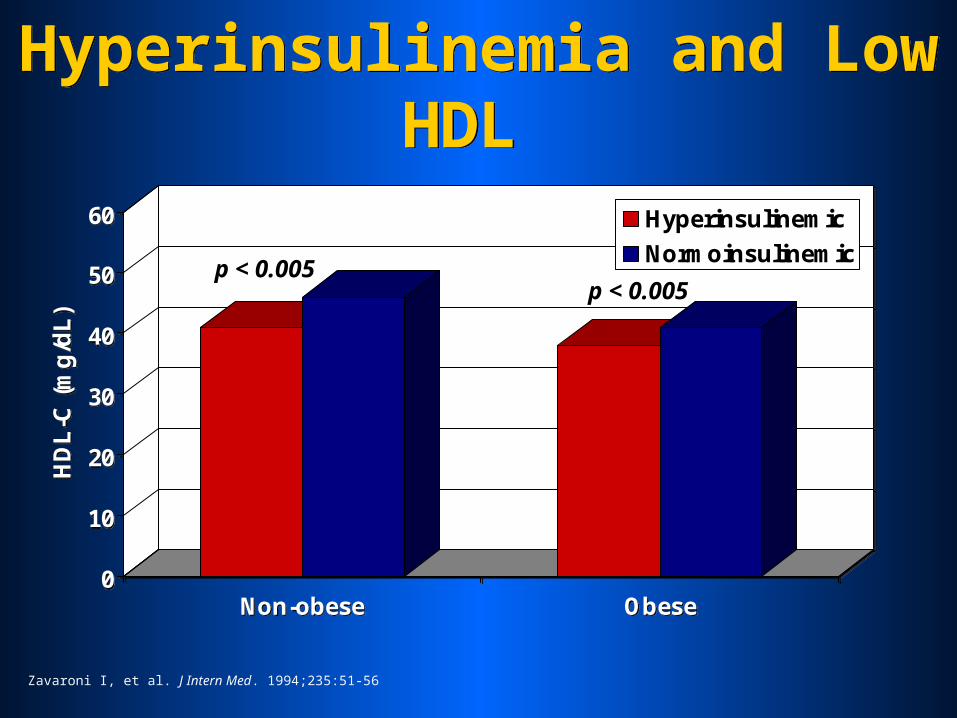
Hyperinsulinemia and Low HDL
Hyperinsulinemia and Low HDL
p < 0.005p < 0.005
Zavaroni I, et al. J Intern Med. 1994;235:51-56

0
30
60
90
120
150
180
Ra
te p
er
100
0
< 34 35-54 > 55
HDL Cholesterol
Men
Women
0
30
60
90
120
150
180
Ra
te p
er
100
0
< 34 35-54 > 55
HDL Cholesterol
Men
Women
Cardiovascular Disease and HDL-C Levels
Cardiovascular Disease and HDL-C Levels
Kannel WB, Am J Cardiol. 1983;52:9b-12b.

0
2
4
6
8
10
12
Ste
ady
Sta
te P
lasm
a G
luco
se (
mm
ol/
L)
Pattern A Intermediate Pattern Pattern B
LDL Phenotype
0
2
4
6
8
10
12
Ste
ady
Sta
te P
lasm
a G
luco
se (
mm
ol/
L)
Pattern A Intermediate Pattern Pattern B
LDL Phenotype
Glycemia and Small Dense LDL
Glycemia and Small Dense LDL
Reaven GM, et al. J Clin Invest. 1993;92:141-146

LDL SubpopulationsLDL Subpopulations
Large Fluffy LDLLarge Fluffy LDL
Small Dense LDLSmall Dense LDL
Pattern A and Pattern BPattern A and Pattern B

0
2
4
6
8
10
12
Ste
ady
Sta
te P
lasm
a G
luco
se (
mm
ol/
L)
Pattern A Intermediate Pattern Pattern B
LDL Phenotype
0
2
4
6
8
10
12
Ste
ady
Sta
te P
lasm
a G
luco
se (
mm
ol/
L)
Pattern A Intermediate Pattern Pattern B
LDL Phenotype
Glycemia and Small Dense LDL
Glycemia and Small Dense LDL
Reaven GM, et al. J Clin Invest. 1993;92:141-146

Small, Dense LDL
• Permeates arterial wall• Binds proteoglycans• Susceptible to oxidation• Atherogenic lipid profile

Structure of LDLStructure of LDL
Murphy HC et al. Biochemistry 2000;39:9763-970.
Hydrophobic CoreHydrophobic Core of Triglyceride and of Triglyceride and Cholesteryl EstersCholesteryl Esters
apoBapoB
Surface Monolayer Surface Monolayer of Phospholipids of Phospholipids and Free and Free CholesterolCholesterol

VLDLVLDL IDLIDL LDLLDL
LDLLDL
LDLLDLLDLLDL
LDL SubpopulationsLDL Subpopulations

VLDLVLDL IDLIDL LDLLDLVLDLVLDL
VLDLVLDLVLDLVLDL
IDLIDL
IDLIDLIDLIDL
LDL SubpopulationsLDL Subpopulations

VLDLVLDL IDLIDL LDLLDL
LDLLDL
LDLLDLLDLLDL
LDL SubpopulationsLDL Subpopulations

Small Dense LDLSmall Dense LDL
TGTG
CholesterolCholesterol
VLDLVLDL IDLIDL LDLLDL
VLDLVLDL LDLLDL

Small Dense LDLSmall Dense LDL
TGTG
CholesterolCholesterol
VLDLVLDL IDLIDL LDLLDL
VLDLVLDL LDLLDL

Small Dense LDLSmall Dense LDL
VLDLVLDL IDLIDL LDLLDL
VLDLVLDL LDLLDL

Small Dense LDLSmall Dense LDL
VLDLVLDL IDLIDL LDLLDL
VLDLVLDLSDLDLSDLDL

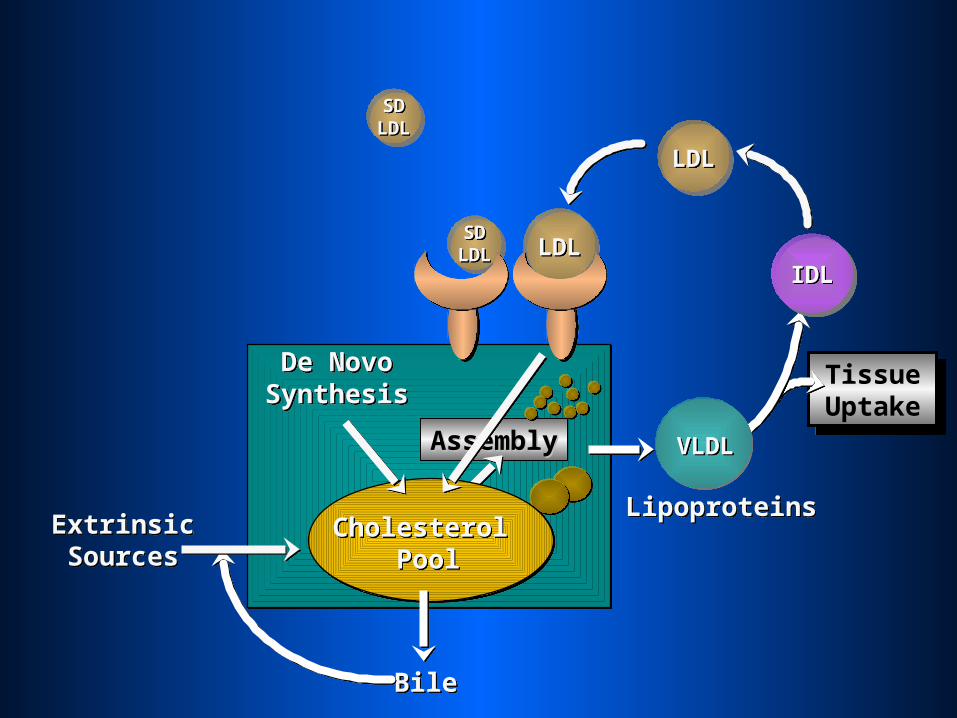
Tissue Uptake
Tissue Uptake
IDLIDLLDLLDL
AssemblyAssembly
ExtrinsicSourcesExtrinsicSources
LipoproteinsLipoproteins
VLDLVLDL
LDLLDL
Cholesterol Pool
Cholesterol Pool
BileBile
De NovoSynthesisDe Novo
Synthesis
LDLLDL
LDLLDL

LDLLDL
Tissue Uptake
Tissue Uptake
IDLIDL
ExtrinsicSourcesExtrinsicSources
De NovoSynthesisDe Novo
Synthesis
LDLLDL
AssemblyAssembly
BileBile
LipoproteinsLipoproteins
VLDLVLDL
LDLLDL
Cholesterol Pool
Cholesterol Pool
LDLLDL

Tissue Uptake
Tissue Uptake
IDLIDL
ExtrinsicSourcesExtrinsicSources
De NovoSynthesisDe Novo
Synthesis
LDLLDL
AssemblyAssembly
BileBile
LipoproteinsLipoproteins
VLDLVLDL
LDLLDL
Cholesterol Pool
Cholesterol Pool
LDLLDL
LDLLDL

Tissue Uptake
Tissue Uptake
IDLIDL
ExtrinsicSourcesExtrinsicSources
De NovoSynthesisDe Novo
Synthesis
LDLLDL
AssemblyAssembly
BileBile
LipoproteinsLipoproteins
VLDLVLDL
LDLLDL
Cholesterol Pool
Cholesterol Pool
SDLDLSDLDL
SDLDLSDLDL
SDLDLSDLDL
Tissue Uptake
Tissue Uptake
IDLIDL
ExtrinsicSourcesExtrinsicSources
De NovoSynthesisDe Novo
Synthesis
LDLLDL
AssemblyAssembly
BileBile
LipoproteinsLipoproteins
VLDLVLDL
LDLLDL
Cholesterol Pool
Cholesterol Pool
SDLDLSDLDL

SDLDLSDLDL
Tissue Uptake
Tissue Uptake
IDLIDL
ExtrinsicSourcesExtrinsicSources
De NovoSynthesisDe Novo
Synthesis
LDLLDL
AssemblyAssembly
BileBile
LipoproteinsLipoproteins
VLDLVLDL
LDLLDL
Cholesterol Pool
Cholesterol Pool
SDLDLSDLDL

SDLDLSDLDL
Tissue Uptake
Tissue Uptake
IDLIDL
ExtrinsicSourcesExtrinsicSources
De NovoSynthesisDe Novo
Synthesis
LDLLDL
AssemblyAssembly
BileBile
LipoproteinsLipoproteins
VLDLVLDL
LDLLDL
Cholesterol Pool
Cholesterol Pool
SDLDLSDLDL

Tissue Uptake
Tissue Uptake
IDLIDL
ExtrinsicSourcesExtrinsicSources
De NovoSynthesisDe Novo
Synthesis
LDLLDL
AssemblyAssembly
BileBile
LipoproteinsLipoproteins
VLDLVLDL
LDLLDL
Cholesterol Pool
Cholesterol Pool
SDLDLSDLDL
SDLDLSDLDL

Tissue Uptake
Tissue Uptake
IDLIDL
ExtrinsicSourcesExtrinsicSources
De NovoSynthesisDe Novo
Synthesis
LDLLDL
AssemblyAssembly
BileBile
LipoproteinsLipoproteins
VLDLVLDL
LDLLDL
Cholesterol Pool
Cholesterol Pool
SDLDLSDLDL
LDLLDL

LDLLDL
Tissue Uptake
Tissue Uptake
IDLIDL
ExtrinsicSourcesExtrinsicSources
De NovoSynthesisDe Novo
Synthesis
LDLLDL
AssemblyAssembly
BileBile
LipoproteinsLipoproteins
VLDLVLDL
LDLLDL
Cholesterol Pool
Cholesterol Pool
SDLDLSDLDL

Infiltration of LDL Infiltration of LDL
LDLLDLLDLLDL
VLDLVLDL VLDLVLDL
IDLIDL

LDLLDL
Infiltration of LDL Infiltration of LDL
LDLLDL
VLDLVLDL VLDLVLDL
IDLIDL
LDLLDL LDLLDL

LDLLDL
Infiltration of LDL Infiltration of LDL
VLDLVLDL VLDLVLDL
IDLIDL
LDLLDL
SDLDLSDLDL
SDLDLSDLDL

The Problem With Treating Only NumbersThe Problem With Treating Only Numbers

The Metabolic SyndromeThe Metabolic Syndrome
Prothrombotic StateProthrombotic State HypertensionHypertension
DyslipidemiaDyslipidemia
Insulin ResistanceInsulin Resistance
Prothrombotic StateProthrombotic State

Prothrombotic StateProthrombotic State

Increased plasma fibrinogenIncreased plasma fibrinogen
Increased plasminogen activator Increased plasminogen activator inhibitor 1inhibitor 1
Increased platelet aggregabilityIncreased platelet aggregability
Factors Promoting Thromboembolic Disease in Diabetes
Thompson SG et al. N Engl J Med 1995;332:635-641.

PA
I-1
ant
igen
(ng
/mL
)
35
30
25
20
15
10
5
0NGT
(n=693)IGT
(n=348)Type 2 diabetes
(n=510)
P<0.001, adjusted for age, gender. Mean SE.
GT=glucose tolerance; IGT=impaired glucose tolerance; PAI-1=plasminogen activator inhibitor-Festa et al. Arterioscler Thromb Vasc Biol 1999;19:562–568.
Plasma concentration of PAI-1 in Plasma concentration of PAI-1 in normal subjects, IGT, and type 2 diabetesnormal subjects, IGT, and type 2 diabetes

Vascular endothelium
Free t-PA activates plasmin, Free t-PA activates plasmin, leading to fibrinolysis and leading to fibrinolysis and
reducing the risk of reducing the risk of thrombosisthrombosis
PAI-1 t-PAt-PA
PAI-1 t-PAt-PA
PAI-1 complexes and PAI-1 complexes and inactivates t-PAinactivates t-PA
Plasmin
t-PAt-PA
PlateletsPlatelets
t-PAt-PAPlasminogen
Kohler HP & Grant PJ. N Engl J Med 2000; 342:1792–1801.
PAI-1 BloodstreamBloodstream
PAI-1 and inhibition of fibrinolysis
PAI-1 and inhibition of fibrinolysis

The Metabolic SyndromeThe Metabolic Syndrome
Prothrombotic StateProthrombotic State HypertensionHypertension
DyslipidemiaDyslipidemia
Insulin ResistanceInsulin Resistance
HypertensionHypertension

HypertensionHypertension

Hypertension, Glucose Intolerance and CHD
Hypertension, Glucose Intolerance and CHD
0
50
100
150
200
Ag
e A
dju
ste
d C
V E
ve
nt
Ra
te /
10
00
105 135 165 195Systolic BP (mm Hg)
No GlucoseIntolerance
GlucoseIntolerance
0
50
100
150
200
Ag
e A
dju
ste
d C
V E
ve
nt
Ra
te /
10
00
105 135 165 195Systolic BP (mm Hg)
No GlucoseIntolerance
GlucoseIntolerance
Kannel WB, et al. Am Heart J. 1991;121:1268-1273.
MenMen
0
50
100
150
200
Ag
e A
dju
ste
d C
V E
ve
nt
Ra
te /
10
00
105 135 165 195Systolic BP (mm Hg)
No GlucoseIntolerance
GlucoseIntolerance
0
50
100
150
200
Ag
e A
dju
ste
d C
V E
ve
nt
Ra
te /
10
00
105 135 165 195Systolic BP (mm Hg)
No GlucoseIntolerance
GlucoseIntolerance
WomenWomen

-P-H-P+H
+P-H+P+H
0
500
1,000
Sta
nd
ar d
ized
m
ort
ality
rati
oProteinuria and Hypertension Proteinuria and Hypertension
in Type 2 Diabetesin Type 2 Diabetes
Status of Proteinuria (P) and Status of Proteinuria (P) and Hypertension (H) in Type 2 DiabeticsHypertension (H) in Type 2 Diabetics
-P-H
Men
-P+H +P-H +P+H
Women
Wang SL, et al. Diabetes Care. 1996;19:305-312. Copyright ©1996, American Diabetes Association. Reprinted with permission.

1.0
0.9
0.8
0.7
0.6
0.5
0 1 2 3 4 5 6
Years
Su
rviv
al (a
ll-c
au
se m
ort
ality
)
NormoalbuminuriaNormoalbuminuria(n=191)(n=191)
MicroalbuminuriaMicroalbuminuria(n=86)(n=86)
MacroalbuminuriaMacroalbuminuria(n=51)(n=51)
P<0.01 normoalbuminuria vs microalbuminuriaP<0.001 normoalbuminuria vs macroalbuminuriaP<0.05 microalbuminuria vs macroalbuminuria
Proteinuria as a Risk Factor Proteinuria as a Risk Factor for Mortality in Type 2 Diabetesfor Mortality in Type 2 Diabetes
Gall MA, et al. Diabetes. 1995;44:1303-1309.Copyright ©1995, American Diabetes Association. Reprinted with permission.

The Metabolic SyndromeThe Metabolic Syndrome
Prothrombotic StateProthrombotic State HypertensionHypertension
DyslipidemiaDyslipidemia
Insulin ResistanceInsulin ResistanceInsulin ResistanceInsulin Resistance

Insulin ResistanceInsulin Resistance

Interrelation Between Atherosclerosis and Interrelation Between Atherosclerosis and Insulin ResistanceInsulin Resistance
HypertensionHypertension
ObesityObesity
HyperinsulinemiaHyperinsulinemia
DiabetesDiabetes
HypertriglyceridemiaHypertriglyceridemia
Small, dense LDLSmall, dense LDL
Low HDLLow HDL
HypercoagulabilityHypercoagulability
InsulinInsulinResistanceResistance
InsulinInsulinResistanceResistance AtherosclerosisAtherosclerosisAtherosclerosisAtherosclerosis

Therapy for Insulin ResistanceTherapy for Insulin Resistance
• Exercise
• Weight control
• Diet
• Smoking cessation
• Thiazolidinediones– Pioglitazone – Rosiglitazone
• Metformin
Pharmacologic:Pharmacologic:Nonpharmacologic::Nonpharmacologic::

Therapy for Metabolic SyndromeTherapy for Metabolic Syndrome

The Metabolic SyndromeThe Metabolic Syndrome
Prothrombotic StateProthrombotic State HypertensionHypertension
DyslipidemiaDyslipidemia
Insulin ResistanceInsulin Resistance

Treatment of Metabolic SyndromeTreatment of Metabolic Syndrome
If T2DM: TZDs with or without If T2DM: TZDs with or without metforminmetformin
Insulin ResistanceInsulin Resistance
And HyperglycemiaAnd Hyperglycemia
ASA, Quit smokingASA, Quit smokingProthrombotic StateProthrombotic State
ACE I or ARBsACE I or ARBsHypertension Hypertension (and/or (and/or endothelial dysfunction)endothelial dysfunction)
Statins and/or FibratesStatins and/or FibratesDyslipidemiaDyslipidemia
Lifestyle ModificationLifestyle ModificationCentral ObesityCentral Obesity
TreatmentTreatmentRisk FactorRisk Factor