Instrumented Becker Penetration Test I: Equipment...
38
1 Instrumented Becker Penetration Test I: Equipment, Operation, and Performance [Paper in review for publication in ASCE JGGE] Jason T. DeJong, M.ASCE 1 , Mason Ghafghazi, M.ASCE 2 , Alexander P. Sturm, S.M.ASCE 3 , Daniel W. Wilson, M.ASCE 4 , Joel den Dulk 5 , Richard J. Armstrong 6 , Adam Perez 7 , Craig A. Davis, M.ASCE 8 1 Professor, Department of Civil & Environmental Engineering, University of California at Davis, One Shields Ave., Davis, CA 95616, +1 (530) 754 – 8995, [email protected] 2 Assistant Professor, Department of Civil Engineering, University of Toronto, 35 St. George St., Toronto, ON M5S 1A4, +1 (416) 978 – 5972, [email protected] 3 Graduate Student, Department of Civil & Environmental Engineering, University of California at Davis, One Shields Ave., Davis, CA 95616, +1 (650) 580 – 2729, [email protected] 4 Associate Director, Center for Geotechnical Modeling, University of California at Davis, One Shields Ave., Davis, CA 95616, Phone: +1 (530) 754 – 9761, [email protected] 5 Mechanical Engineer, 533 Antioch Dr., Davis, CA 95616, [email protected] 6 Assistant Professor, Department of Civil Engineering, Sacramento State University, CSU Sacramento 6000 J St., Sacramento, CA 95819, +1 (916) 278 – 6812, [email protected] 7 Design Geotechnical Engineering Group Manager, Los Angeles Department of Water and Power, 111 N. Hope Street, Room 1368, Los Angeles, CA 90012, +1 (213) 367 – 0262, [email protected] 8 Trunk Line Design Manager, Los Angeles Department of Water and Power, 111 N. Hope Street, Room 1356, Los Angeles, CA 90012, +1 (213) 367 – 0769, [email protected]
-
Upload
vuongduong -
Category
Documents
-
view
230 -
download
0
Transcript of Instrumented Becker Penetration Test I: Equipment...
1
Instrumented Becker Penetration Test
I: Equipment, Operation, and Performance
[Paper in review for publication in ASCE JGGE]
Jason T. DeJong, M.ASCE1, Mason Ghafghazi, M.ASCE2, Alexander P. Sturm, S.M.ASCE3, Daniel W. Wilson, M.ASCE4, Joel den Dulk5, Richard J. Armstrong6, Adam Perez7,
Craig A. Davis, M.ASCE8
1 Professor, Department of Civil & Environmental Engineering, University of California at Davis, One Shields Ave., Davis, CA 95616, +1 (530) 754 – 8995, [email protected] 2 Assistant Professor, Department of Civil Engineering, University of Toronto, 35 St. George St., Toronto, ON M5S 1A4, +1 (416) 978 – 5972, [email protected] 3 Graduate Student, Department of Civil & Environmental Engineering, University of California at Davis, One Shields Ave., Davis, CA 95616, +1 (650) 580 – 2729, [email protected] 4 Associate Director, Center for Geotechnical Modeling, University of California at Davis, One Shields Ave., Davis, CA 95616, Phone: +1 (530) 754 – 9761, [email protected] 5 Mechanical Engineer, 533 Antioch Dr., Davis, CA 95616, [email protected] 6 Assistant Professor, Department of Civil Engineering, Sacramento State University, CSU Sacramento 6000 J St., Sacramento, CA 95819, +1 (916) 278 – 6812, [email protected] 7 Design Geotechnical Engineering Group Manager, Los Angeles Department of Water and Power, 111 N. Hope Street, Room 1368, Los Angeles, CA 90012, +1 (213) 367 – 0262, [email protected] 8 Trunk Line Design Manager, Los Angeles Department of Water and Power, 111 N. Hope Street, Room 1356, Los Angeles, CA 90012, +1 (213) 367 – 0769, [email protected]

2
ABSTRACT
The Becker Penetration Test (BPT) is a widely used tool for characterizing gravelly soils,
especially for liquefaction assessment. Interpretation of BPT data is complicated by the energy
transferred from the hammer to the drill string being variable and by the shaft resistance that
develops along the drill string generally increasing with penetration depth. Existing interpretation
methods that utilize above-ground measurements to interpret BPT measurements have had limited
success in accurately separating the shaft and tip resistance. Therefore, penetration resistance with
depth cannot be reliably predicted.
An instrumented Becker Penetration Test (iBPT), that measures acceleration and force
directly behind the driving shoe in order to compute the energy delivered to the driving tip, was
developed and integrated into the standard closed-ended Becker drill system. The equipment and
data acquisition system are described in this paper. The analysis procedure used to compute energy
normalized blow count values and produce continuous penetration resistance profiles are outlined.
The energy normalized blow count profiles generated are shown to be independent of penetration
depth, pre-drilling depth, shaft resistance magnitude, and hammer operating conditions. In
particular, the efficacy of a residual energy based normalization scheme is demonstrated. Finally,
a discussion regarding energy measurements, locked-in stress at the drill string tip, and the use of
the pull-back and re-drive procedure is presented.

3
INTRODUCTION
The use of in-situ penetration tests, namely the standard penetration test (SPT) and cone
penetration test (CPT), has become the standard of practice for characterizing the liquefaction
potential of cohesionless soils, largely because adequate sampling in these soils is prohibitively
difficult. Assessing the characteristics of gravelly soils using either SPT or CPT poses difficulties
due to large particle size – to – penetrometer diameter ratios (Daniel et al., 2004). In the case of
the SPT, gravel particles can clog or block the split-spoon sampler resulting in limited recovery
and/or unrepresentative blow counts. Depending on the abundance of large particles during cone
penetration, gravel particles can either completely block the advancement of the cone, or cause a
misalignment in the rods.
The BPT was widely adopted for liquefaction assessment (Harder and Seed, 1986) after
the 1983 Borah Peak, Idaho, earthquake, where extensive liquefaction was observed in gravelly
soils. The large diameter of the BPT device was particularly applicable in these coarse materials,
where it provided more repeatable results and fewer occurrences of refusals compared to smaller
scale split-spoon penetrometers (e.g. SPT).
Becker drilling was developed in Canada in the late 1950’s for oil explorations at gravel
sites (Sy and Campanella, 1994). It consists of driving a hollow, steel drill string into the ground
using a double-acting diesel hammer. The double-acting hammer is faster due to the additional
reaction force provided by compressing air in the bounce chamber above the ram. The BPT can be
performed open- or closed-ended using one of three different drill string diameters (140 mm [5 1/2
in], 168 mm [6 5/8 in], and 230 mm [9 in]). Disturbed bulk samples can be obtained during open-
ended drilling by transporting soil cuttings up the hollow drill string to the ground surface using

4
compressed air that is delivered to the tip via the casing annulus. For characterization of penetration
resistance, a closed-ended tip is used and the measured blows per foot (0.3 m) is correlated to soil
strength.
Despite having obvious benefits over other in-situ testing devices in gravelly soils, a
fundamental challenge exists when using the BPT for determining penetration resistances for
liquefaction assessment. Unlike the SPT, performed through an over-bored open hole, shaft
resistance accumulates as the Becker drill string is advanced into the ground. The shaft resistance
contributes to the number of blows required for penetration, leading to the measured penetration
resistance not directly reflecting the soil resistance beneath the drill string tip. Efforts to eliminate
shaft resistance by using an oversized driving shoe have produced inconsistent results due to
material caving (Wightman et al., 1993). Additionally, the utilization of drilling mud to reduce
shaft resistance (Sy and Lum, 1997) has proven impractical.
Harder and Seed (1986) standardized the BPT by recommending a standard equipment
configuration: a 168 mm (6 5/8 in) diameter drill string with a closed-ended, eight tooth, crowd-
out bit driven with an AP-1000 drill rig. They proposed a method that uses the bounce chamber
pressure to indirectly account for the energy transferred to the penetrometer. Harder and Seed
(1986) proposed an empirical correlation for estimating equivalent SPT blow count values from
the bounce chamber pressure normalized BPT blow count values. Although this method provided
the basis for standardization of the BPT equipment and of the procedures, the method does not
reliably estimate equivalent SPT blow count values since it does not account for the accumulated
shaft resistance.

5
Sy and Campanella (1994) proposed a more theoretically rigorous method to estimate the
energy transmitted to the drill string and account for the influence of shaft resistance in estimation
of the tip penetration resistance. The energy transmitted to the top of the drill string is directly
measured using pile driving analysis (PDA) equipment and used in a two stage wave equation
analysis process (Rausche et al., 1972). CAPWAP analyses are first used to estimate the shaft
resistance followed by WEAP analyses which are used to correct the blow count values to what
would have been recorded had no shaft resistance been present. They proposed a set of BPT-SPT
correlations that depend on the estimated static shaft resistance. The method presented by Sy and
Campanella (1994) made significant advances in measuring the energy transmitted to the drill
string and understanding the mechanisms affecting the BPT results. However, limited validation,
inherent uncertainty in the wave equation analyses, and the compound effects of the underlying
assumptions have led to inconsistent results.
Applying the two BPT interpretation methods (Harder and Seed, 1986; Sy and Campanella,
1994) often produces significant differences in the estimated equivalent SPT N60 values. The
Harder and Seed method will produce different values for a given depth when different amounts
of shaft resistance exist in two adjacent soundings. The Sy and Campanella method will produce
different equivalent N60 values when different practitioners use the same measured acceleration-
force data set due to differences in how the CAPWAP analyses are performed. For a given project
it is not possible to know which, if either, of these methods correctly estimate equivalent SPT N60
values. The inaccuracy in these methods has become an acute challenge in liquefaction assessment
for gravelly soil deposits at depth and where softer soils underlie stiffer soils (e.g. foundation strata
beneath dams). In these latter cases the shaft resistance absorbs the majority of the energy delivered

6
by the hammer; thus, the above methods cannot accurately characterize these soft layers since they
do not reliable measure, or correct for, the shaft resistance.
This paper describes the development, integration, and validation of a new instrumented
Becker Penetration Test (iBPT) system that is fully integrated with the standard closed-ended
Becker drill string. Most importantly, the iBPT system measures the acceleration and force 0.5m
(1.5 ft) behind the drill string tip in order to compute the energy arriving at this point. Hereinafter
it is stated that these measurements and the subsequently calculated energy occur ‘at the tip’ as it
is not practically possible to mount the gages directly on the BPT drill string tip and the difference
in energy delivered to the tip and gage location is negligible. Computing the energy based on direct
measurements at the drill string tip eliminates the effect of shaft resistance on normalized blow
count values. Herein the iBPT equipment design and data acquisition system are described. The
processes for analysis and integration of the collected data to produce continuous, energy-
normalized blow count profiles, are outlined. The repeatability of normalized blow count profiles
produced is assessed and the robustness of the energy normalization scheme for calculation of the
normalized blow count values is established. The ability of the method to produce consistent
results with variable shaft resistance (or pre-drilling) is documented. Finally, a discussion
regarding energy measurements, locked-in stress at the drill string tip, and use of the pull-back and
re-drive procedure is presented.
iBPT SYSTEM
The instrumented Becker Penetration Test (iBPT) is a site investigation tool that measures
the energy normalized penetration resistance of soil beneath the drill string tip. The equipment
design goal of the iBPT was to obtain direct measurements of acceleration and force at the drill

7
string tip using robust, reliable, low maintenance equipment with commercial-level performance.
Advances in sensor technology and the availability of robust, smaller, and faster data acquisition
systems at reasonable cost have only recently made the iBPT, that is presented herein, possible.
The instrumented Becker Penetration Test (iBPT) equipment consists of 0.6 m (2 ft) long,
168 mm (6 5/8 in) diameter, pipe sections (hereinafter referred to as iBPT sections) which are
added to the drill string as shown in Figure 1a and b. Two instrumented sections, one located
directly behind the drill string tip (hereafter referred to as the ‘tip’ location) and a second located
above ground directly below the hammer (hereafter referred to as the ‘head’ location), were used
in iBPT development and are used in standard operation. Therefore, measurements from this setup
are presented herein. However, only the tip instrumented section is essential for calculation of the
iBPT energy normalized tip resistance. Data collected at the drill string tip is processed by a small,
robust, in-pipe data acquisition module that digitally transmits the data to an above-ground host.
A parallel conventional field data acquisition system (Figure 1c) collects data from the iBPT head
unit and other above above-ground sensors (bounce chamber pressure, string potentiometers). The
overall operation of the iBPT system occurs in a small, mobile trailer.
Four strain transducers are mounted inside the iBPT sections, equidistant around the
circumference, to measure axial strain. Two diametrically opposite strain transducers are wired in
pairs, yielding two average measurements of axial strain to minimize sensitivity to bending. Two
accelerometers are mounted coincidently with two of the four strain transducers; producing two
measurements of pipe motion. The transducers are secured to the inside of the iBPT pipe sections
with two bolts using special tools to ensure axial alignment with no preloading. The strain
transducers have an accuracy of ±2% and can measure up to 2,000 micro-strain. The piezo-resistive

8
critically damped accelerometers have accuracy of ±1%, a capacity of 2,000 g, and a natural
frequency above 10 kHz. Thermistors enable measurement of temperature change in the iBPT
section near the sensors. Extensive laboratory and field testing was performed to ensure reliability
and robustness of the measurements. All sensors conform to, or exceed, ASTM D4633 (2010) and
D4945 (2012) standards on energy measurement for dynamic penetrometers and dynamic testing
of deep foundations.
A computer module is installed inside the iBPT section at the tip for data acquisition. A
shock absorption system limits the impact acceleration experienced by the electronics to 50 g, a
reduction from the 2,000+ g experienced by the iBPT sections. The data acquisition provides
excitation (power) to the sensors, receives the analog signals, gains (magnifies) the signals,
conditions the signals with a low pass filter, and digitizes the signals at 14.4 kHz per channel before
transmitting them via a Controller Area Network (CAN) bus to the above-ground host. To ensure
the entire dynamic wave is captured, the operator specifies the recorded signal duration. The 14.4
kHz sampling frequency enables recorded measurement signal frequencies of up to 7.2 kHz
(Nyquist frequency). Extensive testing with higher sampling frequencies confirmed that the 14.4
kHz sampling frequency fully captures Becker hammer dynamic impacts (which have typical
frequency contents less than 2 kHz).
The two accelerometers and four strain gage transducers located within the head section
(directly below the Becker hammer) are individually connected to the above-ground data
acquisition unit in the trailer. This enables more efficient operation of the in-pipe data acquisition
module in the head section and allows for independent recording of all four strain gages to monitor
pipe bending.

9
In addition, a 6.35 m (20.8 ft) string potentiometer is connected to a collar mounted on the
drill string head to measure displacement per blow and to track the depth during driving. The
hammer bounce chamber pressure is continuously measured using a 3.4 MPa (500 psi) pressure
transducer. The bounce chamber pressure and string potentiometer data are utilized by the data
acquisition system to automatically log the number of blows per foot.
The iBPT system can also collect force and displacement data during static pull-back
(tension pull-out) tests to measure the static shaft resistance versus displacement curve. Two short
stroke (0.32 m, 12.5 in), high accuracy string potentiometers, mounted to an isolated reference
frame, monitor the pull-back displacement. The amount of force required for pull-back is recorded
using the head section strain gages that are also used for dynamic measurements. Force-
displacement curves are produced in real time to determine when the maximum static resistance is
reached.
The equipment is fully integrated within the standard (168 mm, 6 5/8 in) closed-ended
Becker system and comprised of modular components that enable reliable operation and rapid
repairs for deployment on industry projects. Individual segments of the downhole communication
cable are installed inside each 1.5 or 3 m (5 or 10 ft) Becker pipe at the beginning of a field program
and connections are made and broken as pipe sections are added and removed, respectively, during
driving and removal of pipe sections. Data acquisition operations are performed in an enclosed
trailer, which enables mobilization to any location that a BPT rig can access. The level of
operational efficiency and reliability are critical to the success of iBPT investigations, as the high
cost of drilling does not allow for extensive delays.

10
MEASUREMENTS AND DATA PROCESSING
The strain and acceleration values measured at the tip and in the head unit are processed to
generate energy normalized blow count values. Driving forces are calculated from the strain gage
measurements with the cross-sectional area (A) and Young’s modulus (Es) of the iBPT sections. A
baseline correction is applied to the dynamic force measurements by referencing a ‘quiet time’
(flat-line signature) prior to the impact arrival. At the drill string tip, the baseline reading includes
a locked-in residual force (FR) which is due to the generation of an upwards force caused by the
elastic rebound of the soil below the tip (discussed in detail in the Discussion section); the locked-
in residual force is balanced by an opposing resultant downward force along the shaft. A
temperature correction is also applied to correct for the strain that is induced by the differential
thermal expansion of the steel pipe and aluminum strain gages as the gages are heated by the shaft
friction during driving.
A baseline correction is performed on accelerations by referencing a quiet time prior to the
impact arrival. The measured acceleration time histories are integrated to produce velocity time
histories. Often a minute post impact residual velocity is calculated after integration of
accelerations. This residual velocity is an artifact of the physical and electronic noise produced
within the accelerometers. To correct this post-impact residual velocity to zero, a baseline is fit
through the recorded data during the post-impact quiet time. A half cosine baseline shift function
is applied during the impact to generate a smooth baseline correction between the zero pre- and
post-impact velocities.
Conventionally, the velocity is multiplied by the impedance of the section (Z = EsA/c) and
plotted alongside force in pile dynamic analyses (e.g. Rausche et al., 1972), as shown in Figure 2,

11
for both head and tip sections. Es is the Young’s Modulus of the steel, A is the cross sectional area
of the drill string, and c is the wave velocity (c = √ Es /ρ). The time required for the wave to travel
to the bottom of the drill string and back (2L/c) is also indicated as dashed lines in the figure. The
wave measured at the head arrived at the tip with a delay of L/c.As expected, exact force-velocity
proportionality was not observed at the head section between 0 and 2L/c after the hammer impact,
due to the reflection waves caused by shaft resistance, connections, and drill-string non-
uniformities.
Displacements are calculated by integrating velocity time histories. Representative
displacement time histories for both the head and the tip section are shown in Figure 2. The residual
displacements calculated at the head and tip sections were similar due to the very stiff Becker drill-
string. The displacement measurements also matched the directly measured values obtained with
the above-ground string potentiometer. The agreement between measured displacements
determined using different approaches provided additional confidence in the quality of the
measurements.
ENERGY CALCULATION AND NORMALIZING BLOW COUNTS
The number of blows per foot of penetration, or measured blow count value, NB, are
calculated by using the depth measured by the string potentiometer and the continuous bounce
chamber pressure data. The number of peaks in bounce chamber pressure that occur in each foot
of driving are reported as the blow count value.
The amount of energy delivered by the hammer (E), defined in a normalized manner
consistent with how the SPT hammer energy is defined (and the energy hammer ratio as is

12
conventional for pile driving), is calculated by integrating the measured force (F) multiplied by
velocity (V) over the impact time (t). The energy is expressed as a percentage of the rated
(theoretical) ICE 180 hammer energy (11.0 kJ),
𝐸 % = %&'()).+,-
[1]
At the tip, the force includes both the dynamic and the locked-in forces. The energy time
history for both the head and tip sections are also plotted in Figure 2. The energy reached a peak
value Emax (or ENTHRU) before reducing to a residual value Eres (or Efnl in pile driving). The
reduction in the amount of energy after the peak was caused by elastic rebound within the drill
string and within the soil below the tip; Eres reflects the energy delivered to the soil below the tip.
The difference between the peak and residual energy is typically more pronounced at the head
section due to the elastic rebound within the drill string. Therefore, as addressed further in the
Discussion section, Eres was mechanistically more appropriate than Emax (ENTHRU) for
normalizing the residual, or permanent, displacements.
The difference between the amount of energy measured at tip and head can be attributed to
the amount of energy absorbed by shaft resistance. The ratio of the residual energy at the tip to the
residual energy at the head, defined as the delivered energy ratio (ERT/H), quantifies the energy
absorbed by shaft friction.
𝐸𝑅//1 =2345,7892345,:4;<
[2]
Higher ERT/H values indicate that more energy was transmitted to the tip (i.e. less energy was lost
to shaft resistance), and vice versa.

13
The energy normalized blow count, NB30, is computed by normalizing the measured blow
count values, NB, to 30% reference energy (Sy and Campanella, 1994) using Eres at the tip section:
𝑁>?+ = 𝑁>2345,789?+
[3]
In this equation, Eres,Tip is the amount of residual energy at the drill string tip, as averaged over
each foot of driving. The energy normalized blow count value, NB30, is the main output of the iBPT
system and represents penetration resistance; it is analogous to the N60 value for SPT. (It is noted
that NB30 defined here is different from that defined by Sy and Campanella (1994), who used the
maximum energy measured at the head (Emax,Head or ENTHRU) instead of the residual energy
measured at the tip Eres,Tip in Equation 3.)
EXAMPLE iBPT OUTPUT
An example set of results from the iBPT system is presented in Figure 3. The raw blow
count (NB) profile in Figure 3a contains large variations with depth, which reflect the stratigraphic
depositional variations at the site. The residual energy (Eres) profiles, presented in Figure 3b, show
the hammer energy delivered to the drill string at the head (Eres,Head) as well as the remaining
energy that is transmitted to the tip (Eres,Tip). The Eres at the head ranged from 20% to 45%
throughout the sounding, and is similar to the 30% energy used as reference. In contrast, the Eres
delivered to the tip generally decreases with depth, as shaft friction accumulates, eventually
decreasing to values less than 5%.
There is a steady decay of ERT/H due to an increase in shaft resistance with penetration
depth as shown in Figure 3c. Shaft resistance can accumulate rapidly with depth, resulting in ERT/H
values of less than 5% after only 10 m (33 ft) of driving (as observed in some compacted

14
embankments). Alternatively, shaft resistance can accumulate more slowly, resulting in ERT/H
values near 40% after 30.5 m (100 ft) of driving (Figure 3c). When soft layers are encountered
(e.g. at 18 m (60 ft) depth in Figure 3c), the energy delivered to the tip can be further reduced as
the soil below the tip is less stiff than the soil acting along the shaft. This observed reduction is a
crucial reason why direct measurements at the drill string tip are important for detection of weak
layers at depth.
The energy normalized blow count (NB30) profile, as shown in Figure 3d, is the main output
of the iBPT system. The NB30 values can be correlated with other penetration test results (e.g. SPT
N60 as presented in the companion manuscript) for site characterization. The continuous profile
with depth enables detection of thin, weaker layers. The ability of the iBPT to produce reliable
results in a wide range of soil types makes it a valuable investigation tool for sites where the
presence of gravelly and cobbly soils limits the application of other penetration tests.
FIELD TESTING
Four extensive field programs have been completed to date. These programs have provided
data across a wide range of soil and drilling conditions. The first site, the Headworks West
Reservoir, is founded on alluvial deposits from the original alignment of the Los Angeles River,
as such there is in significant vertical and horizontal variability in the subsurface. Sixteen iBPT
soundings (406 linear m, 1,332 linear ft total) were performed with penetration depths ranging
between 12 and 38 m (40 and 125 ft). Gravelly and cobbly materials were frequently encountered
in all soundings. The blow count values were generally high with occasional low resistance zones.
The variable site conditions provided an opportunity for testing the robustness of the equipment
and for developing an understanding of the range and quality of the iBPT measurements.

15
The second site, the new alignment for North Haiwee Dam, is located along the
southeastern edge of the Sierra Nevada mountain range in Eastern California. The relatively calm
hydro-geologic, depositional environment created a relatively uniform soil profile in both the
vertical and lateral directions. Soils at the site consisted of silty sand and clean sand deposits with
occasional gravelly lenses. Ten soundings (248 linear m, 813 linear ft) were performed with
penetration depths ranging between 18 and 29 m (60 and 95 ft). The site homogeneity was
conducive to perform side-by-side soundings (spaced ~3 m apart) to investigate the performance
of the iBPT system.
The third site, the Stone Canyon Dam, is located within a narrow canyon in the city of Los
Angeles. The arroyo, alluvial foundation beneath the dam is comprised of highly interlayered and
intermixed low plasticity clays and sands with frequent gravel-sized, slate fragments. There is
significant variability in the alluvium; however, the man-made, dam embankment units are
relatively homogeneous. Eight soundings (166 linear m, 546 linear ft) were performed with
penetration depths reaching 51 m (168 ft). The compacted dam materials required pre-drilling with
a 190 mm (7 ½ in) oversized bit before the Becker penetrometer could reach the underlying
alluvium of concern. The pre-drilling sequence and homogeneity of the man-made dam units
enabled assessment of the influence of varying shaft resistance on iBPT measurements.
The fourth site, Bouquet Canyon Dam, is located near the city of Palmdale, California. The
alluvial foundation beneath the dam is comprised of an upper, sandy, alluvium and a lower,
gravelly, alluvium which is underlain by highly weathered bedrock. The investigation, performed
for liquefaction assessment of the foundation and toe materials of the existing dam, consisted of
eight borings (100 linear m (330 linear ft) in total; boring depths from 12 m (39 ft) to 46 m (150
16
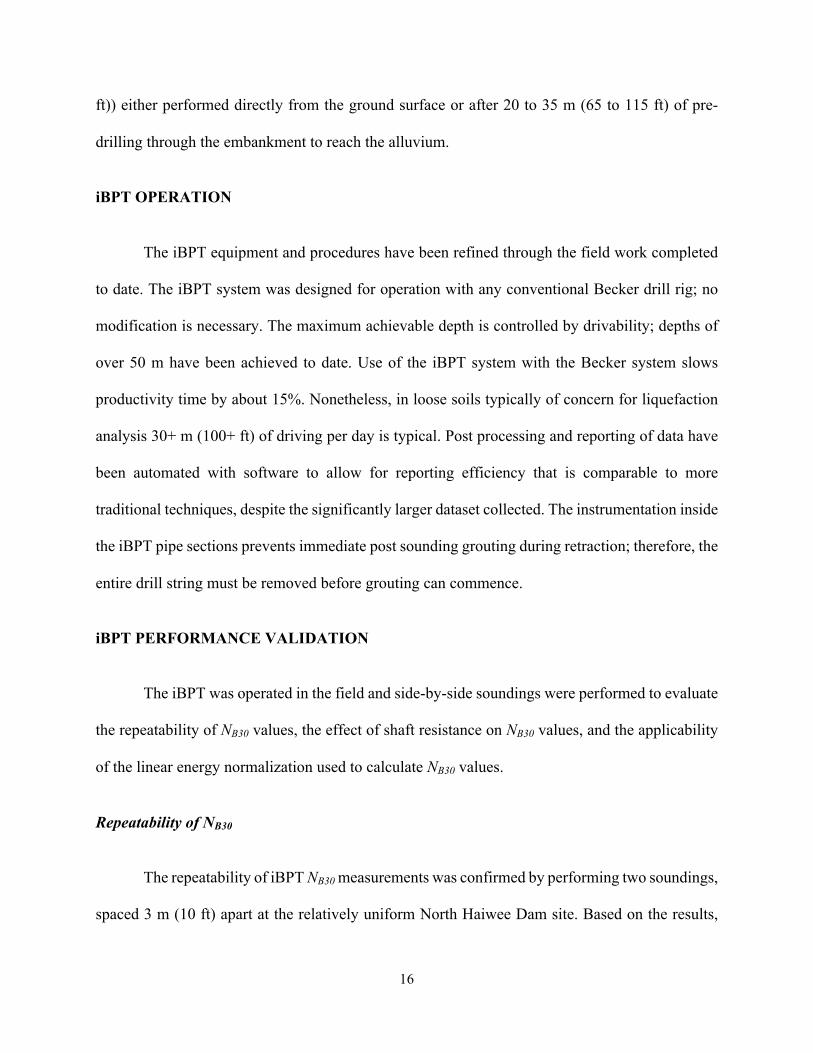
ft)) either performed directly from the ground surface or after 20 to 35 m (65 to 115 ft) of pre-
drilling through the embankment to reach the alluvium.
iBPT OPERATION
The iBPT equipment and procedures have been refined through the field work completed
to date. The iBPT system was designed for operation with any conventional Becker drill rig; no
modification is necessary. The maximum achievable depth is controlled by drivability; depths of
over 50 m have been achieved to date. Use of the iBPT system with the Becker system slows
productivity time by about 15%. Nonetheless, in loose soils typically of concern for liquefaction
analysis 30+ m (100+ ft) of driving per day is typical. Post processing and reporting of data have
been automated with software to allow for reporting efficiency that is comparable to more
traditional techniques, despite the significantly larger dataset collected. The instrumentation inside
the iBPT pipe sections prevents immediate post sounding grouting during retraction; therefore, the
entire drill string must be removed before grouting can commence.
iBPT PERFORMANCE VALIDATION
The iBPT was operated in the field and side-by-side soundings were performed to evaluate
the repeatability of NB30 values, the effect of shaft resistance on NB30 values, and the applicability
of the linear energy normalization used to calculate NB30 values.
Repeatability of NB30
The repeatability of iBPT NB30 measurements was confirmed by performing two soundings,
spaced 3 m (10 ft) apart at the relatively uniform North Haiwee Dam site. Based on the results,

17
presented in Figure 4, the raw blow count values and amount of energy delivered to the tip were
consistent between the two soundings. After energy normalization, the resulting NB30 profiles were
practically identical. The level of repeatability between these iBPT profiles is comparable to that
observed in CPT data from the same site and better than that observed in SPT data.
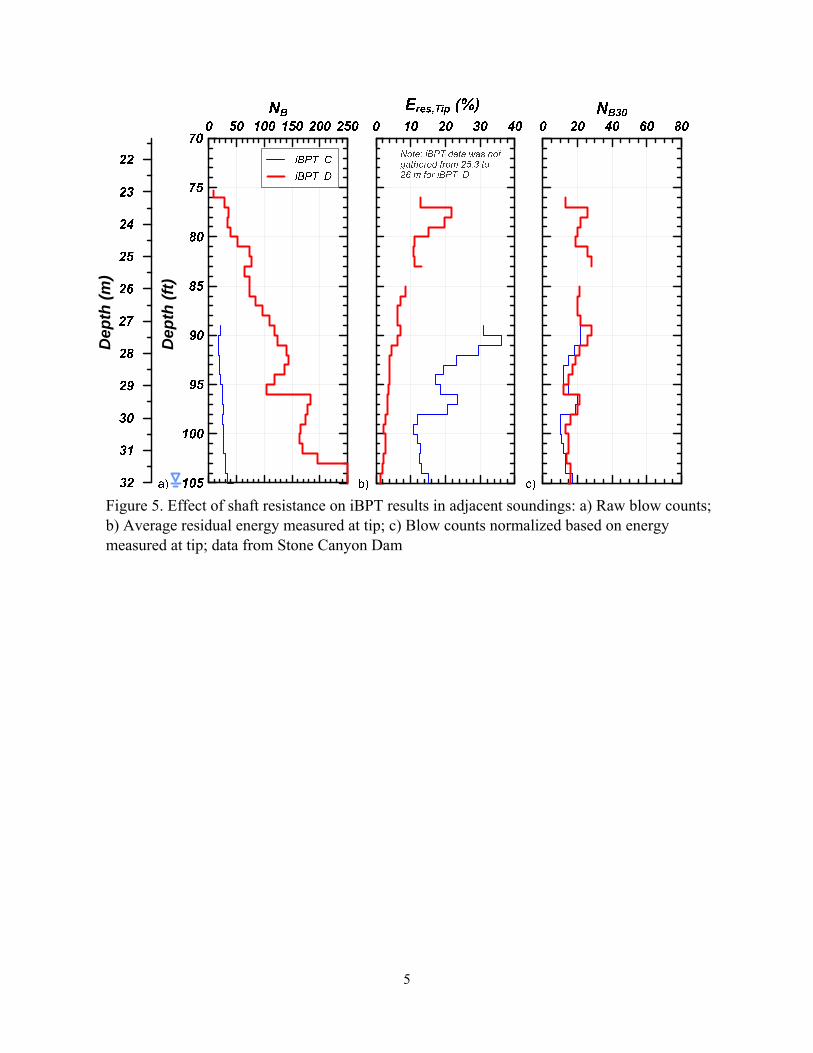
Effect of Shaft Resistance on NB30
iBPT NB30 values were confirmed to be independent of the amount of shaft resistance by
comparing the results from two soundings that were predrilled to different depths in order to obtain
data in penetration through the same alluvium with different magnitudes of shaft resistance.The
adjacent soundings, performed at the Stone Canyon Dam site at 3 m (10 ft) spacing, are presented
in Figure 5. In these soundings the pre-drilling depths were staggered, with the first being
predrilled to a depth of 23 m (75.5 ft) while the other was predrilled to a depth of 27 m (88.6 ft).
This resulted in significantly different amounts of shaft resistance at certain depth intervals (e.g.
23.5 to 32 m, 76 to 105 ft and 27 to 33 m, 89 to 109 ft).
Different amounts of energy were delivered to the tip in the two soundings due to the
difference in the amount of shaft resistance (Figure 5b). For example, in sounding ‘iBPT C’ in
Figure 5b at about 32 m (105 ft), less than 2% energy is delivered to the tip. At the same depth in
sounding ‘iBPT D’ about 13% energy was delivered to the tip. However, when energy
normalization was applied (per Eq. 3), the computed 𝑁>?+ values from the two soundings were
practically identical.

18
Energy Normalization of NB30
The energy normalization (Eq. 3) is based on the assumption that the number of hammer
blows required to advance the penetrometer is inversely proportional to the average energy that is
transferred to the soil by each blow. The normalization is fundamentally based on the
proportionality between the amount of plastic work that is input to the system and the amount of
plastic deformations that are incurred in the soil. Energy normalization, for all dynamic penetration
tests, are commonly based on the same assumption (e.g. Schmertmann and Palacios, 1979).
The energy normalization proportionality was confirmed for the iBPT system, and is
exemplified herein by using multiple pairs of adjacent soundings (3 m, 10 ft spacing) at the North
Haiwee Dam (Figure 6) and Headworks West Reservoir (4.5 m, 15 ft spacing) sites. In each pair
of soundings, one sounding was performed using ‘high’ hammer energy and the second was
performed using ‘low’ energy. The Becker hammer energy is controlled by the fuel throttle
controls; high energy consisted of full-throttle with the turbo charger operating, while low energy
consisted of operation at ¼ to ½ of full-throttle and no turbo charger operating. Based on the pair
of example soundings in Figure 6, differences in raw blow counts (NB, Figure 6a) and residual
energies measured at the tip (Eres,Tip, Figure 6b), resulting from the differenced in energy input by
the hammer throttle settings, coalesce into nearly identical NB30 profiles (Figure 6c). The
differences in NB30 values between a depth of 2 and 5 m (7 to 16 ft) resulted from the heterogeneity
of the randomly placed fill.
The measurements from the aforementioned tests are summarized in Figure 7 where the
raw (per foot) blow counts from the higher energy sounding were divided by the corresponding
lower energy sounding, resulting in ratios less than unity on the vertical axis. The associated

19
average per foot energies measured at the tip (Eres,Tip) during the lower energy sounding were
divided by those from the higher energy sounding, again resulting in ratios less than unity on the
horizontal axis. A sample calculation is presented in Figure 7a for reference. Ideally, energy
normalization and homogeneous soil deposits would result in the data aligning withthe 1:1 line.
The data presented generally align with the 1:1 line with no bias (Figure 7b), confirming that
energy normalization according to Eq. 2 will result in near identical NB30 profiles, in identical
strata, independent of the amount of hammer energy applied.
The data closer to the origin in Figure 7b represent the highest difference between the
energies arriving at the tip in adjacent soundings and are thus most relevant toward supporting the
linearity of energy normalization. The data plotted in the upper right corner of Figure 2b, represent
repeatability of the drilling operation since similar blow counts were achieved in the same strata
when similar energies arriving at the tip. Additional data, presented from Figure 5, where
differences in shaft resistance led to different energies arriving at the tip, plot closer to the origin
and provide additional support for the provided energy normalization methodology. The largest
spread in Figure 7b is clustered in the upper right corner, at ratios greater than about 0.6. These
data (open circles) are from the sounding that were presented in Figure 4.
The data presented close to the origin in Figure 7b represent energy normalization by a
factor as large as ten with Eres,Tip values as low as 2%. There is a small bias at such extremes
because driving at lower energy is less efficient than driving at high energies due to the greater
plastic work loss in the larger number of unload-reload loops. Nevertheless, based on the data,
negligible bias was observed for all practical purposes. The potential for such bias is minimized

20
when the energy was measured at the tip compared to head measurements which were also
influenced by the shaft resistance and the associated non-linearity.
DISCUSSION
Above-ground energy measurements have been routinely used for normalizing blow counts
obtained from dynamic penetration tests. A similar approach was adopted for the iBPT system
with additional considerations and improvements discussed in this section. First, the contribution
of the locked-in residual force on the energy measurement at the tip is discussed. Then, the
importance of using the residual energy, instead of the maximum energy, for energy normalization
of blow counts is highlighted. Finally, the merits of pull-back and re-drive procedures, commonly
used in Becker penetration testing, are elaborated.
Locked-in Residual Force at the Tip
A locked-in, compressive, residual force (FR) develops at the drill string tip due to the
opposing downward resultant force along the drill string caused by the elastic soil rebound at the
end of hammer blows. The drill string weight also contributes to the locked-in residual force. The
locked-in residual force gradually develops with driving; it typically increases with depth and is
proportional to the soil stiffness below the tip. The locked-in residual force contributes to the
amount of work done on the soil during each hammer blow; therefore, it is included in the energy
calculation presented in Equation 1. Schmertmann and Palacios (1979) identified a similar effect
caused by the weight of rods for SPT energy calculations.
The contribution of the locked-in residual force to the residual energy at the tip (𝐸@AB,/CD)
is the product of the residual force and the residual displacement for each hammer impact. The

21
locked-in residual force can exceed 200 kN, which can contribute up to 5% energy to the residual
energy measured at the tip, depending on the displacement caused by a given hammer impact. The
contribution of the locked-in residual force to the residual energy at the tip is more pronounced
when less energy is delivered to the tip by the hammer. For example, in Figure 5b between the
depths of 30.5 and 32 m (100 and 105 ft), up to two thirds of the residual energy reported at the
tip is associated with the work done on the soil by the locked-in residual force. The near perfect
match obtained between NB30 values (Figure 5c) was only possible after measuring and including
the contribution of the locked-in residual force to the energy measured at the tip.
Energy Calculation
Energy measurement in dynamic penetration tests has been guided by developments in the
SPT. Research into the amount of energy that a hammer system can deliver to a drill string was
initiated by the realization that driving energy significantly affects the measured blow count.
Kovacs (1979) monitored the hammer velocity immediately before the impact and developed
guidelines for the effects of hammer configuration and drop height on the measured blow counts.
Schmertmann and Palacios (1979) developed a strain gage based system for measuring the force,
and thus the energy delivered to the drill string. Both approaches targeted measuring the maximum
energy delivered to the drill string because the residual energy, transferred at the end of the impact,
could not be reliably measured at the time. Schmertmann and Palacios (1979) used force-velocity
proportionality during the first 2L/c time interval to compute the energy available to advance the
sampler into the ground. The approach, commonly known as the F2 method, uses Equation 4 to
calculate the energy. An assumption that the drill string connections do not cause any reflections
is also included.

22
𝐸𝐹2 = GH25
𝐹I𝑑𝑡 [4]
The rationale for imposing a cutoff at 2L/c was that arrival of the tension wave at that time ends
the contact between the hammer and the drill rods; therefore, no significant energy is transferred
to the sampler after that point in time.
Sy and Campanella (1991) measured the energy delivered to the SPT drill rods without
assuming force-velocity proportionality by utilizing a set of accelerometers in the instrumentation.
Sy and Campanella (1991) showed that the uniform rod assumption was not valid because
reflection waves, produced by the rod connections, cause an error in the amount of energy
measured by the F2 method. Subsequent research (e.g. Daniel et al., 2005) has also shown that the
hammer-rod contact can be lost before time 2L/c and additional impacts can occur at later times,
further advancing the sampler. In the Sy and Campanella (1991) approach, the energy (EFV) is
calculated by integrating the product of the force and velocity over the entire impact time.
𝐸𝐹𝑉 = 𝐹𝑉𝑑𝑡 [4]
In order to normalize SPT blow counts to a reference energy, Schmertmann and Palacios
(1979) adopted the Housel (1965) definition of ENTHRU which is defined as the maximum energy
transferred through the pile hammer-cushion-anvil system and delivered to the drill string. Using
ENTHRU was practically appealing as the peak energy was measured during the first 2L/c after
the impact. Advances in energy measurement techniques (e.g. piezo-resistive accelerometers) have
allowed for better measurement of the complete energy time history over the entire duration of the
impact. However, ENTHRU has remained the de facto index for SPT energy normalization.

23
In the iBPT method the measured residual energy at the tip is used to normalize penetration
values rather than the maximum energy (ENTHRU). The residual energy (the energy transferred
to the soil after reflections have attenuated) is a more appropriate index for normalizing blow
counts from penetration tests. Blow counts are associated with the permanent (plastic)
deformations induced in soil by each hammer impact. For example, the displacements shown
previously in Figure 2 exhibit peak values which reduce to the residual values following the
impact. This reflects the elastic rebound occurring in both the soil and the drill string during
driving. The residual energy represents the amount of energy used to permanently advance the
penetrometer and is consistent with the associated plastic deformation.
Utilizing the residual energy to compute energy normalizing blow counts is an
improvement in the fundamental assumptions of penetration testing. The difference between the
traditional peak energy (ENTHRU) and the proposed residual energy is less pronounced in the
iBPT tip measurements, as compared to the above-ground measurements, but the difference can
still be significant. SPT energy normalization which utilizes ENTHRU, as opposed to the residual
energy, may result in biased blow count values especially for long rods which will experience
more elastic rebound. This bias is likely embedded in the corrections for rod length and overburden
stress applied during SPT N60 calculation.
Pull-back and Re-drive
A pull-back and re-drive procedure has been implemented in practice, on occasion, in an
attempt to quantify the shaft resistance which accumulated during driving of the BPT. When this
procedure is utilized, driving is ceased and the drill string is pulled back approximately 1 m (3 ft)
before being re-driven through the open cavity, past the depth at which the pull-back was initiated.

24
The hypothesis underlying this procedure is that the blow count values at the beginning of the re-
drive, through the open cavity, can be attributed solely to shaft resistance. Hence, the blow count
values measured while driving through virgin material can be corrected for the effect of shaft
resistance through subtraction of blow counts measured during re-drive. An additional perceived
benefit of the procedure is a potential reduction in the shaft resistance after the re-drive, enabling
penetration to greater depths.
The iBPT system provides data to evaluate the validity of the hypotheses underlying the
pull-back and re-drive procedure by directly measuring the energy dissipated by shaft friction. The
energy dissipated by shaft resistance, Eres,Shaft, is the difference between the energy delivered to the
top of the drill string, Eres,Head, and the energy arriving at the tip, Eres,Tip. Raw blow counts can be
normalized using Eres,Shaft to calculate the blows that can be hypothetically attributed to shaft
resistance, NB30,Shaft. If the hypothesis underlying the pull-back and re-drive procedure was true,
NB30,Head at the start of a redrive (NB30,Head,Redrive) should be approximately equal to NB30,Shaft during
the original drive. Typical measurements obtained from pull-back and re-drive procedures are
presented in Figures 8a and 8b. Figure 8b shows that NB30,Head,Redrive values are significantly less
than NB30,Shaft values. Multiple pull-out and re-drive tests, such as those shown in Figure 8, were
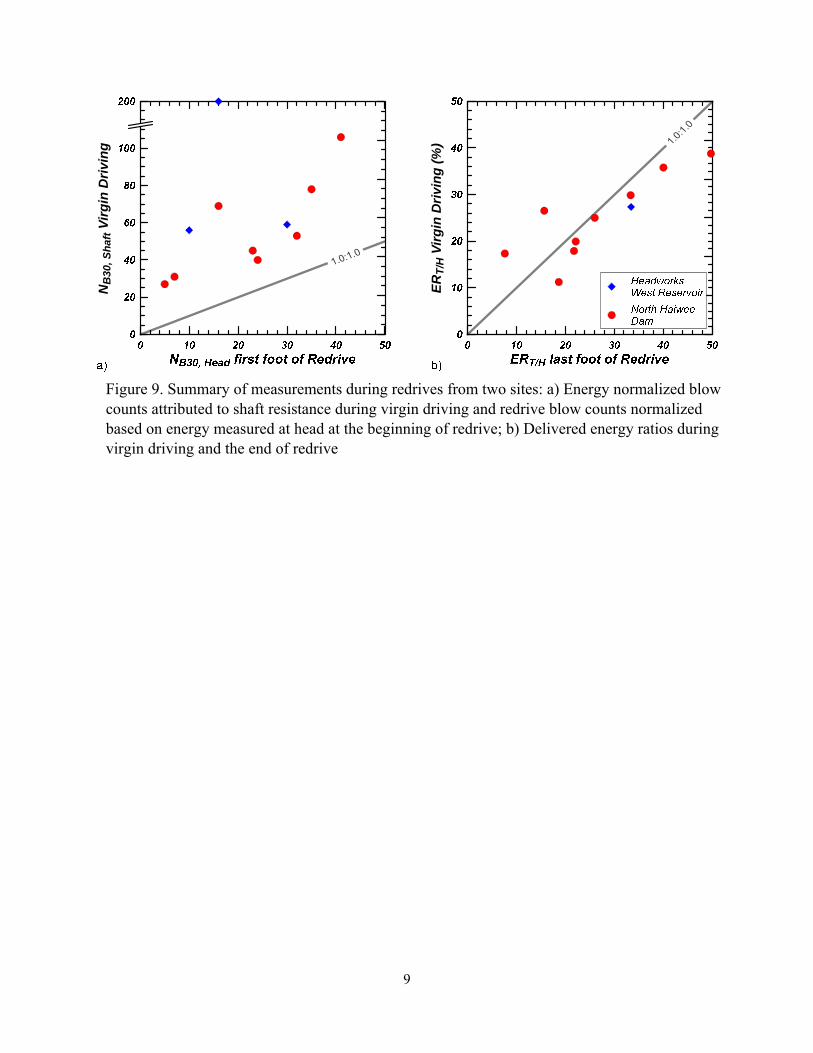
performed in the field and the data are summarized in Figure 9a. The data consistently shows that
NB30,Shaft values that were obtained during virgin driving are significantly greater than NB30,Head
obtained during re-drive. Based on the difference, a correction based on re-drive blow count value
cannot be expected to capture the effect of shaft resistance on energy measurements made only at
the drill string head. The use of pull-back and re-drives to correct for the influence of shaft
resistance has been shown to significantly underestimate the blow counts attributed to shaft

25
resistance, resulting in overestimating the penetration resistance of the soil under the tip of the drill
string.
Finally, the potential for pull-back and re-drives to reduce shaft resistance in subsequent
driving was investigated using the delivered energy ratio (ERT/H). If the pull-back and re-drive
procedure resulted in a significant reduction in shaft resistance more energy would reach the tip,
thus ERT/H would increase. In Figure 8c the delivered energy ratio at the end of the re-drive (i.e.
12.5 to 13 m) is very similar to that before the pull-back. The near equivalency between the
delivered energy ratios before and after the pull-back suggests that shaft resistance was not
significantly reduced and driving below the pull-back depth was generally unaffected. Similar data
collected during the field exploration program are summarized in Figure 9b and confirm that the
results from Figure 8c are typical of a general trend.
CONCLUSIONS
The development and validation of the iBPT system has led to the following observations and
conclusions:
• Conventional in-situ tests cannot produce reliable penetration resistance measurements in
gravelly soils due to a particle to penetrometer diameter ratio altering the penetration
mechanism.
• The large diameter alternative, the Becker Penetration Test, is influenced by shaft resistance
and interpretation methods that use above-ground measurements have failed to produce
consistent and reliable results.

26
• The instrumented Becker Penetration Test (iBPT) eliminates the shaft resistance issue through
direct measurement of acceleration and force at the drill string tip, enabling calculation of the
energy delivered to the soil below the tip of the closed-ended Becker drill string.
• The energy measured at the tip is used to normalize the Becker blow counts, enabling
characterization of a wide range of soils including those with significant gravel content. The
measurements have a high degree of repeatability and reliably by accounting for variations in
delivered energy at the tip due to either variation in equipment or shaft resistance accumulation.
• The iBPT provides a continuous normalized blow count profile (NB30) that accounts for wide
variations of delivered energy to the tip, including the common scenario of characterizing thin,
weak layers below harder natural layers and/or man-made embankments.
• The equipment is fully integrated within the industry standard closed-ended Becker testing
system. It has been successfully used in a variety of sites, driving conditions, and penetration
depths.
The companion paper (Ghafghazi et al., 2016) presents the development of a correlation between
iBPT NB30 and SPT N60 values that enables the penetration resistance of gravelly soils to be
characterized with a parameter commonly used in geotechnical engineering practice for
liquefaction assessment (e.g. Idriss and Boulanger, 2008).
ACKNOWLEDGEMENTS
The authors appreciate the funding and support provided by the Division of Safety of Dams
(DSOD) of the California Department of Water Resources (David Gutierrez) and Los Angeles
Department of Water and Power (Jianping Wu). The support of Bill Sluis, Daret Kehlet, Jon
Pearson, Chase Temple, Kevin Kuei, and Chris Krage of the Department of Civil and

27
Environmental Engineering at the University of California Davis is also greatly appreciated. The
technical contributions ofJohn Lemke of Geodaq in developing the downhole data acquisition
module is acknowledged. In addition, the collaboration with AMEC Foster Wheeler (Marty
Hudson and Alek Harounian), AECOM (Wolfgang Roth and S. Nesarajah), GeoPentech (Jon
Barneich, Andrew Dinsick and Doug Wahl), and Great West Drilling (Jim Benson) is appreciated.
REFERENCES
ASTM D4633-10 (2010). “Standard test method for energy measurement for dynamic
penetrometers.” ASTM International, West Conshohocken, PA, USA.
ASTM D4945-12 (2012). “Standard test method for high-strain dynamic testing of deep
foundations.” ASTM International, West Conshohocken, PA, USA.
Daniel, C.R., Howie, J.A., Campanella, R.G., and Sy, A. (2004). “Characterization of SPT grain
size effects in gravels.” 2nd Int. Conf. Site Characterization (ISC’2). Porto, Portugal.
Daniel, C.R., Howie, J.A., Jackson, R.S., and Walker, B. (2005).“Review of Standard Penetration
Test Short Rod Corrections.” J. Geotech. Geoen. Eng., ASCE, 131(4), 489-497.
Ghafghazi, M., DeJong, J.T., Sturm, A.P., and Temple, C.E. (2016). “Instrumented Becker
Penetration Test II: iBPT- SPT Correlation for Liquefaction Assessment in Gravelly Soils.” Under
review.
Harder, L.F.Jr., and Seed, H.B. (1986). “Determination of penetration resistance for coarse-grained
soils using the Becker Hammer Drill.” College of Engineering, University of California, Berkeley,
Report No. UCB/EERC-86/06. May 1986.

28
Housel, W. (1965). “Michigan study of pile driving hammers.” J. soil mech. and found. div., ASCE
91(SM5), 37-64.
Idriss, I.M., and Boulanger, R.W. (2008). “Soil Liquefaction during Earthquakes.” Oakland,
California. Earthquake Engineering Research Institute.
Kovacs, W.D. (1979). “Velocity measurement of free-fall SPT hammer.” J. Geotech. Eng. Div.,
ASCE, 105(1), 1-10.
McVay, M.C., Alvarez, V., Zhang, L., Perez ,A., and Gibson, A. (2002). “Estimating driven pile
capacitiesduring construction.” University of Florida report (4910450460312) to FDOT.
Odebrecht, E., Schnaid, F., Rocha, M.M., and Bernardes, G.P. (2005). “Energy Efficiency for
Standard Penetration Tests.” J. Geotech. Geoenv. Eng., ASCE, 131(10), 1252-1263.
Rausche, F., Moses, F., and Goble, G. (1972). “Soil resistance predictions from pile dynamics.” J.
Soil Mech. Found. Div., ASCE, 98(SM9), 917-937.
Schmertmann, J.H., and Palacios, A. (1979). “Energy dynamics of SPT.” J. Geotech. Eng. Div.,
105(8), 909-926.
Sy, A. and Campanella, R.G. (1991). “An alternative method of measuring SPT energy.” Proc. 2nd
Int. Conf. Recent Advances in Geotechnical Earthquake Engineering and Soil Dynamics, St Louis,
MO, 499–505.
Sy, A. and Campanella, R.G. (1994). “Becker and standard penetration tests (BPT-SPT)
correlations with consideration of casing friction.” Can. Geotech. J., 31(3), 343-356.
29
Sy, A., and Lum, K.K.Y. (1997). “Correlations of mud-injection Becker and standard penetration
tests.” Can. Geotech. J., 34(1), 139–144.
Wightman, A., Yan, L., and Diggle, D.A. (1993). “Improvements to the Becker Penetration Test
for Estimation of SPT Resistancein Gravelly Soils.” Proc. 46th Can. Geotech. Conf., Saskatoon,
SK, September 27-29, 379-388.

1
b)
a)
b)
c)
Ground Surface
t2L/c
FV∙Z
Bounce Chamber
Ram
ExhaustFuel
Impact Helmet
Head Section
Tip Section
Drive Shoe
Std. Becker Pipe
Closed-endedCrowd-out
1.5 m (5 ft) and 3.0 m (10 ft) Becker pipes can be strung together to achieve 200+ ft. of continuous driving.
168 mm O.D.128 mm I.D.
Measured response at module sensor locations
2L/c
Figure 1. iBPT system: a) Schematic iBPT system and Becker hammer; b) Tip and head modules; c) Field control unit

2
Figure 2. iBPT measurements of force, velocity (multiplied by impedance), displacements and energies at head (above ground) and tip sections from impact at 37.5 m (122.5 ft) depth in relatively dense soil; data from Stone Canyon Dam

3
Dep
th (
m)
Dep
th (
ft)
Figure 3. iBPT output profile: a) Automatically recorded raw blow counts; b) Average residual energies measured at head and tip sections; c) Delivered energy ratio ERT/H; d) Blow counts normalized based on energy measured at tip; data from Headworks West Reservoir

4
Figure 4. Repeatability of iBPT results in adjacent soundings: a) Raw blow counts; b) Average residual energy measured at tip; c) Blow counts normalized based on energy measured at tip; data from North Haiwee Dam
5
Dep
th (
ft)
Dep
th (
m)
Figure 5. Effect of shaft resistance on iBPT results in adjacent soundings: a) Raw blow counts; b) Average residual energy measured at tip; c) Blow counts normalized based on energy measured at tip; data from Stone Canyon Dam

6
Figure 6. Linearity of the iBPT results in adjacent soundings: a) Raw blow counts; b) Average residual energy measured at the tip; c) Blow counts normalized based on energy measured at the tip; data from North Haiwee Dam

7
NB
(h
igh
en
erg
y)
NB
(lo
w e
ner
gy)
Dep
th (
ft)
Dep
th (
ft)
Figure 7. Linearity of the energy normalization of blow counts with residual energy measured at tip. a) Schematic soundings layout and calculation of energy and blow count ratios; b) Equivalency of ratios of tip energy and raw blow counts in adjacent soundings; data from three sites

8
Figure 8. Typical measurements during redrives: a) Raw and energy normalized blow counts during virgin driving and redrive; b) Energy normalized blow counts attributed to shaft resistance during virgin driving and redrive blow counts normalized based on energy measured at head; c) Delivered energy ratios during virgin driving and redrive; data from North Haiwee Dam
9
NB
30, S
haf
t Vir
gin
Dri
vin
g
ER
T/H
Vir
gin
Dri
vin
g (
%)
Figure 9. Summary of measurements during redrives from two sites: a) Energy normalized blow counts attributed to shaft resistance during virgin driving and redrive blow counts normalized based on energy measured at head at the beginning of redrive; b) Delivered energy ratios during virgin driving and the end of redrive