
Instrument Science Report STIS 2018-04 Monitoring the STIS ... · other settings, the lamp current...
37
Instrument Science Report STIS 2018-04 Monitoring the STIS Wavelength Calibration: MAMA and CCD First-Order Modes Daniel E. Welty August 30, 2018 Abstract We discuss a uniform analysis of the wavelength calibration of STIS Pt/Cr-Ne lamp spectra that have been obtained for monitoring the accuracy of that calibration during cycles 7–11 and 17–25, focusing on the first-order MAMA and CCD settings. We have made improvements to the procedures that were used for previous analyses of some of those spectra, and have added accurate wavelengths for many Ne and Cr lines (from recent references) to the list of laboratory values used for comparison. We find that both the mean wavelength o↵sets and the scatter in the individual wavelength residuals have remained within the desired accuracies (0.2–0.3 pix, 1σ) for all of the first-order settings that have been monitored – though there has been some reduction in the number and strength of the lines measurable for some of the settings, due to the fading of the calibration lamps. As has been found in several previous studies, there are slight systematic trends (versus wavelength) in the wavelength residuals for some settings. We also note an apparent slight (⇠ 0.1 pix) shift in the mean o↵sets for most of the CCD settings that followed a change in the lamp used for the calibration observations in cycle 11. Additional changes have been made to the calibration observations in cycles 24 and 25 to compensate for the fading of the calibration lamps. We recommend that a re-calibration of the wavelengths be performed for the final archive of STIS observations, in order to correct the observed systematic deviations in the current calibration. Copyright c 2018 The Association of Universities for Research in Astronomy, Inc. All Rights Reserved.
Transcript of Instrument Science Report STIS 2018-04 Monitoring the STIS ... · other settings, the lamp current...

Instrument Science Report STIS 2018-04
Monitoring the STIS WavelengthCalibration: MAMA and CCD
First-Order Modes
Daniel E. Welty
August 30, 2018
Abstract
We discuss a uniform analysis of the wavelength calibration of STIS Pt/Cr-Ne lamp spectra
that have been obtained for monitoring the accuracy of that calibration during cycles 7–11
and 17–25, focusing on the first-order MAMA and CCD settings. We have made
improvements to the procedures that were used for previous analyses of some of those
spectra, and have added accurate wavelengths for many Ne and Cr lines (from recent
references) to the list of laboratory values used for comparison. We find that both the mean
wavelength o↵sets and the scatter in the individual wavelength residuals have remained
within the desired accuracies (0.2–0.3 pix, 1�) for all of the first-order settings that have
been monitored – though there has been some reduction in the number and strength of the
lines measurable for some of the settings, due to the fading of the calibration lamps. As has
been found in several previous studies, there are slight systematic trends (versus
wavelength) in the wavelength residuals for some settings. We also note an apparent slight
(⇠ 0.1 pix) shift in the mean o↵sets for most of the CCD settings that followed a change in
the lamp used for the calibration observations in cycle 11. Additional changes have been
made to the calibration observations in cycles 24 and 25 to compensate for the fading of the
calibration lamps. We recommend that a re-calibration of the wavelengths be performed for
the final archive of STIS observations, in order to correct the observed systematic
deviations in the current calibration.
Copyright c� 2018 The Association of Universities for Research in Astronomy, Inc. All Rights Reserved.

Instrument Science Report STIS 2018-04
Contents
• Introduction (page 2)
• Monitoring Procedures (page 4)
• Results (page 10)
• Conclusions / Recommendations (page 19)
• Change History (page 21)
• References (page 21)
• Appendices (page 22)
1. Introduction
The assignment of an accurate wavelength scale to each STIS spectrum is an essential as-pect of converting raw STIS spectroscopic data into scientifically useful spectra. The STISwavelength calibration was initially established by comparing pre-launch and early in-flightobservations of the onboard Pt/Cr-Ne lamps with lists of rest wavelengths determined fromlaboratory studies, then fitting the measured positions of identified lines on the MAMA andCCD detectors to a simple, approximate model for the dispersion relations (Smith 1990;Hulbert et al. 1997; see also Espey 1999; Kerber et al. 2006a). The dispersion coe�cientsobtained in those early calibration programs have been applied to all subsequent STIS ob-servations, with short contemporaneous lamp observations used to determine the zero pointo↵set (e.g., due to slight di↵erences in the position of the mode select mechanism) for eachparticular STIS spectrum (e.g., Baum 1997; Hulbert et al. 1997; McGrath et al. 1999;see also Lindler 1999). The continuing applicability and accuracy of that approach to thewavelength calibration of STIS spectra has been monitored on a roughly annual basis byobtaining sets of deeper spectra than those used for the o↵set determinations, for selected”representative” settings spanning the wavelength coverage of each of the available STISgratings. The wavelengths measured for the lamp lines detected in those dispersion monitorspectra (assuming the default wavelength calibration) are compared with the correspondinglaboratory values, in order to determine whether the wavelength calibration is within thedesired absolute and relative accuracies [both typically of order 0.2-0.3 pix (1�)].
While brief summaries of the results from the STIS dispersion monitor programs generallyhave been given in the annual STIS calibration close-out reports (see the list at the end ofthe References), a number of studies have examined the accuracies achieved in restrictedsubsets of the dispersion monitor spectra in more detail. Examples include analyses of CCDspectra from cycles 11 and 12 at pseudo-aperture E1 (Friedman 2005), selected MAMAechelle spectra from cycles 7–11 (Ayres 2008), a somewhat larger set of echelle spectra(Ayres 2010b), all of the CCD and MAMA spectra from cycle 17 (Pascucci et al. 2011;hereafter Pas11), and all of the CCD and MAMA spectra from cycles 19–21 (Sonnentrucker2015; hereafter Son15). While all of those studies have indicated that the STIS wavelength
2

Instrument Science Report STIS 2018-04
Table 1: STIS wavelength calibration monitoring programsMAMA programs CCD programs
Cycle PID Date Lampa PID Date Lampa Comments7 7078 1997jul L/H1 image quality
7722 1997aug L/H1/H2 7722 1997aug L/H1/H2 3.8, 10 mA for 3 lamps7649 1997dec L 7648 1997sep L some echelle, a few G230B7651a 1998feb L 7650a 1998mar L7651b 1999jan L 7650b 1999jan L
8 8430a 1999aug L 8413a 1999aug L8430b 2000aug L 8413b 2000aug L
9 8850 2000jul L deep G750M8859 2000jul L 8848 2000sep L
10 8917 2001aug L 8909 2001aug L11 9618 2002jun L 9617 2002jun H1 expanded sample12 10031 2003dec L 10025 2003sep H1 a few deep exposures
10087 2003dec H2 GxxxL, a few G750M
17 11391 2009jul L 11385 2009jun H1 format verification11392 2009aug L format verification11859 2009aug L 11858 2009aug L/H1 expanded sample12079 2010apr L/H1/H2 12079 2010apr L/H1/H2 lamp comparisons12280 2010dec L/H2 deep MAMA echelle (Ayres)
18 12412 2010nov L 12407 2010nov H119 12773 2011oct L 12768 2011oct H120 13143 2012oct L 13137 2012oct H121 13546 2013oct L 13540 2013oct H122 13992 2014nov L 13987 2014nov H123 14427 2015nov L 14419 2015nov H1
14489 2016mar H2 test HITM2 lamp24 14831 2017may L 14825 2017apr H1 slight changes25 15391 2018feb L/H2 15390 2018mar H1 slight changes
Notes: a L = LINE; H1 = HITM1; H2 = HITM2Regular dispersion monitor programs are in bold type.
calibration has remained within the desired accuracies, slight systematic deviations in thewavelength residuals (the individual di↵erences between observed and reference wavelengths),versus wavelength, have been noted for a number of the settings (e.g., Valenti 1996; Ayres2008, 2010a, 2010b; Pas11; Son15).
In this report, we present the results of a uniform analysis of most of the first-orderSTIS spectra (using gratings G140L, G140M, G230L, G230M, G230LB, G230MB, G430L,G430M, G750L, G750M) obtained under the various dispersion monitor programs (and someother calibration programs) executed during cycles 7–11 and 17–25 (Table 1). Applicationof a uniform analysis procedure over a long baseline enables both a better assessment of thevalidity of that procedure and more reliable recognition and characterization of any subtle,but persistent systematic wavelength-dependent trends and/or temporal variations in thewavelength calibration. A subsequent report will cover the corresponding NUV-MAMA andFUV-MAMA echelle spectra obtained under those programs.
3
Instrument Science Report STIS 2018-04
Table 2: Regularly monitored settingsGrating � range �� Cycles 7–11 Cycles 17–25
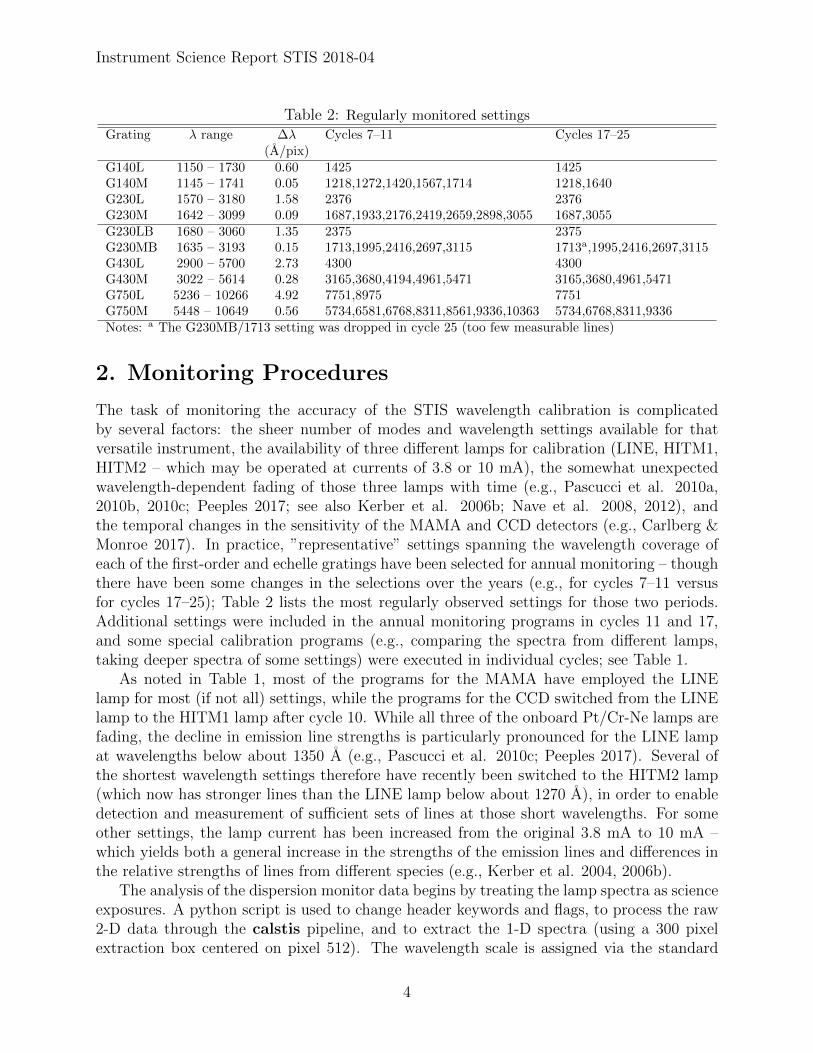
(A/pix)G140L 1150 – 1730 0.60 1425 1425G140M 1145 – 1741 0.05 1218,1272,1420,1567,1714 1218,1640G230L 1570 – 3180 1.58 2376 2376G230M 1642 – 3099 0.09 1687,1933,2176,2419,2659,2898,3055 1687,3055G230LB 1680 – 3060 1.35 2375 2375G230MB 1635 – 3193 0.15 1713,1995,2416,2697,3115 1713a,1995,2416,2697,3115G430L 2900 – 5700 2.73 4300 4300G430M 3022 – 5614 0.28 3165,3680,4194,4961,5471 3165,3680,4961,5471G750L 5236 – 10266 4.92 7751,8975 7751G750M 5448 – 10649 0.56 5734,6581,6768,8311,8561,9336,10363 5734,6768,8311,9336Notes: a The G230MB/1713 setting was dropped in cycle 25 (too few measurable lines)
2. Monitoring Procedures
The task of monitoring the accuracy of the STIS wavelength calibration is complicatedby several factors: the sheer number of modes and wavelength settings available for thatversatile instrument, the availability of three di↵erent lamps for calibration (LINE, HITM1,HITM2 – which may be operated at currents of 3.8 or 10 mA), the somewhat unexpectedwavelength-dependent fading of those three lamps with time (e.g., Pascucci et al. 2010a,2010b, 2010c; Peeples 2017; see also Kerber et al. 2006b; Nave et al. 2008, 2012), andthe temporal changes in the sensitivity of the MAMA and CCD detectors (e.g., Carlberg &Monroe 2017). In practice, ”representative” settings spanning the wavelength coverage ofeach of the first-order and echelle gratings have been selected for annual monitoring – thoughthere have been some changes in the selections over the years (e.g., for cycles 7–11 versusfor cycles 17–25); Table 2 lists the most regularly observed settings for those two periods.Additional settings were included in the annual monitoring programs in cycles 11 and 17,and some special calibration programs (e.g., comparing the spectra from di↵erent lamps,taking deeper spectra of some settings) were executed in individual cycles; see Table 1.
As noted in Table 1, most of the programs for the MAMA have employed the LINElamp for most (if not all) settings, while the programs for the CCD switched from the LINElamp to the HITM1 lamp after cycle 10. While all three of the onboard Pt/Cr-Ne lamps arefading, the decline in emission line strengths is particularly pronounced for the LINE lampat wavelengths below about 1350 A (e.g., Pascucci et al. 2010c; Peeples 2017). Several ofthe shortest wavelength settings therefore have recently been switched to the HITM2 lamp(which now has stronger lines than the LINE lamp below about 1270 A), in order to enabledetection and measurement of su�cient sets of lines at those short wavelengths. For someother settings, the lamp current has been increased from the original 3.8 mA to 10 mA –which yields both a general increase in the strengths of the emission lines and di↵erences inthe relative strengths of lines from di↵erent species (e.g., Kerber et al. 2004, 2006b).
The analysis of the dispersion monitor data begins by treating the lamp spectra as scienceexposures. A python script is used to change header keywords and flags, to process the raw2-D data through the calstis pipeline, and to extract the 1-D spectra (using a 300 pixelextraction box centered on pixel 512). The wavelength scale is assigned via the standard
4

Instrument Science Report STIS 2018-04
dispersion relations (with the zero point determined from the data themselves, rather thanfrom a separate wavecal exposure). No background corrections, flux calibrations, or Dopplercorrections are performed. In most cases, only single exposures were obtained for the CCDsettings, so that no removal of cosmic rays is performed – which can be problematic forseveral of the shorter wavelength G230MB settings (with longer exposure times), due to therelatively large extraction box. As discussed in more detail below, a procedure coded inIDL is then used to measure the wavelengths of discernible emission lines and to comparethose measured values with a list of laboratory wavelengths, in order to determine – for eachsetting at each epoch – the mean o↵set between the measured and fiducial wavelengths, thescatter in the residuals, and any systematic trends in the residuals. Those characteristics arethen compared between di↵erent cycles, to see if there are any significant temporal trendsin the accuracy of the wavelength calibration.
2.1. Line Lists
Because the various available STIS modes cover a large range in wavelength (from about 1150to 10650 A), Pt/Cr-Ne hollow cathode lamps were chosen for the wavelength calibration– with Pt providing the majority of the lines below 3200 A, Ne most of the lines above5400 A, and Cr most of the lines in between. The lists of laboratory wavelengths used forthe initial STIS wavelength calibrations were compiled by D. Lindler from several sources:the measurements of lines in Pt-Ne lamp spectra performed by Reader et al. (1990), thewavelength tables maintained at NIST, and other references. Custom subsets of those lineswere used to calibrate the various STIS modes – e.g., excluding lines that would be blended inthe lowest-resolution GxxxL-mode spectra. Those initial line lists were later augmented andrefined via new laboratory measurements of the lines in Pt/Cr-Ne lamp spectra (Sansonettiet al. 2004) and via slight empirical adjustments based on measurements of the lines indeep STIS echelle wavelength calibration spectra (Ayres 2010b) – but only between about1130 and 3150 A. The analyses of post-SM4 STIS wavelength calibration spectra reportedby Pas11 and Son15 used several of those wavelength lists: primarily Sansonetti et al. (2004)and Ayres (2010b) for the shorter wavelength settings (G140, E140, G230, E230, G230B)and values obtained from NIST and from a list of longer wavelength lines provided by D.
Table 3: Wavelength compilations: mean wavelength di↵erences vs. current NIST valuesReference Coverage ��(Cr) ��(Ne) ��(Pt)
(A) N (mA) N (mA) N (mA) NReader et al. 1990 (PtNe) 1100 – 4000 >3000 NA ... ... ... ... ...initial STIS (Lindler; PtCrNe) 1164 – 10613 2390 �1.92± 0.96 110 0.97± 0.12 441 �5.79± 0.88 146LindPC (Lindler; PtCrNe) 2914 – 9967 798 7.13± 0.92 386 0.56± 0.39 351 0.29± 0.02 36Sansonetti et al. 2004 (PtCrNe) 1131 – 1828 1232 0.53± 0.74 199 0.52± 0.01 71 ... 5Kramida & Nave 2006a (Ne III) 204 – 360000 NA ... ... ... NA ...Kramida & Nave 2006b (Ne II) 324 – 130000 >1700 NA ... ... ... NA ...Wallace & Hinkle 2009 (Cr I) 2366 – 54287 1975 0.00± 0.00 1532 NA ... NA ...Ayres 2010b (PtCrNe) 1151 – 3150 5698 �0.07± 0.31 1688 0.36± 0.04 356 �6.03± 1.21 147NIST (Pas11/Son15; PtCrNe) 1131 – 4333 5627 ... 7 �0.55± 0.17 695 �7.02± 0.90 185Sansonetti et al. 2012 (Cr II) 1142 – 3954 3604 �0.02± 0.01 3367 NA ... NA ...Sansonetti & Nave 2014 (Cr II) 2850 – 37857 5362 0.02± 0.00 4758 NA ... NA ...this study (all; PtCrNe) 1131 – 54287 14252 ... ... ... ... ... ...this study (G430, G750; PtCrNe) 1131 – 45917 6430 0.08± 0.15 993 0.32± 0.16 1281 �6.69± 0.86 193
5

Instrument Science Report STIS 2018-04
Lindler (a revised version of the list used for the original calibrations; hereafter referred to as”LindPC”) for the longer wavelength settings (G430, G750)1. More recent measurementsof the lines produced by Cr-Ne, Cr-Ar, and Fe-Ne hollow cathode lamps, however, haveincreased the samples of accurate wavelengths for Cr I and Cr II (Wallace & Hinkle 2009;Sansonetti et al. 2012; Sansonetti & Nave 2014) and for Ne I, Ne II, and Ne III (Kramida& Nave 2006a, 2006b), particularly at longer wavelengths. While the newer values for Crand Ne have now been incorporated into the line lists maintained at NIST, the currentNIST list for Pt needs updating (e.g., it does not include the values from Sansonetti etal. 2004). Table 3 lists the various wavelength compilations used in previous studies ofthe STIS wavelength calibration and/or incorporated in this study, with information on thewavelength range covered, the number of lines included, and the mean wavelength di↵erences(separately for Cr, Ne, and Pt) relative to the values currently available at NIST.
We have compared the wavelengths and line intensities listed in the various referencesgiven in Table 3 – first to determine how well the values agree for lines in common andthen to assemble a new merged list of lines, on a common wavelength and intensity scale(as much as possible), for comparison with the STIS wavelength calibration spectra. Belowabout 4330 A, the agreement in wavelength is generally reasonably good (within several mA)for the lines in Sansonetti et al. (2004), the NIST list used by Pas11 and Son15, and thelist described by Ayres (2010b) – both among those three lists and versus the current NISTvalues (for Cr and Ne). The overall mean wavelength di↵erences for each reference (for eachelement, relative to the current NIST values), listed in the last six columns of Table 3, aregenerally less than 1 mA for Cr and Ne, but are larger for Pt (where the NIST values needupdating). There is much greater scatter (di↵erences of tens of mA), however, for a numberof the longer wavelength Cr and Ne lines in the LindPC list, compared to the more recentvalues now incorporated into the NIST compilations (Appendix Figure 7). While even thelargest of those di↵erences correspond to a small fraction of a pixel for the G750L settings, adi↵erence of 100 mA corresponds to nearly 0.2 pixel for the G750M settings. As the LindPClist is very similar to the list used in the original wavelength calibration, and as it apparentlywas the only list used by Pas11 and Son15 that includes lines beyond about 4330 A, thosedi↵erences between the older and current reference wavelengths suggest that some revisionsto the wavelength calibration (and its evaluation) might be in order. Comparisons of theline strengths among the various line lists are more di�cult, however, as di↵erent lamps,operating under di↵erent conditions, were used in the corresponding laboratory studies. Wehave attempted to bring the intensities to a (roughly) common scale (that of the older NISTlist used by Pas11 and Son15) by multiplying the values for each species and reference by aconstant determined from lines in common with that older NIST list – but those constantscaling factors are not well defined or determined in some cases.
Our final merged list includes more than 14000 lines, ranging from 1131 A to 5.43 µm(Table 3). For comparisons with the shorter wavelength spectra from G140, G230, andG230B, we have adopted the Ayres (2010b) wavelengths (slightly augmented to extend thecoverage to 3200 A). For comparisons with the longer wavelength spectra from G430 and
1While both Pas11 and Son15 also cite Wallace & Hinkle (2009), only the lines below 3150 A were included(through the Ayres 2010b compilation); the many Cr I lines at longer wavelengths from that source werenot included.
6

Instrument Science Report STIS 2018-04
G750, we have adopted the Cr and Ne wavelengths currently in NIST (based on the recentstudies noted above; but omitting the weaker lines that are generally not detected in theSTIS spectra), plus the Pt wavelengths from the older NIST and LindPC lists.
2.2. Line Identification and Fitting
The initial analyses of the extracted 1-D wavelength calibration spectra utilized the legacyIDL code that had been employed by Pas11 and Son15 in their analyses of the spectra fromcycles 17–21. For each first-order setting, that code marches through the spectrum, lookingfor measurable emission features within 0.5 pixel of the expected positions of lines in thefiducial lists. For each recognized emission feature, the line center is estimated in three ways:as the wavelength of peak intensity, via an intensity-weighted average of the wavelengths ofthe five points nearest the peak, and via a Gaussian fit to the overall line profile.2 Featuresthat are deemed too narrow (e.g., due to cosmic rays) or too broad (e.g., due to blends of twoor more lines) are rejected – with di↵erent cut-o↵ widths for the di↵erent gratings and modes;Son15 also removed obviously blended or saturated lines. The values for the centroids of theremaining ”valid” matches are saved in a log file, and the mean wavelength o↵set (relativeto the laboratory values) and standard deviation of the residuals are computed for eachmethod.
After examination of the results of those initial analyses, some changes were made to thecode and procedure – to fix several problems that were identified, to incorporate additionalcapabilities, and to reduce the need for user intervention:
• In the legacy code, a number of the lines longward of 2000 A in the NIST list were notconverted from air to vacuum values (which is necessary for comparisons with the STISspectra), and some of the LindPC lines were not included in the combined referencelist. That, together with the incompleteness of the previously available lists for Cr andNe beyond about 3150 A, meant that a number of lines that are consistently detectablein the spectra were either misidentified or not identified in a number of the settings(especially G430L/4300 and G430M/3165-4194). Performing the appropriate air-to-vacuum conversions and incorporating additional Cr and Ne lines from more recentreferences significantly increased the number of lines (N) correctly identified in thosesettings (Appendix Table 12; note that the N values for this study do not include linesconsidered to be blended).
• In the legacy code, matching of the observed emission features with lines in the ref-erence lists did not take into account the relative strengths of the reference lines; inall cases, the closest match in wavelength (within 0.5 pixel) was adopted. For somesettings, however, the density of lines in the combined reference lists is high enoughthat some observed emission features were matched with weak lines that happenedto be slightly closer in wavelength, instead of the stronger (but slightly more distant)lines that should have been assigned. Such mismatches would presumably have yielded
2As Gaussians generally gave good fits to the profiles (except for some saturated, asymmetric lines inseveral of the longer wavelength G140M and G230M settings) – and as the Gaussian fits also provideconvenient measures of line strength – we have adopted the Gaussian fits in this study.
7

Instrument Science Report STIS 2018-04
smaller mean wavelength o↵sets and smaller scatter in the residuals than would havebeen obtained for the correct matches. The match criterion was therefore changed toassociate each detected emission feature with the strongest line in the reference listswithin 0.5 pixel (instead of the nearest line). While that criterion yields reasonablematches in most cases, the di�culty of assigning accurate relative strengths to linesfrom di↵erent species (in the reference lists) does lead to some ambiguity for a smallnumber of lines.
• Not all of the emission features due to cosmic rays (especially in the longer CCD expo-sures) or due to blends of several lamp lines were eliminated by the line width restric-tions. While some weak lamp lines could be reliably measured in early G230MB/1713spectra, for example, cycle-to-cycle inconsistencies in the set of lines found in the post-SM4 spectra suggest that the lamp had faded enough that most of the lines ”identified”in those more recent spectra are actually due to cosmic rays. On the other hand, someblended features dominated by a single relatively strong line are not broad enough tobe rejected as obvious blends, but their centroids can still be a↵ected by the weakerlines contributing to the blends. Such features are now flagged if the potential contri-butions from weaker lines to the total (blended) line strength exceeds 10%. For eachsetting, separate statistics are now calculated for all the detected lines, for the subsetof unblended lines, and for the subset of lines consistently detected (cycle to cycle) inthe spectra. The lines that are both unblended and consistently detected should givethe most reliable measure of the mean o↵set and scatter in each setting.
• A measure of the strength of each detected line – the product of the height and widthof the fitted Gaussian – is now computed and saved in the log file. Those data enablequantitative tracking of the temporal changes in line strength – due to the combinationof changes in the detector sensitivity (e.g., Carlberg & Monroe 2017) and the fading ofthe calibration lamps (e.g., Peebles 2017) – as functions of wavelength and (in principle)species within each setting. They have also informed decisions regarding changes tothe monitoring observations themselves – e.g., eliminating a setting for which too fewlines are now measurable, increasing the lamp current or switching lamps for a givensetting to yield more measurable lines.
A single master copy of the IDL code for each grating (which incorporates the variouscorrections and enhancements noted above) is now used to analyze the available dispersionmonitor data from all cycles, so that any further modifications of the procedure can be quicklyand uniformly applied to all the data. Additional IDL procedures have been developed tocompare both the spectra and the results of the analysis from di↵erent cycles.
As an example, Figure 1 shows the results of the line-fitting procedure for the G430M/3680spectrum (and the corresponding part of the lower-resolution G430L/4300 spectrum) fromcycle 17. While most of the lines in the G430M spectrum appear to be correctly identifiedand fitted, several of the lines in the G430L spectrum (near 3665 and 3778 A) are misiden-tified. Both the density of lines in the reference list (compared to the resolution of theG430L spectrum) and the evident di↵erences between the relative line strengths given in thereference list and those actually observed are likely to have contributed to those misiden-tifications. There is also at least one line in the G430L spectrum (near 3714 A) for which
8
Instrument Science Report STIS 2018-04
G430L_M3680_17
3520 3540 3560 3580 3600 3620 3640Wavelength
0
1×10⁴
2×10⁴
3×10⁴
4×10⁴
5×10⁴
6×10⁴
Intensity
G430L_M3680_17
3620 3640 3660 3680 3700 3720 3740Wavelength
0
2000
4000
6000
8000
Intensity
G430L_M3680_17
3720 3740 3760 3780 3800 3820 3840Wavelength
0
1000
2000
3000
4000
Intensity
Figure 1: Spectra from cycle 17 of G430M/3680 (black) and G430L/1425 (red). Lines from thereference lists are given by dotted black lines (with height proportional to the listed strength);detected / measured lines are given by dashed green (G430M) and red (G430L) lines (at thelaboratory wavelengths). One pixel corresponds to 0.28 A for G430M and to 2.73 A for G430L.Note the di↵erences in vertical scale among the three panels, the e↵ects of line density / blending(especially for the G430L spectrum), and the di↵erences between the relative line strengths in thereference list versus in the observed spectrum.
9

Instrument Science Report STIS 2018-04
G430M 3680 (cycle 17)
3500 3550 3600 3650 3700 3750 3800 3850Wavelength [AA]
-1.0
-0.5
0.0
0.5
1.0
Offs
et [p
ixel]
Spk 0.125, 0.31WeightSpk 0.142, 0.19Gauss 0.144, 0.19, 37 (0.145, 0.18, 32)
Figure 2: Wavelength residuals (in pix-els) for the G430M/3680 setting (cycle17) shown in Fig. 1. Black squares arefor the peak wavelengths; red stars arefor the weighted averages; green circlesare for the Gaussian fits (open circlesare for blended features). The meano↵sets, standard deviation of the residu-als, and (for the Gaussian fits) the num-ber of points are given at the top; thevalues in parentheses for the Gaussianfits are for the unblended lines. The redand green solid lines are linear fits to theweighted fit and Gaussian fit points, re-spectively.
blending has shifted the centroid of the line away from the position of the dominant con-tributor to that blended feature. For the 32 unblended lines measured in the G430M/3680spectrum, the mean o↵set (for wavelengths obtained from the Gaussian fits, relative to thereference wavelengths) is 0.15 pix, and the standard deviation of the residuals is 0.18 pix(Fig. 2; Appendix Tables 6, 8, and 11). Linear fits to the residuals (for both the weightedand Gaussian fits) suggest no significant trends with wavelength for this setting; there areseveral apparently ”discrepant” points, however (e.g., near 3750 A). Only 6–8 lines could bemeasured in the corresponding part of the G430L/4300 spectrum, due to blending issues.
3. Results
The main results of the analysis of the dispersion monitor spectra from cycles 7–11 and17–25 are given compactly in Figures 3, 4, and 5, which show the mean wavelength o↵sets(for the Gaussian fits), the standard deviations of the residuals, and the mean relative linestrengths, respectively, for the unblended lamp lines measured for each of the regularlymonitored settings of the five first-order gratings, as functions of time. In each panel ofthose figures, the black lines give the values for the L-mode spectra noted in the title to thepanel, while the colored lines give the values for the corresponding higher-resolution M-modespectra noted in the middle of the panel. Table 4 lists the average values (for cycles 7–11and 17–25) of the mean o↵sets, the standard deviations of the residuals, and the numberof consistently detected unblended lines for each regularly monitored setting. The averagevalues presented in Figures 3–5 and in Table 4 are based primarily on the detailed cycle-by-
10

Instrument Science Report STIS 2018-04
cycle lists of those quantities contained in Appendix Tables 5–11. The average residuals forthe individual lines measured in each setting in cycles 7–11 are shown (versus wavelength) inAppendix Figures 8–12. In those figures, lines measured in at least one cycle (all) are givenby ”+”, unblended lines (nob – for no blend) are given by open squares, and lines measuredin at least five of the seven data sets (5–7) are given by ”x”; the most reliable lines (gnb –for good, no blend) are thus given by a superposition of all three symbols.
Mean o↵sets: With one notable exception, the mean wavelength o↵sets (for wavelengthsobtained from the Gaussian fits) exhibit roughly constant, but often apparently non-zerovalues for each monitored setting (Fig. 3; columns 4 and 10 of Table 4; see also AppendixTables 5 and 6). The exception is the apparent ⇠0.1 pix increase in the mean o↵sets for mostof the CCD settings when the lamp was switched from LINE to HITM1 in cycle 11 (Table 4,last column). (Note that the mean o↵sets for the post-SM4 cycles 17–25 are consistent withthose for cycle 11, for those CCD settings, and are generally higher than the values forcycles 7–10.) As noted by Pas11, the wavelength calibration appears not to have changedsignificantly during the period between cycles 12 and 17 (when STIS was not operational).The absolute values of the mean o↵sets are in all cases less than 0.3 pix, and in most casesare less than 0.2 pix. For example, the mean o↵sets for the di↵erent settings range from 0.00to 0.13 (G140), -0.26 to 0.03 (G230), -0.03 to 0.05 (G230B), -0.19 to 0.05 (G430), and -0.19to 0.05 (G750) for cycles 7–11, and from -0.03 to 0.23 (G140), -0.24 to 0.07 (G230), 0.00to 0.21 (G230B), -0.11 to 0.15 (G430), and -0.08 to 0.08 (G750) for cycles 17–25. At leastsome of the cycle-to-cycle di↵erences and possible weak secular trends seen for some settingsin Figure 3 (e.g., the possible slight increases for G230LB, G430L, and G750L over cycles17–25) appear to be due to di↵erences in the set of lines detected and successfully measuredin each case (e.g., as the calibration lamps fade).
Cross-correlation of spectra for a given setting but from di↵erent cycles – which shouldbe less sensitive to di↵erences in the sets of detected lines – generally yielded similar relativemean o↵sets to those determined from fitting individual lines. That method does not revealpossible trends in the residuals with wavelength within a given setting, however, and isless straightforward for comparing spectra at the position of the E1 pseudo-aperture withthose taken at the nominal (central) position, due to slight changes in the dispersion withy-position on the detector.
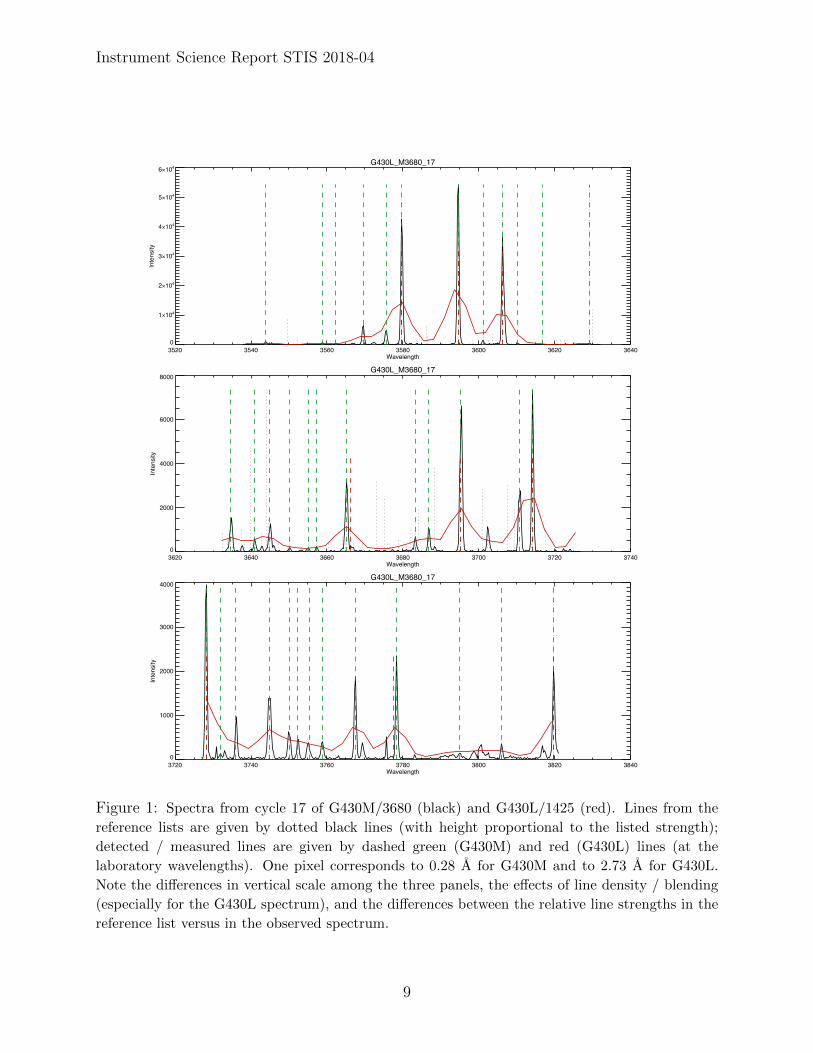
Residuals / scatter: In general, the standard deviations of the wavelength residualsare smaller for the subset of unblended, consistently detected lines, compared to the valuesfor the full set of measured lines (columns 6 and 12 versus columns 5 and 11, respectively, inTable 4). For most of the settings, the standard deviations for the unblended lines appearto have remained roughly constant, with average values less than 0.25 pix (Fig. 4; columns6 and 12 of Table 4; see also Appendix Tables 7 and 8) – though the post-SM4 selection ofsettings is somewhat di↵erent and the number of lines consistently detected (for settings incommon) has decreased, in many cases. For example, the mean standard deviations for thedi↵erent settings range from 0.16 to 0.24 (G140), 0.18 to 0.24 (G230), 0.11 to 0.17 (G230B),0.10 to 0.17 (G430), and 0.06 to 0.13 (G750) for cycles 7–11, and from 0.09 to 0.23 (G140),0.14 to 0.20 (G230), 0.09 to 0.20 (G230B), 0.07 to 0.20 (G430), and 0.03 to 0.10 (G750) forcycles 17–25. Again, some of the cycle-to-cycle di↵erences in the standard deviations for agiven setting appear to be related to di↵erences in the number of lines that were measured(e.g., for G140M/1640).
11

Instrument Science Report STIS 2018-04
G140L 1425
2000 2005 2010 2015Date
-0.6
-0.4
-0.2
-0.0
0.2
0.4
0.6
Mea
n of
fset
(pix
)
117312181640
G230L 2376
2000 2005 2010 2015Date
-0.6
-0.4
-0.2
-0.0
0.2
0.4
0.6
Mea
n of
fset
(pix
)
16873055
G230LB 2375
2000 2005 2010 2015Date
-0.6
-0.4
-0.2
-0.0
0.2
0.4
0.6
Mea
n of
fset
(pix
)
1995241626973115
G430L 4300
2000 2005 2010 2015Date
-0.6
-0.4
-0.2
-0.0
0.2
0.4
0.6
Mea
n of
fset
(pix
)
3165368049615471
G750L 7751
2000 2005 2010 2015Date
-0.6
-0.4
-0.2
-0.0
0.2
0.4
0.6
Mea
n of
fset
(pix
)
5734676883119336
Figure 3: Mean wavelength o↵sets (in pixels) for unblended lines measured in regularly monitoredsettings. The left-hand panels are for the first-order MAMA settings; the right-hand panels are forthe first-order CCD settings. In each panel, the black line is for the L-mode setting given in thetitle of the panel, while the colored lines are for the corresponding M-mode settings noted in themiddle of the panel (where STIS was not operational). The vertical dotted lines for the CCD markthe last data obtained with the LINE lamp (cycle 10); subsequent cycles have used the HITM1lamp. While the mean o↵sets for most settings have remained roughly constant (and within thedesired accuracy of 0.2-0.3 pix), there appears to have been a slight (⇠ 0.1 pix) increase in theo↵sets for a number of the CCD settings after the switch to the HITM1 lamp.
12
Instrument Science Report STIS 2018-04
G140L 1425
2000 2005 2010 2015Date
-0.1
0.0
0.1
0.2
0.3
0.4
0.5
Stan
dard
Dev
iatio
n (p
ix)
117312181640
G230L 2376
2000 2005 2010 2015Date
-0.1
0.0
0.1
0.2
0.3
0.4
0.5
Stan
dard
Dev
iatio
n (p
ix)
16873055
G230LB 2375
2000 2005 2010 2015Date
-0.1
0.0
0.1
0.2
0.3
0.4
0.5
Stan
dard
Dev
iatio
n (p
ix)
1995241626973115
G430L 4300
2000 2005 2010 2015Date
-0.1
0.0
0.1
0.2
0.3
0.4
0.5
Stan
dard
Dev
iatio
n (p
ix)
3165368049615471
G750L 7751
2000 2005 2010 2015Date
-0.1
0.0
0.1
0.2
0.3
0.4
0.5
Stan
dard
Dev
iatio
n (p
ix)
5734676883119336
Figure 4: Standard deviations of wavelength residuals (in pixels) for unblended lines measuredin regularly monitored settings. The left-hand panels are for the first-order MAMA settings; theright-hand panels are for the first-order CCD settings. In each panel, the black line is for theL-mode setting given in the title of the panel, while the colored lines are for the correspondingM-mode settings noted in the middle of the panel (where STIS was not operational). The verticaldotted lines for the CCD mark the last data obtained with the LINE lamp (cycle 10); subsequentcycles have used the HITM1 lamp. While the scatter may have increased slightly for some of thesettings, the most recent values are all 0.3 pix.
13

Instrument Science Report STIS 2018-04
Line strengths: The wavelength-dependent fading of the calibration lamps (e.g., Peeples2017) has led to corresponding declines in both the strengths of the measured lines and thenumber of lines detected – particularly at the shorter wavelengths (Fig. 5 and AppendixTable 9; Appendix Tables 10 and 11). The decrease in the number of lines is most dramaticfor the subset of unblended, consistently detected (gnb) lines, which constitute a smallerfraction of the total detected lines in cycles 17–25 (columns 8 and 14, relative to columns7 and 13, in Table 4). In Figure 5, the average line strengths for each setting in cycles7–11 are shown relative to the values found in the early part of cycle 7; for cycles 17–25, thenormalization is to the values found in cycle 17 (except for G140M/1173, which is normalizedto cycle 19). That dual normalization is most appropriate for the CCD data (as the lamp forall CCD settings was switched from LINE to HITM1 in cycle 11) and for the G140M/1173data (as the lamp for that setting was switched from LINE to HITM2 in cycle 19). It issomewhat misleading, however, for the rest of the MAMA data – for which the lamp and (inmost cases) lamp current have not changed (except for several of the settings in cycles 24and 25).3 Normalizing the strengths of the lines in the cycle 24 G140M/1218 spectrum bythe corresponding values from cycle 7, for example, indicates that the strengths decreased bya factor of about 40 (on average), and by an even larger factor at the shortest wavelengths.These declines in line strength are consistent with the results of Peeples (2017) and with thetrends seen in a compilation of data for all of the calibration lamps4– both of which are basedon total count rates over the entire images. Figure 5 also indicates that the strengths of thelines in the MAMA/G230 settings are declining more rapidly than those of the correspondinglines in the CCD/G230B settings. Figure 6 shows the line strength ratios (cycle 23 vs. cycle17) for the individual lines measured in each of the five L-mode spectra. For all except theG750L/7751 setting, the ratios appear to be systematically smaller at the shorter wavelengthend of the setting; that trend is especially clear for G140L/1425 below about 1350 A. Thesevere declines in line strength at the shortest wavelengths – which cannot be ascribed tochanges in detector sensitivity (e.g., Carlberg & Monroe 2017) – motivated the switch to theHITM2 lamp (which is now brighter than the LINE lamp below about 1270 A, and is fadingless rapidly) for several MAMA settings in cycle 25.
Systematic trends: Several previous studies of the STIS wavelength calibration havefound slight systematic trends in the wavelength residuals vs. wavelength for some MAMAE140 and E230 echelle settings (Valenti 1996; Ayres 2008, 2010a, 2010b; Pas11; Son15).Similar trends were di�cult to discern in the first-order grating spectra in the latter two ref-erences, however, due largely to the relatively small number of lines identified and measuredin many of the G140M, G230M, G230MB, G430M, and G750M settings. In the presentstudy, the use of an expanded reference line list has enabled the identification of many morelines, particularly for some of the G230B and G430 settings (Appendix Table 12). Moreover,comparison of the results from many cycles indicates sets of lines that are both unblendedand consistently detected. Averaging the observed residuals for those most reliably mea-sured lines over several cycles then can provide a clearer view of any possible trends in theresiduals.
3The current for G140L/1425 and G230M/3055 was changed from 3.8 to 10 mA in cycle 24 (producingboth an overall increase in line strengths and changes in the relative strengths of lines from di↵erent species);the lamp for E140H/1271 and G140M/1218 was switched from LINE to HITM2 in cycle 25.
4available at http://www.stsci.edu/⇠STIS/monitors/lamp/stis lamps.pdf
14

Instrument Science Report STIS 2018-04
G140L 1425
2000 2005 2010 2015Date
0.0
0.2
0.4
0.6
0.8
1.0
1.2
Line
stre
ngth
ratio
117312181640
G230L 2376
2000 2005 2010 2015Date
0.0
0.2
0.4
0.6
0.8
1.0
1.2
Line
stre
ngth
ratio
16873055
G230LB 2375
2000 2005 2010 2015Date
0.0
0.2
0.4
0.6
0.8
1.0
1.2
Line
stre
ngth
ratio
1995241626973115
G430L 4300
2000 2005 2010 2015Date
0.0
0.2
0.4
0.6
0.8
1.0
1.2
Line
stre
ngth
ratio
3165368049615471
G750L 7751
2000 2005 2010 2015Date
0.0
0.2
0.4
0.6
0.8
1.0
1.2
Line
stre
ngth
ratio
5734676883119336
Figure 5: Mean ratios for strengths of lines measured in regularly monitored settings. The left-hand panels are for the first-order MAMA settings; the right-hand panels are for the first-orderCCD settings. In each panel, the black line is for the L-mode setting given in the title of thepanel, while the colored lines are for the corresponding M-mode settings noted in the middle of thepanel (where STIS was not operational). The vertical dotted lines for the CCD mark the last dataobtained with the LINE lamp (cycle 10); subsequent cycles have used the HITM1 lamp. The valuesfor cycles 7–10 are normalized to the early cycle 7 strengths; the post-SM4 (cycle 17–25) valuesare normalized to the cycle 17 strengths. Note that the declines for the G230B (CCD) settings areless severe than for the corresponding G230 (MAMA) settings. At the shortest wavelengths, thestrengths of lines in the LINE lamp spectra are now only several percent of their initial values incycle 7; several of those settings have now been switched to HITM2 (which is now brighter belowabout 1270 A).
15

Instrument Science Report STIS 2018-04
G140L 1425
1200 1300 1400 1500 1600 1700Wavelength
0.0
0.5
1.0
1.5
stre
ngth
(23
/ 17)
0.682
G230L 2376
1500 2000 2500 3000 3500Wavelength
0.0
0.5
1.0
1.5
stre
ngth
(23
/ 17)
0.744
G230LB 2375
1500 2000 2500 3000 3500Wavelength
0.0
0.5
1.0
1.5
stre
ngth
(23
/ 17)
0.881
G430L 4300
2500 3000 3500 4000 4500 5000 5500 6000Wavelength
0.0
0.5
1.0
1.5
stre
ngth
(23
/ 17)
0.951
G750L 7751
5000 6000 7000 8000 9000 10000Wavelength
0.0
0.5
1.0
1.5
stre
ngth
(23
/ 17)
0.987
Figure 6: Line strength ratios (cycle 23 vs. cycle 17) for individual lines in all five L-mode settings.The weighted mean ratio (noted at upper right; with weights based on the uncertainties on theratios for the individual lines) is given by the horizontal dashed line; there is a general tendencyfor the ratios to be smaller at the shorter wavelengths in each setting, however – especially forG140L/1425 below about 1350 A.
16

Instrument Science Report STIS 2018-04
Appendix Figures 8–12 show the average residuals for the individual lines measuredfor most of the first-order grating settings observed in cycles 7–11. As noted above, themost reliably measured lines (gnb) are those marked by a combination of the ”+”, ”x”,and open square symbols. While the number of points is still relatively small and/or thescatter is still fairly large for some settings, there do appear to be cases of consistentlynon-zero mean o↵sets (i.e., where the residuals for the gnb lines are predominantly positiveor negative; e.g., G230M/2659, G230M/3055, G430M/4194, G750L/7751, G750L/8975; seealso Fig. 3 and Table 4) and of possible linear or non-linear trends in the residuals withwavelength (e.g., G140M/1420, G140M/1714, G230L/2376, G230MB/1995, G230MB/2697,G230MB/3115, G430M/5471, G750M/8311, G750M/9336). A di↵erent set of CCD settingsexhibits consistently non-zero mean o↵sets in the post-SM4 data, due to the apparent ⇠0.1pixel increase in mean o↵sets following the change in lamp after cycle 10 (Table 4). Someconsistently ”discrepant” points may also be noted in some of the settings. In principle,systematic deviations in the wavelength calibration near the ends of the wavelength coverageof a given setting can produce disagreements in the wavelengths in the regions of overlapwith adjacent settings.
In several studies of the wavelength calibration of STIS echelle spectra, Ayres (2008,2010a, 2010b) has argued that such systematic trends in the wavelength residuals are likelydue to the combined e↵ects of a too-simple parameterization of the dispersion relations,relatively small numbers of lines used for the original calibration of some settings, and/orpersistent small-scale geometric distortions in the detectors (i.e., apart from the optical ef-fects) – and that such trends can be significantly reduced by the incorporation of additionalhigher-order terms in the dispersion relations. The current STIS echelle dispersion relationsare parameterized as
s = A0 + A1m�+ A2(m�)2 + A3m+ A4�+ A5m2�+ A6m�2
(e.g., Hulbert et al. 1997), where s is the position along the dispersion direction, m isthe order number, and the An are the dispersion coe�cients. For the first-order gratingspectra (m = 1), that formula reduces to a quadratic in �. For the echelle spectra, Ayres(2010b) found that the use of a more extensive set of accurate reference wavelengths andthe addition of two terms [m2 and (m�)3] to the dispersion relations yielded the most signif-icant overall improvements to the echelle wavelength solutions.5 Adding other higher-orderterms to the dispersion relations for individual echelle settings further improved the resultsfor those particular settings (Ayres 2010a). Analyses of the MAMA echelle mode spectraobtained in cycles 7–11 and 17–25 – and comparisons with the trends found by Ayres (2008,2010a, 2010b), Pas11, and Son15 – will be explored in a subsequent report.
Changes: During the past two cycles (24 and 25), a number of changes were made to thedispersion monitor observing programs in order to compensate for the fading of the calibra-tion lamps. In cycle 24, the operating current for the G140L/1425 and G230M/3055 settingswas increased from 3.8 mA to 10 mA – yielding both general increases in the strengths of the
5Initial indications of increased residuals for some echelle settings following the incorporation of thoseterms were found to be due to the monthly o↵sets of MAMA spectra that were performed between 1998January and 2002 August (i.e., for most of cycles 7–11; Pas11; see also Lindler 1999).
17

Instrument Science Report STIS 2018-04
Table 4: Monitored settings: average values (first-order MAMA and CCD)Cycles 7–11 Cycles 17–25 17–25
Grating Wave O↵set StDev Nlines O↵set StDev Nlines vs.all gooda all gooda all gooda all gooda all gooda all gooda 7–11b
G140L 1425 �0.01 0.08 0.25 0.21 61 14 �0.04 0.00 0.23 0.17 73 11 �0.08
G140M 1173 �0.02 �0.02 0.23 0.23 11 111218 �0.05 0.00 0.22 0.16 29 20 �0.03 �0.03 0.22 0.19 28 9 �0.031272 0.11 0.13 0.30 0.22 33 181420 0.03 0.02 0.26 0.20 43 281567 0.11 0.10 0.25 0.17 33 201640 0.17 0.23 0.23 0.09 15 51714 0.05 0.06 0.26 0.24 26 18
G230L 2376 �0.01 0.03 0.25 0.20 74 26 0.00 0.07 0.27 0.20 77 24 0.04
G230M 1687 �0.01 0.01 0.24 0.19 35 26 0.02 0.03 0.23 0.17 35 18 0.021933 0.00 0.00 0.20 0.19 30 242176 �0.02 �0.02 0.26 0.19 33 232419 �0.08 �0.07 0.22 0.20 23 182659 �0.10 �0.20 0.32 0.23 27 182898 �0.10 �0.11 0.25 0.24 15 93055 �0.23 �0.26 0.25 0.18 22 15 �0.19 �0.24 0.24 0.14 23 11 0.02
G230LB 2375 0.01 0.05 0.25 0.17 79 29 0.04 0.13 0.27 0.20 102 30 0.08
G230MB 1995 0.00 �0.01 0.19 0.13 60 33 �0.01 0.00 0.24 0.13 53 10 0.012416 0.05 0.06 0.18 0.13 55 27 0.06 0.21 0.27 0.09 51 7 0.152697 �0.05 �0.03 0.16 0.11 72 42 �0.01 0.11 0.24 0.09 55 12 0.143115 0.03 �0.01 0.17 0.14 63 36 0.07 0.09 0.20 0.14 51 26 0.10
G430L 4300 �0.11 �0.12 0.26 0.17 74 20 �0.08 �0.11 0.25 0.20 82 23 0.01
G430M 3165 �0.04 �0.04 0.16 0.13 68 44 0.04 0.03 0.16 0.13 61 32 0.073680 0.06 0.05 0.18 0.16 60 42 0.16 0.15 0.20 0.19 47 25 0.104194 �0.17 �0.19 0.22 0.17 50 354961 �0.03 �0.05 0.15 0.10 38 31 0.03 0.03 0.18 0.09 30 19 0.085471 0.06 0.05 0.14 0.11 26 24 0.13 0.15 0.16 0.07 22 12 0.10
G750L 7751 �0.21 �0.19 0.11 0.10 49 37 �0.09 �0.08 0.11 0.10 54 42 0.118975 �0.12 �0.14 0.16 0.13 34 26
G750M 5734 �0.06 �0.05 0.08 0.06 27 22 0.05 0.05 0.12 0.07 26 20 0.106581 0.04 0.05 0.07 0.06 19 156768 �0.01 �0.02 0.10 0.09 13 10 0.07 0.08 0.03 0.03 10 9 0.108311 0.00 �0.01 0.07 0.07 18 17 0.08 0.07 0.06 0.06 19 17 0.088561 0.04 0.04 0.07 0.07 24 219336 �0.10 �0.09 0.11 0.11 30 27 0.04 0.05 0.12 0.09 20 15 0.14
10363 �0.04 �0.04 0.21 0.21 8 8Notes: a For the subset of unblended lines measured in most of the cycles (”gnb”).
b Di↵erence in mean o↵set for cycles 17–25 versus cycles 7–11 (i.e., column 10 minus column 4).Mean o↵sets and standard deviations are in pixels.G140M/1173 data are from Spectroscopic Sensitivity and Focus Monitor programs
18

Instrument Science Report STIS 2018-04
lines and changes in the relative line strengths. Further adjustments were made in cycle 25:(1) The G230MB/1713 setting was dropped, because there were too few detectable lines evenin the relatively long exposures used for that setting, and because no GO programs have usedthe setting since SM4. (2) The total exposure times for G230MB/1995 and G230MB/2416were increased, and multiple exposures were obtained in order to facilitate removal of cos-mic rays. More reliable results are now obtained for those two settings. (3) The lamp forthe E140H/1271 and G140M/1218 settings was changed from LINE to HITM2, to enabledetection of more lines below 1270 A. (4) The exposure times for several other settings wereincreased – yielding slight increases in the number of detected lines.
4. Conclusions / Recommendations
Examination of wavelength calibration spectra from cycles 7–11 and 17–25, using a refined,uniform analysis procedure and an expanded list of more accurate reference wavelengths,indicates that all of the monitored STIS first-order settings remain within the desired externaland internal accuracies. For all of the first-order settings observed in cycle 25, the meanwavelength o↵sets for unblended lines (relative to the corresponding laboratory referencevalues) are 0.2 pixel, and the standard deviations of the residuals are < 0.3 pixel. Thereappears to have been a slight (⇠0.1 pixel) increase in the mean o↵sets for most of the first-order CCD settings in cycle 11, when the lamp used for the CCD calibrations was changedfrom LINE to HITM1; the mean o↵sets for some of the settings may exhibit weak seculartrends. Consistently non-zero mean o↵sets and/or apparent trends of the residuals withwavelength for some of the settings – reminiscent of similar results found in analyses ofSTIS echelle spectra – suggest that the wavelength calibration could be improved. If thecalibration lamps continue to fade at the current apparent rates (e.g., Peeples 2017; thisstudy), the changes in the dispersion monitor programs made for cycles 24 and 25 shouldbe su�cient to allow adequate monitoring of the STIS wavelength calibration for the nextseveral cycles.
There are some issues concerning the wavelength calibration, however, that remain to beaddressed:
• Similar analyses – examining the data from all available cycles versus the more exten-sive and accurate rest wavelengths now available – should be performed both for theMAMA echelle spectra and for CCD spectra obtained at the E1 pseudo-aperture.
• Given that work has begun on a ”legacy archive” of STIS spectra, that some deficien-cies in the current wavelength calibration have been noted (e.g., Valenti 1996; Ayres2008, 2010a, 2010b; Pas11; Son15; this study), and that more extensive and accu-rate laboratory wavelengths are now available, revisions to the wavelength calibrationshould be considered. While adoption of a more physical, instrument-based model(e.g., Kerber et al. 2006a) would be desirable, much of the potential improvementin the calibration might be realized more simply by incorporating several additionalterms in the dispersion relations (e.g., Ayres 2008, 2010a, 2010b).
• In connection with a re-calibration, it would be useful to obtain one more set of ob-servations covering more of the available wavelength settings (e.g., as in cycles 11 and
19
Instrument Science Report STIS 2018-04
17) – to reduce the interpolations and extrapolations of dispersion coe�cients thatwould otherwise be necessary. Deeper exposures for some of the settings (e.g., Table 3of Pas11) would increase the number of detectable lines – thus enabling more welldetermined fits to the dispersion relations for those settings.
• A more specific assigning of relative strengths to the lines from the di↵erent species inthe reference wavelength list, based on the actual observations of the onboard Pt/Cr-Ne lamps used for the calibrations – extending the work of Ayres (2008, 2010a, 2010b)to longer wavelengths – would aid the evaluation of the CCD spectra.
• At present, the LINE lamp is still brighter than the HITM2 lamp longward of about1270 A, but the more rapid decline of the LINE lamp suggests that it might be usefulto switch some of the other short-wavelength settings to HITM2 in the near future.The strengths of the lines in all three lamps, for di↵erent wavelength regimes, shouldbe monitored.
• As the fading of the calibration lamps a↵ects our ability to assess the calibration at theshortest wavelengths, it would be of interest to try to understand why those lamps arefading. While such severe time-dependent fading has not been seen in ground-basedtesting of similar lamps (e.g., Nave et al. 2012), an apparent fading at the shortestwavelengths seen in some tests was ascribed to degraded alignment and focus at thosewavelengths (Kerber et al. 2006). Could such alignment/focus issues be at least partlyresponsible for the observed severe fading of the lamps at the shortest wavelengths?Is there any evidence for di↵erences in the fading of lines from di↵erent species, or forany broadening of the lines with time?
• With the increases in exposure time adopted for some settings in cycle 25, there is nomore time available in the usual allocation for these programs (3 internal orbits forthe CCD, 7 internal orbits for the MAMA). It may be useful, however, to split moreof the CCD exposures into two, in order to enable elimination of cosmic rays – Or,alternatively, to try to enhance the analysis code to do that for single exposures.
• At this point, all but one of the regularly monitored STIS settings use a lamp currentof 10 mA. Increasing the current to 20 mA for settings where most of the lines areweak, while possible in principle, may not be desirable – as care would need to betaken to not saturate the MAMA detectors.
Acknowledgements
We thank D. Lindler for supplying the original line lists used for calibration and informationon how that calibration was performed and P. Sonnentrucker for comments on the originalversion of this report. Various other members of the STIS team (especially P. Sonnentrucker,S. Lockwood, and T. Sohn) provided initial assistance with the analysis software.
20

Instrument Science Report STIS 2018-04
Change History for STIS ISR 2018-04
Version 1: 2018 Aug 29 – original report
References
Ayres, T. R. 2008, ApJ, 177, 626Ayres, T. R. 2010a, ApJS, 187, 149Ayres, T. R. 2010b, in The 2010 Space Telescope Science Institute Calibration Workshop –
Hubble after SM4. Preparing JWST, eds. S. Deustua & C. Oliveira, p. 57, Ironing Out theWrinkles in STIS
Baum, S. 1997, STIS Instrument Science Report 1997-01, Automatic and GO Wavecals, forCCD and MAMA Spectroscopic Observations
Carlberg, J. K. & Monroe, T. 2017, STIS Instrument Science Report 2017-06, Updated TimeDependent Sensitivity Corrections for STIS Spectral Modes
Espey, B. 1999, STIS Technical Instrument Report 1999-03, Revised Dispersion Solution Soft-ware
Friedman, S. D. 2005, STIS Instrument Science Report 2005-03, Wavelength Calibration Ac-curacy of the First-Order CCD Modes Using the E1 Aperture
Hodge, P., Baum, S., McGrath, M., Hulbert, S., & Christensen, J. 1998, STIS InstrumentScience Report 1998-12, Calstis4, calstis11, calstis12: Wavecal Processing in the STIS Cali-bration Pipeline
Hulbert, S, Hodge, P., & Baum, S. 1996, STIS Instrument Science Report 1996-019, The STScISTIS Pipeline VI: Reduction of WAVECALs
Hulbert, S., Hodge, P., & Busko, I. 1997, STIS Instrument Science Report 1997-02, The STScISTIS Pipeline VII: Extraction of 1-D Spectra
Kerber, F., Rosa, M. R., Sansonetti, C. J., et al. 2004, Proc. SPIE, 5488, 679Kerber, F., Bristow, P., & Rosa, M. R. 2006a, in The 2005 HST Calibration Workshop, eds.
A. M. Koekemoer, P. Goudfrooij, & L. L. Dressel, p. 309, STIS Calibration Enhancement(STIS-CE): Dispersion Solutions Based on a Physical Instrument Model
Kerber, F., Bristow, P., Rosa, M. R., et al. 2006b, in The 2005 HST Calibration Workshop,eds. A. M. Koekemoer, P. Goudfrooij, & L. L. Dressel, p. 318, Characterization of Pt/Cr-NeHollow-Cathode Lamps for Wavelength Standards in Space Astronomy
Kramida, A. E. & Nave, G. 2006a, Eur. Phys. J. D, 37, 1Kramida, A. E. & Nave, G. 2006b, Eur. Phys. J. D, 39, 331Lindler, D. 1999, STIS IDT Post-Launch Analysis Report #062, Echelle Wavelength Calibra-
tion UpdateMcGrath, M., Busko, & Hodge, P. 1999, STIS Instrument Science Report 1999-03, Calstis6:
Extraction of 1-D Spectra in the STIS Calibration PipelineNave, G., Sansonetti, C. J., Kerber, F., et al. 2008, Proc. SPIE, 7011, 3LNave, G., Sansonetti, C. J., Penton, S. V., et al. 2012, PASP, 124, 1295Pascucci, I., Pro�tt, C., Ghavamian, P., et al. 2010a, STIS Instrument Science Report 2010-10,
Monitoring of the Wavelength Calibration Lamps for the Hubble Space Telescope
21

Instrument Science Report STIS 2018-04
Pascucci, I., Pro�tt, C., Ghavamian, P., et al. 2010b, Proc. SPIE, 7731, 3BPascucci, I., Pro�tt, C. R., Ghavamian, P., et al. 2010c, in The 2010 Space Telescope Science
Institute Calibration Workshop – Hubble after SM4. Preparing JWST, eds. S. Deustua &C. Oliveira. p. 439, Monitoring of the Wavelength Calibration Lamps for the Hubble SpaceTelescope
Pascucci, I., Hodge, P., Pro�tt, C. R., & Ayres, T. 2011, STIS Instrument Science Report2011-01, Wavelength Calibration Accuracy for the STIS CCD and MAMA Modes (Pas11)
Peeples, M. 2017, STIS Instrument Science Report 2017-04, On the Fading of the STIS Ultra-violet Calibration Lamps
Reader, J., Acquista, N., Sansonetti, C. J., & Sansonetti, J. E. 1990, ApJS, 72, 831Sansonetti, C. J., Kerber, F., Reader, J., & Rosa, M. R. 2004, ApJS, 153, 555Sansonetti, C. J. & Nave, G. 2014, ApJS, 213, 28Sansonetti, C. J., Nave, G., Reader, J., & Kerber, F. 2012, ApJS, 202, 15Smith, M. A. 1990, in Evolution in Astrophysics: IUE Astronomy in the Era of New Space
Missions, ed. E. J. Rolfe, ESA SP-310, p. 627, A Revised Parameterization of the DispersionConstants for High Dispersion IUE Images
Sonnentrucker, P. 2015, STIS Instrument Science Report 2015-02, Multi-Cycle Analysis of theSTIS Dispersion Solutions (Son15)
Valenti, J. A. 1966, STIS IDT Pre-Launch Analysis Report #072, Current Status of STISEchelle Wavelength Solutions
Wallace, L. & Hinkle, K. 2009, ApJ, 700, 720
STIS team calibration close-out Instrument Science Reports:cycle 7: Dashevsky, I., & McGrath, M. A. 2000, STIS ISR 2000-04cycle 8: Diaz-Miller, R. I., & Goudfrooij, P. 2001, STIS ISR 2001-04cycle 9: Pro�tt, C. R., & Davies, J. 2003, STIS ISR 2003-02cycle 10: Dressel, L., & Davies, J. 2004, STIS ISR 2004-06cycle 17: Wolfe, M. A., Osten, R. A., Aloisi, A. et al. 2012, STIS ISR 2012-03cycle 18: Kriss, G. A., Wolfe, M. A., Aloisi, A. et al. 2013, STIS ISR 2013-03cycle 19: Roman-Duval, J., Ely, J., Aloisi, A. et al. 2014, STIS ISR 2014-01cycle 20: Roman-Duval, J., Ely, J., Cox, C. et al. 2015, STIS ISR 2015-08cycle 21: Sana, H., Fox, A., Roman-Duval, J. et al. 2015, STIS ISR 2015-09
Appendices
• Figure 6 – wavelength di↵erences between the LindPC list and the current NISTvalues
• Figures 7–11 – average wavelength residuals (observed minus reference) for individuallines in settings monitored for all five STIS gratings during cycles 7–11
• Tables 5–6 – detailed mean wavelength o↵set values for the MAMA and CCD settingsmonitored in each cycle
22

Instrument Science Report STIS 2018-04
• Tables 7–8 – standard deviations of the wavelength residuals for the MAMA andCCD settings monitored in each cycle
• Table 9 – strengths of emission lines, generally relative to the values in cycles 7 and17, for the MAMA and CCD settings monitored in each cycle
• Tables 10–11 – number of unblended lines measured for the MAMA and CCD settingsmonitored in each cycle
• Table 12 – comparison of mean wavelength o↵sets, scatter in the residuals, andnumber of lines measured for the MAMA and CCD settings monitored in cycle 17(versus Pas11) and in cycles 19–21 (versus Son15)
23

Instrument Science Report STIS 2018-04
Lindler (priv. comm.) Cr
2000 4000 6000 8000 10000wavelength
-0.2
-0.1
0.0
0.1
0.2
delta
Lindler (priv. comm.) Ne
2000 4000 6000 8000 10000wavelength
-0.2
-0.1
0.0
0.1
0.2
delta
Lindler (priv. comm.) Pt
2000 4000 6000 8000 10000wavelength
-0.2
-0.1
0.0
0.1
0.2
delta
Figure 7: Di↵erences in reference wavelengths (in A): LindPC line list (similar to the original STISline list; Lindler, private communication) vs. current NIST values. While there are large (tens ofmA) di↵erences for many Cr and Ne lines at the longer wavelengths, many of the larger di↵erencesare for relatively weak lines. For comparison, one pixel corresponds to 2.73 A for G430L, 0.28 Afor G430M, 4.92 A for G750L, and 0.56 A for G750M. Note that the current NIST values for Ptneed updating.
24

Instrument Science Report STIS 2018-04
L1425_1
1100 1200 1300 1400 1500 1600 1700Wavelength
-2.0
-1.5
-1.0
-0.5
0.0
0.5
1.0
Mea
n R
esid
ual
all (-0.01, 0.25, 61) (+)nob (-0.02, 0.29, 23) (sq)5-7 (0.010, 0.21, 36) (x)gnb (0.081, 0.21, 14)
M1218_1
1190 1200 1210 1220 1230 1240 1250Wavelength
-2.0
-1.5
-1.0
-0.5
0.0
0.5
1.0
Mea
n R
esid
ual
all (-0.05, 0.22, 29) (+)nob (-0.03, 0.21, 28) (sq)5-7 (-0.00, 0.16, 20) (x)gnb (-0.00, 0.16, 20)
M1272_1
1240 1250 1260 1270 1280 1290 1300Wavelength
-2.0
-1.5
-1.0
-0.5
0.0
0.5
1.0
Mea
n R
esid
ual
all (0.107, 0.30, 33) (+)nob (0.117, 0.30, 32) (sq)5-7 (0.134, 0.22, 18) (x)gnb (0.134, 0.22, 18)
M1420_1
1390 1400 1410 1420 1430 1440 1450Wavelength
-2.0
-1.5
-1.0
-0.5
0.0
0.5
1.0
Mea
n R
esid
ual
all (0.025, 0.26, 43) (+)nob (0.015, 0.25, 42) (sq)5-7 (0.022, 0.20, 28) (x)gnb (0.022, 0.20, 28)
M1567_1
1540 1550 1560 1570 1580 1590 1600Wavelength
-2.0
-1.5
-1.0
-0.5
0.0
0.5
1.0
Mea
n R
esid
ual
all (0.114, 0.25, 33) (+)nob (0.116, 0.25, 32) (sq)5-7 (0.100, 0.17, 21) (x)gnb (0.103, 0.17, 20)
M1714_1
1680 1690 1700 1710 1720 1730 1740Wavelength
-2.0
-1.5
-1.0
-0.5
0.0
0.5
1.0
Mea
n R
esid
ual
all (0.050, 0.26, 26) (+)nob (0.050, 0.26, 26) (sq)5-7 (0.058, 0.24, 18) (x)gnb (0.058, 0.24, 18)
Figure 8: Average residuals (in pixels) for individual lines measured in G140L and G140M settingsmonitored in cycles 7–11. In each case, lines measured in any cycle (all) are given by ”+”; unblendedlines (nob) are given by open squares; and lines measured in at least five of the seven data sets(5-7) are given by ”x”; the most reliable lines (gnb) are thus given by a superposition of all threesymbols. The mean average o↵set, the standard deviation, and the number of points for each ofthose are given in the lower right-hand corner of each panel. For the most reliable lines, the meano↵sets range from 0.00 to 0.13 pix; the standard deviations are all less than 0.25 pix.
25

Instrument Science Report STIS 2018-04
L2376_1
1500 2000 2500 3000 3500Wavelength
-2.0
-1.5
-1.0
-0.5
0.0
0.5
1.0
Mea
n R
esid
ual
all (-0.01, 0.25, 74) (+)nob (-0.02, 0.24, 35) (sq)5-7 (0.029, 0.21, 52) (x)gnb (0.025, 0.20, 26)
M1687_1
1640 1660 1680 1700 1720 1740Wavelength
-2.0
-1.5
-1.0
-0.5
0.0
0.5
1.0
Mea
n R
esid
ual
all (-0.01, 0.24, 35) (+)nob (-0.00, 0.23, 33) (sq)5-7 (0.020, 0.19, 27) (x)gnb (0.012, 0.19, 26)
M1933_1
1880 1900 1920 1940 1960 1980Wavelength
-2.0
-1.5
-1.0
-0.5
0.0
0.5
1.0
Mea
n R
esid
ual
all (-0.00, 0.20, 30) (+)nob (0.001, 0.20, 29) (sq)5-7 (-0.00, 0.19, 25) (x)gnb (0.001, 0.19, 24)
M2176_1
2120 2140 2160 2180 2200 2220Wavelength
-2.0
-1.5
-1.0
-0.5
0.0
0.5
1.0
Mea
n R
esid
ual
all (-0.02, 0.26, 33) (+)nob (-0.02, 0.25, 31) (sq)5-7 (-0.02, 0.22, 25) (x)gnb (-0.02, 0.19, 23)
M2419_1
2360 2380 2400 2420 2440 2460 2480Wavelength
-2.0
-1.5
-1.0
-0.5
0.0
0.5
1.0
Mea
n R
esid
ual
all (-0.08, 0.22, 23) (+)nob (-0.08, 0.22, 23) (sq)5-7 (-0.07, 0.20, 18) (x)gnb (-0.07, 0.20, 18)
M2659_1
2600 2620 2640 2660 2680 2700Wavelength
-2.0
-1.5
-1.0
-0.5
0.0
0.5
1.0
Mea
n R
esid
ual
all (-0.10, 0.32, 27) (+)nob (-0.12, 0.31, 26) (sq)5-7 (-0.20, 0.23, 18) (x)gnb (-0.20, 0.23, 18)
M2898_1
2840 2860 2880 2900 2920 2940Wavelength
-2.0
-1.5
-1.0
-0.5
0.0
0.5
1.0
Mea
n R
esid
ual
all (-0.10, 0.25, 15) (+)nob (-0.10, 0.25, 15) (sq)5-7 (-0.11, 0.24, 9) (x)gnb (-0.11, 0.24, 9)
M3055_1
3000 3020 3040 3060 3080 3100Wavelength
-2.0
-1.5
-1.0
-0.5
0.0
0.5
1.0
Mea
n R
esid
ual
all (-0.23, 0.25, 22) (+)nob (-0.27, 0.20, 21) (sq)5-7 (-0.26, 0.18, 15) (x)gnb (-0.26, 0.18, 15)
Figure 9: Average residuals (in pixels) for individual lines measured in G230L and G230M settingsmonitored in cycles 7–11. In each case, lines measured in any cycle (all) are given by ”+”; unblendedlines (nob) are given by open squares; and lines measured in at least five of the seven data sets (5-7)are given by ”x”; the most reliable lines (gnb) are thus given by a superposition of all three symbols.The mean average o↵set, the standard deviation, and the number of points for each of those aregiven in the lower right-hand corner of each panel. For the most reliable lines, the mean o↵setsrange from �0.20 to 0.03 pix; the standard deviations are all less than 0.25. Note the systematictrends in the average residuals, as functions of wavelength, for some settings (especially L2376).
26
Instrument Science Report STIS 2018-04
LB2375_1
1500 2000 2500 3000 3500Wavelength
-2.0
-1.5
-1.0
-0.5
0.0
0.5
1.0
Mea
n R
esid
ual
all (0.009, 0.25, 79) (+)nob (0.031, 0.19, 40) (sq)5-7 (0.069, 0.19, 44) (x)gnb (0.052, 0.17, 29)
MB1995_1
1900 1950 2000 2050 2100Wavelength
-2.0
-1.5
-1.0
-0.5
0.0
0.5
1.0
Mea
n R
esid
ual
all (-0.00, 0.19, 60) (+)nob (-0.01, 0.18, 56) (sq)5-7 (2.432, 0.15, 35) (x)gnb (-0.01, 0.13, 33)
MB2416_1
2300 2350 2400 2450 2500Wavelength
-2.0
-1.5
-1.0
-0.5
0.0
0.5
1.0
Mea
n R
esid
ual
all (0.047, 0.18, 55) (+)nob (0.037, 0.14, 46) (sq)5-7 (0.069, 0.14, 30) (x)gnb (0.056, 0.13, 27)
MB2697_1
2600 2650 2700 2750 2800Wavelength
-2.0
-1.5
-1.0
-0.5
0.0
0.5
1.0
Mea
n R
esid
ual
all (-0.05, 0.16, 72) (+)nob (-0.03, 0.15, 61) (sq)5-7 (-0.05, 0.12, 47) (x)gnb (-0.03, 0.11, 42)
MB3115_1
3000 3050 3100 3150 3200Wavelength
-2.0
-1.5
-1.0
-0.5
0.0
0.5
1.0
Mea
n R
esid
ual
all (0.026, 0.17, 63) (+)nob (0.022, 0.17, 59) (sq)5-7 (-0.01, 0.15, 38) (x)gnb (-0.01, 0.14, 36)
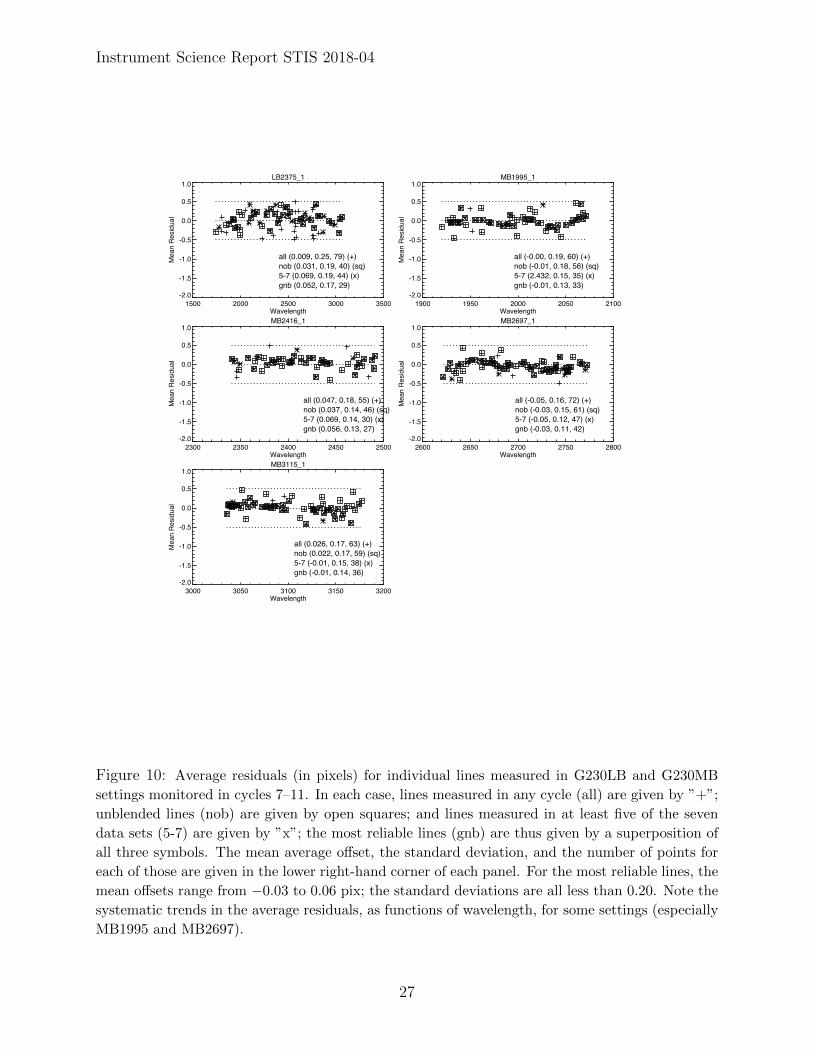
Figure 10: Average residuals (in pixels) for individual lines measured in G230LB and G230MBsettings monitored in cycles 7–11. In each case, lines measured in any cycle (all) are given by ”+”;unblended lines (nob) are given by open squares; and lines measured in at least five of the sevendata sets (5-7) are given by ”x”; the most reliable lines (gnb) are thus given by a superposition ofall three symbols. The mean average o↵set, the standard deviation, and the number of points foreach of those are given in the lower right-hand corner of each panel. For the most reliable lines, themean o↵sets range from �0.03 to 0.06 pix; the standard deviations are all less than 0.20. Note thesystematic trends in the average residuals, as functions of wavelength, for some settings (especiallyMB1995 and MB2697).
27

Instrument Science Report STIS 2018-04
L4300_1
2500 3000 3500 4000 4500 5000 5500 6000Wavelength
-2.0
-1.5
-1.0
-0.5
0.0
0.5
1.0
Mea
n R
esid
ual
all (-0.11, 0.26, 74) (+)nob (-0.12, 0.17, 24) (sq)5-7 (-0.11, 0.23, 48) (x)gnb (-0.12, 0.17, 20)
M3165_1
3000 3050 3100 3150 3200 3250 3300 3350Wavelength
-2.0
-1.5
-1.0
-0.5
0.0
0.5
1.0
Mea
n R
esid
ual
all (-0.04, 0.16, 68) (+)nob (-0.03, 0.16, 57) (sq)5-7 (-0.06, 0.13, 54) (x)gnb (-0.04, 0.13, 44)
M3680_1
3500 3550 3600 3650 3700 3750 3800 3850Wavelength
-2.0
-1.5
-1.0
-0.5
0.0
0.5
1.0
Mea
n R
esid
ual
all (0.059, 0.18, 60) (+)nob (0.060, 0.16, 50) (sq)5-7 (0.050, 0.17, 50) (x)gnb (0.053, 0.16, 42)
M4194_1
4050 4100 4150 4200 4250 4300 4350Wavelength
-2.0
-1.5
-1.0
-0.5
0.0
0.5
1.0
Mea
n R
esid
ual
all (-0.17, 0.22, 50) (+)nob (-0.17, 0.20, 46) (sq)5-7 (-0.19, 0.19, 39) (x)gnb (-0.19, 0.17, 35)
M4961_1
4800 4850 4900 4950 5000 5050 5100Wavelength
-2.0
-1.5
-1.0
-0.5
0.0
0.5
1.0
Mea
n R
esid
ual
all (-0.03, 0.15, 38) (+)nob (-0.03, 0.15, 37) (sq)5-7 (-0.05, 0.11, 32) (x)gnb (-0.05, 0.10, 31)
M5471_1
5300 5350 5400 5450 5500 5550 5600Wavelength
-2.0
-1.5
-1.0
-0.5
0.0
0.5
1.0
Mea
n R
esid
ual
all (0.064, 0.14, 26) (+)nob (0.064, 0.14, 26) (sq)5-7 (0.045, 0.11, 24) (x)gnb (0.045, 0.11, 24)
Figure 11: Average residuals (in pixels) for individual lines measured in G430L and G430M settingsmonitored in cycles 7–11. In each case, lines measured in any cycle (all) are given by ”+”; unblendedlines (nob) are given by open squares; and lines measured in at least five of the seven data sets (5-7)are given by ”x”; the most reliable lines (gnb) are thus given by a superposition of all three symbols.The mean average o↵set, the standard deviation, and the number of points for each of those aregiven in the lower right-hand corner of each panel. For the most reliable lines, the mean o↵setsrange from �0.19 to 0.05 pix; the standard deviations are all less than 0.20. Note the systematictrends in the average residuals, as functions of wavelength, for some settings (especially M5471).
28

Instrument Science Report STIS 2018-04
L7751_1
5000 6000 7000 8000 9000 10000Wavelength
-2.0
-1.5
-1.0
-0.5
0.0
0.5
1.0
Mea
n R
esid
ual
all (-0.21, 0.11, 49) (+)nob (-0.21, 0.11, 42) (sq)5-7 (-0.19, 0.10, 44) (x)gnb (-0.19, 0.10, 37)
L8975_1
6.0×10³ 7.0×10³ 8.0×10³ 9.0×10³ 1.0×10⁴ 1.1×10⁴ 1.2×10⁴
Wavelength
-2.0
-1.5
-1.0
-0.5
0.0
0.5
1.0
Mea
n R
esid
ual
all (-0.12, 0.16, 34) (+)nob (-0.14, 0.13, 30) (sq)5-7 (-0.12, 0.16, 29) (x)gnb (-0.14, 0.13, 26)
M5734_1
5500 5600 5700 5800 5900 6000 6100Wavelength
-2.0
-1.5
-1.0
-0.5
0.0
0.5
1.0
Mea
n R
esid
ual
all (-0.06, 0.08, 27) (+)nob (-0.06, 0.08, 26) (sq)5-7 (-0.05, 0.06, 23) (x)gnb (-0.05, 0.06, 22)
M6581_1
6300 6400 6500 6600 6700 6800Wavelength
-2.0
-1.5
-1.0
-0.5
0.0
0.5
1.0
Mea
n R
esid
ual
all (0.036, 0.07, 19) (+)nob (0.036, 0.07, 19) (sq)5-7 (0.054, 0.06, 15) (x)gnb (0.054, 0.06, 15)
M6768_1
6500 6600 6700 6800 6900 7000 7100Wavelength
-2.0
-1.5
-1.0
-0.5
0.0
0.5
1.0
Mea
n R
esid
ual
all (-0.01, 0.10, 13) (+)nob (-0.01, 0.10, 13) (sq)5-7 (-0.02, 0.09, 10) (x)gnb (-0.02, 0.09, 10)
M8311_1
8000 8100 8200 8300 8400 8500 8600Wavelength
-2.0
-1.5
-1.0
-0.5
0.0
0.5
1.0
Mea
n R
esid
ual
all (-0.00, 0.07, 18) (+)nob (-0.01, 0.07, 17) (sq)5-7 (-0.00, 0.07, 18) (x)gnb (-0.01, 0.07, 17)
M8561_1
8300 8400 8500 8600 8700 8800 8900Wavelength
-2.0
-1.5
-1.0
-0.5
0.0
0.5
1.0
Mea
n R
esid
ual
all (0.042, 0.07, 24) (+)nob (0.041, 0.07, 23) (sq)5-7 (0.036, 0.07, 22) (x)gnb (0.035, 0.07, 21)
M9336_1
9000 9100 9200 9300 9400 9500 9600Wavelength
-2.0
-1.5
-1.0
-0.5
0.0
0.5
1.0
Mea
n R
esid
ual
all (-0.10, 0.11, 30) (+)nob (-0.10, 0.12, 29) (sq)5-7 (-0.09, 0.11, 28) (x)gnb (-0.09, 0.11, 27)
Figure 12: Average residuals (in pixels) for individual lines measured in G750L and G750M settingsmonitored in cycles 7–11. In each case, lines measured in any cycle (all) are given by ”+”; unblendedlines (nob) are given by open squares; and lines measured in at least five of the seven data sets (5-7)are given by ”x”; the most reliable lines (gnb) are thus given by a superposition of all three symbols.The mean average o↵set, the standard deviation, and the number of points for each of those aregiven in the lower right-hand corner of each panel. For the most reliable lines, the mean o↵setsrange from �0.19 to 0.05 pix; the standard deviations are all less than 0.15. Note the systematictrends in the average residuals, as functions of wavelength, for some settings (especially M8311 andM9336).
29

Instrument Science Report STIS 2018-04
Table 5: Monitored settings: mean o↵sets (first-order MAMA; in pixels)Grating Wave 7a 7b 8a 8b 9 10 11 17 18 19 20 21 22 23 24 25G140L 1425 0.02 0.03 0.00 0.06 0.03 0.05 0.01 0.09 -0.02 0.04 0.11 0.13 0.02 0.00 -0.13 -0.11
G140M 1173 0.00 -0.02 0.00 -0.07 0.00 -0.05 0.01 0.001218 0.00 -0.01 0.05 -0.02 0.01 -0.08 -0.03 0.06 -0.07 -0.01 -0.05 -0.03 -0.11 -0.06 -0.02 -0.021222 0.01 0.161272 0.12 0.13 0.13 0.10 0.13 0.09 0.101321 0.05 0.021371 0.001387 0.091400 0.151420 0.00 0.02 0.06 0.01 0.06 0.05 0.03 0.031470 0.071518 0.051540 0.14 0.101550 0.211567 0.13 0.09 0.11 0.06 0.12 0.11 0.071616 0.051640 0.15 0.24 0.18 0.24 0.18 0.11 0.26 0.09 0.18 0.181665 0.111714 -0.01 0.07 0.10 0.05 0.09 0.04 0.00
G230L 2376 -0.03 0.04 0.00 0.06 0.01 -0.03 0.00 0.00 0.06 0.02 0.02 0.07 0.03 0.08 0.08 0.01
G230M 1687 -0.02 0.01 0.00 0.03 0.00 0.00 -0.01 0.08 0.01 -0.02 0.03 0.03 0.01 -0.02 0.00 -0.011769 -0.121851 -0.051884 -0.131933 0.00 0.01 0.00 0.00 0.04 -0.02 0.002014 -0.132095 -0.152176 -0.01 -0.05 -0.01 0.02 -0.04 -0.03 -0.032257 -0.082338 -0.13 -0.092419 0.00 -0.10 -0.06 -0.09 -0.01 -0.07 -0.082499 -0.102579 0.102600 -0.082659 -0.08 -0.16 -0.19 -0.16 -0.24 -0.15 -0.182739 -0.162800 -0.052818 -0.09 -0.232828 -0.192898 -0.14 -0.12 -0.06 -0.08 -0.24 -0.13 -0.082977 -0.203055 -0.27 -0.28 -0.23 -0.22 -0.23 -0.33 -0.24 -0.21 -0.31 -0.18 -0.27 -0.20 -0.22 -0.21 -0.11 -0.20
Notes: Lamp current for G140L/1425 and G230M/3055 was increased from 3.8 to 10 mA in cycle 24.Lamp for G140M/1218 was switched from LINE to HITM2 in cycle 25.G140M/1173 data are from Spectroscopic Sensitivity and Focus Monitor programs
30

Instrument Science Report STIS 2018-04
Table 6: Monitored settings: mean o↵sets (first-order CCD; in pixels)Grating Wave 7a 7b 8a 8b 9 10 11 17 18 19 20 21 22 23 24 25G230LB 2375 0.04 0.04 0.05 0.05 0.04 0.00 0.13 0.05 0.11 0.14 0.13 0.05 0.17 0.11 0.16 0.10
G230MB 1854 0.00 0.071995 -0.03 0.01 0.01 0.00 -0.01 -0.03 0.09 0.02 0.03 0.00 0.00 -0.02 -0.03 -0.01 0.05 0.082135 0.09 -0.072276 -0.07 0.012416 -0.01 0.03 0.06 0.11 0.06 0.04 0.16 0.19 0.14 0.11 0.10 0.05 0.25 0.17 0.07 0.182557 -0.01 -0.122697 0.00 -0.06 -0.03 0.03 -0.03 -0.06 0.00 0.07 0.00 0.00 0.07 0.08 0.09 0.13 0.01 0.052794 0.05 0.092836 0.12 0.092976 0.25 0.263115 -0.02 0.00 0.03 0.05 0.02 -0.02 0.10 0.17 0.02 0.12 0.16 0.06 0.06 0.06 0.04 0.08
G430L 4300 -0.15 -0.11 -0.12 -0.10 -0.12 -0.13 -0.14 -0.16 -0.14 -0.04 -0.13 -0.07 -0.12 -0.03 -0.04 -0.05
G430M 3165 -0.07 -0.07 -0.02 0.00 -0.04 -0.05 -0.03 0.04 0.02 0.06 0.00 0.01 0.05 0.06 0.07 0.043423 0.10 0.113680 0.03 0.03 0.07 0.11 0.06 0.03 0.11 0.15 0.14 0.19 0.17 0.14 0.16 0.18 0.17 0.173843 0.04 0.073936 0.06 0.064194 -0.17 -0.16 -0.17 -0.22 -0.16 -0.19 -0.20 -0.174451 0.09 0.084706 0.15 0.134961 -0.10 -0.07 -0.01 -0.02 -0.03 -0.05 0.00 -0.02 -0.01 -0.05 0.07 0.04 0.05 0.08 0.05 -0.035093 0.08 0.055216 0.01 0.035471 0.01 0.05 0.05 0.07 0.05 0.04 0.15 0.15 0.06 0.18 0.14 0.16 0.11 0.17 0.13 0.16
G750L 7751 -0.23 -0.22 -0.20 -0.19 -0.20 -0.17 -0.03 -0.12 -0.11 -0.09 -0.03 -0.12 -0.02 -0.10 -0.01 -0.098975 -0.13 -0.15 -0.14 -0.09 -0.10 -0.19
G750M 5734 -0.10 -0.06 -0.06 -0.02 -0.02 -0.08 0.06 0.03 0.10 0.05 0.05 0.02 0.09 0.06 0.09 0.056252 0.17 0.126581 0.05 0.04 0.04 0.06 0.06 0.04 0.18 0.176768 -0.09 -0.01 -0.02 0.01 -0.01 -0.01 0.05 0.06 0.08 0.05 0.08 0.06 0.12 0.07 0.09 0.107283 0.10 0.117795 0.17 0.178311 -0.05 0.00 0.00 0.04 -0.02 -0.03 0.10 0.12 0.09 0.07 0.06 0.04 0.04 0.05 0.07 0.058561 0.02 0.01 0.03 0.08 0.04 0.05 0.16 0.108825 0.16 0.159336 -0.08 -0.07 -0.10 -0.09 -0.09 -0.13 0.03 0.05 0.00 0.08 0.07 0.08 0.07 0.01 0.02 0.099851 -0.01 0.10
10363 0.06 -0.07 -0.01 -0.04 -0.12 -0.06Notes: Lamp for all CCD settings switched from LINE to HITM1 in cycle 11.
Multiple exposures obtained for G230MB/1995 and G230MB/2416 in cycle 25.
31
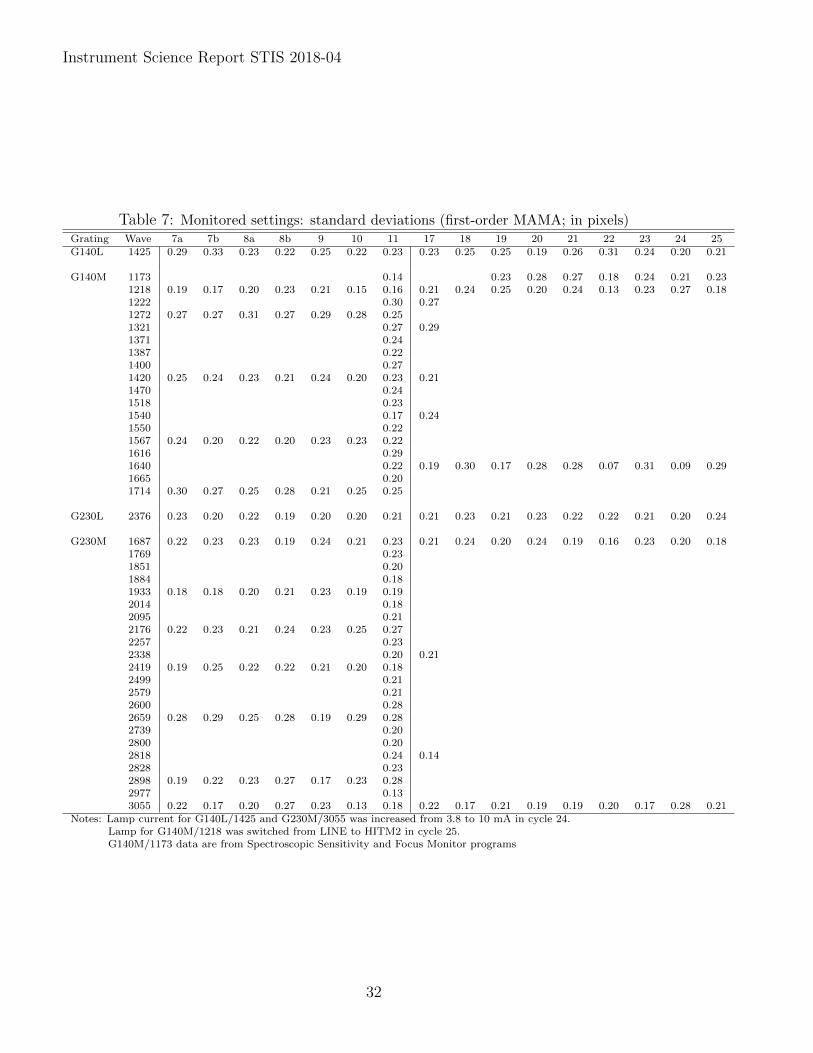
Instrument Science Report STIS 2018-04
Table 7: Monitored settings: standard deviations (first-order MAMA; in pixels)Grating Wave 7a 7b 8a 8b 9 10 11 17 18 19 20 21 22 23 24 25G140L 1425 0.29 0.33 0.23 0.22 0.25 0.22 0.23 0.23 0.25 0.25 0.19 0.26 0.31 0.24 0.20 0.21
G140M 1173 0.14 0.23 0.28 0.27 0.18 0.24 0.21 0.231218 0.19 0.17 0.20 0.23 0.21 0.15 0.16 0.21 0.24 0.25 0.20 0.24 0.13 0.23 0.27 0.181222 0.30 0.271272 0.27 0.27 0.31 0.27 0.29 0.28 0.251321 0.27 0.291371 0.241387 0.221400 0.271420 0.25 0.24 0.23 0.21 0.24 0.20 0.23 0.211470 0.241518 0.231540 0.17 0.241550 0.221567 0.24 0.20 0.22 0.20 0.23 0.23 0.221616 0.291640 0.22 0.19 0.30 0.17 0.28 0.28 0.07 0.31 0.09 0.291665 0.201714 0.30 0.27 0.25 0.28 0.21 0.25 0.25
G230L 2376 0.23 0.20 0.22 0.19 0.20 0.20 0.21 0.21 0.23 0.21 0.23 0.22 0.22 0.21 0.20 0.24
G230M 1687 0.22 0.23 0.23 0.19 0.24 0.21 0.23 0.21 0.24 0.20 0.24 0.19 0.16 0.23 0.20 0.181769 0.231851 0.201884 0.181933 0.18 0.18 0.20 0.21 0.23 0.19 0.192014 0.182095 0.212176 0.22 0.23 0.21 0.24 0.23 0.25 0.272257 0.232338 0.20 0.212419 0.19 0.25 0.22 0.22 0.21 0.20 0.182499 0.212579 0.212600 0.282659 0.28 0.29 0.25 0.28 0.19 0.29 0.282739 0.202800 0.202818 0.24 0.142828 0.232898 0.19 0.22 0.23 0.27 0.17 0.23 0.282977 0.133055 0.22 0.17 0.20 0.27 0.23 0.13 0.18 0.22 0.17 0.21 0.19 0.19 0.20 0.17 0.28 0.21
Notes: Lamp current for G140L/1425 and G230M/3055 was increased from 3.8 to 10 mA in cycle 24.Lamp for G140M/1218 was switched from LINE to HITM2 in cycle 25.G140M/1173 data are from Spectroscopic Sensitivity and Focus Monitor programs
32

Instrument Science Report STIS 2018-04
Table 8: Monitored settings: standard deviations (first-order CCD; in pixels)Grating Wave 7a 7b 8a 8b 9 10 11 17 18 19 20 21 22 23 24 25G230LB 2375 0.18 0.18 0.20 0.17 0.20 0.18 0.23 0.17 0.18 0.24 0.21 0.21 0.17 0.25 0.20 0.23
G230MB 1854 0.26 0.221995 0.15 0.17 0.16 0.16 0.14 0.17 0.20 0.25 0.15 0.17 0.27 0.18 0.23 0.20 0.22 0.172135 0.17 0.192276 0.20 0.222416 0.15 0.15 0.11 0.13 0.19 0.16 0.10 0.14 0.17 0.22 0.25 0.28 0.13 0.16 0.30 0.192557 0.24 0.172697 0.09 0.14 0.16 0.14 0.14 0.15 0.18 0.22 0.19 0.23 0.21 0.14 0.18 0.22 0.18 0.192794 0.16 0.202836 0.20 0.222976 0.19 0.133115 0.18 0.16 0.15 0.16 0.15 0.16 0.18 0.17 0.16 0.19 0.17 0.17 0.19 0.19 0.17 0.17
G430L 4300 0.17 0.17 0.18 0.17 0.18 0.16 0.21 0.22 0.20 0.21 0.20 0.23 0.22 0.22 0.22 0.20
G430M 3165 0.15 0.13 0.16 0.16 0.14 0.13 0.17 0.16 0.13 0.15 0.16 0.16 0.16 0.12 0.15 0.143423 0.11 0.113680 0.15 0.16 0.16 0.16 0.16 0.17 0.21 0.18 0.21 0.19 0.20 0.21 0.18 0.19 0.17 0.233843 0.18 0.163936 0.17 0.134194 0.21 0.22 0.17 0.19 0.21 0.18 0.18 0.154451 0.21 0.194706 0.21 0.214961 0.10 0.12 0.15 0.12 0.11 0.12 0.16 0.14 0.14 0.13 0.17 0.11 0.13 0.14 0.10 0.145093 0.22 0.185216 0.16 0.175471 0.13 0.15 0.09 0.07 0.08 0.14 0.11 0.09 0.17 0.07 0.15 0.12 0.22 0.11 0.11 0.09
G750L 7751 0.10 0.11 0.11 0.10 0.11 0.11 0.11 0.11 0.10 0.11 0.10 0.11 0.10 0.10 0.12 0.118975 0.14 0.13 0.14 0.15 0.14 0.12
G750M 5734 0.07 0.06 0.07 0.07 0.09 0.05 0.10 0.11 0.07 0.11 0.09 0.07 0.10 0.07 0.09 0.086252 0.07 0.096581 0.05 0.07 0.09 0.12 0.07 0.06 0.09 0.076768 0.05 0.09 0.07 0.06 0.08 0.18 0.03 0.03 0.03 0.03 0.03 0.03 0.03 0.03 0.03 0.037283 0.05 0.047795 0.10 0.158311 0.07 0.07 0.07 0.07 0.07 0.07 0.06 0.06 0.06 0.06 0.06 0.06 0.09 0.06 0.08 0.078561 0.07 0.07 0.09 0.07 0.07 0.07 0.06 0.078825 0.05 0.129336 0.16 0.12 0.13 0.11 0.11 0.12 0.12 0.09 0.10 0.14 0.12 0.12 0.11 0.09 0.10 0.129851 0.18 0.08
10363 0.25 0.19 0.21 0.17 0.20 0.26Notes: Lamp for all CCD settings switched from LINE to HITM1 in cycle 11.
Multiple exposures obtained for G230MB/1995 and G230MB/2416 in cycle 25.
33

Instrument Science Report STIS 2018-04
Table 9: Monitored settings: relative line strengths (first-order MAMA and CCD)Grating Wave 7a 7b 8a 8b 9 10 11 17 18 19 20 21 22 23 24 25G140L 1425 1.00 0.91 0.68 0.60 0.61 0.55 0.52 1.00 0.89 0.82 0.78 0.74 0.67 0.68 ... ...
G140M 1173 1.00 0.83 0.75 0.69 0.61 0.56 0.541218 1.00 0.90 0.70 0.55 0.57 0.41 0.37 1.00 0.75 0.55 0.42 0.34 0.28 0.26 0.27 ...1272 1.00 0.95 0.76 0.65 0.66 0.57 0.491420 1.00 0.93 0.74 0.66 0.66 0.61 0.561567 1.00 0.90 0.66 0.59 0.61 0.50 0.491640 1.18 1.00 0.90 0.81 0.78 0.76 0.70 0.73 0.68 0.711714 1.00 0.87 0.59 0.51 0.54 0.44 0.42
G230L 2376 1.00 0.90 0.87 0.83 0.82 0.70 0.61 1.00 0.97 0.89 0.87 0.80 0.77 0.74 0.74 0.70
G230M 1687 1.00 0.90 0.89 0.74 0.74 0.71 0.62 1.00 0.93 0.88 0.87 0.80 0.76 0.73 0.67 0.681933 1.00 0.87 0.87 0.70 0.71 0.57 0.492176 1.00 0.90 0.95 0.80 0.82 0.65 0.582419 1.00 0.91 0.95 0.86 0.88 0.71 0.622659 1.00 0.91 0.95 0.91 0.93 0.76 0.742898 1.00 0.92 0.94 0.95 0.96 0.74 0.773055 1.00 0.93 0.93 0.98 0.98 0.80 0.78 1.00 0.93 0.85 0.82 0.77 0.76 0.72 ... ...
G230LB 2375 1.00 1.00 1.04 0.94 0.96 0.87 1.06 1.00 0.96 0.95 0.93 0.91 0.90 0.88 0.87 0.84
G230MB 1995 1.00 0.97 0.97 0.81 0.79 0.66 1.20 1.00 0.97 0.95 0.88 0.88 0.86 0.86 0.84 0.802416 1.00 1.00 1.03 0.92 0.90 0.79 1.16 1.00 1.01 1.00 0.87 0.90 0.94 0.89 0.86 0.882697 1.00 0.98 1.02 0.94 0.91 0.88 1.08 1.00 1.02 0.97 0.88 0.89 0.90 0.88 0.84 0.843115 1.00 1.01 1.05 0.97 0.96 0.93 1.05 1.00 0.97 0.96 0.92 0.92 0.92 0.91 0.88 0.87
G430L 4300 1.00 0.98 1.06 1.04 1.05 0.97 1.06 1.00 1.00 0.99 1.00 0.99 0.97 0.95 0.96 0.97
G430M 3165 1.00 0.98 1.04 0.97 0.97 0.91 1.05 1.00 0.98 0.97 0.95 0.93 0.94 0.92 0.90 0.893680 1.00 0.96 1.04 1.01 1.01 0.92 1.04 1.00 0.99 0.97 0.97 0.95 0.95 0.93 0.92 0.934194 1.00 0.98 1.07 1.07 1.07 0.954961 1.00 1.00 1.06 1.05 1.05 1.01 1.02 1.00 1.02 0.99 0.99 0.97 1.00 0.99 0.97 0.965471 1.00 1.00 1.06 1.04 1.03 1.00 0.99 1.00 1.00 1.00 1.00 0.99 0.99 0.98 0.97 0.97
G750L 7751 1.00 1.03 1.04 1.04 1.03 1.02 0.98 1.00 0.99 1.00 0.99 0.99 0.99 0.98 0.98 0.988975
G750M 5734 1.00 1.02 1.03 1.02 1.01 1.01 0.98 1.00 0.99 0.99 0.99 0.99 0.99 0.98 0.98 0.976581 1.00 1.02 1.03 1.02 1.02 1.006768 1.00 1.02 1.03 1.02 1.02 1.01 0.99 1.00 0.99 0.99 0.99 0.98 0.98 0.98 0.98 0.978311 1.00 1.02 1.03 1.02 1.02 1.00 0.98 1.00 1.00 1.00 1.00 1.00 1.00 0.99 0.99 0.988561 1.00 1.01 1.04 1.02 1.02 0.999336 1.00 1.02 1.04 1.03 1.02 1.00 0.97 1.00 0.98 1.00 1.00 1.00 1.00 1.00 1.00 0.99
10363 1.00Notes: Lamp current for G140L/1425 and G230M/3055 was increased from 3.8 to 10 mA in cycle 24.
Lamp for G140M/1218 was switched from LINE to HITM2 in cycle 25.G140M/1173 data are from Spectroscopic Sensitivity and Focus Monitor programsLamp for all CCD settings switched from LINE to HITM1 in cycle 11; values for CCD in cycle 11 are relative to cycle 17.Multiple exposures were obtained for G230MB/1995 and G230MB/2416 in cycle 25.
34

Instrument Science Report STIS 2018-04
Table 10: Monitored settings: number of lines (first-order MAMA)Grating Wave 7a 7b 8a 8b 9 10 11 17 18 19 20 21 22 23 24 25G140L 1425 18 20 14 15 17 17 14 15 18 14 13 13 14 13 22 16
G140M 1173 14 13 12 12 10 9 11 121218 21 20 20 20 23 21 18 13 13 12 10 11 11 10 6 211222 22 101272 25 23 20 20 25 20 191321 21 221371 311387 301400 281420 30 29 33 32 29 23 26 261470 251518 241540 19 241550 221567 22 20 24 18 24 22 221616 151640 13 7 7 7 10 7 5 10 5 81665 191714 20 19 16 18 16 19 17
G230L 2376 28 29 28 28 27 26 27 23 26 24 28 26 27 26 27 27
G230M 1687 28 27 28 24 26 28 27 18 18 20 24 23 21 24 24 191769 191851 251884 181933 24 21 25 20 24 23 232014 232095 232176 23 23 25 26 26 23 242257 182338 17 162419 17 20 19 20 19 20 172499 222579 102600 132659 17 19 20 17 19 17 182739 152800 162818 13 72828 122898 8 11 9 12 11 10 82977 133055 15 15 14 16 18 14 18 10 11 11 16 13 13 15 12 12
Notes: Lamp current for G140L/1425 and G230M/3055 was increased from 3.8 to 10 mA in cycle 24.Lamp for G140M/1218 was switched from LINE to HITM2 in cycle 25.G140M/1173 data are from Spectroscopic Sensitivity and Focus Monitor programs
35

Instrument Science Report STIS 2018-04
Table 11: Monitored settings: number of lines (first-order CCD)Grating Wave 7a 7b 8a 8b 9 10 11 17 18 19 20 21 22 23 24 25G230LB 2375 35 37 35 35 34 28 37 33 29 31 33 30 30 34 32 23
G230MB 1854 22 211995 33 37 43 39 40 41 28 19 14 20 23 15 16 16 14 212135 11 82276 26 212416 24 34 36 37 32 34 16 19 17 14 16 12 13 14 13 152557 34 252697 42 49 45 50 47 46 27 21 24 22 16 21 21 19 17 202794 40 402836 33 352976 29 283115 39 44 47 43 44 43 36 33 35 30 33 32 35 26 31 30
G430L 4300 22 22 21 19 21 21 24 26 27 25 25 27 27 28 27 24
G430M 3165 44 45 46 50 47 44 34 34 37 36 39 37 36 36 32 323423 38 413680 48 46 45 44 45 43 33 32 30 30 33 32 29 31 28 323843 37 313936 31 264194 38 42 38 38 39 38 25 274451 29 364706 29 324961 32 33 34 35 34 33 25 23 19 20 25 23 21 20 18 185093 21 215216 31 305471 23 25 23 22 24 26 16 13 16 11 17 16 17 15 16 13
G750L 7751 38 38 39 37 37 39 42 46 42 44 42 45 41 42 42 448975 25 25 26 29 26 27
G750M 5734 22 24 25 23 24 23 23 23 22 23 21 22 22 22 21 236252 24 246581 16 16 18 17 15 15 13 136768 10 12 13 11 12 10 9 9 9 10 9 9 9 9 10 97283 13 127795 7 78311 17 17 17 17 17 17 17 17 18 17 17 17 16 16 17 178561 23 21 21 22 22 22 20 208825 21 229336 28 27 29 26 25 28 17 16 18 17 16 15 15 17 16 169851 9 9
10363 7 8 8 8 8 7Notes: Lamp for all CCD settings switched from LINE to HITM1 in cycle 11.
Multiple exposures obtained for G230MB/1995 and G230MB/2416 in cycle 25.
36

Instrument Science Report STIS 2018-04
Table 12: Current analysis vs. Pas11 and Son15 (first-order MAMA and CCD)Grating Wave t
exp
(25) Pascucci et al. 2011 Cycle 17 Sonnentrucker 2015 Cycles 19–21o↵set stdev N o↵set stdev N o↵set stdev N o↵set stdev N
G140L 1425 70 -0.05 0.20 41 -0.08 0.22 33 0.03 0.15 0.09 0.23 13G140M 1218 600 -0.10 0.25 16 0.06 0.21 13 0.03 0.23 8 -0.03 0.23 11
1222 -0.07 0.46 18 0.16 0.27 101321 -0.03 0.37 20 0.02 0.29 221420 -0.01 0.26 19 0.03 0.21 261540 0.06 0.25 12 0.10 0.24 241640 150 0.08 0.23 9 0.24 0.19 7 4 0.18 0.24 8
G230L 2376 48 0.01 0.15 0.00 0.21 23 -0.01 0.12 0.04 0.22 26G230M 1687 310 -0.03 0.20 19 0.08 0.21 18 -0.06 0.34 8 0.01 0.21 22
2338 -0.10 0.22 7 -0.09 0.21 162818 -0.11 0.14 8 -0.23 0.14 73055 22 -0.18 0.12 6 -0.21 0.22 10 -0.24 0.17 4 -0.22 0.20 13
G230LB 2375 240 0.06 0.24 0.05 0.17 33 -0.01 0.29 0.11 0.22 31G230MB 1854 0.05 0.25 15 0.07 0.22 21
1995 3x240 -0.02 0.23 14 0.02 0.25 19 -0.03 0.20 12 -0.01 0.21 192135 -0.12 0.08 5 -0.07 0.19 82276 0.01 0.22 17 0.01 0.22 212416 2x50 0.11 0.12 8 0.19 0.14 19 0.03 0.22 6 0.09 0.25 142557 -0.01 0.33 16 -0.12 0.17 252697 20 0.07 0.22 21 0.02 0.27 8 0.05 0.19 202794 0.04 0.24 21 0.09 0.20 402836 0.02 0.25 27 0.09 0.22 352976 0.12 0.16 20 0.26 0.13 283115 27 0.05 0.20 22 0.17 0.17 33 -0.04 0.20 18 0.11 0.18 32
G430L 4300 11 -0.02 0.28 -0.16 0.22 26 -0.01 0.27 -0.08 0.21 26G430M 3165 11 0.16 0.23 12 0.04 0.16 34 0.04 0.16 8 0.03 0.16 37
3423 0.00 0.26 6 0.11 0.11 413680 11 0.12 0.18 8 0.15 0.18 32 0.00 0.29 7 0.17 0.20 323843 0.07 0.16 313936 0.13 0.43 3 0.06 0.13 264194 0.02 0.13 4 -0.17 0.15 274451 0.06 0.19 23 0.08 0.19 364706 0.15 0.28 21 0.13 0.21 324961 24 -0.05 0.07 10 -0.02 0.14 23 -0.07 0.11 11 0.02 0.14 235093 0.06 0.11 8 0.05 0.18 215216 -0.02 0.07 14 0.03 0.17 305471 26 0.06 0.12 11 0.15 0.09 13 0.07 0.09 9 0.16 0.11 15
G750L 7751 6.2 -0.07 0.15 -0.12 0.11 46 -0.08 0.17 -0.08 0.11 448975
G750M 5734 5.9 0.01 0.07 16 0.03 0.11 23 -0.01 0.09 14 0.04 0.09 226252 0.09 0.08 17 0.12 0.09 246581 0.09 0.14 11 0.17 0.07 136768 3.9 -0.01 0.04 9 0.06 0.03 9 -0.01 0.04 9 0.06 0.03 97283 0.04 0.06 9 0.11 0.04 127795 0.12 0.12 5 0.17 0.15 78311 10 0.06 0.09 17 0.12 0.06 17 -0.02 0.06 17 0.05 0.06 178561 0.02 0.07 19 0.10 0.07 208825 0.04 0.06 17 0.15 0.12 229336 10 -0.01 0.10 14 0.05 0.09 16 -0.03 0.07 13 0.07 0.13 169851 0.14 0.12 2 0.10 0.08 9
Notes: texp
(25) is the exposure time used in cycle 25.G230L/2376 is at a lamp current of 3.8 mA; all others are at 10 mA.All lines in settings G430L/4300 and G430M/3165–4194 appear to have been misidentified in Pas11 and Son15.
37