Instructure 3.3.16 v final pdf
33
-
Upload
instructure -
Category
Investor Relations
-
view
757 -
download
5
Transcript of Instructure 3.3.16 v final pdf

FORWARDING LOOKING STATEMENTS & NON-GAAP MEASURES This presentation and the accompanying oral commentary contain “forward-looking” statements that are based on our beliefs and assumptions and on information currently available to us. Forward-looking statements include information concerning our possible or assumed future results of operations and financial performance, business strategies, potential growth opportunities and the effects of competition. Forward-looking statements include all statements that are not historical facts and can be identified by terms such as “believe,” “will,” “may,” “estimate,” “continue,” “anticipate,” “intend,” “should,” “plan,” “might,” approximately,” “expect,” “predict,” “could,” “potentially” or the negative of these terms or other similar expressions. Forward-looking statements involve known and unknown risks, uncertainties, assumptions and other factors that may cause our actual results, performance or achievements to be materially different from any future results, performance or achievements expressed or implied by the forward-looking statements. Important risk factors are described more fully in the final prospectus for our initial public offering, which was filed with the Securities and Exchange Commission (the “SEC”) on November 13, 2015 and other documents filed with the SEC and could cause actual results to vary from expectations. Forward-looking statements represent our management’s beliefs and assumptions only as of the date of this presentation. Except as required by law, we assume no obligation to update these forward-looking statements publicly, or to update the reasons why actual results could differ materially from those anticipated in the forward-looking statements, even if new information becomes available in the future. This presentation includes certain non-GAAP financial measures as defined by the SEC rules. These non-GAAP financial measures are in addition to, and not as a substitute for or superior to measures of financial performance prepared in accordance with U.S. GAAP. There are a number of limitations related to the use of these non-GAAP financial measures versus their nearest GAAP equivalents. For example, other companies may calculate non-GAAP financial measures differently or may use other measures to evaluate their performance, all of which could reduce the usefulness of our non-GAAP financial measures as tools for comparison. As required by Regulation G, we have provided a reconciliation of those measures to the most directly comparable GAAP measures, which is available in the appendix.
2
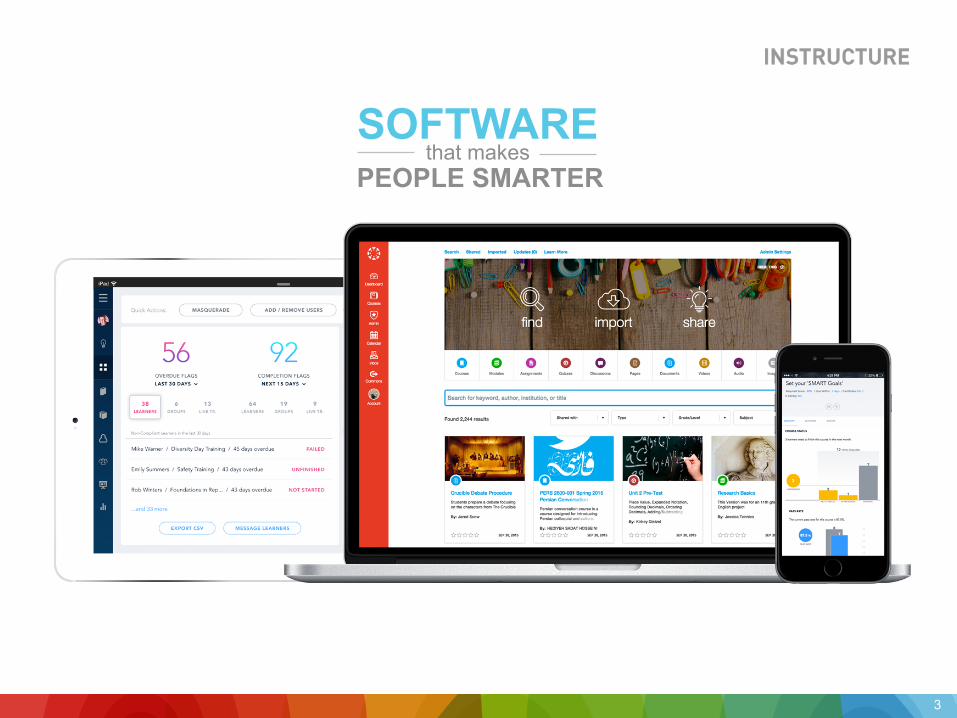
SOFTWARE PEOPLE SMARTER
that makes
3
PRODUCT OVERVIEW
4
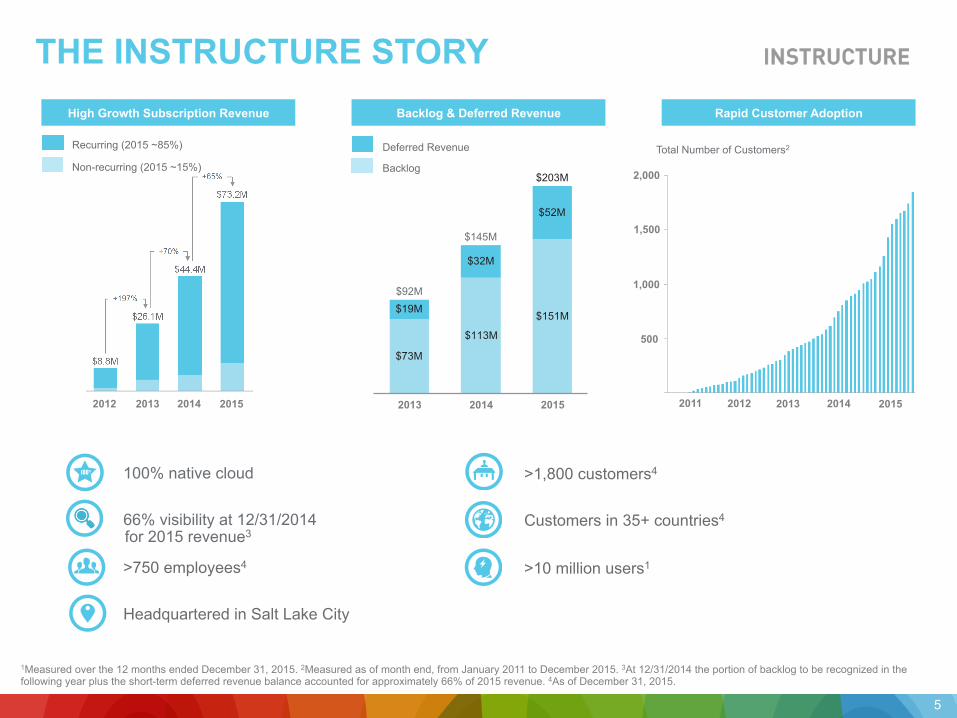
100% native cloud
66% visibility at 12/31/2014
>750 employees4
Headquartered in Salt Lake City
1Measured over the 12 months ended December 31, 2015. 2Measured as of month end, from January 2011 to December 2015. 3At 12/31/2014 the portion of backlog to be recognized in the following year plus the short-term deferred revenue balance accounted for approximately 66% of 2015 revenue. 4As of December 31, 2015.
for 2015 revenue3
THE INSTRUCTURE STORY High Growth Subscription Revenue
>1,800 customers4
Customers in 35+ countries4
>10 million users1
Recurring (2015 ~85%)
Non-recurring (2015 ~15%)
2014 2013 2012 2015
5
100%
Deferred Revenue
Backlog
Backlog & Deferred Revenue Rapid Customer Adoption
$73M
$113M
$151M$19M
$32M
$52M
$203M
$145M
$92M
2014 2013 2015
500
1,000
1,500
2,000
2014 2013 2012 2015 2011
Total Number of Customers2
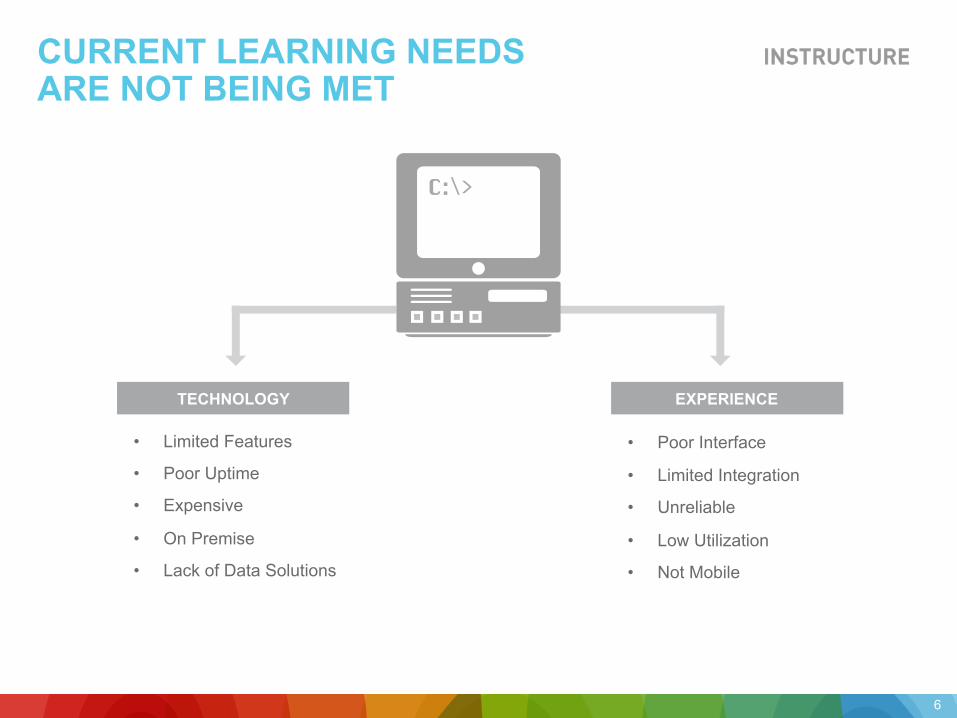
CURRENT LEARNING NEEDS ARE NOT BEING MET
• Limited Features
• Poor Uptime
• Expensive
• On Premise
• Lack of Data Solutions
• Poor Interface
• Limited Integration
• Unreliable
• Low Utilization
• Not Mobile
TECHNOLOGY EXPERIENCE
C:\>C:\>
6
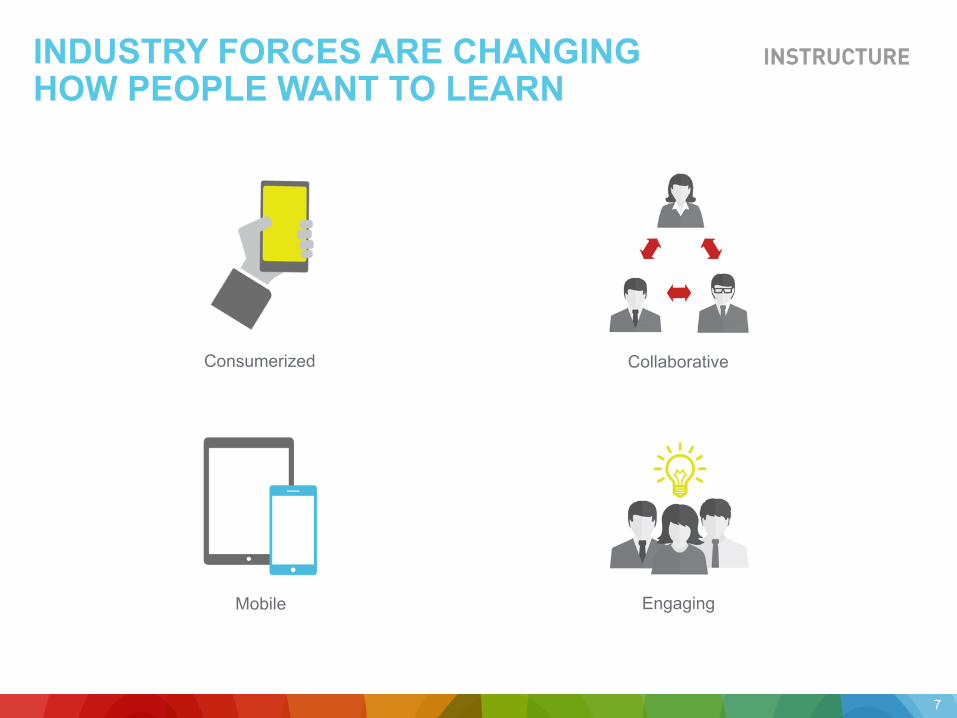
INDUSTRY FORCES ARE CHANGING HOW PEOPLE WANT TO LEARN
Consumerized Collaborative
Mobile Engaging
7
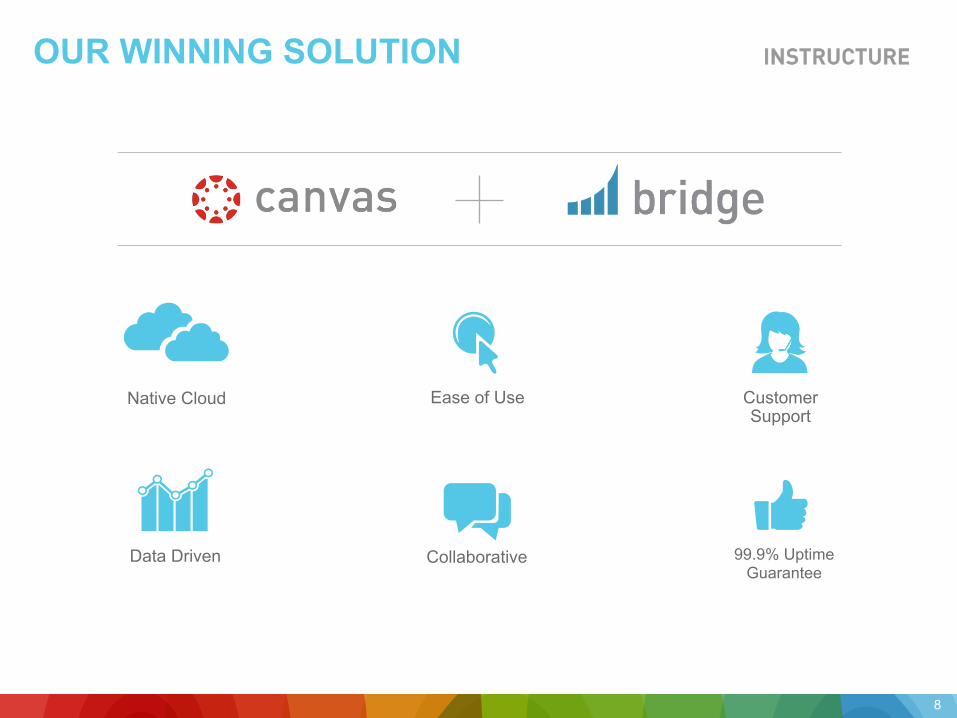
OUR WINNING SOLUTION
Collaborative 99.9% Uptime Guarantee
Data Driven
Customer Support
Native Cloud Ease of Use
8
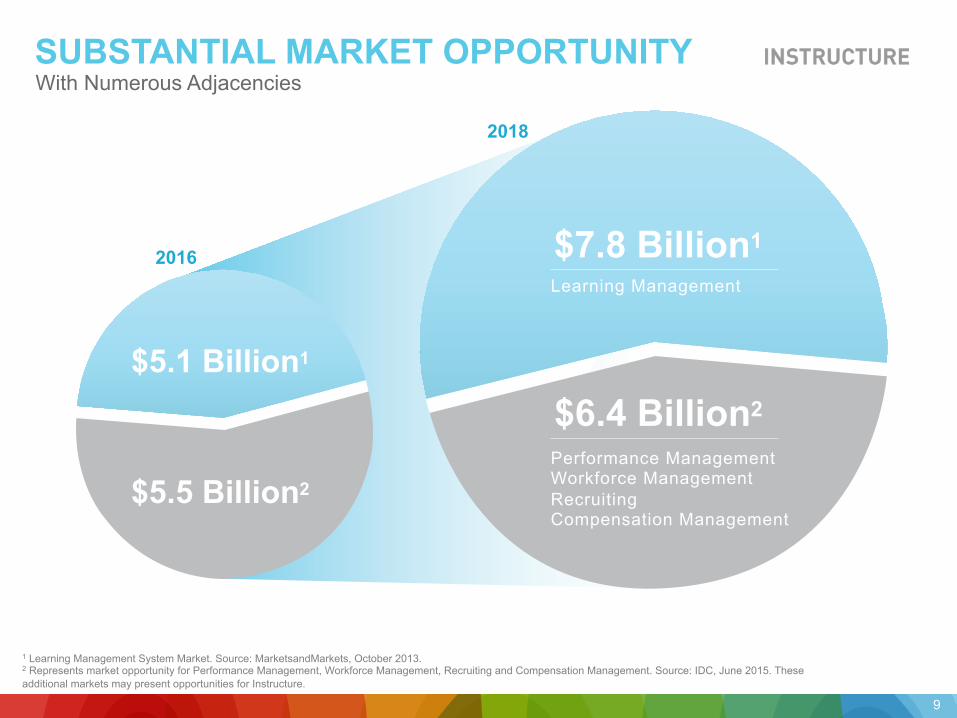
SUBSTANTIAL MARKET OPPORTUNITY With Numerous Adjacencies
2016
2018
Learning Management
Performance Management Workforce Management Recruiting Compensation Management
$7.8 Billion1
$6.4 Billion2
$5.1 Billion1
$5.5 Billion2
1 Learning Management System Market. Source: MarketsandMarkets, October 2013. 2 Represents market opportunity for Performance Management, Workforce Management, Recruiting and Compensation Management. Source: IDC, June 2015. These additional markets may present opportunities for Instructure.
9
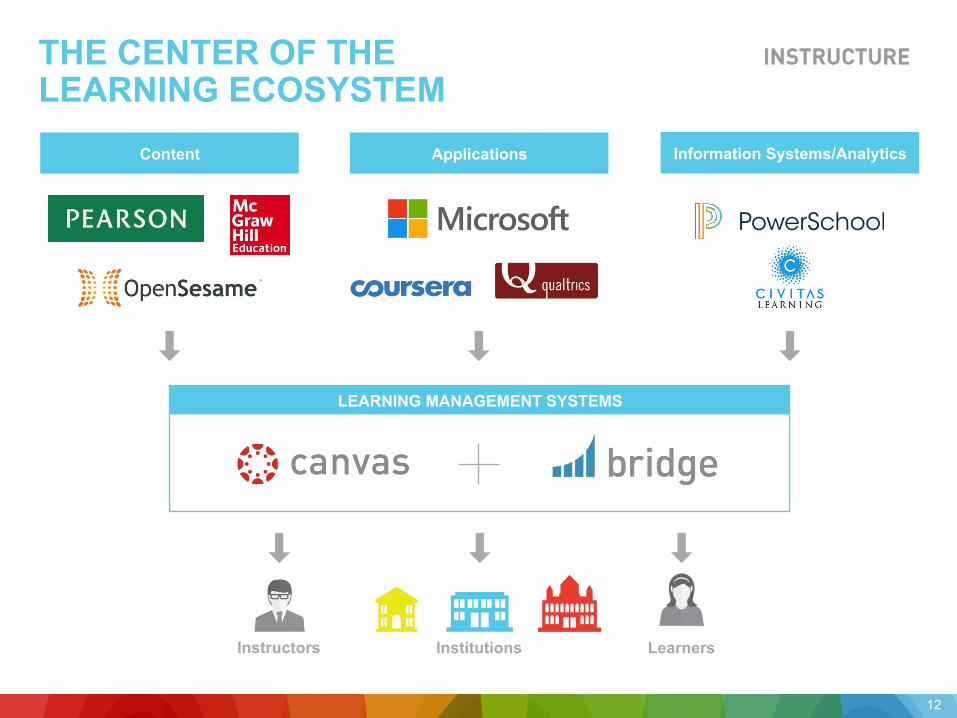
THE CENTER OF THE LEARNING ECOSYSTEM
Institutions
Information Systems/Analytics Content Applications
LEARNING MANAGEMENT SYSTEMS
Instructors Learners
12
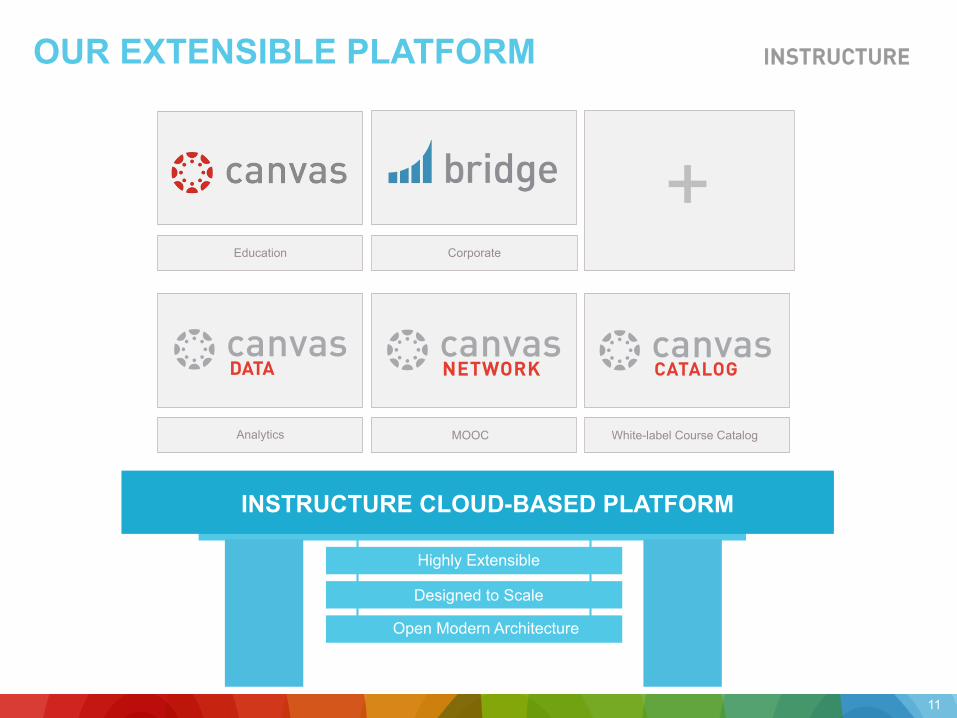
OUR EXTENSIBLE PLATFORM
Education Corporate
White-label Course Catalog MOOC Analytics
+
Highly Extensible
Designed to Scale
Open Modern Architecture
INSTRUCTURE CLOUD-BASED PLATFORM
11
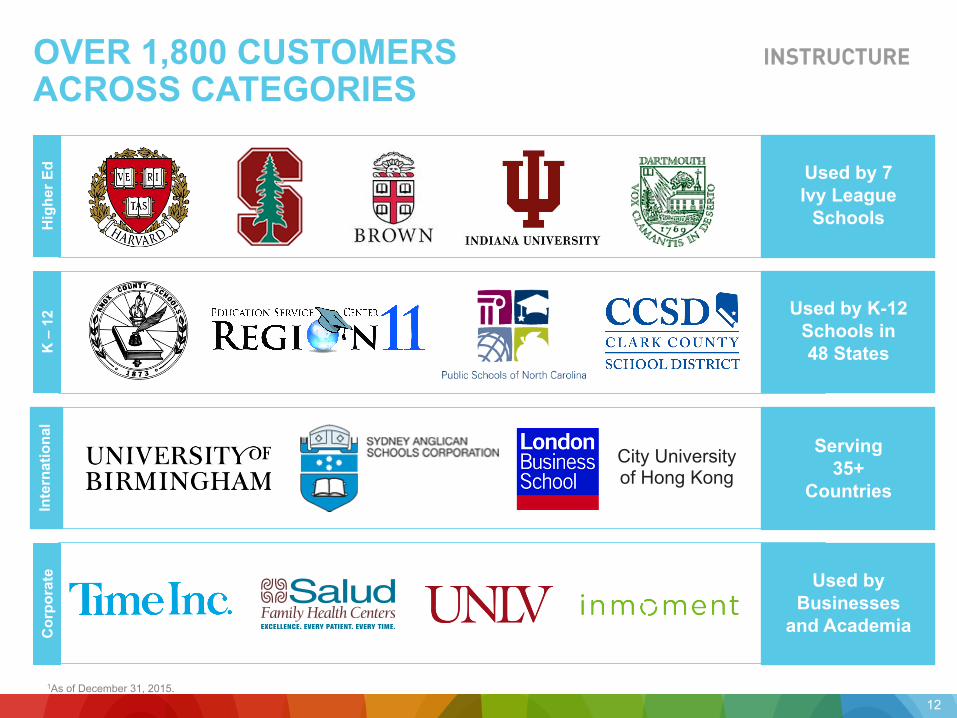
OVER 1,800 CUSTOMERS ACROSS CATEGORIES
Hig
her E
d K
– 1
2 In
tern
atio
nal
Cor
pora
te
City University of Hong Kong
Used by 7 Ivy League
Schools
Used by K-12 Schools in 48 States
Serving 35+
Countries
Used by Businesses
and Academia
1As of December 31, 2015.
12
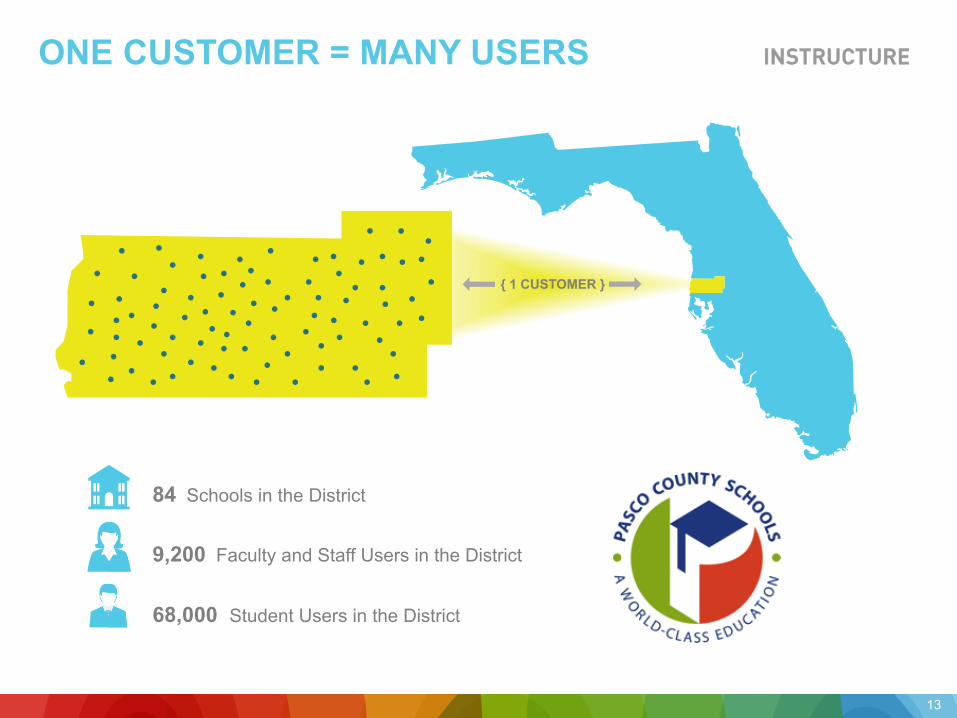
ONE CUSTOMER = MANY USERS
84 Schools in the District
9,200 Faculty and Staff Users in the District
68,000 Student Users in the District
{ 1 CUSTOMER }
13
LMS
LMS
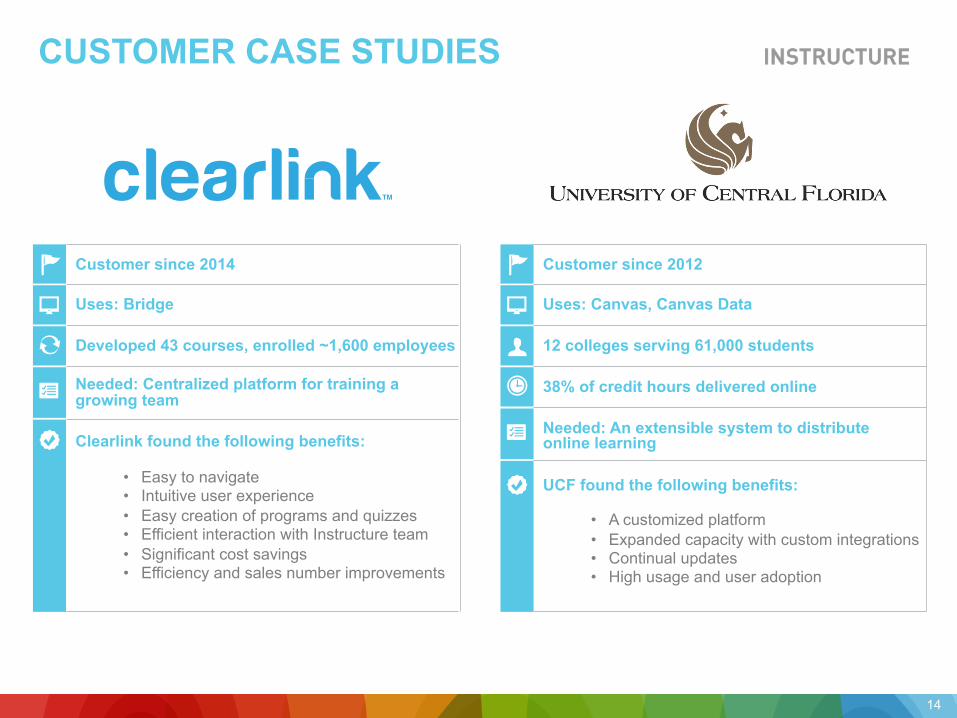
CUSTOMER CASE STUDIES
EDU
K12
CORP
LMS
Customer since 2014
Uses: Bridge
Developed 43 courses, enrolled ~1,600 employees
Needed: Centralized platform for training a growing team
Clearlink found the following benefits:
• Easy to navigate • Intuitive user experience • Easy creation of programs and quizzes • Efficient interaction with Instructure team • Significant cost savings • Efficiency and sales number improvements
Customer since 2012
Uses: Canvas, Canvas Data
12 colleges serving 61,000 students
38% of credit hours delivered online Needed: An extensible system to distribute online learning
UCF found the following benefits:
• A customized platform • Expanded capacity with custom integrations • Continual updates • High usage and user adoption
14
OUR USER’S EXPERIENCE
15
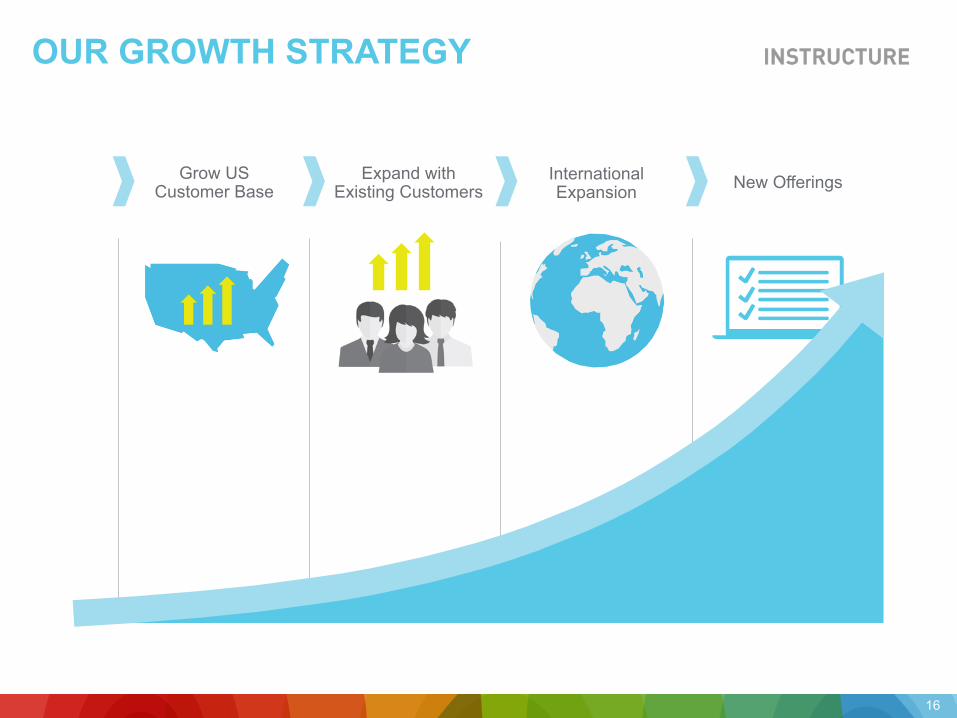
OUR GROWTH STRATEGY
Grow US Customer Base
Expand with Existing Customers New Offerings International
Expansion
16
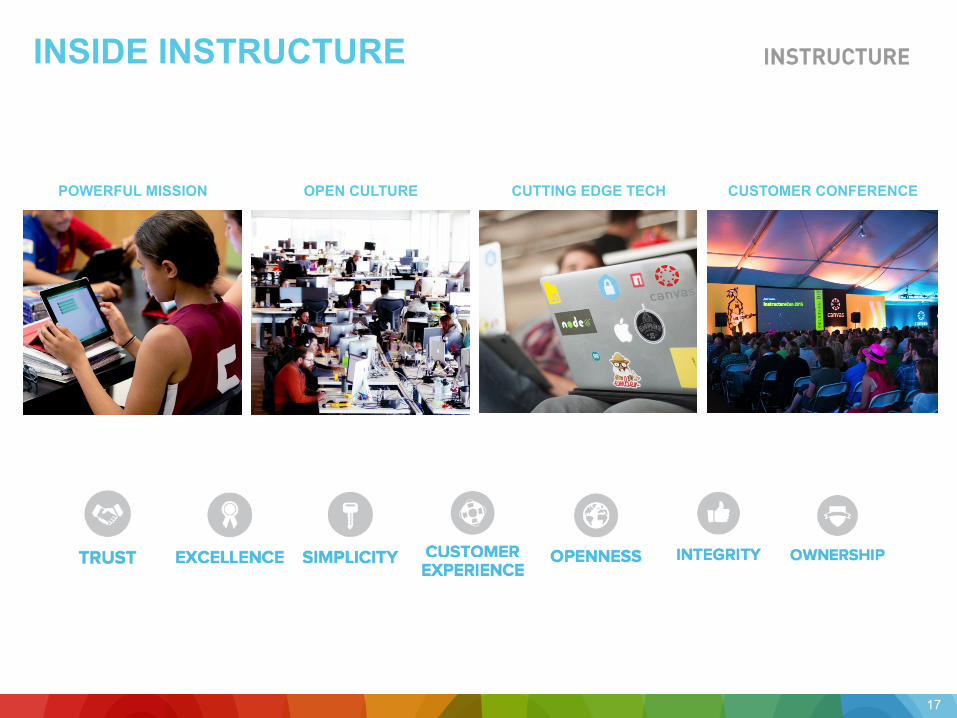
INSIDE INSTRUCTURE
POWERFUL MISSION OPEN CULTURE CUTTING EDGE TECH
17
CUSTOMER CONFERENCE
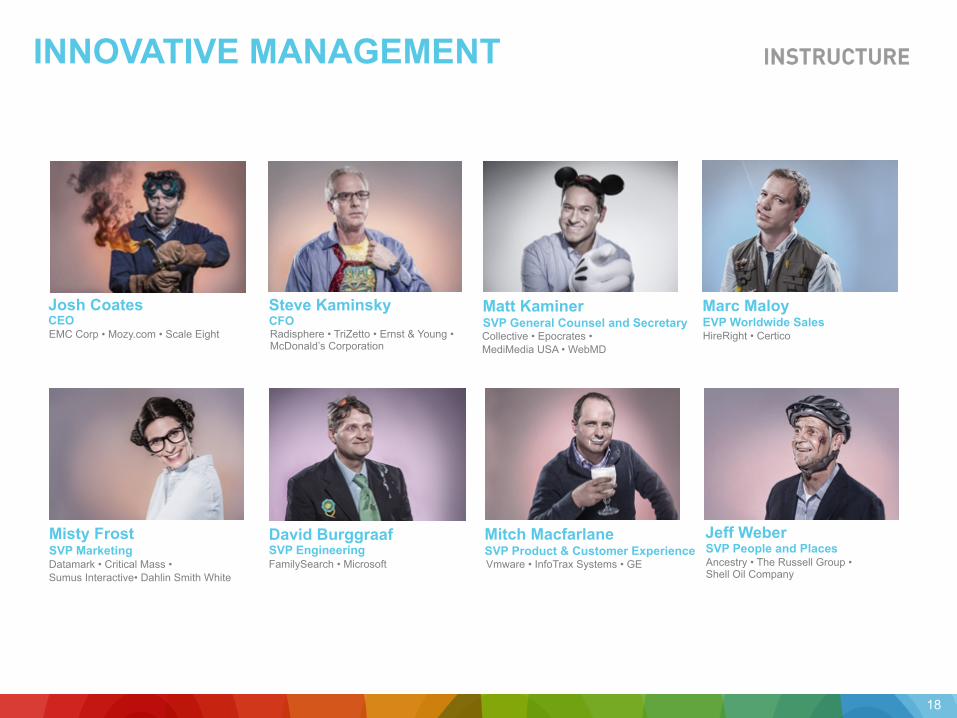
INNOVATIVE MANAGEMENT
Josh Coates EMC Corp • Mozy.com • Scale Eight CEO
Steve Kaminsky Radisphere • TriZetto • Ernst & Young • McDonald’s Corporation
CFO
SVP People and Places Jeff Weber
Ancestry • The Russell Group • Shell Oil Company
FamilySearch • Microsoft
David Burggraaf SVP Engineering
Vmware • InfoTrax Systems • GE
Mitch Macfarlane SVP Product & Customer Experience
Marc Maloy HireRight • Certico EVP Worldwide Sales
Misty Frost Datamark • Critical Mass • Sumus Interactive• Dahlin Smith White
SVP Marketing
SVP/General Counsel and Secretary
18
Matt Kaminer Collective • Epocrates • MediMedia USA • WebMD
SVP General Counsel and Secretary
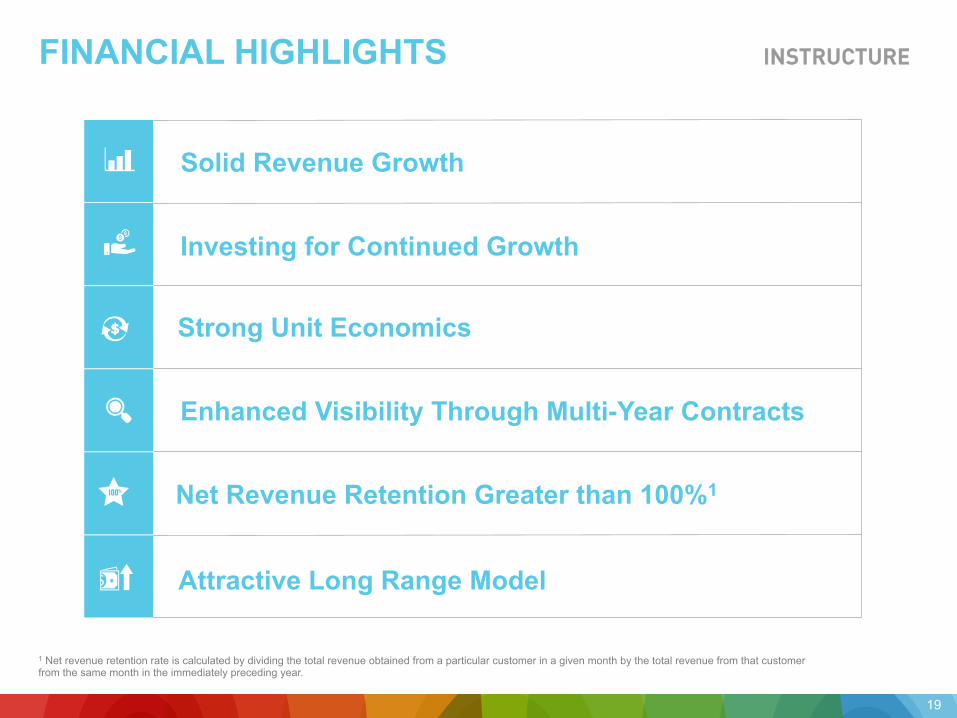
FINANCIAL HIGHLIGHTS
Solid Revenue Growth
Net Revenue Retention Greater than 100%1 100%
Investing for Continued Growth
Attractive Long Range Model
Strong Unit Economics $
Enhanced Visibility Through Multi-Year Contracts
1 Net revenue retention rate is calculated by dividing the total revenue obtained from a particular customer in a given month by the total revenue from that customer from the same month in the immediately preceding year.
19
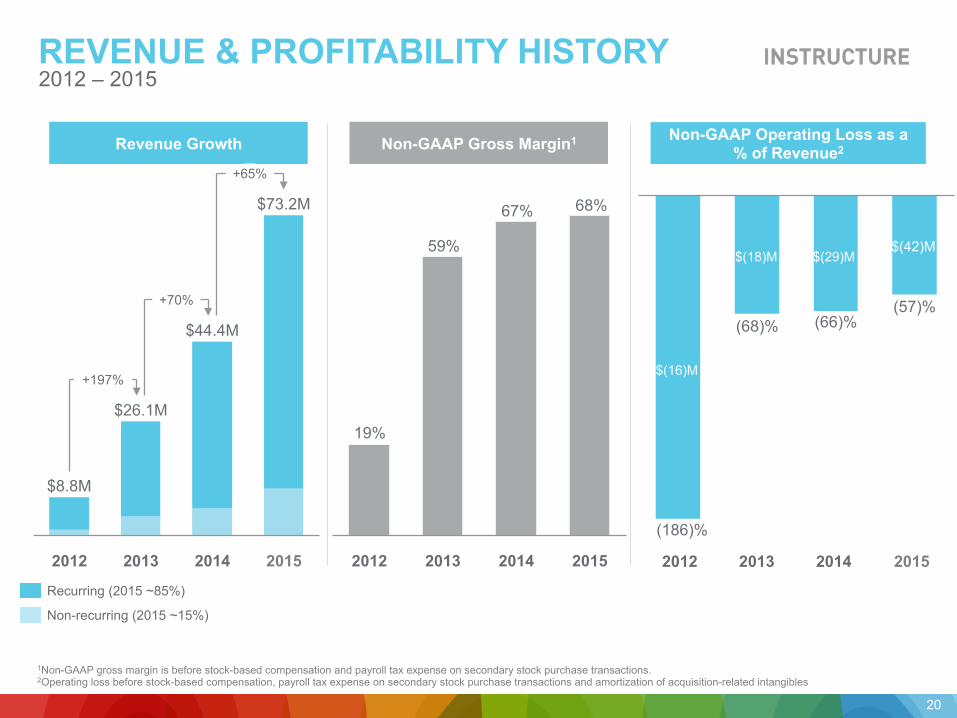
Non-GAAP Operating Loss as a % of Revenue2 Revenue Growth
REVENUE & PROFITABILITY HISTORY 2012 – 2015
1Non-GAAP gross margin is before stock-based compensation and payroll tax expense on secondary stock purchase transactions. 2Operating loss before stock-based compensation, payroll tax expense on secondary stock purchase transactions and amortization of acquisition-related intangibles
Non-GAAP Gross Margin1
2015 2014 2013 2012 2012 2015 2014 2013
$(16)M
$(18)M $(29)M
+65%
2014
$44.4M
2013
$26.1M
+70%
2015
+197%
$73.2M
$8.8M
2012
$(42)M
20
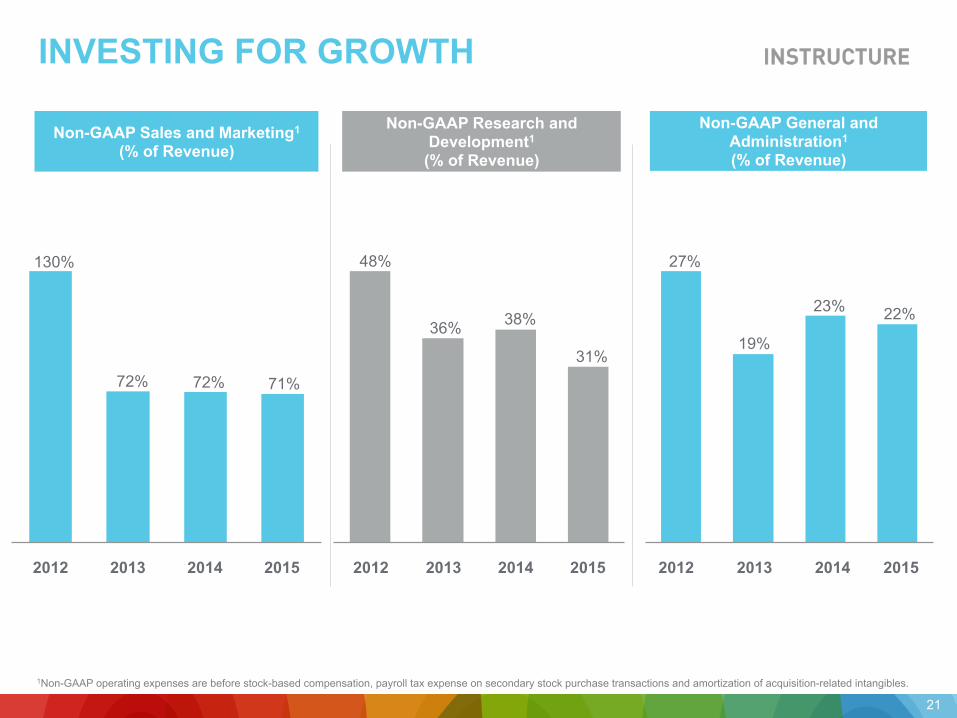
19%
59%
67% 68%
(68)%
(186)%
(66)% (57)%
Recurring (2015 ~85%)
Non-recurring (2015 ~15%)
Non-GAAP General and Administration1
(% of Revenue) Non-GAAP Sales and Marketing1
(% of Revenue)
INVESTING FOR GROWTH
1Non-GAAP operating expenses are before stock-based compensation, payroll tax expense on secondary stock purchase transactions and amortization of acquisition-related intangibles.
Non-GAAP Research and Development1
(% of Revenue)
2015 2013 2014 2012 2015 2014 2013 2012 2014 2013 2012 2015
21
130%
72% 71%
48%
36% 38%
27%
31% 19%
23% 22%
72%
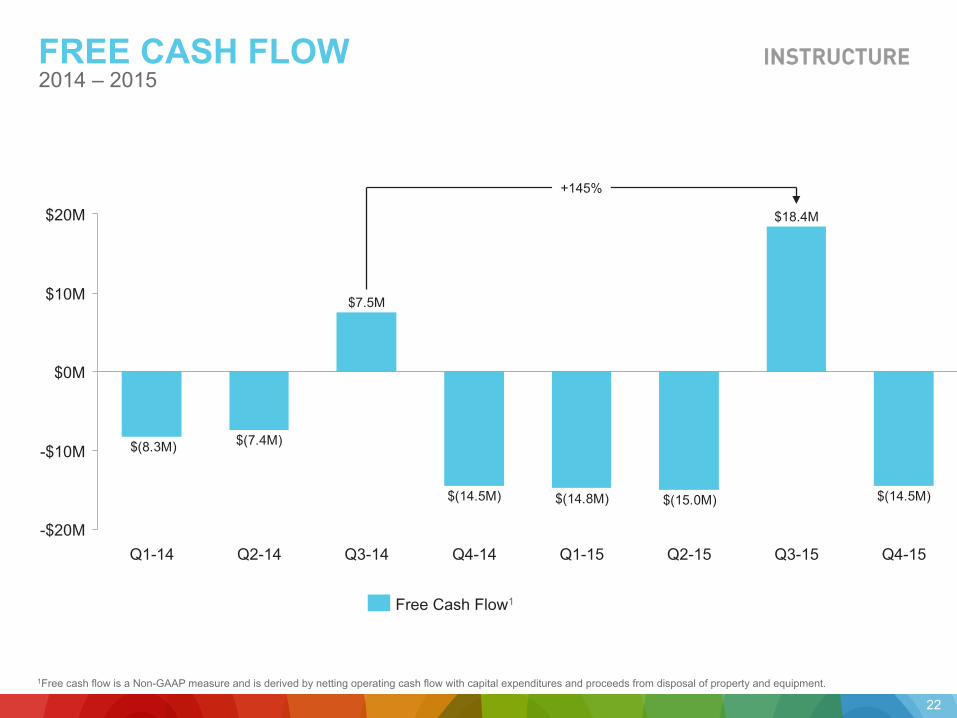
FREE CASH FLOW
Non-GAAP Gross Margin2 %
2014 – 2015
1Free cash flow is a Non-GAAP measure and is derived by netting operating cash flow with capital expenditures and proceeds from disposal of property and equipment.
$(14.5M)$(15.0M)$(14.8M)$(14.5M)
$(7.4M)$(8.3M)
$20M
$10M
$0M
-$10M
-$20M Q4-15 Q3-15
$18.4M
Q2-15 Q1-15 Q4-14 Q3-14
$7.5M
Q2-14 Q1-14
+145%
Free Cash Flow1
22
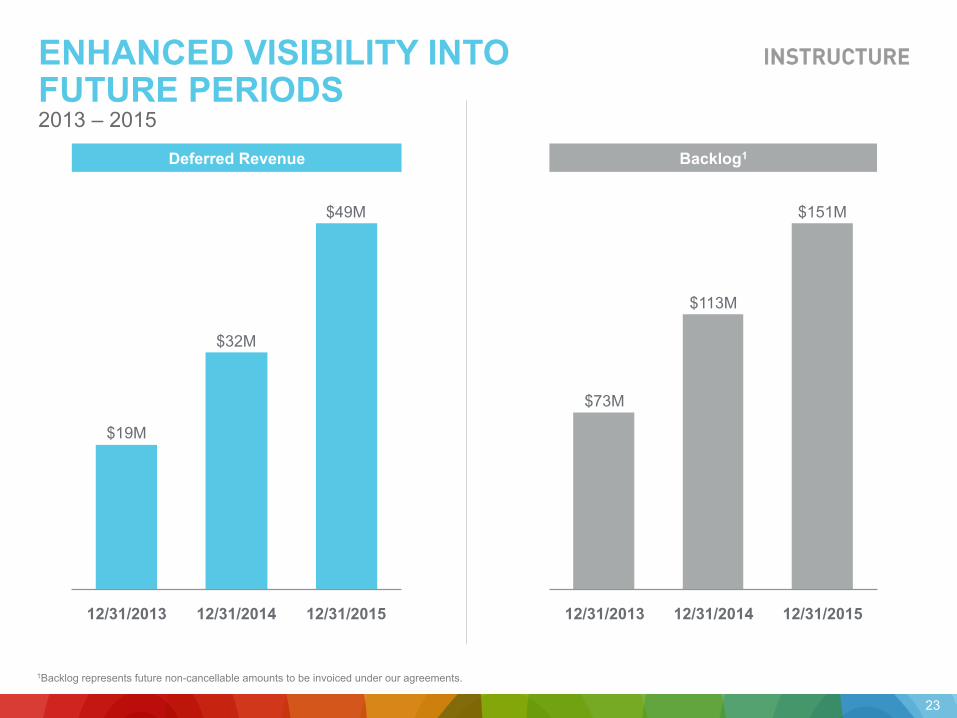
ENHANCED VISIBILITY INTO FUTURE PERIODS 2013 – 2015 Backlog1 Deferred Revenue
12/31/2015
$151M
12/31/2014
$113M
$73M
12/31/2013 12/31/2013 12/31/2015
$32M
12/31/2014
$49M
$19M
1Backlog represents future non-cancellable amounts to be invoiced under our agreements.
23
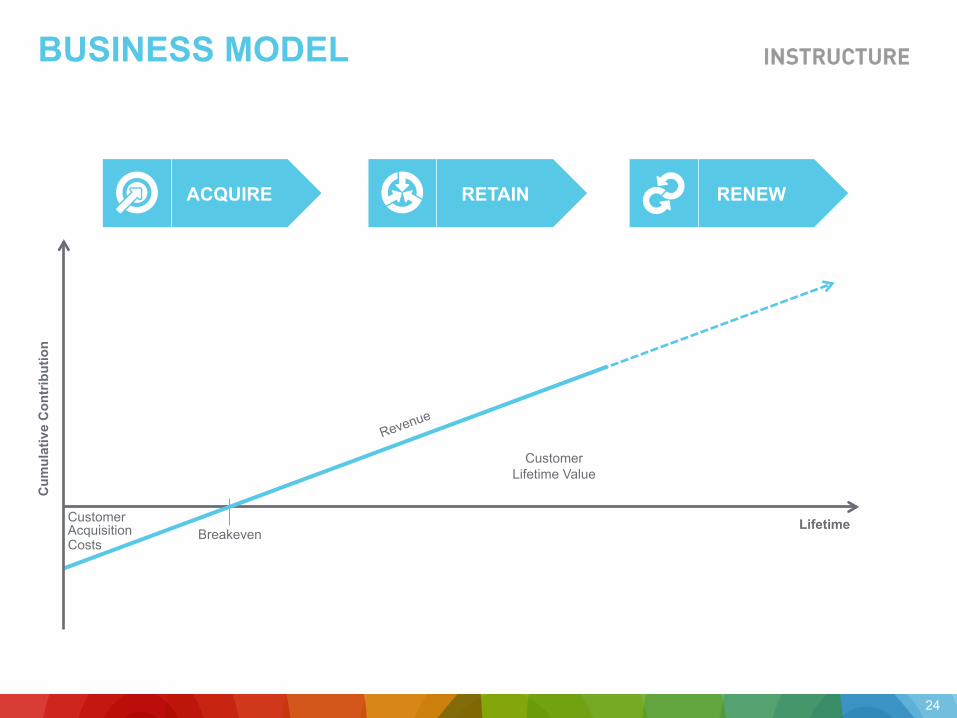
BUSINESS MODEL
Cum
ulat
ive
Con
trib
utio
n
24
Lifetime Customer Acquisition Costs
Breakeven
Customer Lifetime Value
ACQUIRE RETAIN RENEW
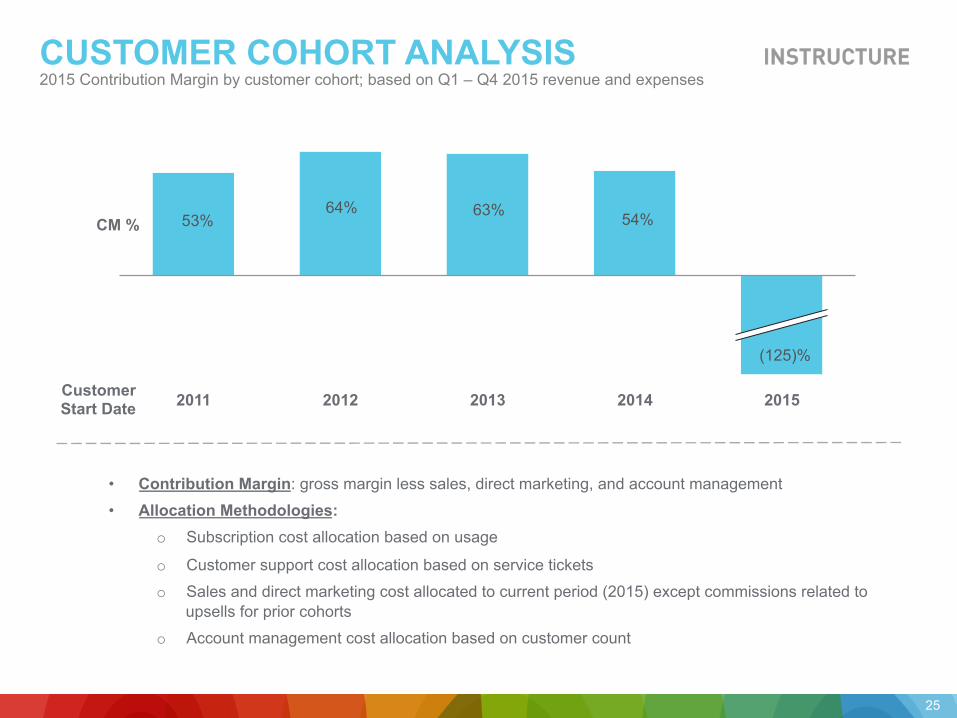
• Contribution Margin: gross margin less sales, direct marketing, and account management
• Allocation Methodologies: o Subscription cost allocation based on usage
o Customer support cost allocation based on service tickets
o Sales and direct marketing cost allocated to current period (2015) except commissions related to upsells for prior cohorts
o Account management cost allocation based on customer count
CUSTOMER COHORT ANALYSIS 2015 Contribution Margin by customer cohort; based on Q1 – Q4 2015 revenue and expenses
CM %
2015 2014 2013 2012 2011 Customer Start Date
25
53% 64% 63% 54%
(125)%
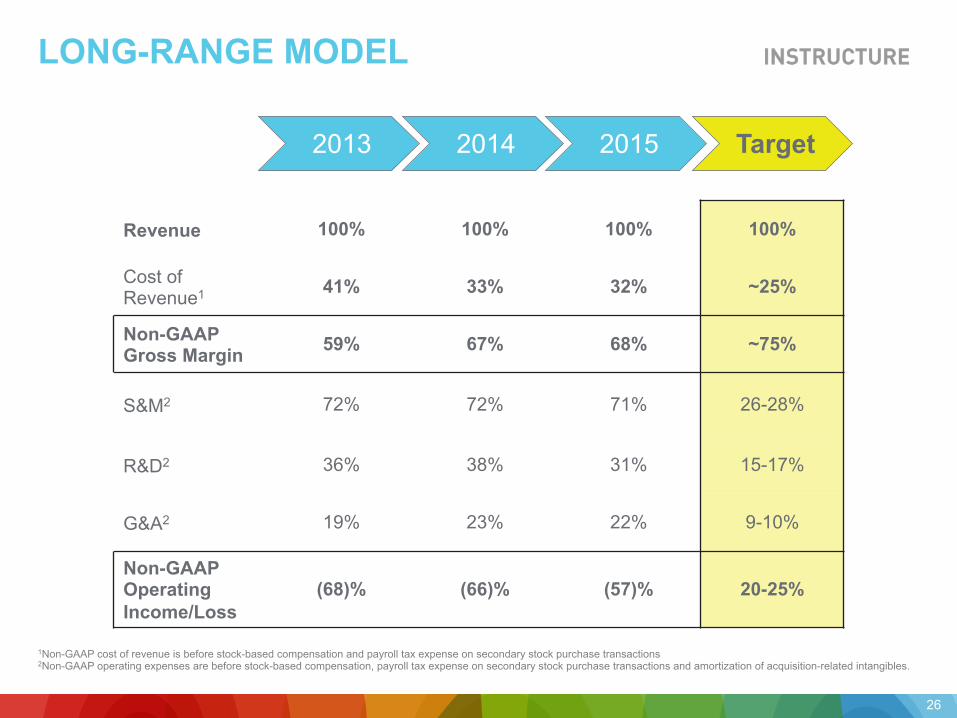
LONG-RANGE MODEL
Revenue 100% 100% 100% 100%
Cost of Revenue1 41% 33% 32% ~25%
Non-GAAP Gross Margin 59% 67% 68% ~75%
S&M2 72% 72% 71% 26-28%
R&D2 36% 38% 31% 15-17%
G&A2 19% 23% 22% 9-10%
Non-GAAP Operating Income/Loss
(68)% (66)% (57)% 20-25%
2013 2014 2015 Target
1Non-GAAP cost of revenue is before stock-based compensation and payroll tax expense on secondary stock purchase transactions 2Non-GAAP operating expenses are before stock-based compensation, payroll tax expense on secondary stock purchase transactions and amortization of acquisition-related intangibles.
26
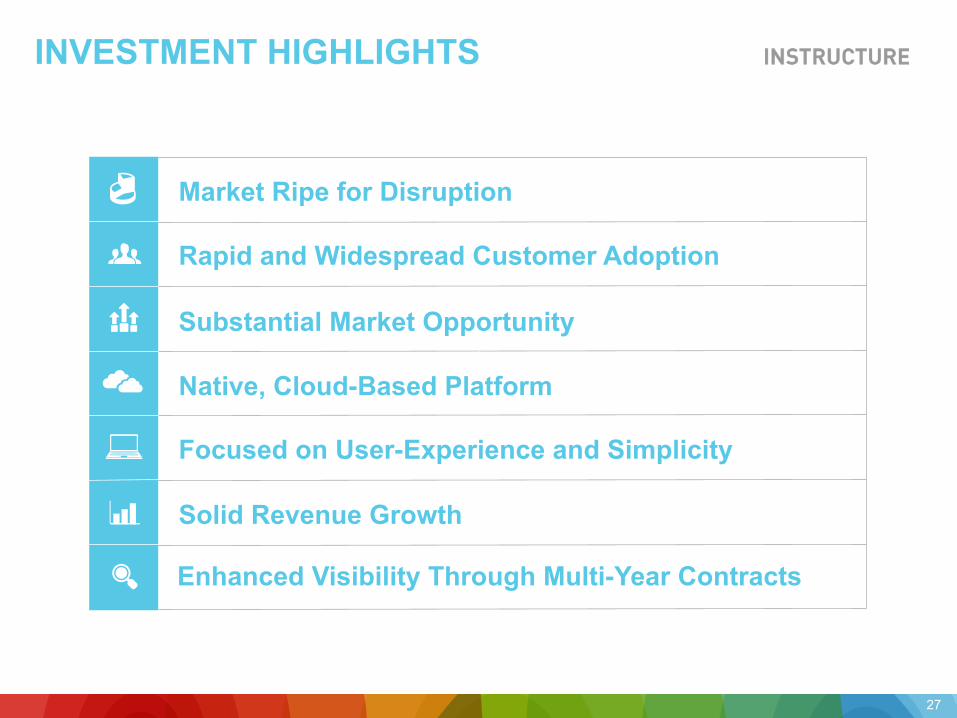
INVESTMENT HIGHLIGHTS
Market Ripe for Disruption
Rapid and Widespread Customer Adoption
Substantial Market Opportunity
Native, Cloud-Based Platform
Focused on User-Experience and Simplicity
Solid Revenue Growth
Enhanced Visibility Through Multi-Year Contracts
27

APPENDIX
29
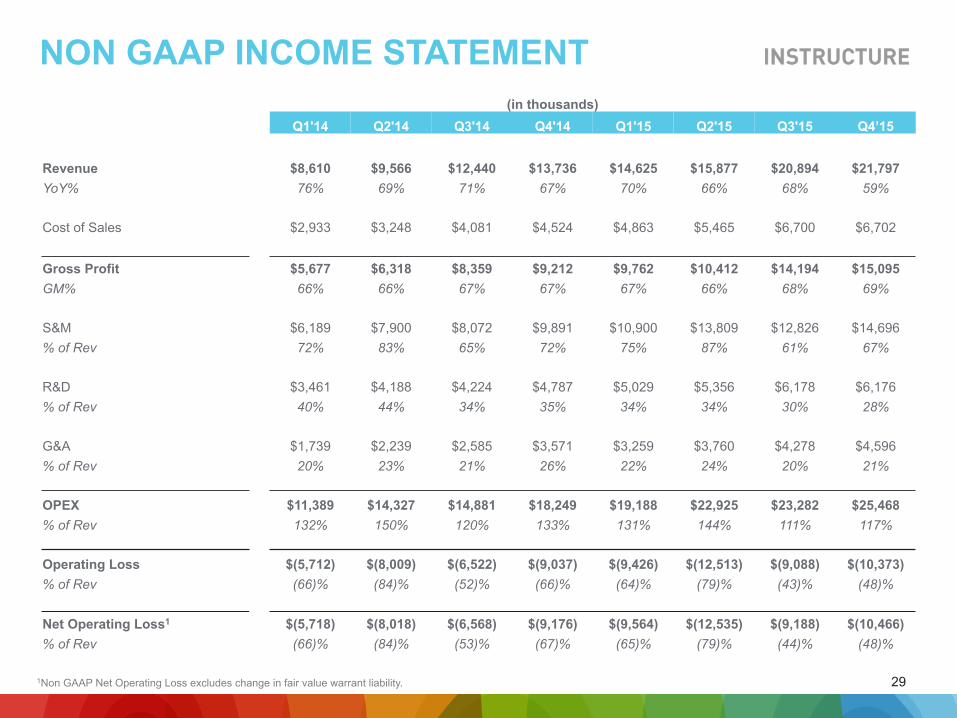
(in thousands) Q1'14 Q2'14 Q3'14 Q4'14 Q1'15 Q2'15 Q3'15 Q4’15
Revenue $8,610 $9,566 $12,440 $13,736 $14,625 $15,877 $20,894 $21,797 YoY% 76% 69% 71% 67% 70% 66% 68% 59%
Cost of Sales $2,933 $3,248 $4,081 $4,524 $4,863 $5,465 $6,700 $6,702
Gross Profit $5,677 $6,318 $8,359 $9,212 $9,762 $10,412 $14,194 $15,095 GM% 66% 66% 67% 67% 67% 66% 68% 69%
S&M $6,189 $7,900 $8,072 $9,891 $10,900 $13,809 $12,826 $14,696 % of Rev 72% 83% 65% 72% 75% 87% 61% 67%
R&D $3,461 $4,188 $4,224 $4,787 $5,029 $5,356 $6,178 $6,176 % of Rev 40% 44% 34% 35% 34% 34% 30% 28%
G&A $1,739 $2,239 $2,585 $3,571 $3,259 $3,760 $4,278 $4,596 % of Rev 20% 23% 21% 26% 22% 24% 20% 21%
OPEX $11,389 $14,327 $14,881 $18,249 $19,188 $22,925 $23,282 $25,468 % of Rev 132% 150% 120% 133% 131% 144% 111% 117%
Operating Loss $(5,712) $(8,009) $(6,522) $(9,037) $(9,426) $(12,513) $(9,088) $(10,373) % of Rev (66)% (84)% (52)% (66)% (64)% (79)% (43)% (48)%
Net Operating Loss1 $(5,718) $(8,018) $(6,568) $(9,176) $(9,564) $(12,535) $(9,188) $(10,466) % of Rev (66)% (84)% (53)% (67)% (65)% (79)% (44)% (48)%
NON GAAP INCOME STATEMENT
1Non GAAP Net Operating Loss excludes change in fair value warrant liability.
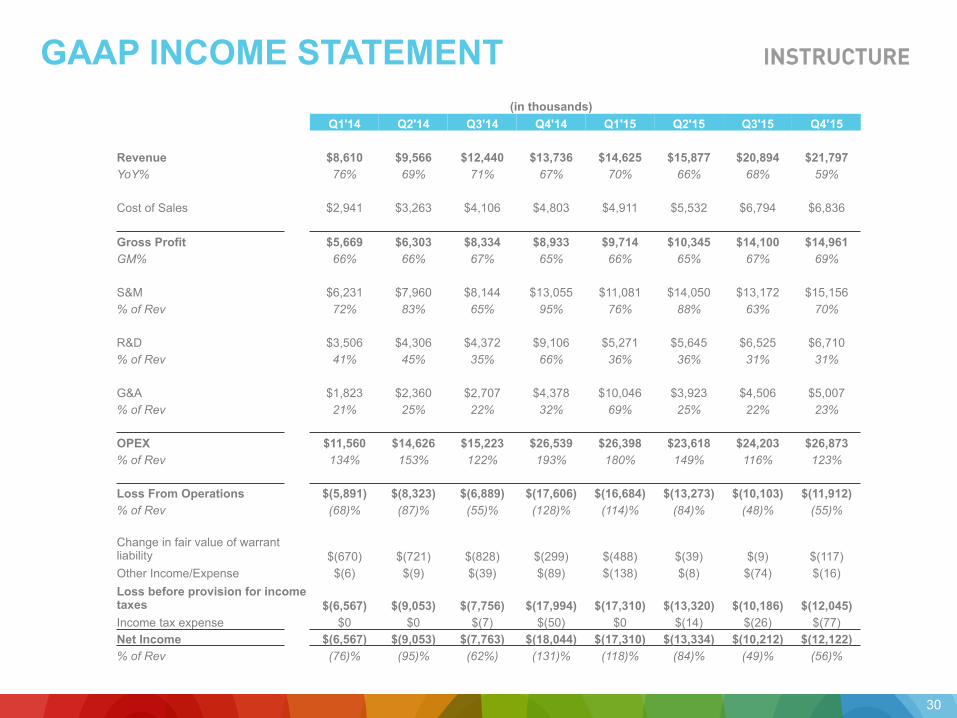
GAAP INCOME STATEMENT
(in thousands) Q1'14 Q2'14 Q3'14 Q4'14 Q1'15 Q2'15 Q3'15 Q4’15
Revenue $8,610 $9,566 $12,440 $13,736 $14,625 $15,877 $20,894 $21,797 YoY% 76% 69% 71% 67% 70% 66% 68% 59%
Cost of Sales $2,941 $3,263 $4,106 $4,803 $4,911 $5,532 $6,794 $6,836
Gross Profit $5,669 $6,303 $8,334 $8,933 $9,714 $10,345 $14,100 $14,961 GM% 66% 66% 67% 65% 66% 65% 67% 69%
S&M $6,231 $7,960 $8,144 $13,055 $11,081 $14,050 $13,172 $15,156 % of Rev 72% 83% 65% 95% 76% 88% 63% 70%
R&D $3,506 $4,306 $4,372 $9,106 $5,271 $5,645 $6,525 $6,710 % of Rev 41% 45% 35% 66% 36% 36% 31% 31%
G&A $1,823 $2,360 $2,707 $4,378 $10,046 $3,923 $4,506 $5,007 % of Rev 21% 25% 22% 32% 69% 25% 22% 23%
OPEX $11,560 $14,626 $15,223 $26,539 $26,398 $23,618 $24,203 $26,873 % of Rev 134% 153% 122% 193% 180% 149% 116% 123%
Loss From Operations $(5,891) $(8,323) $(6,889) $(17,606) $(16,684) $(13,273) $(10,103) $(11,912) % of Rev (68)% (87)% (55)% (128)% (114)% (84)% (48)% (55)%
Change in fair value of warrant liability $(670) $(721) $(828) $(299) $(488) $(39) $(9) $(117) Other Income/Expense $(6) $(9) $(39) $(89) $(138) $(8) $(74) $(16) Loss before provision for income taxes $(6,567) $(9,053) $(7,756) $(17,994) $(17,310) $(13,320) $(10,186) $(12,045) Income tax expense $0 $0 $(7) $(50) $0 $(14) $(26) $(77) Net Income $(6,567) $(9,053) $(7,763) $(18,044) $(17,310) $(13,334) $(10,212) $(12,122) % of Rev (76)% (95)% (62%) (131)% (118)% (84)% (49)% (56)%
30
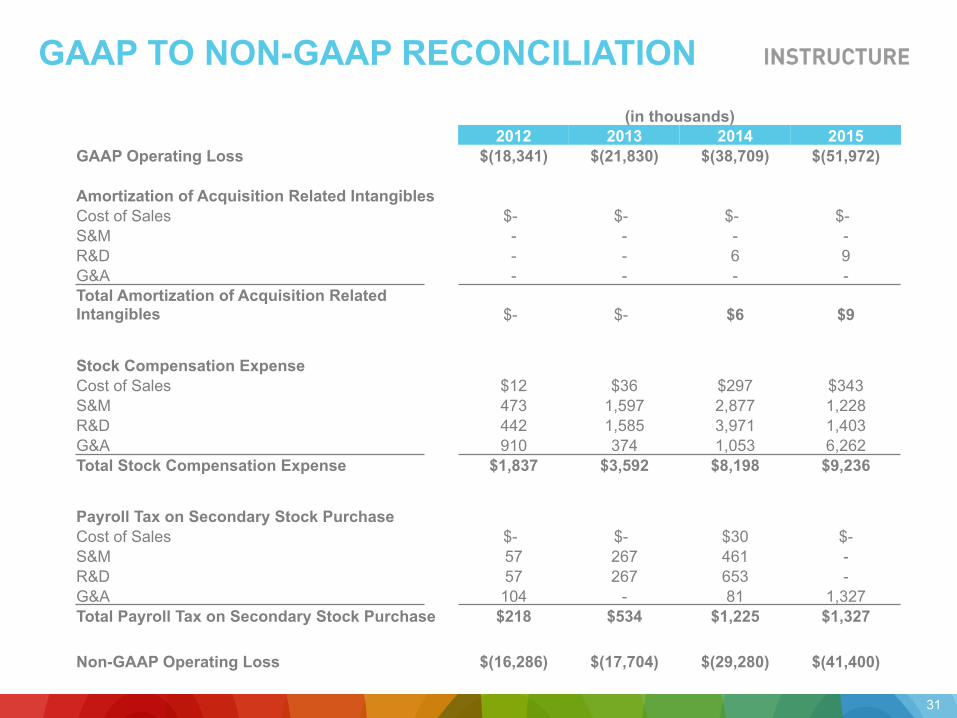
GAAP TO NON-GAAP RECONCILIATION (in thousands)
2012 2013 2014 2015
GAAP Operating Loss $(18,341) $(21,830) $(38,709) $(51,972)
Amortization of Acquisition Related Intangibles Cost of Sales $- $- $- $- S&M - - - - R&D - - 6 9 G&A - - - - Total Amortization of Acquisition Related Intangibles $- $- $6 $9
Stock Compensation Expense Cost of Sales $12 $36 $297 $343 S&M 473 1,597 2,877 1,228 R&D 442 1,585 3,971 1,403 G&A 910 374 1,053 6,262 Total Stock Compensation Expense $1,837 $3,592 $8,198 $9,236
Payroll Tax on Secondary Stock Purchase Cost of Sales $- $- $30 $- S&M 57 267 461 - R&D 57 267 653 - G&A 104 - 81 1,327 Total Payroll Tax on Secondary Stock Purchase $218 $534 $1,225 $1,327
Non-GAAP Operating Loss $(16,286) $(17,704) $(29,280) $(41,400)
31
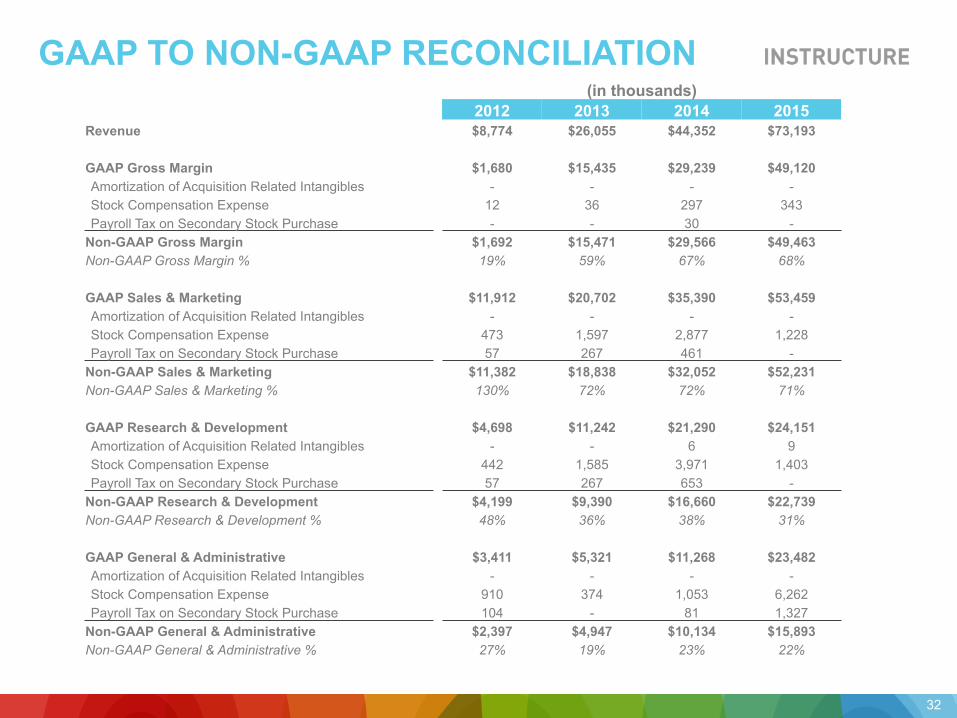
GAAP TO NON-GAAP RECONCILIATION (in thousands)
2012 2013 2014 2015
Revenue $8,774 $26,055 $44,352 $73,193
GAAP Gross Margin $1,680 $15,435 $29,239 $49,120 Amortization of Acquisition Related Intangibles - - - - Stock Compensation Expense 12 36 297 343 Payroll Tax on Secondary Stock Purchase - - 30 -
Non-GAAP Gross Margin $1,692 $15,471 $29,566 $49,463 Non-GAAP Gross Margin % 19% 59% 67% 68%
GAAP Sales & Marketing $11,912 $20,702 $35,390 $53,459 Amortization of Acquisition Related Intangibles - - - - Stock Compensation Expense 473 1,597 2,877 1,228 Payroll Tax on Secondary Stock Purchase 57 267 461 -
Non-GAAP Sales & Marketing $11,382 $18,838 $32,052 $52,231 Non-GAAP Sales & Marketing % 130% 72% 72% 71%
GAAP Research & Development $4,698 $11,242 $21,290 $24,151 Amortization of Acquisition Related Intangibles - - 6 9 Stock Compensation Expense 442 1,585 3,971 1,403 Payroll Tax on Secondary Stock Purchase 57 267 653 -
Non-GAAP Research & Development $4,199 $9,390 $16,660 $22,739 Non-GAAP Research & Development % 48% 36% 38% 31%
GAAP General & Administrative $3,411 $5,321 $11,268 $23,482 Amortization of Acquisition Related Intangibles - - - - Stock Compensation Expense 910 374 1,053 6,262 Payroll Tax on Secondary Stock Purchase 104 - 81 1,327
Non-GAAP General & Administrative $2,397 $4,947 $10,134 $15,893 Non-GAAP General & Administrative % 27% 19% 23% 22%
32
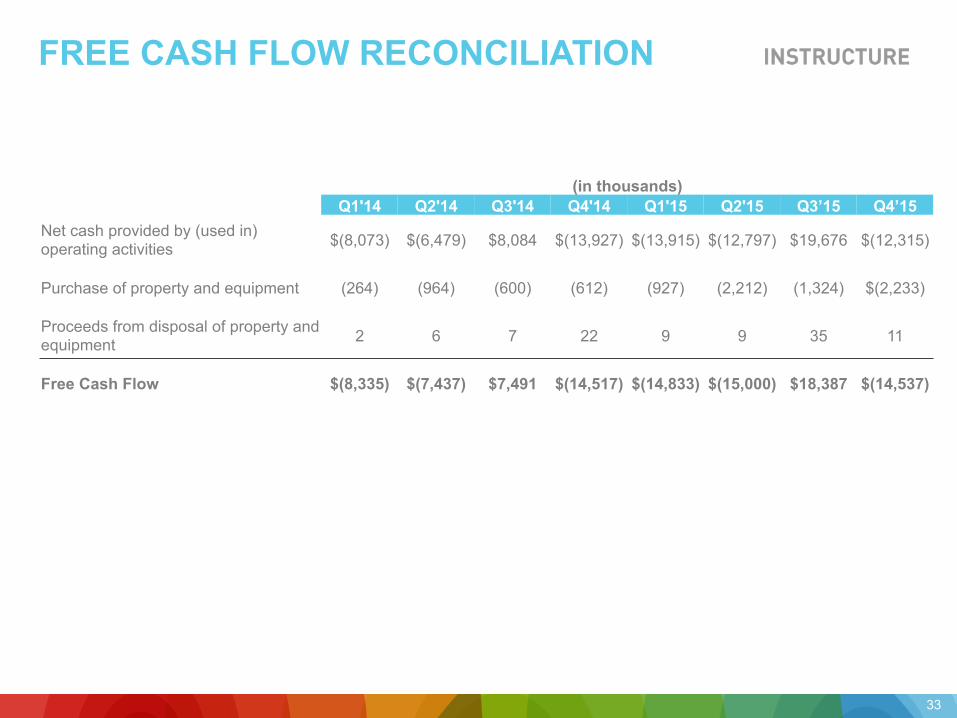
FREE CASH FLOW RECONCILIATION
33
(in thousands) Q1'14 Q2'14 Q3'14 Q4'14 Q1'15 Q2'15 Q3’15 Q4’15
Net cash provided by (used in) operating activities $(8,073) $(6,479) $8,084 $(13,927) $(13,915) $(12,797) $19,676 $(12,315)
Purchase of property and equipment (264) (964) (600) (612) (927) (2,212) (1,324) $(2,233)
Proceeds from disposal of property and equipment 2 6 7 22 9 9 35 11
Free Cash Flow $(8,335) $(7,437) $7,491 $(14,517) $(14,833) $(15,000) $18,387 $(14,537)