The Impact of Financial Deepening on the contribution of ...

Recommended Citation
Farla, K. (2014). Institutions and Financial Deepening. Review of Economics and Institutions, 5(2),
Article 6. doi: 10.5202/rei.v5i2.98. Retrieved from http://www.rei.unipg.it/rei/article/view/98
Copyright © 2014 University of Perugia Electronic Press. All rights reserved
Review of ECONOMICS
and
INSTITUTIONS
Review of Economics and Institutions
www.rei.unipg.it
ISSN 2038-1379 DOI 10.5202/rei.v5i2.98
Vol. 5 – No. 2, Spring-Fall 2014 – Article 6
Institutions and Financial Deepening
Kristine Farla MGSoG/UNU-MERIT Maastricht University
Abstract: This study investigates the extent to which institutional characteristics are related to countries' level of credit depth. The findings suggest that the development of formal property rights, contracting, and competition institutions is positively related to an increase in credit to the private sector as a ratio of GDP. This result remains robust when controlling for the effect of financial policy. The relation between institutional characteristics and banks' lending capacity and investment is mixed. However, overall, institutional development is positively related to credit deepening and investment. JEL classification: G18; O11; O43; Keywords: financial development, institutions
This study benefited from collaboration with the French Ministry for the Economy, Industry and Employment (MINEIE), the French Development Agency (AFD), from suggestions by Denis de Crombrugghe, Bart Verspagen, and two anonymous reviewers.
Address: MGSoG/UNU-MERIT, Maastricht University, Keizer Karelplein 19, 6211 TC, Maastricht, the Netherlands (Phone: +31 43 388 44 00. Email: [email protected])

REVIEW OF ECONOMICS AND INSTITUTIONS, Vol. 5, Issue 2 - Spring-Fall 2014, Article 6
1 Introduction
Credit to the private sector in the Unites States, Japan, Canada, Germany,and China is higher than 100% of GDP. In countries in Sub-Saharan Africacredit to the private sector is, on average, lower than 20% of GDP. Whydo these wide differences occur? And are they important? Credit deepen-ing makes possible an increase in investment, an expansion of production,technological change, and economic growth, and attracts foreign direct in-vestment. Levine (2005, p. 921) summarizes that “empirical analyses, in-cluding firm-level studies, industry-level studies, individual country-levelstudies, time-series studies, panel investigations, and broad cross-countrycomparisons, demonstrate a strong positive link between the functioning ofthe financial system and long-run economic growth”. Similarly, the morerecent study by Jeong and Townsend (2007) concludes that, in Thailand,financial deepening plays a substantial role in determining total factor pro-ductivity growth. Moreover, on the basis of a theoretical model, Greenwoodet al. (2013, p. 211) predict that “world output could increase by 53 percentif all countries adopted the best financial practice in the world.”1 Closely re-lated is the work of Greenwood et al. (2010) who establish a causal relationbetween the efficiency of financial intermediation, information frictions andeconomic development. On the basis of data on US firms, Gilchrist et al.(2013) specifically identify the degree of missallocation of resources that isattributable to financial market frictions. These authors use firms’ borrow-ing costs as a proxy for financial market frictions and conclude that—in de-veloped capital markets—financial market frictions only have a small effecton efficiency losses.
One possible effect of the development of stronger institutions is reduc-ing financial market frictions which for example can lower the cost of lend-ing, generate a higher lending base, and increase the financing of more long-term commitments. In this study we investigate what type of institutionalcharacteristics enable firms’ access to credit markets, and hence are relatedto financial deepening. Financial deepening is defined as an increase in thevolume of credit as a proportion of GDP and the concept is measured usingdata on domestic credit to the private sector by financial intermediaries (thetotal value of loans, trade credits and non-equity securities), as a proportionof GDP.
The types of institutions that we are interested in are (1) property rightsinstitutions, (2) contracting institutions and (3) competition institutions. The-re are several channels by which these types of institutions may influencefinancial deepening. First, we expect that strong property rights institu-tions secure property ownership over time. Weak security of property rights
1 When taking inefficiencies in the non-financial sector into account, this large potential im-pact of financial sector development on economic growth is substantially lower (Green-wood et al., 2013).
Copyright c© 2014 University of Perugia Electronic Press. All rights reserved 2

Farla: Institutions and Financial Deepening
can endanger investors’ and borrowers’ ability to retrieve future revenuefrom investment. This may have a negative impact on firms’ ability to bor-row and invest and may lower the size of loans. Moreover, Bae and Goyal(2009) find that banks issue higher loan amounts with longer loan maturi-ties and request relatively lower loan spreads in countries with strong prop-erty rights protection than in countries with weak property rights protec-tion. Second, we expect that strong contracting institutions reduce infor-mation asymmetry, the costs of contracting, the risk of contractual breach,and can enhance the credibility of contracting. Even though personalizedcontracting systems may be sufficient to protect ‘small’ loans and short-runlending arrangements, it is likely that substantial credit deepening requiresstrong contracting institutions. Third, the absence of competition institu-tions may create an environment that only supports the development of theexisting industry. The monopolization of industry creates entry restrictionsand can cause firms to under invest. A lack of competition is especiallydetrimental to small organizations, risky projects, and ‘infant’ firms’ will-ingness to borrow. Moreover, a lack of competition could result in concen-trated sectoral allocation of investment and general inefficient allocation ofinvestment across sectors and project owners. Finally, monopolization ofthe banking industry can cause frequent breaching of contracts, lack of risk-diversification, and could undermine credibility in the financial system.
This study is closely related to the work of Acemoglu and Johnson (2005)who find that property rights protection has a positive influence on finan-cial deepening (as well as on other indicators of economic performance).The authors find no effect on contracting institutions on financial deepen-ing and hypothesize that contracting institutions are relatively unimportantbecause agents can change financial intermediation and terms of contracts.2
We revisit the relationship between institutions and financial deepening us-ing alternative measurements of property rights protection and contractinginstitutions and additionally estimate the effect of competition institutions.Contrary to the methodological approach of Acemoglu and Johnson (2005),we construct indicators for property rights, contracting, and competitioninstitutions using the same data source. To the best of our knowledge, therelevance of this combination of institutional characteristics has not beenpreviously investigated in relation to financial development. The institu-tional indicators are transparent in their composition, comparable in scaleand construction, and include both de-jure and de-facto perspectives oncountries’ institutional development. The institutional indicators describeinstitutional characteristics which are stable and inert in the medium/long-term. The Hausman-Taylor method with Amemiya-MaCurdy (1986) spec-
2 Similarly, Djankov et al. (2007) argue that private registries can stimulate the private sec-tor by facilitating information exchange between firms. Djankov et al. also find evidencethat in poorer countries the private credit to GDP ratio increases along with the introduc-tion of credit registries.
http://www.rei.unipg.it/rei/article/view/98 3

REVIEW OF ECONOMICS AND INSTITUTIONS, Vol. 5, Issue 2 - Spring-Fall 2014, Article 6
ification is used in order to retrieve the parameter estimates of these time-invariant institutional indicators.
On the basis of panel data of 81 countries for the period 1994-2005, weconclude that there is a strong relationship between property rights, con-tracting and competition institutions and private sector credit deepening.Overall, the institutional indicators remain positive and significant whencontrolling for the effect of financial policy, and when using alternative mea-sures of financial depth and investment.
2 Empirical Approach
2.1 Institutional Indicators
We construct institutional indicators using a relatively unexploited per-ception based survey, the Institutional Profiles Database (IPD, 2009). Thevariables selected describe institutional arrangements for property rights,contracting, and competition.3 Some of the IPD variables (explicitly) com-prise of both a de-jure and de-facto assessment of a countries’ institutionalrules. The IPD data describes ‘stable’ institutional arrangements and do notfocus on describing current change in states’ rule. Moreover, an advantageof using institutional data from the same source is that there is no differencein data collection and treatment. The data are fit for cross-country compari-son and for comparison across indicators.4
The IPD variables are listed below on the basis of a tentative categoriza-tion. Property rights institutions refer to regulations that protect current andfuture tangible and intangible property and revenues that originate fromproperty, i.e., land and non-land assets and intellectual property. Contract-ing institutions consist of arrangements protecting the security of contracts,government respect for contracts, transparency in the banking system, en-forcement of the justice system, creditor rights, the speed of rulings andeffectiveness of commercial courts. Competition institutions refer to typesof regulations that seek to “control or eliminate restrictive agreements orarrangements among enterprises, or mergers and acquisitions or abuse ofdominant positions of market power, which limit access to markets or oth-erwise unduly restrain competition, adversely affecting domestic or inter-
3 This variable selection does not include variables that describe local and sub-nationalinstitutional arrangements, variables that describe costs for foreign actors, variables thatdescribe change and reforms, survey questions that are not relevant for all countries, andsurvey questions that are unclear, ambiguous, or may be particularly difficult for countryexperts to answer.
4 Lack of cross-country and over time comparability is a weakness of data from the WorldBank Worldwide Governance Indicators, the International Country Risk Rating (ICRG)/ PRS Group, and the Fraser institute (De Crombrugghe, 2010).
Copyright c© 2014 University of Perugia Electronic Press. All rights reserved 4

Farla: Institutions and Financial Deepening
national trade or economic development” (UNCTAD, 2007, p. 3).5
Property rights institutions
• Effectiveness of legal measures to defend property rights between private agents(A6000)
• Degree of reasonable compensation in the event of de-jure or de-facto expro-priation of land property (A6001)
• Degree of reasonable compensation in the event of de-jure or de-facto expro-priation of property for production (A6002)
• Frequency of arbitrary government pressure on private property (e.g. usingred tape) (A6003)
• Respect for intellectual property protection in terms of manufacturing secrets,patents (B6020)
• Respect for intellectual property protection in terms of counterfeiting (B6021)
Contract institutions
• Predictability of the results of public procurement contract bids (A3040)
• Independence of the commercial courts from the government in commercialdisputes (A6020)
• Extent of enforcement and speed of commercial court rulings (A6023)
• Extent of enforcement of bankruptcy law (A6030)
Competition institutions
• Degree of administrative barriers (e.g. red tape) restricting firm entry (B7000)
• Effectiveness of competition regulation arrangements (non-banking) to com-bat restrictive collective agreements i.e. cartels (B7020)
• Effectiveness of competition regulation arrangements (non-banking) to com-bat abuses of dominant positions (B7021)
• Existence of competition arrangements in the banking system to combat re-strictive collective agreements i.e. cartels (C7010)
• Existence of competition arrangements in the banking system to combat abuseof dominant position (C7011)
One observation is that, overall, higher scores on the variables are asso-ciated with formal institutional regulations. This observation is related tothe work of Greif and Tabellini (2010) who argues that, in China, institu-tions rely more on an informal organization of enforcement and, in Europe,institutions rely more on a formal organization of enforcement. Hasan et al.(2009) note similar changes in institutions at the province level in Chinaand argues that these changes have a positive effect on GDP growth. In thisstudy we will explore whether formal institutional rules are associated withhigher volumes of credit as a proportion of GDP.
5 Competition policy generally comprises the following elements: antitrust and cartels,market liberalization, state aid control, and merger control. Because competition policyis formalized in countries’ legal framework, in the context of this study we prefer thelabel ‘competition institutions’.
http://www.rei.unipg.it/rei/article/view/98 5

REVIEW OF ECONOMICS AND INSTITUTIONS, Vol. 5, Issue 2 - Spring-Fall 2014, Article 6
We consider the IPD data an interesting alternative to the data used, forexample, by Acemoglu and Johnson (2005) to measure property rights andcontracting institutions. Acemoglu and Johnson (as well as Tressel and De-tragiache, 2008 and Quintyn and Verdier, 2010) measure property rightsprotection using data from Marshall and Jaggers (2009) as a proxy.6 Thisdata may be unfit to capture property rights institutions because, as de-scribed by Glaeser et al. (2004), ‘constraint on the executive’ is a volatilemeasurement which is more a reflection of the result of elections.7 In orderto measure the effect of contracting institutions on credit deepening, Ace-moglu and Johnson (2005) use de-jure descriptions of legal arrangementsintended to protect contracts. However, the existence of de-jure rules doesnot in itself guarantee that these rules are followed.
The core concern with estimating the relation between types of institu-tions and credit deepening when the using the IPD data is that the variablesare empirically closely related: the correlation of the variables is around0.6. We use principal component analysis (PCA) with varimax orthogo-nal rotation to create three institutional indicators. The varimax rotationmethod is chosen because it produces principal components (PCs) that con-tain high loadings for a few variables.8 Three PCs are retained because thevariable selection is made with the objective to describe three institutionaltypes (property rights, contracting and competition).
Figure 1 presents the results—the factor loadings—of the PCA. Principalcomponent 1 (PC1) contains 32% of the total variation. This PC loads highlyon the variables B7020, B7021, C7010, and C7011 which describe the degreeof existence and effectiveness of competition regulations. PC1 is thereforeinterpreted as the component describing the degree of formalization of com-petition institutions. Countries that score highly on this PC are for exampleIreland, Korea, and the Netherlands. Countries that score lowly on this PCare for example Kuwait, Qatar, and Mali. The lower bound of the PC cap-tures countries that have little or no arrangements to stimulate competition.
Principal component 2 (PC2) contains 25% of the total variation andloads highly on the variables A6001 and A6002. These variables describethe degree of reasonable compensation granted in the event of expropria-tion of property. PC2 is therefore identified as describing institutional rules
6 Tressel and Detragiache (2008, p. 16) argue that only countries with stronger constrainson executive experience sustainable financial acceleration after a financial reform, andthat creditor rights, contract enforcement, and legal origins do not determine the successof sustainable financial accelerations. Similarly, Quintyn and Verdier (2010) find thatcountries’ probability to achieve a period of sustained long-run financial developmentafter a financial acceleration is positively influenced by ‘constraint on executive’ and thedurability of democracy.
7 Following calculations on the basis of the sample of 88 countries used throughout thisstudy, the indicator ‘constraint on the executive’ indeed has more variation over timethan between countries.
8 The PCA is run using the 88 countries listed in Table 5 in the appendix. The PCA is runusing the Stata command ‘factor’ with specification pcf.
Copyright c© 2014 University of Perugia Electronic Press. All rights reserved 6

Farla: Institutions and Financial Deepening
to secure property rights. The upper bound of PC2 describes countries thathave secured property rights protection across sectors. Countries that scorehighly on this component are Slovenia, Czech Republic, and Kuwait. Coun-tries that score lowly on component 2 are Pakistan, Cameroon, and Syria.
Principal component 3 (PC3) contains 21% of the total variation andloads highly on variable A3040 which describes the predictability of the re-sults of public procurement contract bids. This PC captures the de-factorole of the state in contracting. Countries that have transparent contract-ing regulations score on the upper bound of this component, for exampleFinland, Cyprus, and Philippines. Countries that score lowly on compo-nent 3 are Guatemala, Benin, and Chad. In the sequel, PC1 is referred to asCompetition, PC2 as Property, and PC3 as Contract.
The results of the PCA do not fully confirm our tentative categorizationof variables. In particular, we find that the variable B7000 which capturesthe degree of administrative barriers is relatively closer related to Contract.Also, variables B6021 and A6000 are relatively closer related to Contractthan to Property. And, contrary to expectations, variables A6023 and A6030load relatively higher on Competition. Excluding these variables from thePCA has no strong influence on the loadings of the other variables andtherefore does not influence the interpretation of the PCs.
Figure 1 - Construction of Orthogonal Institutional Measurements
0.1
.2.3
.4.5
.6.7
.8.9
Load
ings
of P
rinci
pal C
ompo
nent
s
a600
0
a600
1
a600
2
a600
3
b602
0
b602
1
a304
0
a602
0
a602
3
a603
0
b700
0
b702
0
b702
1
c701
0
c701
1
Selection of Variables
Results of Factor Analysis with Varimax Rotation
Competition (PC1) Property (PC2) Contract (PC3)
http://www.rei.unipg.it/rei/article/view/98 7

REVIEW OF ECONOMICS AND INSTITUTIONS, Vol. 5, Issue 2 - Spring-Fall 2014, Article 6
Figure 2 - Scatter Plots: Credit and Institutional indicators
ARG
AUS
BENBFA
BGD
BOL
BWA
CAF
CAN
CHE
CHN
CIVCMR
COL
CYP
CZE
DEU
DNK
DOM
DZA
ECU
EGY
ESP
EST
FIN
GAB
GBR
GHA
GRC
GTM
HND HUNIND
IRL
ISRITAJOR
KEN
KOR
KWT
LBYLKA
LTULVA
MAR
MDG
MEXMLI MNGMOZ
MYS
NER
NPL
NZL
PAK
PAN
PER
PHL
POL
PRT
QAT
ROMRUS
SAU
SDN
SEN
SVKSVN
SWE
SYRTCD
TGO
THA
TUN
TUR
TZAUGA
URY
USA
VEN
ZAF
050
100
150
200
Cre
dit t
o th
e pr
ivat
e se
ctor
/ G
DP
(av
erag
e 19
94−
2005
)
0 .2 .4 .6 .8 1Competition (component 1)
Source: WDI 2011 & IPD 2009
Relation between credit in the private sector and Competition
ARG
AUS
BEN BFA
BGD
BOL
BWA
CAF
CAN
CHE
CHN
CIVCMR
COL
CYP
CZE
DEU
DNK
DOM
DZA
ECU
EGY
ESP
EST
FIN
GAB
GBR
GHA
GRC
GTM
HNDHUNIND
IRL
ISRITAJOR
KEN
KOR
KWT
LBYLKA
LTULVA
MAR
MDG
MEXMLIMNGMOZ
MYS
NER
NPL
NZL
PAK
PAN
PER
PHL
POL
PRT
QAT
ROMRUS
SAU
SDN
SEN
SVKSVN
SWE
SYRTCD
TGO
THA
TUN
TUR
TZA UGA
URY
USA
VEN
ZAF
050
100
150
200
Cre
dit t
o th
e pr
ivat
e se
ctor
/ G
DP
(av
erag
e 19
94−
2005
)
0 .2 .4 .6 .8 1Property (component 2)
Source: WDI 2011 & IPD 2009
Relation between credit in the private sector and Property
ARG
AUS
BEN BFA
BGD
BOL
BWA
CAF
CAN
CHE
CHN
CIVCMR
COL
CYP
CZE
DEU
DNK
DOM
DZA
ECU
EGY
ESP
EST
FIN
GAB
GBR
GHA
GRC
GTM
HND HUNIND
IRL
ISRITAJOR
KEN
KOR
KWT
LBYLKA
LTULVA
MAR
MDG
MEXMLI MNG MOZ
MYS
NER
NPL
NZL
PAK
PAN
PER
PHL
POL
PRT
QAT
ROMRUS
SAU
SDN
SEN
SVKSVN
SWE
SYRTCD
TGO
THA
TUN
TUR
TZAUGA
URY
USA
VEN
ZAF
050
100
150
200
Cre
dit t
o th
e pr
ivat
e se
ctor
/ G
DP
(av
erag
e 19
94−
2005
)
0 .2 .4 .6 .8 1Contract (component 3)
Source: WDI 2011 & IPD 2009
Relation between credit in the private sector and Contract
Copyright c© 2014 University of Perugia Electronic Press. All rights reserved 8

Farla: Institutions and Financial Deepening
As illustrated in Figure 2, higher levels of credit in the private sectorare associated with higher values of Competition, Property, and Contract.European countries score on the upper bound of the institutional indicatorsbut differ substantially in the level of credit to the private sector. Some morepronounced differences between the institutional indicators include Qatarand Kuwait that score lowly on Competition but highly on Property. Syria,Philippines, and Pakistan score lowly on Property but highly on Contract.Chad, and the Czech Republic score lowly onContract but highly on Proper-ty. Argentina, Cameroon, China, and India score lowly on Property buthighly on Competition. Guatemala and Korea score lowly on Contract buthighly on Competition.
2.2 Model and Methodology
The aim of this study is to estimate effects of the between-country differ-ence of the institutional time-invariant (TI) indicators and both the between-county and over-time variation of the time-varying (TV) indicators. In thissection, the basic model is introduced as well as some terminology that isused throughout the remainder of this study.
Our main methodological challenge is the estimation of the effect of TIinstitutional indicators without biases or inconsistencies. In an attempt toaddress such concerns, the model is estimated using a Hausman-Taylor esti-mator with Amemiya-MaCurdy (1986) specification, hereafter AM. The AMmethod builds on the instrumental variable method proposed by Haus-man and Taylor (HT) (1981).9 The HT method estimates the parametersusing the TV variables both to estimate their own coefficients and as instru-ments for the endogenous TI variables (Hausman and Taylor, 1981). TheHT method uses the time-average of the TV exogenous variables as instru-ments. Amemiya and MaCurdy (1986) propose combining the between-country and over-time information of the TV exogenous variables as instru-ments. The model is mathematically represented by equation 1 below.
Yi,t = βXi,t + γZi + αi + εi,t (1)
Yi,t is the dependent variable, the ratio of credit to the private sector toGDP in country i in year t. αi represents the unobservable country-specificeffects. αi is assumed a random variable that is distributed independentlyacross our country sample with constant variance σ2
α. εi,t is the error termand is assumed to have a zero mean and constant variance σ2
ε , conditionalon Xi,t and Zi. Xi,t is a vector of TV indicators and is assumed to containboth exogenous and endogenous indicators. Zi is a vector of TI indicators
9 The Hausman-Taylor estimator with Amemiya-MaCurdy specification is typically usedless frequently than the estimator of Hausman and Taylor (1981) because it requires bal-anced data. One alternative application of the model in the field of finance is that ofTchakoute-Tchuigoa (2012).
http://www.rei.unipg.it/rei/article/view/98 9

REVIEW OF ECONOMICS AND INSTITUTIONS, Vol. 5, Issue 2 - Spring-Fall 2014, Article 6
and also is assumed to contain both exogenous and endogenous indica-tors. The endogenous part of Zi contains the institutional indicators. Onlythe between-country variation of the institutional characteristics is observedand the institutional characteristics are assumed inert in the medium-term.
The vector Xi,t includes several macroeconomic indicators. Data sourcesare given in the appendix. We control for the effect of savings (Savings)on Yi,t because the availability of collateral is a major requirement for cred-itors. Countries’ external debt (ExternalDebt) may be negatively related tofinancial development. Countries that have a large capital account surplusmay rely on foreign funding for investment instead of stimulating savingand investment in the domestic economy. We control for the influence ofexchange rates (ExchangeRate). Finally, we control for inflation (Inflation)measured as the rate of change in the consumer price index. High inflationdiscourages lending. All these variables are assumed to be exogenous, i.e.,uncorrelated with αi and εi,t.
The following TI indicators are used: incidence of malaria (Malaria),temperate zones (Temperate), and ethnic (Ethnic), linguistic (Language),and religious fragmentation (Religion).10 These are all assumed to be ex-ogenous.
On the one hand, several scholars argue that the development of in-stitutions is related to deep historical roots; for instance see Spolaore andWacziarg (2013) for a comprehensive overview of this literature. For exam-ple, Engerman and Sokoloff (1997) propose that countries’ natural resourcesand climate influences institutional development. Acemoglu et al. (2001)argue that the incentives of establishing early settlements and developingformal property rights is related to malaria incidence and tropical climates.Similarly, tropical climates may be related to relative underdevelopment ofcontracting institutions. Also, it is more likely that industry developed incountries with temperate zones favorable to agricultural development. Asa result, in such areas there may be a higher need for competition institu-tions. On the other hand, institutional formalization may be related to classfragmentation. The formalization of competition regulations may be influ-enced by ethnic fragmentation; high ethnic fragmentation may contributeto the economic/political dominance of a (small) ethnic majority. Coun-tries with high linguistic fragmentation may have established more formalregulations to facilitate business. In countries with religious fragmentation,states may have had more incentive to separate the church from private sec-tor regulations. Thereby, such countries may have early establishments of a
10 Acemoglu and Johnson (2005) use an IV approach with legal origins and settler mortalityas instruments for property rights and contracting. These frequently used indicators areboth based on the argument that the legal system and institutional heritage of countriesinfluence today’s institutions. Scholars have extensively argued that these indicators suf-fer from measurement bias, reverse-causality and/or estimations may suffer from omit-ted variable bias, in particular see Albouy, 2012 for a critique of Acemoglu et al. (2001)and the use of settler mortality data.
Copyright c© 2014 University of Perugia Electronic Press. All rights reserved 10

Farla: Institutions and Financial Deepening
more formal institutional setting.In order to assess the sensitivity of the data to unobserved unit effects
and reverse causality, the model is also tested using OLS with panel cor-rected standard errors (PCSE)11 and fixed effects vector decomposition, here-after FEVD.12
A Hausman specification test rejects a random effects model over a fixedeffects model. A Hausman test of the difference between a FE model andAmemiya-MaCurdy (AM) yields a χ2 value of 0.37, which is insignificant;this supports estimating using AM.13 The low χ2 statistic indicates that thecoefficients of the FE estimation and the AM estimation are close. A Haus-man test based on the difference between HT and AM yields a χ2 value of3.47 which also is insignificant. Thereby, this Hausman test does not rejectthe additional exogeneity assumptions of AM.
3 Results
3.1 Descriptive Statistics
This study is based on a balanced panel dataset for the period 1994 to2005. The sample of countries used throughout the analyses is listed in Table5 in the appendix.14
There is substantial cross-country variation in credit to the private sector.The average of countries’ ratio of credit to the private sector to GDP during1994-2005 ranges from less than 10% to more than 150%.15 Based on our
11 PCSEs, as proposed by Beck and Katz (1995), correct for ‘extreme overconfidence’ andyield standard errors that are within 10% of the true variability, also for data containingheteroskedasticity and contemporaneously correlated errors. PCSE does not address uniteffects.
12 The FEVD estimates for TV variables are the same as Fixed Effect (FE) estimates andare assumed endogenous. Unlike FE estimations, FEVD estimates TI variables in paneldata models with unit effects. TI variables are assumed exogenous and the methoddoes not control for causality. FEVD and HT estimators provide equal results when allTV variables are treated as endogenous and the TI variables are treated as exogenous(Breusch et al., 2011). FEVD has received several critiques, e.g. see Greene (2011), Chate-lain and Ralf (2010) and Breusch et al. (2011). The FEVD estimations here are based onan updated 2009 version (xtfevd4.0beta.ado) with revised standard errors (Plumper andTroeger, 2011).
13 The Hausman tests are based on the estimations presented in Table 1 where Competition,Property, and Contract are endogenous.
14 The countries Azerbaijan, Brazil, Bulgaria, Democratic Republic of Congo, Iran, India,Kazakhstan, Paraguay, Ukraine, Zimbabwe, and Zambia are not included in the samplebecause of hyperinflation rates and/or high levels of exchange rate over-valuation.
15 The dependent variable Credit has missing data for the following countries: Austria,Belgium, France, Mauritania, Netherlands, and Norway. These countries are excludedwhen using the variable Credit. In addition, Japan is excluded because of the country’shigh level of Credit. For some countries, data on the credit claims includes credit to
http://www.rei.unipg.it/rei/article/view/98 11

REVIEW OF ECONOMICS AND INSTITUTIONS, Vol. 5, Issue 2 - Spring-Fall 2014, Article 6
sample, the average ratio of credit to GDP is 47.35%.
3.2 Main Results
Table 1 reports the relation between credit to the private sector and in-stitutional characteristics whilst controlling for macroeconomic influences.Column 1 to 3 report the estimation results using the different regressionmethods. There is a strong and significant relationship between credit andthe formalization of institutional characteristics. Unlike the OLS with PCSEand FEVD methods, the AM method seeks to control for endogeneity ofthe institutional indicators. The magnitude of the institutional coefficientsis relatively similar which may indicate that there is limited reverse causal-ity between credit deepening and the development of formal institutionalrules. Alternatively, one possibility is that the AM method is not sufficientto address endogeneity and therefore, we cannot exclude the possibility ofreverse causality: i.e. that credit deepening triggers the establishment ofmore formal institutional rules.
The AM estimations in column 3 report that the formalization of compe-tition, property and contract institutions is significantly and positively re-lated to credit deepening.16 The coefficients of Temperate and Malaria aresignificant at a 10% level and have a direct relation with credit deepening.Following the results of the OLS estimation, Religion and Language are alsorelated to credit deepening. The coefficients of ExternalDebt and Savingshave the expected sign, are significant, and the estimations are relativelyconstant across regressions. The coefficients of Inflation andExchangeRateare close to zero. We also experimented using institutional proxies thatexclude some IPD variables (i.e. B7000, B6021, A6000, A6023, and A6030)which can be considered ‘misclassified’ in the construction of Competition,Property, and Contract. These results likewise suggest a significant andpositive relation between the institutional variables and credit as a propor-tion of GDP.
Column 4 in Table 1 reports the aggregate / combined magnitude ofthe formalization of institutional characteristics on the private sector, mea-sured by Composite. Composite is measured by the first retained PC froman unrotated PCA on the total selection of IPD variables. Unrotated PCAyields only one strong institutional dimension. Composite contains 66% ofthe total variation and loads on all underlying variables.17 The coefficient ofComposite indicates the overall degree to which the institutional character-
public enterprises.16 The first PC (Competition) contains the highest of the total variation and therefore we
expect that this PC is more closely related to the overall dimension of institutional for-malization than Property and Contract. For this reason, the relative contribution of eachinstitutional characteristics is not emphasized.
17 The second PC contains 7% of the variation and the third PC contains 5% of the variation.
Copyright c© 2014 University of Perugia Electronic Press. All rights reserved 12
Farla: Institutions and Financial Deepening
istics are related to financial depth.18 The coefficient of Composite is higherthan the coefficient of Competition, Property and Contract. The effect ofoverall institutional quality on financial deepening appears to be substan-tial. The coefficient of Composite in the AM model, column 4, suggests that,on average, a one standard deviation increase in this variable is associatedwith a 0.71 standard deviation increase in credit to the private sector as apercentage of GDP.19
One concern with data on credit to the private sector is that high levelsof credit may be an indication of excess borrowing and of suboptimal al-location of credit. Especially since 2008, it is undeniable that rapid privatecredit build-up, caused by financial system deregulation and privatization,can have a negative impact on economic growth. Additionally, Arcand et al.(2013) shows that bailouts can cause the financial sector to increase beyondthe socially optimum level. As such, there are limitations to the extent towhich financial deepening is beneficial to growth. This has also been rec-ognized by previous literature, such as Reinhart and Rogoff (2009) Kindle-berger and Aliber (2005), and Minsky (1986). Arcand et al. (2012) find thatfinancial deepening is negatively related to economic growth when the ratioof credit to GDP reaches (roughly) 100%.
For the years 1994-2005, the average ratio of credit to GDP exceeds 100%for the following countries: New Zealand, Portugal, China, Germany, Thai-land, South Africa, United Kingdom, Canada, Malaysia, Switzerland, UnitedStates, and Cyprus. The above mentioned countries are excluded in theanalysis presented in column 5 and 6 of Table 1. By comparing the resultsin column 3, 4, 5, and 6, we can identify the extent to which the estimationsare influenced by countries with high levels of credit to the private sector.
Specifically, the coefficient of Competition is lower in column 5 com-pared to column 3 suggesting that competition institutions is more impor-tant for countries with high levels of credit. One possible explanation is thatcountries that have a relatively small private sector are typically countriesthat have lower credit as a ratio of GDP. And, because in such countries thereis a basic absence of competition there are less incentives to develop rulesto stimulate competition. The coefficient for Property is higher in column5 compared to column 3 suggesting that property rights protection is moreimportant for countries with low or moderate levels of credit. Although thisfinding is somewhat surprising one explanation is that countries with a rel-atively high ratio of credit to GDP invest more in tertiary sectors which areless dependent on property rights protection. The magnitude of the coeffi-cient of Composite is higher in column 3 than in column 5. This suggeststhat, overall, the private sector is less influenced by the formalization of in-
18 The results of the Hausman tests in section 2.2 are confirmed when Competition,Property, and Contract are replaced by Composite.
19 Analysis using FEVD and OLS with PCSE and the composite indicator likewise suggestsa significant and positive relation between institutions and credit deepening.
http://www.rei.unipg.it/rei/article/view/98 13

REVIEW OF ECONOMICS AND INSTITUTIONS, Vol. 5, Issue 2 - Spring-Fall 2014, Article 6
stitutional rules in countries with lower levels of credit.
Table 1 - Regression Results: Dependent Variable Credit
(1) (2) (3) (4) (5) (6)FEVD OLS with PCSE AM� AM� AM� AM�
Competition 0.52*** 0.52*** 0.51** 0.39**(0.00) (0.00) (0.01) (0.01)
Property 0.38*** 0.36*** 0.40* 0.44***(0.00) (0.00) (0.01) (0.00)
Contract 0.39*** 0.35*** 0.39** 0.37**(0.00) (0.00) (0.01) (0.00)
Composite 0.71*** 0.63***(0.00) (0.00)
Language 0.06 0.03** 0.06 0.06 -0.07 -0.05(0.60) (0.00) (0.75) (0.67) (0.66) (0.68)
Ethnic -0.03 -0.00 -0.04 -0.05 -0.11 -0.10(0.81) (0.78) (0.85) (0.74) (0.45) (0.45)
Malaria -0.34** -0.31*** -0.33+ -0.33* -0.17 -0.19(0.01) (0.00) (0.09) (0.03) (0.30) (0.20)
Temperate -0.37** -0.35*** -0.37+ -0.37* -0.25 -0.27+(0.00) (0.00) (0.08) (0.03) (0.13) (0.06)
Religion 0.15+ 0.15*** 0.15 0.16 0.00 0.00(0.07) (0.00) (0.26) (0.14) (0.97) (0.98)
ExternalDebt -0.11*** -0.12** -0.11*** -0.11*** -0.18*** -0.18***(0.00) (0.00) (0.00) (0.00) (0.00) (0.00)
Savings 0.13*** 0.12** 0.13*** 0.13*** 0.21*** 0.20***(0.00) (0.00) (0.00) (0.00) (0.00) (0.00)
Inflation -0.02+ -0.16*** -0.02+ -0.03* -0.04* -0.05*(0.08) (0.00) (0.05) (0.04) (0.02) (0.01)
ExRate -0.01 -0.08*** -0.02 -0.02 -0.03 -0.03(0.62) (0.00) (0.54) (0.49) (0.49) (0.43)
N 972 972 972 972 828 828R2 0.91 0.55Standardized beta coefficients; p-values in parentheses+ p < 0.10, * p < 0.05, ** p < 0.01, *** p < 0.001� exogenous = ExternalDebt, Savings, Inflation, ExchangeRate, Language, Malaria, Ethnic,Temperate, Religion. � endogenous = Competition, Property, Contract, Composite.
3.3 Institutions - Policy Mix
Financial policy is an important tool for states by which they can influ-ence the allocation of credit. Financial policy may have a positive or a nega-tive impact on credit deepening. We control for the effect of financial policyon credit to the private sector using three indicators from Abiad et al. (2010).We use a smaller sample of 61 countries.20 We control for the influence of20 The following countries are excluded because of missing policy data: Benin, Botswana,
Central African Republic, Cyprus, Gabon, Honduras, Kuwait, Libya, Mali, Mongolia,
Copyright c© 2014 University of Perugia Electronic Press. All rights reserved 14

Farla: Institutions and Financial Deepening
the degree of privatization of banks (Privatization, decrease in State owner-ship), for the effect of the degree of bank supervision (Supervision, decreasein independence from executive influence), and for the effect of entry bar-riers in the banking sector (Barriers, decrease in state control over creditallocation). These TV policy indicators are assumed to be endogenous.
High scores on the indicator Privatization indicate relatively more pri-vatized banks. One possibility is that the privatization of banks results inmore lending to the private sector. La Porta et al. (2002) find that countrieswith high government ownership of banks have lower financial develop-ment, productivity and growth.21 Privatization could result in more efficientand effective allocation of credit and privatization could result in highercompetition, increasing borrowing opportunities for organizations. How-ever, Yeyati et al. (2007), using more recent data than that used in the workof La Porta et al. (2002), find some evidence which indicates that there is nosignificant relation between state ownership of banks and credit to the pri-vate sector. Overall, these authors argue that the relationship between stateownership of banks and financial deepening is more complex than was pre-viously outlined by La Porta et al. (2002). Related research by Andrianovaet al. (2008) suggests that, in comparison to government-owned banks, thecost of borrowing is generally higher in privatized banks.22 Also in contrastto the evidence of La Porta et al., Detragiache et al. (2008) find a negative re-lation between state-owned banks and the volume of credit as a proportionof GDP.
High scores on the indicator Supervision represent relatively more gov-ernment intervention of the banking sector. Banking supervision may in-crease transparency. The implementation of prudential regulations can re-strain the allocation of credit into unproductive, high risk projects. In the1980’s, the objective of most high-income countries was financial marketderegulation. Since 2008, deregulation is heavily debated by stakeholderswith the aim to re-gain control over financial safety.
Mauritania, Niger, Panama, Qatar, Saudi Arabia, Sudan, Slovak Republic, Slovenia, Syr-ian Arab Republic, Chad, and Togo. In addition, the following countries are excluded:Austria, Belgium, France, Netherlands, Norway, and Japan. See also footnote 15.
21 Following the political view, La Porta et al. (2002) explain that “government ownershipleads to missallocation of resources” and that “governments are less able to use banksthey own to redistribute wealth to political supporters when they are subject to greateroversight by the electorate. As a consequence they have less interest in owning suchbanks” (La Porta et al., 2002, p. 188,179). As explained by Yeyati et al. (2007, pp. 2010),the political view is contrasted with a development view “which stresses the need forpublic intervention in economies where the scarcity of capital, the general distrust ofthe public, and endemic fraudulent practices amongst debtors may fail to generate thesizable financial sector required to facilitate economic development.”
22 Government-owned banks may select less risky projects to finance. On the basis ofa model of banking Andrianova et al. (2008, p. 230) find that “where private andgovernment-owned banks co-exist, the former will offer a higher interest rate to deposi-tors reflecting the higher risk”.
http://www.rei.unipg.it/rei/article/view/98 15

REVIEW OF ECONOMICS AND INSTITUTIONS, Vol. 5, Issue 2 - Spring-Fall 2014, Article 6
The indicatorBarriers captures the degree of entry restrictions of banks’activities including restrictions on foreign banks and geographic restrictionson operations. High scores on this indicator represent a more liberal bank-ing sector. The relationship between a more liberal banking sector and fi-nancial deepening is ambiguous. One the one hand, it is possible that en-try barriers restrict the lending capacity of the financial sector and driveup the cost of borrowing which in return can cause a lower demand forcredit. Therefore, the liberalization of the banking sector may increase fi-nancial sectors’ aggregate lending capacity. On the other hand, as describedin the work of Detragiache et al. (2008), foreign banks’ presence may crowdout domestic banks resulting in a decrease in aggregate credit. And, on thebasis of a theoretical model and empirical evidence, Detragiache et al. findthat the presence of foreign banks is associated with relatively lower levelsof credit.
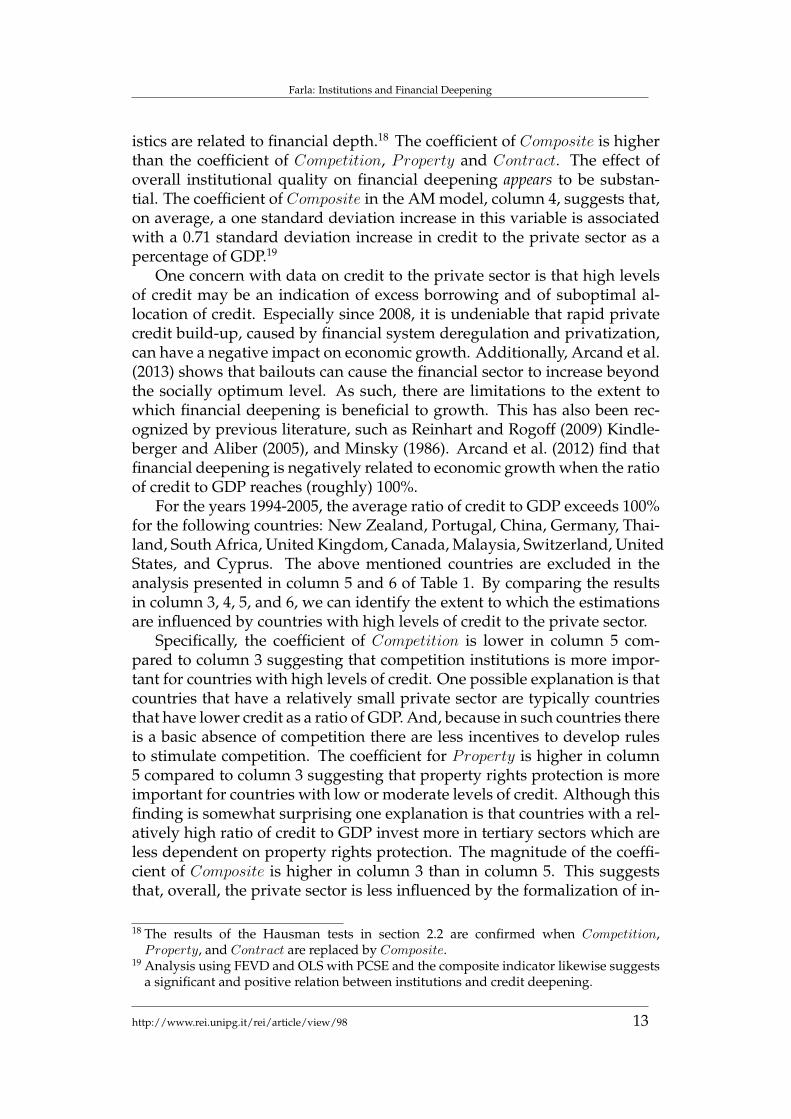
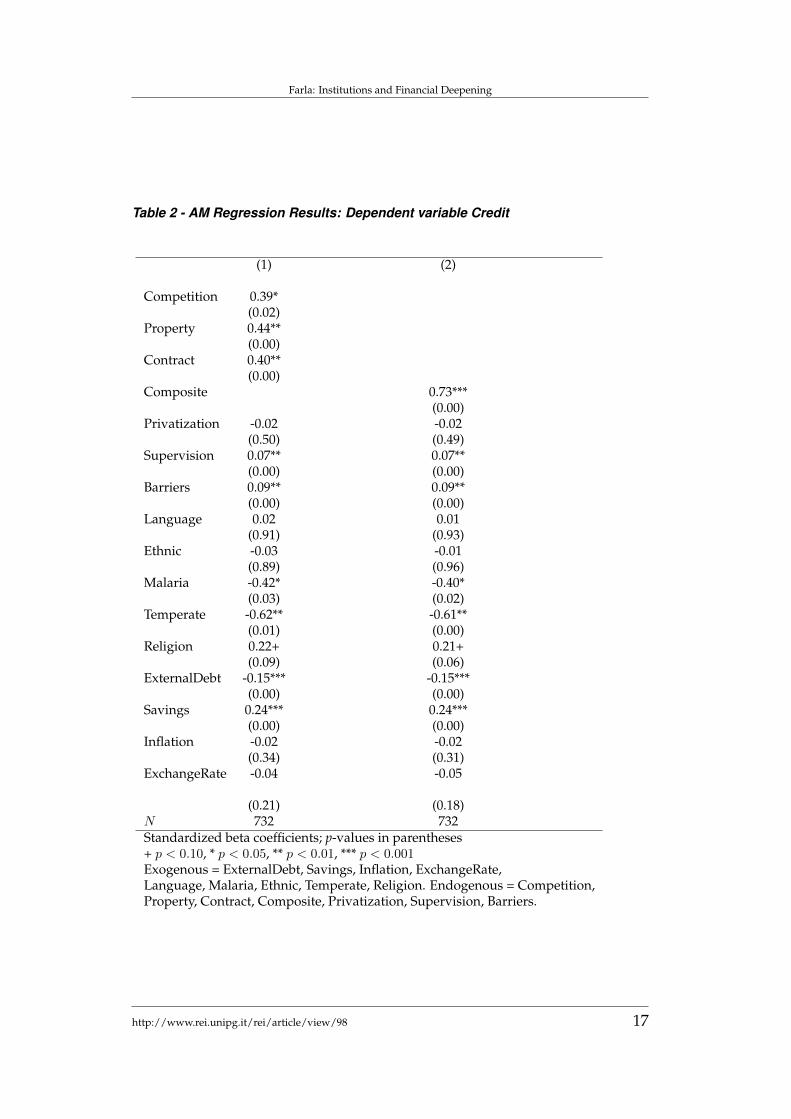
Table 2 reports the regression results that include the policy indicators.Column 1 and 2 report that there is a relation between banking supervi-sion and entry barriers and the ratio of credit to GDP. The coefficients ofSupervision and Barriers are positive, albeit low. The positive coefficientBarriers may suggest that the overall level of credit to the private sectoris higher in countries with fewer restrictions in the banking sector (therebythis interpretation does not support the theory of Detragiache et al. (2008)on the role of foreign banks). Alternatively, one possibility is that fewerrestrictions in the banking sector is associated with small economies (lowGDP). The coefficient for banking privatization is not significant which sup-ports the empirical findings of Yeyati et al. (2007) rather than that of La Portaet al. (2002).
The coefficient of Temperate is significant at a 1% level, and that ofMalaria is significant at a 5% level. The coefficients for Temperate andMalaria are substantially higher in Table 2 than in Table 1. The coefficient ofReligion is significant at a 10% level. On the one hand, when controlling forpolicy, the coefficients of Contract, Property and Composite are higher. Onthe other hand, the coefficient for Competition is lower. The change in thecoefficient of Competition is not surprising because market competition reg-ulations and the types of financial policy discussed above are closely relatedaspects in terms of public sector governance.
3.4 Alternative Dependent Variables
In this section, we present the estimation results using alternative depen-dent variables.23 First, we examine the relation between the institutional
23 As in section 3.3, countries with missing policy data are excluded. See also footnote 20.Data sources are given in the appendix.
Copyright c© 2014 University of Perugia Electronic Press. All rights reserved 16
Farla: Institutions and Financial Deepening
Table 2 - AM Regression Results: Dependent variable Credit
(1) (2)
Competition 0.39*(0.02)
Property 0.44**(0.00)
Contract 0.40**(0.00)
Composite 0.73***(0.00)
Privatization -0.02 -0.02(0.50) (0.49)
Supervision 0.07** 0.07**(0.00) (0.00)
Barriers 0.09** 0.09**(0.00) (0.00)
Language 0.02 0.01(0.91) (0.93)
Ethnic -0.03 -0.01(0.89) (0.96)
Malaria -0.42* -0.40*(0.03) (0.02)
Temperate -0.62** -0.61**(0.01) (0.00)
Religion 0.22+ 0.21+(0.09) (0.06)
ExternalDebt -0.15*** -0.15***(0.00) (0.00)
Savings 0.24*** 0.24***(0.00) (0.00)
Inflation -0.02 -0.02(0.34) (0.31)
ExchangeRate -0.04 -0.05
(0.21) (0.18)N 732 732Standardized beta coefficients; p-values in parentheses+ p < 0.10, * p < 0.05, ** p < 0.01, *** p < 0.001Exogenous = ExternalDebt, Savings, Inflation, ExchangeRate,Language, Malaria, Ethnic, Temperate, Religion. Endogenous = Competition,Property, Contract, Composite, Privatization, Supervision, Barriers.
http://www.rei.unipg.it/rei/article/view/98 17

REVIEW OF ECONOMICS AND INSTITUTIONS, Vol. 5, Issue 2 - Spring-Fall 2014, Article 6
characteristics and the level of domestic bank credit to the private sector(BankCredit).24 Unlike the dependent variable Credit, this indicator doesnot include the volume of credit issued by development banks. The cor-relation between these indicators is 0.97. Second, we test our model usingthe ratio of bank deposits to GDP.25 The correlation between Credit andBankDeposit is 0.85. Third, the model is also estimated using investmentas a share of GDP as the dependent variable (Investment). The correlationbetween Credit and Investment is 0.49.
The estimations results are reported in Table 3. When using BankCreditas the dependent variable the AM method yields coefficients for the insti-tutional indicators that are relatively similar to those presented in Table 2.In column 3 and 4, Property, Contract, and Composite are significantly re-lated to the ratio of bank deposits to GDP, although the magnitude of theestimated effects is lower. The coefficient for Competition is not significant.This suggests that banks’ lending capacity is dependent on the formaliza-tion of property rights and contracting but is unrelated to competition insti-tutions.
The regression results in column 5, with Investment as the dependentvariable, indicate that formal competition institutions has a positive andsignificant relation with the ratio of investment to GDP. Composite is like-wise related to Investment, presumably because of the underlying compe-tition indicator. The coefficients for Property and Contract are not signif-icant. Countries that have substantially higher levels of investment haveimplemented formal competition institutions. Some oil rich countries havestrong property rights protection but have relatively low competition andrelatively lower levels of investment as a percentage of GDP. This could im-ply that the translation of credit deepening into higher levels of investmentrequires the implementation of competition regulations. When using in-vestment as the dependent variable, the coefficients of Temperate are closeto zero whilst the coefficients for ExternalDebt and Savings are high.
24 This regression analysis does not include data for Austria, Belgium, Botswana, France,Japan, Netherlands, and Norway.
25 The countries Austria, Belgium, Bangladesh, China, France, Japan, Libya, Netherlands,and Qatar are excluded from this regression analysis.
Copyright c© 2014 University of Perugia Electronic Press. All rights reserved 18

Farla: Institutions and Financial Deepening
Table 3 - AM Regression Results: Alternative Dependent Variables
(1) (2) (3) (4) (5) (6)BankCredit BankCredit BankDeposit BankDeposit Investment Investment
Competition 0.36* 0.35 0.34*(0.03) (0.11) (0.04)
Property 0.43** 0.53** 0.19(0.00) (0.01) (0.21)
Contract 0.40** 0.39* 0.04(0.01) (0.04) (0.75)
Composite 0.70*** 0.76*** 0.32*(0.00) (0.00) (0.02)
Privatization -0.09** -0.09** -0.04+ -0.04+ 0.09*** 0.09***(0.00) (0.00) (0.08) (0.07) (0.00) (0.00)
Supervision 0.09*** 0.09*** 0.15*** 0.15*** 0.040*** 0.04***(0.00) (0.00) (0.00) (0.00) (0.00) (0.00)
Barriers 0.08** 0.08** 0.07** 0.07** 0.04* 0.04*(0.00) (0.00) (0.00) (0.00) (0.02) (0.02)
Language 0.08 0.07 0.20 0.16 0.05 0.04(0.68) (0.67) (0.39) (0.33) (0.79) (0.73)
Ethnic -0.06 -0.04 -0.08 -0.02 -0.15 -0.17(0.74) (0.80) (0.75) (0.92) (0.42) (0.16)
Malaria -0.49* -0.46* -0.46+ -0.45* -0.21 -0.29*(0.02) (0.01) (0.08) (0.02) (0.29) (0.04)
Temperate -0.62** -0.61** -0.68* -0.67** -0.03 -0.05(0.01) (0.00) (0.02) (0.00) (0.91) (0.76)
Religion 0.20 0.19 -0.02 -0.03 -0.12 -0.09(0.13) (0.12) (0.91) (0.81) (0.37) (0.33)
ExternalDebt -0.07* -0.07* 0.05 0.04 -0.71*** -0.71***(0.02) (0.02) (0.11) (0.14) (0.00) (0.00)
Savings 0.13** 0.13** -0.01 -0.01 0.66*** 0.67***(0.00) (0.00) (0.75) (0.81) (0.00) (0.00)
Inflation -0.00 -0.003 -0.02 -0.02 -0.00 -0.00(0.86) (0.83) (0.24) (0.20) (0.96) (0.95)
ExchangeRate -0.04 -0.04 -0.03 -0.03 -0.10*** -0.10***(0.18) (0.16) (0.32) (0.28) (0.00) (0.00)
N 732 732 720 720 804 804Standardized beta coefficients; p-values in parentheses+ p < 0.10, * p < 0.05, ** p < 0.01, *** p < 0.001Exogenous = ExternalDebt, Savings, Inflation, ExchangeRate, Language, Malaria, Ethnic,Temperate, Religion. Endogenous = Competition, Property, Contract, Composite,Privatization, Supervision, Barriers.
In contrast to the estimation results with Credit as the dependent vari-ables, the estimations in Table 3 report that the policy indicators all havea significant coefficient. The models in column 1 to 4 suggest that privati-zation of the banking sector has a negative relation with the ratio of bankdeposits to GDP and with the ratio of bank credit to the private sector toGDP. This finding is in line with that of Detragiache et al. (2008). Based onthe results reported in column 5 and 6—with Investment as the dependentvariable—we conclude that the privatization of banks is associated withhigh levels of investment as a proportion of GDP, albeit the magnitude ofthe effect is relatively small.
http://www.rei.unipg.it/rei/article/view/98 19

REVIEW OF ECONOMICS AND INSTITUTIONS, Vol. 5, Issue 2 - Spring-Fall 2014, Article 6
Table 4 - Robustness Tests. AM Regression Results: Dependent Variable Credit
Models with lags Models with smoothed averages(1) (2) (3) (4) (5) (6) (7) (8)
Competition 0.49** 0.40* 0.54** 0.35+(0.01) (0.02) (0.00) (0.06)
Property 0.38* 0.46** 0.36* 0.57***(0.01) (0.00) (0.02) (0.00)
Contract 0.37* 0.39** 0.50*** 0.45**(0.01) (0.01) (0.00) (0.00)
Composite 0.68*** 0.74*** 0.77*** 0.82***(0.00) (0.00) (0.00) (0.00)
Privatization -0.01 -0.01 0.02 0.02(0.86) (0.85) (0.66) (0.64)
Supervision 0.06* 0.06** 0.04 0.05(0.01) (0.01) (0.21) (0.20)
Barriers 0.08** 0.08* 0.07 0.07(0.01) (0.01) (0.13) (0.15)
Language 0.06 0.06 0.02 0.01 0.02 0.03 -0.02 -0.04(0.73) (0.65) (0.92) (0.97) (0.90) (0.84) (0.91) (0.81)
Ethnic -0.04 -0.05 -0.03 -0.00 0.02 -0.01 -0.03 0.03(0.83) (0.71) (0.88) (0.99) (0.89) (0.93) (0.88) (0.85)
Malaria -0.33+ -0.33* -0.40+ -0.39* -0.30+ -0.28+ -0.34+ -0.32(0.08) (0.03) (0.05) (0.03) (0.07) (0.09) (0.10) (0.11)
Temperate -0.35+ -0.34* -0.60** -0.60** -0.35+ -0.34+ -0.59** -0.57*(0.10) (0.03) (0.01) (0.00) (0.06) (0.06) (0.01) (0.01)
Religion 0.16 0.16 0.21 0.21+ 0.14 0.14 0.20 0.18(0.24) (0.12) (0.11) (0.08) (0.22) (0.22) (0.12) (0.16)
ExternalDebt -0.13*** -0.13*** -0.19*** -0.19*** -0.26*** -0.26*** -0.35*** -0.36***(0.00) (0.00) (0.00) (0.00) (0.00) (0.00) (0.00) (0.00)
Savings 0.16*** 0.16*** 0.29*** 0.29*** 0.29*** 0.29*** 0.49*** 0.47***(0.00) (0.00) (0.00) (0.00) (0.00) (0.00) (0.00) (0.00)
Inflation -0.03* -0.03** -0.03 -0.03 -0.04* -0.04* -0.03 -0.04(0.01) (0.01) (0.11) (0.10) (0.02) (0.02) (0.20) (0.16)
ExchangeRate -0.01 -0.01 -0.03 -0.04 -0.01 -0.02 -0.04 -0.04(0.69) (0.63) (0.33) (0.30) (0.72) (0.65) (0.37) (0.35)
N 891 891 671 671 648 648 488 488Standardized beta coefficients; p-values in parentheses+ p < 0.10, * p < 0.05, ** p < 0.01, *** p < 0.001Exogenous = ExternalDebt, Savings, Inflation, ExchangeRate, Language, Malaria, Ethnic,Temperate, Religion. Endogenous = Competition, Property, Contract, Composite.
Copyright c© 2014 University of Perugia Electronic Press. All rights reserved 20

Farla: Institutions and Financial Deepening
Overall, both the formalization of institutional characteristics and finan-cial policy are important for countries’ financial market. Nevertheless, thedifferences across the models support the thesis that the development offormal institutions is a stage by stage process.
3.5 Robustness
The dynamics are further explored by lagging the TV macroeconomicand policy variables by one year. The importance of substituting a currentvalue with a one year lag may be relevant for the estimation of some coun-tries. The regulatory processes to obtain credit may be relatively slower incountries that have relatively low levels of credit. The estimation resultswith the lagged variables are reported in Table 4 column 1, 2, 3, and 4. Theestimations for the institutional indicators are positive and significant; sev-eral coefficients of institutional indicators are lower than the coefficients ofinstitutional indicators presented in Table 1 and Table 2. In addition, wesmooth the TV data into five year average levels and growth rates. Currentvalues are substituted for the average of the observations in the current yearand for those in the previous four years. The results are presented in Table 4column 5, 6, 7, and 8. The institutional variables remain positive and signif-icant. However, the policy indicators are not significant. This supports thethesis that financial policy only has an effect on short term macroeconomicchanges.
4 Conclusion
The results of this study only partially confirm those of Acemoglu andJohnson (2005). Following these authors’ conclusive argument, propertyrights institutions are related to countries’ level of credit to the private sec-tor. However, the authors find that contracting institutions do not matterfor credit deepening. Our findings are in line with the conclusions drawnby La Porta et al. (2000) who argue that creditor rights, which protect in-vestors from expropriation, encourages financial development. We find em-pirical evidence that suggests a strong positive relationship between creditdeepening and the development of formal property rights, contracting, andcompetition institutions. Our results also suggest that only property rightsand contracting institutions are related to banks’ lending capacity, and thatonly competition institutions are positively related to investment. Based ona broader indicator of institutional development we conclude that the de-velopment of formal institutions is positively related to financial deepeningand to the ratio of investment to GDP.
The financial sector is an important intermediating factor in the institu-tions - growth relationship. Before the crisis, formal institutional rules weregenerally described as beneficial because of their association with high vol-
http://www.rei.unipg.it/rei/article/view/98 21

REVIEW OF ECONOMICS AND INSTITUTIONS, Vol. 5, Issue 2 - Spring-Fall 2014, Article 6
umes of credit. Since the crisis, more focus is on understanding the extentto which credit deepening is beneficial for economic growth. We emphasizethat a lack of credit to the private sector is expected to form an obstacle togrowth and development.
This study documents why institutional characteristics are difficult tomeasure. On the one hand, composite institutions / governance indicatorsas well as broad institutional surveys can not be used to assess a country’sperformance on specific institutional aspects. On the other hand, specific in-stitutional aspects are closely related amongst each other and are closely re-lated to composite indicators. Therefore, we estimate the relation of closelyrelated institutional characteristics by constructing orthogonal institutionalindicators. Policymakers need to be careful when assessing a country’s in-stitutional development. Because of the interrelatedness of the institutionalcharacteristics, institutions may be best documented on the basis of a moregeneral institutional dimension.
This study would benefit from further analysis on the relation betweeninstitutional characteristics, credit markets, investment, and growth. Ad-ditional questions that arise include: Under what institutional conditionsdoes credit deepening have a positive effect on growth? What is the effectof institutional formalization on informal lending?
Copyright c© 2014 University of Perugia Electronic Press. All rights reserved 22

Farla: Institutions and Financial Deepening
References
Abiad, A., Detragiache, E., Tressel, T., 2010. A New Database of FinancialReforms. IMF Staff Papers 57, 281-302. doi:10.1057/imfsp.2009.23
Acemoglu, D., Johnson, S., 2005. Unbundling institutions. Journal of Politi-cal Economy 113, 949-995. doi:10.1086/432166
Acemoglu, D., Johnson, S., Robinson, J.A., 2001. The Colonial Origins ofComparative Development: An Empirical Investigation. American Eco-nomic Review 91. 1369-1401. doi:10.1257/aer.91.5.1369
Albouy, Y.D., 2012. The Colonial Origins of Comparative Development: AnEmpirical Investigation: Comment. American Economic Review 102, 3059-3076. doi:10.1257/aer.102.6.3059
Alesina, A., Devleeschauwer, A., Easterly, W., Kurlat, S., Wacziarg,R., 2003. Fractionalization. Journal of Economic Growth 8, 155-94.doi:10.1023/A:1024471506938
Amemiya, T., MaCurdy, T.E., 1986. Instrumental-Variable Estimation of anError-Components Model. Econometrica 54, 869-80. doi:10.2307/1912840
Andrianova, S., Demetriades, P.O., Shortland, A.K., 2008. GovernmentOwnership of Banks, Institutions, and Financial Development. Journal ofDevelopment Economics 85, 218-252. doi:10.1016/j.jdeveco.2006.08.002
Arcand, J.L., Berkes, E., Panizza, U., 2013. Finance and Economic Develop-ment in a Model with Credit Rationing? Graduate Institute of Internationaland Development Studies Working Paper, 02/2013.
Arcand, J.L., Berkes, E., Panizza, U., 2012. Too much Finance? IMF WorkingPaper, 12.
Bae, K., Goyal, V.K., 2009. Creditor Rights, Enforcement, and Bank Loans.Journal of Finance 64, 823-860. doi:10.1111/j.1540-6261.2009.01450.x
Beck, N. Katz, J.N., 1995. What To Do (and Not To Do) with Time-SeriesCross-Section Data. The American Political Science Review 89, 634-647.doi:10.2307/2082979
Beck, T., Demirguc-Kunt, A., Levine, R., 2009. Financial Institutions andMarkets Across Countries and Over Time-Data and Analysis. Policy Re-search Working Paper Series 4943, The World Bank, May 2009.
Breusch, T., Ward, M.B., Hoa, T.N., Kompas, T., 2011. FEVD: Just IV or JustMistaken? Political Analysis 19, 123-134. doi:10.1093/pan/mpq026
http://www.rei.unipg.it/rei/article/view/98 23

REVIEW OF ECONOMICS AND INSTITUTIONS, Vol. 5, Issue 2 - Spring-Fall 2014, Article 6
Chatelain, J., Ralf, K., 2010. Inference on Time-Invariant Variables UsingPanel Data: A Pre-Test Estimator with an Application to the Returns toSchooling. Pse working papers, HAL.
De Crombrugghe, D., 2010. Unity in Diversity: Studies on Micro and MacroPanel Data Sets. PhD thesis, Maastricht Univeristy. Chapter 6.
Detragiache, E., Tressel, T., Gupta, P., 2008. Foreign Banks in Poor Countries:Theory and Evidence. Journal of Financial Economics LXIII, 2160-2123.
Djankov, S., McLiesh, C., Shleifer, A., 2007. Private Credit in129 Countries. Journal of Financial Economics 84, 299-329.doi:10.1016/j.jfineco.2006.03.004
Engerman, S.L., Sokoloffm K.L., 1997. Factor Endowments, Institutions andDifferential Paths of Growth Among New World Economies. In Calif. Stan-ford (Ed.), How America Fell Behind, Stanford Univeristy press. pp. 260-304.
Gallup, J.L., Mellinger, A.D., Sachs, J.D., 2001. Geography Datasets, Centerfor International Development.
Gilchrist, S., Sim, J.M., Zakrajsek, E., 2013. Missallocation and FinancialMarket Frictions: Some Direct Evidence from the Dispersion in Borrow-ing Costs. Review of Economic Dynamics 16, 159-176.
Glaeser, E.L., La Porta, R., Lopez-de Silanes, F., Shleifer, A., 2004. DoInstitutions Cause Growth? Journal of Economic Growth 9, 271-303.doi:10.1023/B:JOEG.0000038933.16398.ed
Greene, W., 2011. Fixed Effects Vector Decomposition: A Magical Solution tothe Problem of Time Invariant Variables in Fixed Effects Models? PoliticalAnalysis 19, 135-406. doi:10.1093/pan/mpq034
Greenwood, J., Sanchez, J.M., and Wang, C., 2013. Quantifying the Impact ofFinancial Development on Economic Development. Review of EconomicAnalysis 16, 194-215.
Greenwood, J., Sanchez, J.M., and Wang, C., 2010. Financing Development:the Role of Information Costs. American Economic Review 100, 1975-1891.doi:10.1257/aer.100.4.1875
Greif, A., Tabellini, G., 2010. Cultural and Institutional Bifurcation:China and Europe Compared. American Economic Review 100, 135-40.doi:10.1257/aer.100.2.135
Hasan, I., Wachtel, P., Zhou, M., 2009. Institutional Development, FinancialDeepening and Economic Growth: Evidence from China. Journal of Bank-ing & Finance 33, 157-170. doi:10.1016/j.jbankfin.2007.11.016
Copyright c© 2014 University of Perugia Electronic Press. All rights reserved 24

Farla: Institutions and Financial Deepening
Hausman, J.A., Taylor, W.E., 1981. Panel Data and Unobservable IndividualEffects. Econometrica 49, 1377-1398. doi:10.2307/1911406
Heston, A., Summers, R., Aten, B., 2009. Penn World Table 6.3 .
IPD, 2009. Institutional Profiles Database.
Jeong, H., Townsend, R.M., 2007. Sources of TFP Growth: OccupationalChoice and Financial Deepening. Economic Theory 32, 179-221.
Kindleberger, C.P., Aliber, R., 2005. Manias, Panics, and Crashes: A Historyof Financial Crises. Wiley, 5th edition. doi:10.1057/9780230628045
La Porta, R., Lopez-de Silanes, F., Shleifer, A., Vishny, R., 2000. Investor Pro-tection: Origins, Consequences, Reform. The World Bank. Financial SectorDiscussion Paper No.1.
La Porta, R., Lopez-de Silanes, F., Shleifer, A., 2002. Government Ownershipof Banks. Journal of Finance 57, 265-301. doi:10.1111/1540-6261.00422
Levine, R., 2005. Law, Endowments and Property Rights. Journal of Eco-nomic Perspectives 19, 61-88. doi:10.1257/089533005774357842
Marshall, M.G., Jaggers, K., 2009. Polity IV Project. Center for Global Policyand School of Public Policy and George Mason University and Center forSystemic Peace. Dataset Users’ Manual.
Minsky., H.P., 1986. Stabilizing an Unstable Economy. Yale University Press.
Plumper, T., Troeger, V.E., 2011. Fixed-Effects Vector Decomposition:Properties, Reliability, and Instruments. Political Analysis 19, 147-164.doi:10.1093/pan/mpr008
Quintyn, M., Verdier, G., 2010. ”Mother, Can I Trust the Government?” Sus-tained Financial Deepening - A Political Institutions View. IMF WorkingPaper 210.
Reinhart, C.M., Rogoff, K., 2009. This Time Is Different: Eight Centuries ofFinancial Folly. Princeton University Press.
Spolaore, E., Wacziarg, R., 2013. How Deep are the Roots of Eco-nomic Decelopment? Journal of Economic Literature 52, 325-369.doi:10.1257/jel.51.2.325
Tchakoute-Tchuigoa, H., 2012. Active Risk Management and Loan ContractTerms: Evidence from Rated Microfinance Institutions. The Quarterly Re-view of Economics and Finance 52, 427-437.
http://www.rei.unipg.it/rei/article/view/98 25

REVIEW OF ECONOMICS AND INSTITUTIONS, Vol. 5, Issue 2 - Spring-Fall 2014, Article 6
Tressel, T., Detragiache, E., 2008. Do Financial Sector Reforms Lead to Fi-nancial Development? Evidence from a New Dataset. IMF Working Paper265.
UNCTAD, 2007. Model Law on Competition. Technical report, United Na-tions.
World Bank, 2011. World Development Indicators.
Yeyati, E.L., Micco, M., Panizza, U., Detragiache, D., Repetto, A. 2007. AReappraisal of State-Owned Banks. Economia 7, 209-259.
Copyright c© 2014 University of Perugia Electronic Press. All rights reserved 26

Farla: Institutions and Financial Deepening
Appendix
A Countries
Table 5 - Country List
Code Country Code Country Code CountryARG Argentina GHA Ghana PAK PakistanAUS Australia GRC Greece PAN PanamaBEN Benin GTM Guatemala PER PeruBFA Burkina Faso HND Honduras PHL PhilippinesBGD Bangladesh HUN Hungary POL PolandBOL Bolivia IND India PRT PortugalBWA Botswana IRL Ireland QAT QatarCAF Central African
RepublicISR Israel ROM Romania
CAN Canada ITA Italy RUS RussiaCHE Switzerland JOR Jordan SAU Saudi ArabiaCHN China KEN Kenya SDN SudanCIV Cote d’Ivoire KOR Korea, Rep. SEN SenegalCMR Cameroon KWT Kuwait SVK Slovak RepublicCOL Colombia LBY Libya SVN SloveniaCYP Cyprus LKA Sri Lanka SWE SwedenCZE Czech Republic LTU Lithuania SYR SyriaDEU Germany LVA Latvia TCD ChadDNK Denmark MAR Morocco TGO TogoDOM Dominican Re-
publicMDG Madagascar THA Thailand
DZA Algeria MEX Mexico TUN TunisiaECU Ecuador MLI Mali TUR TurkeyEGY Egypt MNG Mongolia TZA TanzaniaESP Spain MOZ Mozambique UGA UgandaEST Estonia MYS Malaysia URY UruguayFIN Finland NER Niger USA United StatesGAB Gabon NPL Nepal VEN VenezuelaGBR United Kingdom NZL New Zealand ZAF South Africa
http://www.rei.unipg.it/rei/article/view/98 27

REVIEW OF ECONOMICS AND INSTITUTIONS, Vol. 5, Issue 2 - Spring-Fall 2014, Article 6
B Data Sources
Credit: Domestic credit to private sector (World Bank, 2011) % of GDP.BankCredit: Domestic credit provided by banking sector (World Bank, 2011)% of GDP.BankDeposit: Deposits of deposit monetary institutions (Beck et al., 2009)% of GDP.Investment: Investment, Current Price National Accounts at PPPs (Hestonet al., 2009) % of GDP.Property, Contract, Competition, Composite: Institutional indicators (IPD,2009) Indicators are normalized on a scale of 0 = low formalization of rulesto 1 = high formalization of rules. Original data ranges from 0-4 and 1-4.Supervision: Prudential regulations and supervision of the banking sector((Abiad et al., 2010) From 0 = unregulated, to 3 = regulated.Privatization: State ownership in the banking sector (Abiad et al., 2010)From 0 = repressed, to 3 = liberalized.Barriers: Entry barriers in the banking sector (Abiad et al., 2010) From 0 =repressed to 3 = liberalized.Inflation: Rate of change in the consumer price index (World Bank, 2011)% change.Savings: Gross domestic savings (World Bank, 2011) % of GDP.ExternalDebt: External balance on goods and services (World Bank, 2011)% of GDP.ExchangeRate: Exchange rate (Heston et al., 2009) US = 1.Malaria: Population at risk of malaria transmission in 1994 World HealthOrganization 1997 / (Glaeser et al., 2004) Probability of 0 = no malaria riskto 1 = high malaria risk.Temperate: Population in Koeppen-Geiger Climatic zone in 1995 (Gallupet al., 2001) % of population.Religion: Religious fractionalization (Alesina et al., 2003) Probability of 0 =homogenous to 1 = fractionalized society.Ethnic: Ethnic fractionalization (Alesina et al., 2003) Probability of 0 = ho-mogenous to 1 = fractionalized society.Language: Linguistic fractionalization (Alesina et al., 2003) Probability of 0= homogenous to 1 = fractionalized society.
Copyright c© 2014 University of Perugia Electronic Press. All rights reserved 28