Institutional Presentation 1H10 - RI Mobileir.bmfbovespa.com.br/enu/3502/Institutional Presentation...
40
Institutional Presentation First Half of 2010 Institutional Presentation
Transcript of Institutional Presentation 1H10 - RI Mobileir.bmfbovespa.com.br/enu/3502/Institutional Presentation...

Institutional Presentation
First Half of 2010
Institutional Presentation
1. CETIP’s Investment Highlights
2. New Initiatives
3. CETIP’s Financial Highlights
Index
2
3. CETIP’s Financial Highlights
4. Appendix

1. CETIP’s Investment Highlights
3

Dominant position in a rapidly expanding market
Diversified and vertically integrated model
CETIP is the largest registration, depository and trading platform of fixed income and
OTC derivatives in Latin America
CETIP’s Highlights
Strong
Position
Business
4
Diversified and vertically integrated model
Superior growth profile
Experienced management team and high standards of governance
Resilient and predictable cash generative business with low execution risk
Business
Model
Growth
Profile
Management
Resilience
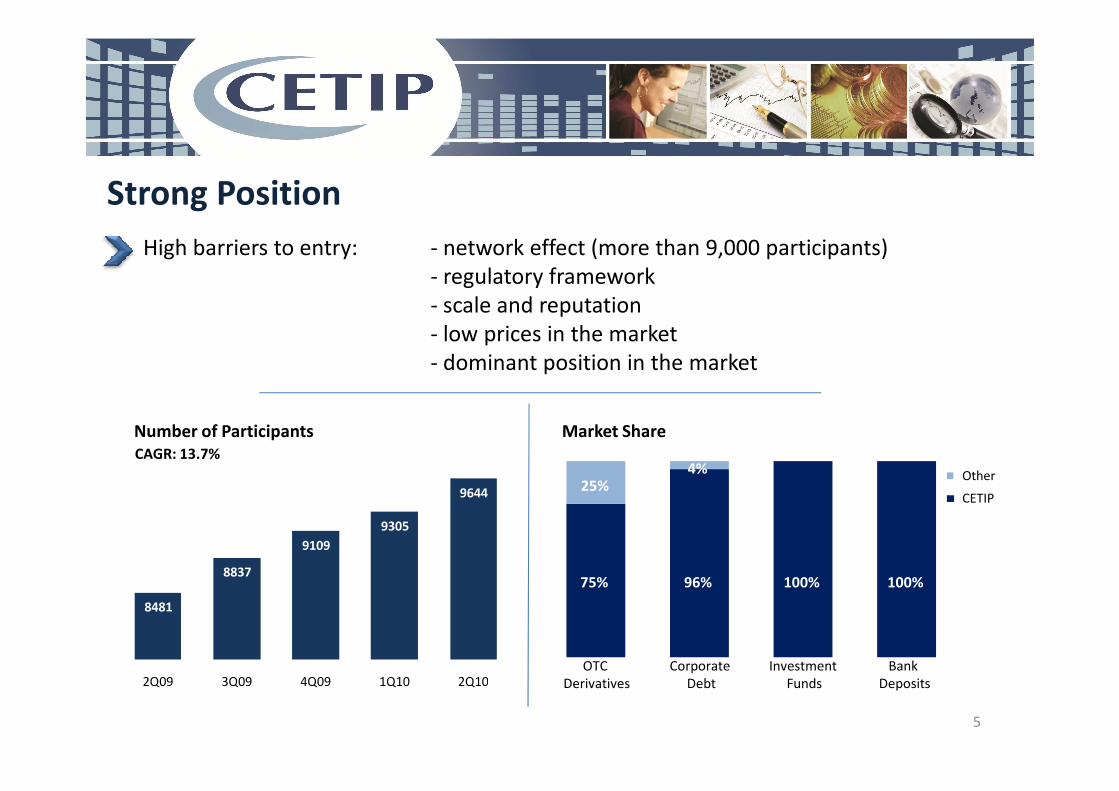
High barriers to entry: - network effect (more than 9,000 participants)
- regulatory framework
- scale and reputation
- low prices in the market
- dominant position in the market
Strong Position
8481
8837
9109
9305
9644
2Q09 3Q09 4Q09 1Q10 2Q10
5
Number of Participants
CAGR: 13.7%
75% 96% 100% 100%
25%4%
OTC
Derivatives
Corporate
Debt
Investment
Funds
Bank
Deposits
CETIP
Other
Market Share

Registration - Fixed income instruments
Financial Institutions
- CDs, IDs, others
- Loans participants (CCBs)
- Real estate financing (CCI, LCI, others)
- Agribusiness financing (LCA, CCA, others)
- Export financing
- Others
Corporations
- Corporate Bonds, Debentures, Commercial
Custody Transactions
Business ModelWe derive our revenues from acting as a registration,
custodian/depository and settlement agent for all securities under our
care, with over 50 asset classes, primarily in fixed income, such as
interbank and time deposits, corporate bonds, some specialty
government bonds, mutual funds, and finally over the counter
derivatives.
6
- Corporate Bonds, Debentures, Commercial
Papers
- OTC DerivativesCustody- Debentures
- Quota of Funds
- Other assets held in custody
Transactions (custody services)- Management of Corporate
Events
Monthly
Utilization- Connectivity Fee26%*
22%* 14%*25%*
(*) % of revenue (2Q10)
Others- CIP services
13%*

Vertically Integrated Model
Business ModelDiversified Revenue Drivers
Registration
Fixed Income Volume %/volume R$
OTC Derivatives Quantity R$/contract
Custody
Debentures Average Volume %/volume R$
Quota of Funds Average Volume %/volume R$
Registration
Matching
Confirmation
Risk ManagementElectronic
7
Vertical integration driven by regulatory zeal
Rest of the world heading this way
Quota of Funds Average Volume %/volume R$
End Users Quantity R$/customer
Transactions Quantity R$/transaction
Monthly Utilization Quantity R$/customer/scale
Others Quantity R$/fund transfer
Risk Management
Collateral
Management
SettlementDepository/
Custody
Electronic
Trading
CETIPNet
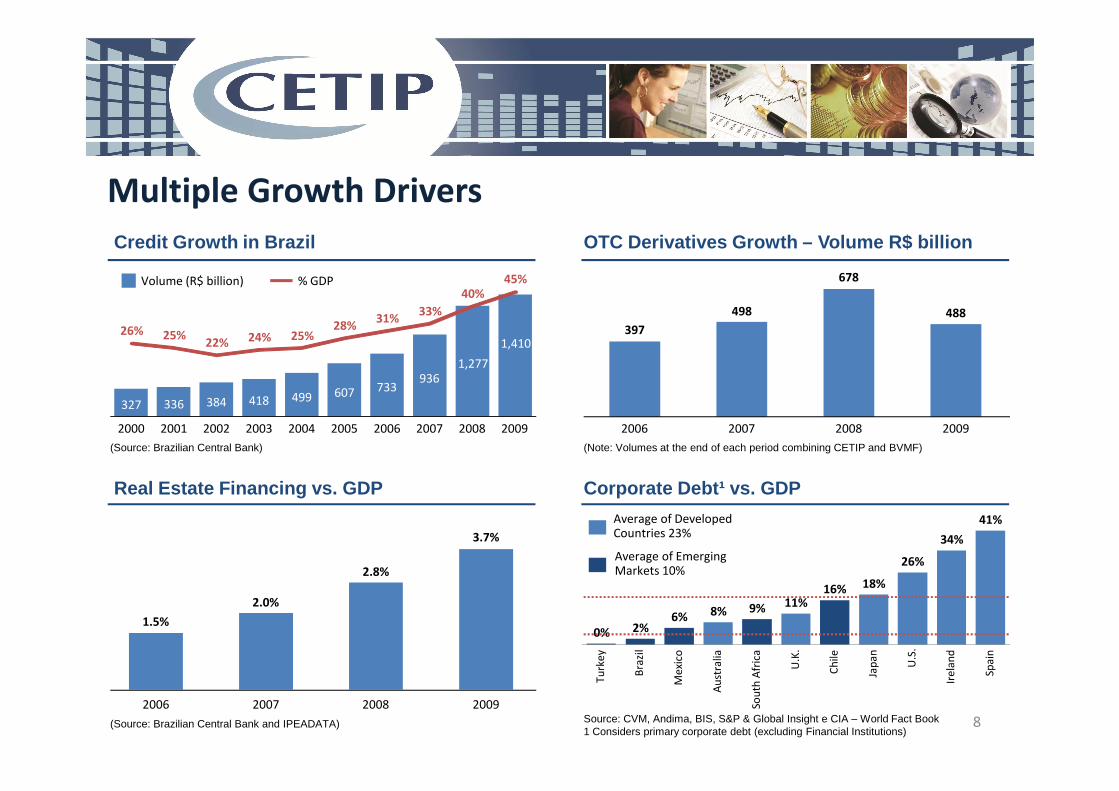
384 418 499 607 733936
1,277
1,41026% 25%
22% 24% 25%28%
31%33%
40%45%
Multiple Growth Drivers
Credit Growth in Brazil OTC Derivatives Growth – Volume R$ billion
397
498
678
488
Volume (R$ billion) % GDP
327 336 384 418 499 607
2000 2001 2002 2003 2004 2005 2006 2007 2008 2009
(Note: Volumes at the end of each period combining CETIP and BVMF)(Source: Brazilian Central Bank)
(Source: Brazilian Central Bank and IPEADATA)
Average of Developed Countries 23%
Average of Emerging Markets 10%
Source: CVM, Andima, BIS, S&P & Global Insight e CIA – World Fact Book1 Considers primary corporate debt (excluding Financial Institutions)
8
Real Estate Financing vs. GDP Corporate Debt¹ vs. GDP
2006 2007 2008 2009
1.5%
2.0%
2.8%
3.7%
2006 2007 2008 2009
0% 2%6% 8% 9% 11%
16% 18%
26%
34%
41%
Tu
rke
y
Bra
zil
Me
xico
Au
stra
lia
Sou
th A
fric
a
U.K
.
Ch
ile
Jap
an
U.S
.
Ire
lan
d
Spa
in

18.3
45.1
Growth DriversAnnual Volume of OTC DerivativesTrading per Country ¹
Benefits from Multiple Growth Drivers – OTC Derivatives
• Increased usage of fixed rate debt
• Lengthening of tenors
Multiple of Country’s GDP
9
0.4
2.81.6
4.15.1
7.0
13.2 13.6 14.0
18.3
Bra
zil'
07
Bra
zil '
12
Tur
key
Mex
ico
Spa
in
Italy
Ger
man
y
Japa
n
S.A
fric
a
US
A
Aus
tral
ia
• Lengthening of tenors
• Progressive regulatory environment
• Increased variety of underlying assets and sophistication of managers and investors
• Development of collaterization and tools for fair value calculation
Source: BIS, Global Insight, Oliver Wyman analysis1 Volumes for other countries in 2007
Emerging markets average 5x
Developed countries average 17x
Volume CAGR
07-12E: 60%

Raising demand for Real Estate Sector Funding
35
53
83
117
25
38
62
3553
83
117
150
188
215
254
Net Savings vs. Real Estate Sector Funding Savings Balance vs. Real Estate Sector Funding(Source: Brazilian Central Bank and ABECIP)(In R$ billion)
Real estate sector funding Net savings Real estate sector funding Savings balance
(Source: Brazilian Central Bank and ABECIP)(In R$ billion)
10
-2
Dec/06 Dec/07 Dec/08 Dec/09
35
Dec/06 Dec/07 Dec/08 Dec/09
2.22.9
7.2
10.6
2.012.64
8.29
12.7
Dec/06 Dec/07 Dec/08 Dec/09
CRI CCI
Dec/06 Dec/07 Dec/08 Dec/09
Savings Accounts LCI/LH CRI
CRI & CCI Volumes Sources of Funding Real Estate Sector(Source: CETIP. Volumes at the end of each period)(In R$ billion)
(Source: Brazilian Central Bank , ABECIP and CETIP )(In R$ billion)
CRI CCI
Real Estate sector is funded, essentially, by savings accounts. Net amount of funds outstanding in
savings accounts is growing less than the Real Estate funding demand.

In 2009 CETIP committed to the highest corporate governance standards with the Novo
Mercado listing
CETIP is created
as a non-for-
profit
Agreement with
ANDIMA to
Advent becomes
a shareholder
with 32% stake
Novo Mercado
Listing
One class of shares
with voting rights
Experience and Corporate Governance
11
CETIP starts its
operations
profit
organization
1984 1986
ANDIMA to
operate SND
1988
Demutualization
process, creating
CETIP SA
2008
with 32% stake
2009 2009
with voting rights
CTIP3

Corporate GovernanceMain ExecutivesYears in Financial
Industry
Francisco Carlos Gomes (CFO)
Former CFO of Bovespa, created CBLC+ 33 years
Luiz Fernando Vendramini Fleury (CEO)
Former CEO of IBI / Redecard+ 19 years
-
Boards
Shareholders
Self Regulation
BoardBoard of Directors
Experience and Corporate Governance
12
Management
CommitteePricing Committee
Self Regulation
OfficerCEO
Former CFO of Bovespa, created CBLC
Carlos Eduardo Ratto Pereira (Commercial Director
and Product Development Director)
Formerly at BankBoston, Bank of America, Banco
Itaú and HSBC Bank
+ 17 years
Maurício Rebouças dos Santos (CTO)
Formerly at Mercabolsa (Portugal), ANDIMA (Selic
manager)
+ 24 years
Wagner Anacleto (COO)
Formerly at BM&FBovespa and CBLC+ 29 years
-
Committees
Executive
Bodies
BoardBoard of Directors
Compensation
Committee
Nominations
Committee
CFO and
Investor
Relations
Commercial and
Product
Development
Chief
Operations
Officer
Chief
Technology
Officer
Carlos Menezes (Self regulation Director)
Formerly at Unibanco and BPN Brasil Bank+ 27 years
2. New Initiatives
13
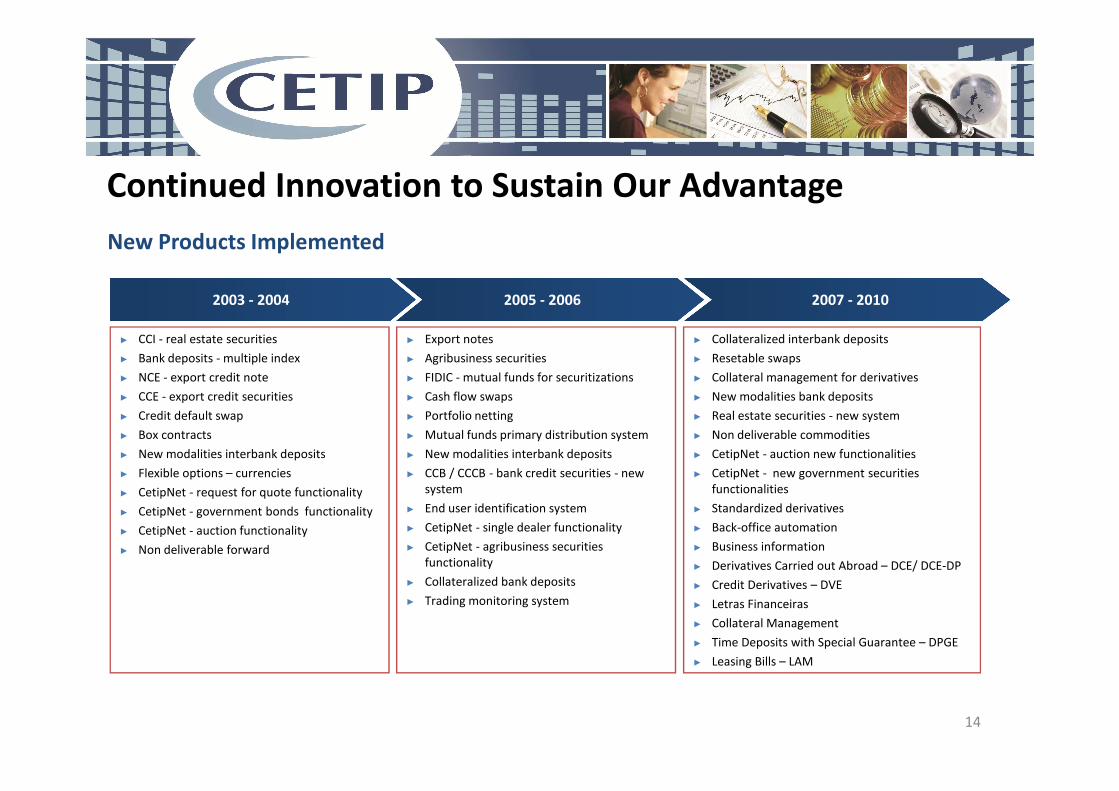
New Products Implemented
2003 - 2004 2005 - 2006 2007 - 2010
► CCI - real estate securities
► Bank deposits - multiple index
► NCE - export credit note
► CCE - export credit securities
► Export notes
► Agribusiness securities
► FIDIC - mutual funds for securitizations
► Cash flow swaps
► Collateralized interbank deposits
► Resetable swaps
► Collateral management for derivatives
► New modalities bank deposits
Continued Innovation to Sustain Our Advantage
► CCE - export credit securities
► Credit default swap
► Box contracts
► New modalities interbank deposits
► Flexible options – currencies
► CetipNet - request for quote functionality
► CetipNet - government bonds functionality
► CetipNet - auction functionality
► Non deliverable forward
► Cash flow swaps
► Portfolio netting
► Mutual funds primary distribution system
► New modalities interbank deposits
► CCB / CCCB - bank credit securities - new
system
► End user identification system
► CetipNet - single dealer functionality
► CetipNet - agribusiness securities
functionality
► Collateralized bank deposits
► Trading monitoring system
► New modalities bank deposits
► Real estate securities - new system
► Non deliverable commodities
► CetipNet - auction new functionalities
► CetipNet - new government securities
functionalities
► Standardized derivatives
► Back-office automation
► Business information
► Derivatives Carried out Abroad – DCE/ DCE-DP
► Credit Derivatives – DVE
► Letras Financeiras
► Collateral Management
► Time Deposits with Special Guarantee – DPGE
► Leasing Bills – LAM
14

2011e
... Q2 Q3 Q4 Q1 ...
Off-shore Derivatives
Equity Derivatives
2010e
Registration of Derivatives Carried out Abroad
2010e New Products
Equity Derivatives
Collateral Management
Bank Assets
Agreement with Clearstream to jointly
develop, promote and distribute collateral
management service for OTC Derivatives
Improvement of the Stock Options registration
procedure and implementation of Stock
Contracts without physical delivery
Implementation of registration module to
Certificados de Operações Estruturadas (COE)
15
(Pending on Brazilian Central Bank regulation)

Collateral Management
CETIP plans to develop a comprehensive collateral
New Initiatives
16
CETIP plans to develop a comprehensive collateral
management functionality to support OTC Derivatives as well
as to help Brazilian banks reduce their capital requirements
and improve process efficiency.
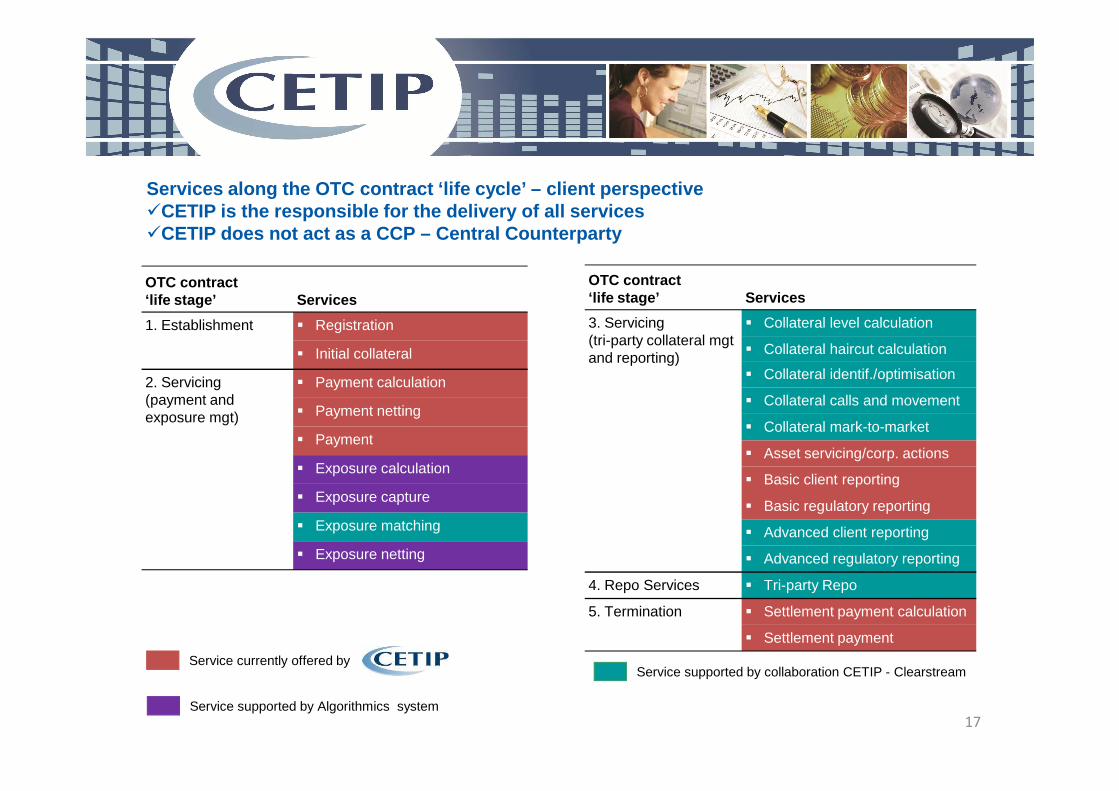
OTC contract‘life stage’ Services
1. Establishment � Registration
� Initial collateral
2. Servicing(payment and
� Payment calculation
OTC contract‘life stage’ Services
3. Servicing(tri-party collateral mgt and reporting)
� Collateral level calculation
� Collateral haircut calculation
� Collateral identif./optimisation
� Collateral calls and movement
Services along the OTC contract ‘life cycle’ – clien t perspective�CETIP is the responsible for the delivery of all se rvices�CETIP does not act as a CCP – Central Counterparty
17
Service currently offered by
(payment and exposure mgt) � Payment netting
� Payment
� Exposure calculation
� Exposure capture
� Exposure matching
� Exposure netting
� Collateral calls and movement
� Collateral mark-to-market
� Asset servicing/corp. actions
� Basic client reporting
� Basic regulatory reporting
� Advanced client reporting
� Advanced regulatory reporting
4. Repo Services � Tri-party Repo
5. Termination � Settlement payment calculation
� Settlement payment
Service supported by Algorithmics system
Service supported by collaboration CETIP - Clearstream
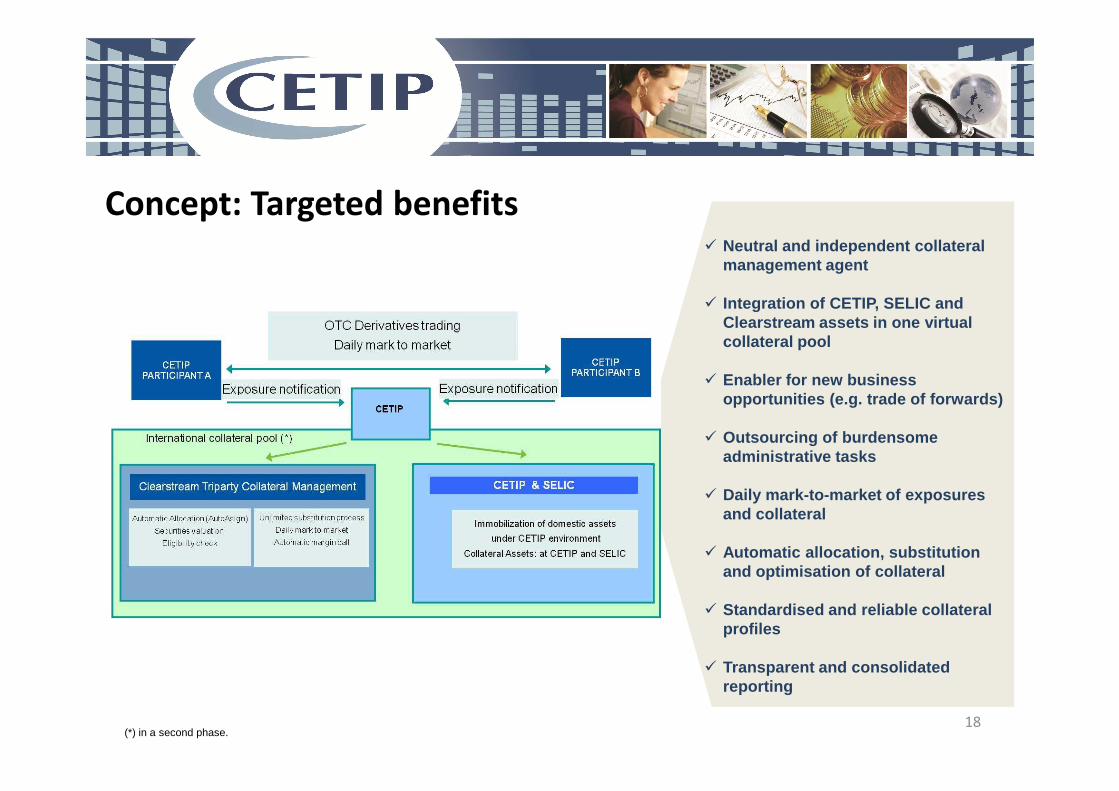
� Neutral and independent collateral management agent
� Integration of CETIP, SELIC and Clearstream assets in one virtual collateral pool
� Enabler for new business opportunities (e.g. trade of forwards)
Concept: Targeted benefits
18
opportunities (e.g. trade of forwards)
� Outsourcing of burdensome administrative tasks
� Daily mark-to-market of exposures and collateral
� Automatic allocation, substitution and optimisation of collateral
� Standardised and reliable collateral profiles
� Transparent and consolidated reporting
(*) in a second phase.
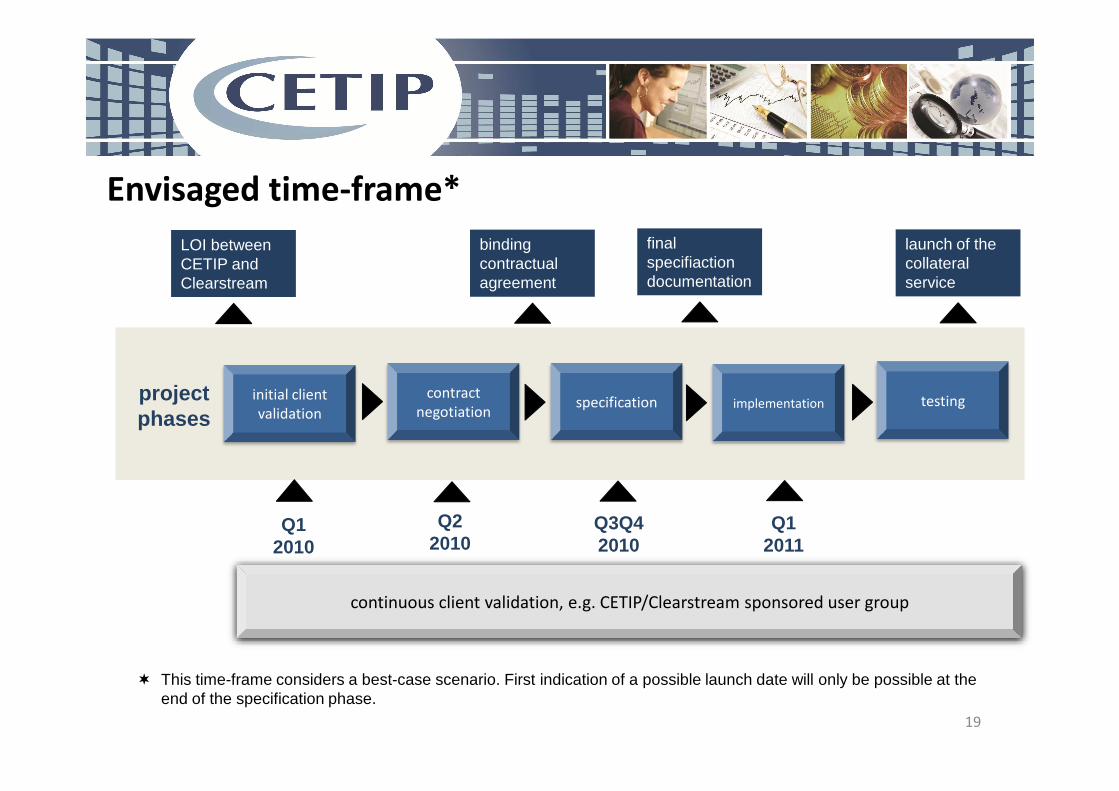
Envisaged time-frame*
project initial client
LOI between CETIP and Clearstream
contractspecification implementation testing
binding contractual agreement
final specifiactiondocumentation
launch of the collateral service
19
project phases
initial client
validation
Q1 2010
contract
negotiationspecification implementation testing
continuous client validation, e.g. CETIP/Clearstream sponsored user group
Q2 2010
Q3Q4 2010
Q12011
� This time-frame considers a best-case scenario. First indication of a possible launch date will only be possible at the end of the specification phase.
550
500
450
400
350
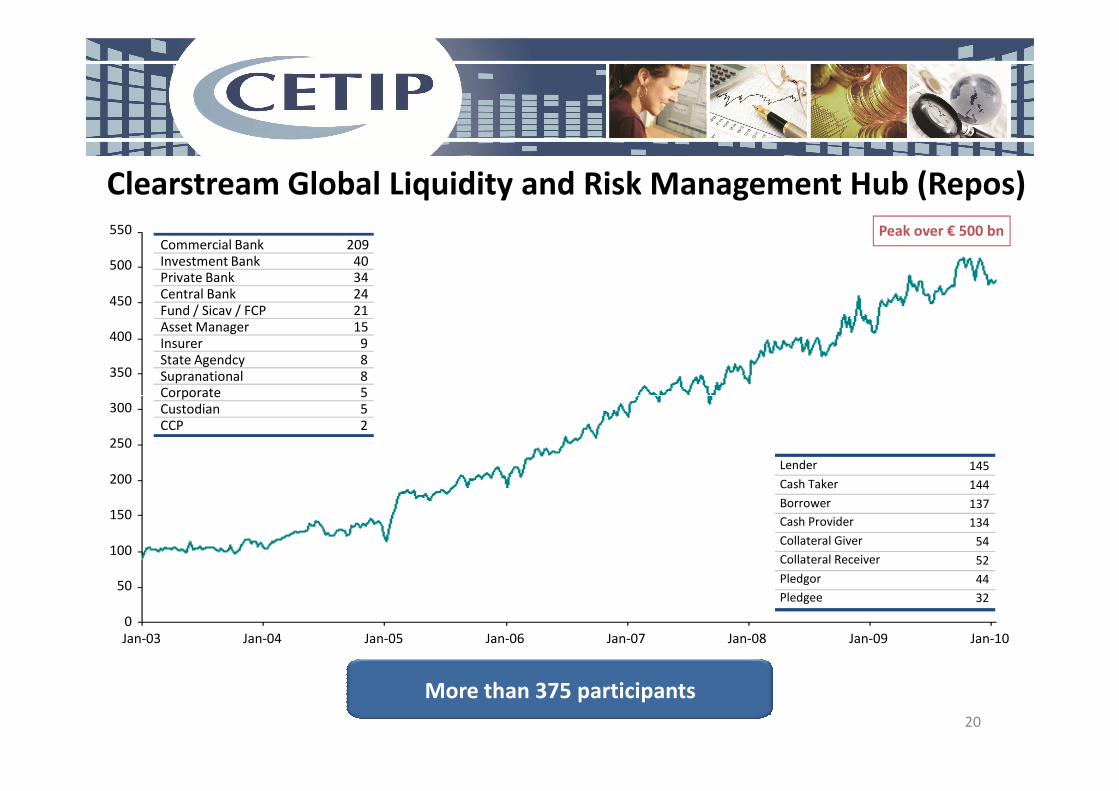
Peak over € 500 bn
Clearstream Global Liquidity and Risk Management Hub (Repos)
Commercial Bank 209Investment Bank 40Private Bank 34Central Bank 24Fund / Sicav / FCP 21Asset Manager 15Insurer 9State Agendcy 8Supranational 8Corporate 5
300
250
200
150
100
50
0
Jan-03 Jan-04 Jan-05 Jan-06 Jan-07 Jan-08 Jan-09 Jan-10
20
More than 375 participants
Corporate 5Custodian 5CCP 2
Lender 145
Cash Taker 144
Borrower 137
Cash Provider 134
Collateral Giver 54
Collateral Receiver 52
Pledgor 44
Pledgee 32

3. CETIP’s Financial Highlights
21
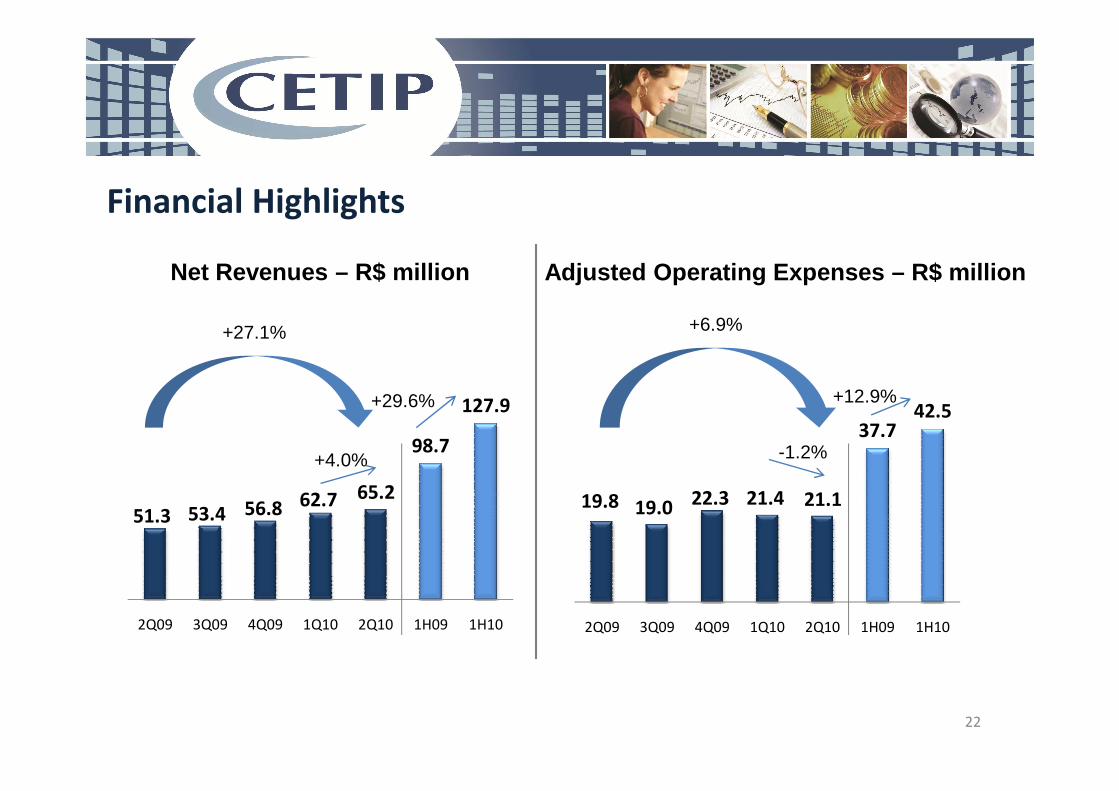
Financial Highlights
Net Revenues – R$ million Adjusted Operating Expenses – R$ million
127.9
+27.1% +6.9%
+29.6% +12.9%
22
65.251.3 53.4 56.8 62.7
98.7
127.9
2Q09 3Q09 4Q09 1Q10 2Q10 1H09 1H10
21.119.8 19.0 22.3 21.4
37.742.5
2Q09 3Q09 4Q09 1Q10 2Q10 1H09 1H10
+4.0% -1.2%
+29.6% +12.9%
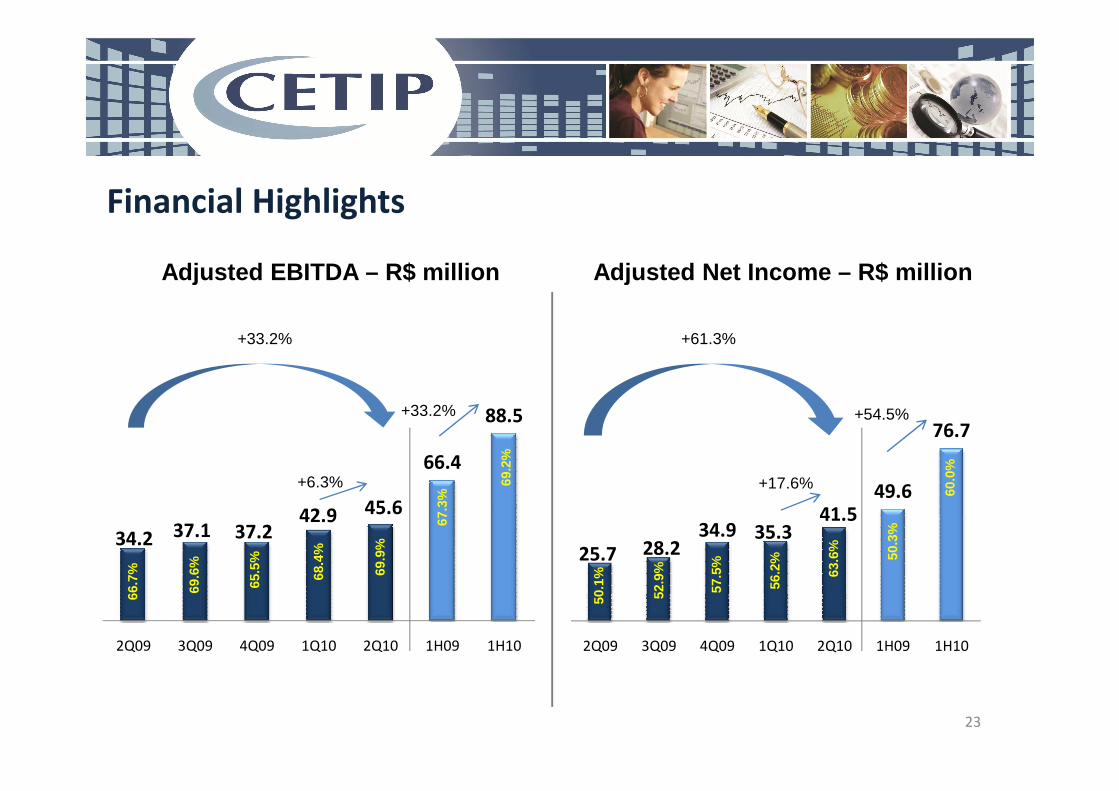
Financial Highlights
Adjusted EBITDA – R$ million Adjusted Net Income – R$ million
+33.2% +61.3%
23
41.5
25.7 28.234.9 35.3
49.6
76.7
2Q09 3Q09 4Q09 1Q10 2Q10 1H09 1H10
45.6
34.2 37.1 37.2 42.9
66.4
88.5
2Q09 3Q09 4Q09 1Q10 2Q10 1H09 1H10
+6.3%
69.9
%
68.4
%
66.7
%
65.5
%
69.6
%
+17.6%
56.2
%
50.1
%
57.5
%
52.9
% 63.6
%
69.2
%
67.3
%
+33.2% +54.5%
50.3
%
60.0
%

Revenue Breakdown by Type (%) – R$ million
+3.6%
+26.6%
+29.6%
24
12% 13% 14% 12% 13% 12% 13%
29% 29% 27% 25% 25% 28% 25%
15% 15% 15%13% 14% 13% 13%
21% 22% 22%22% 22% 20% 22%
23% 21% 22%28% 26% 27% 27%
2Q09 3Q09 4Q09 1Q10 2Q10 1H09 1H10
Other revenues
Monthly Utilization
Transactions
Custody
Registration
75.659.7 61.9 66.1 72.9 114.5 148.5
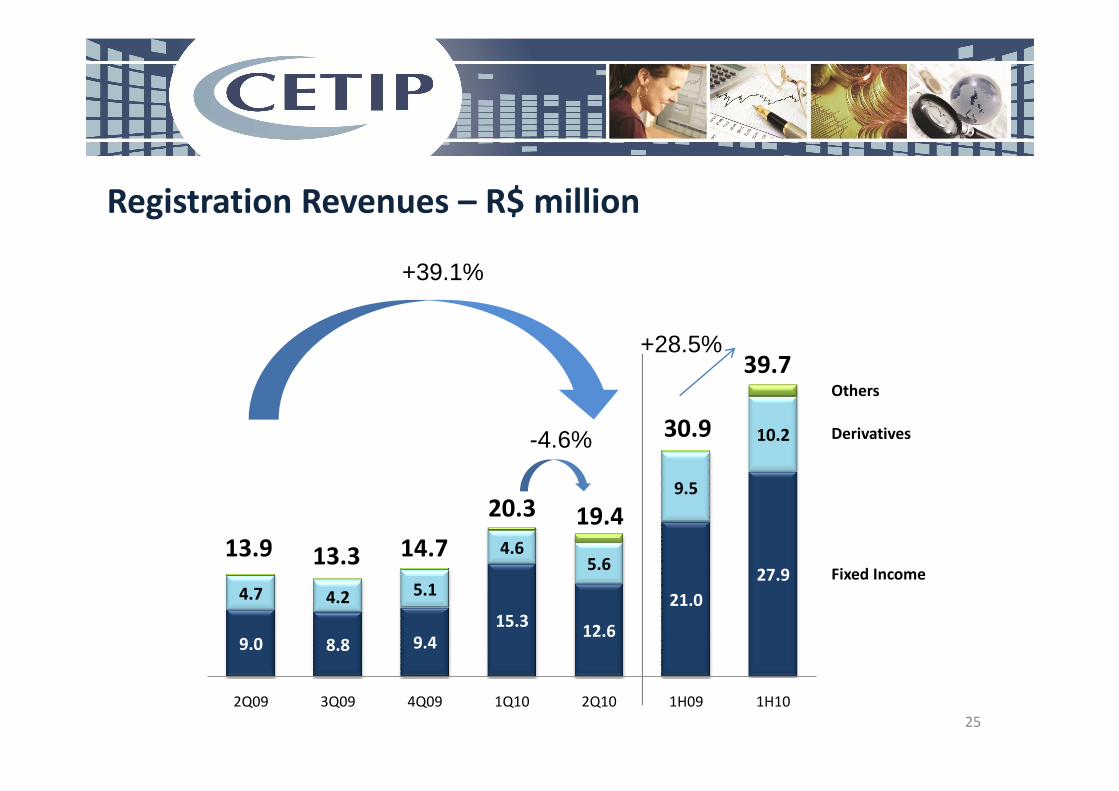
Registration Revenues – R$ million
Others
+39.1%
39.7+28.5%
25
Fixed Income
Derivatives
Others
9.0 8.8 9.4
15.312.6
21.0
27.94.7 4.2 5.1
4.65.6
9.5
10.2
2Q09 3Q09 4Q09 1Q10 2Q10 1H09 1H10
19.4
13.9 13.3 14.7
20.3
-4.6% 30.9
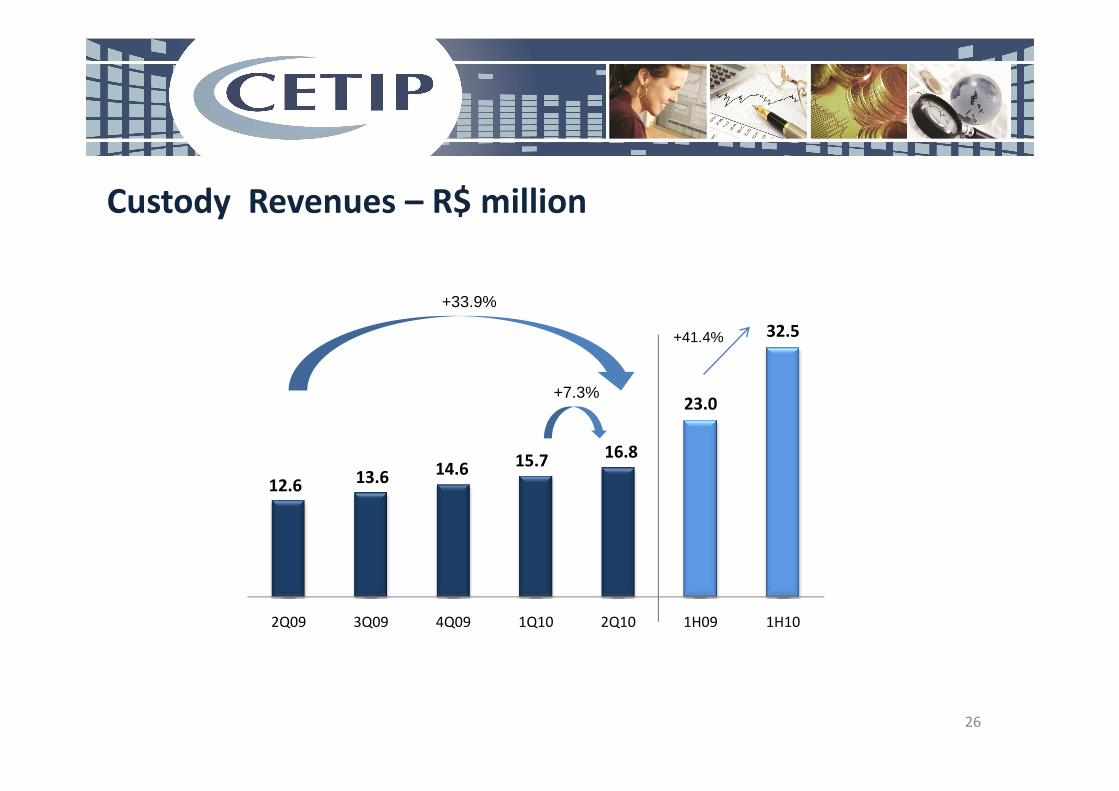
Custody Revenues – R$ million
23.0
32.5
+7.3%
+33.9%
+41.4%
26
16.8
12.6 13.6 14.6 15.7
23.0
2Q09 3Q09 4Q09 1Q10 2Q10 1H09 1H10
+7.3%
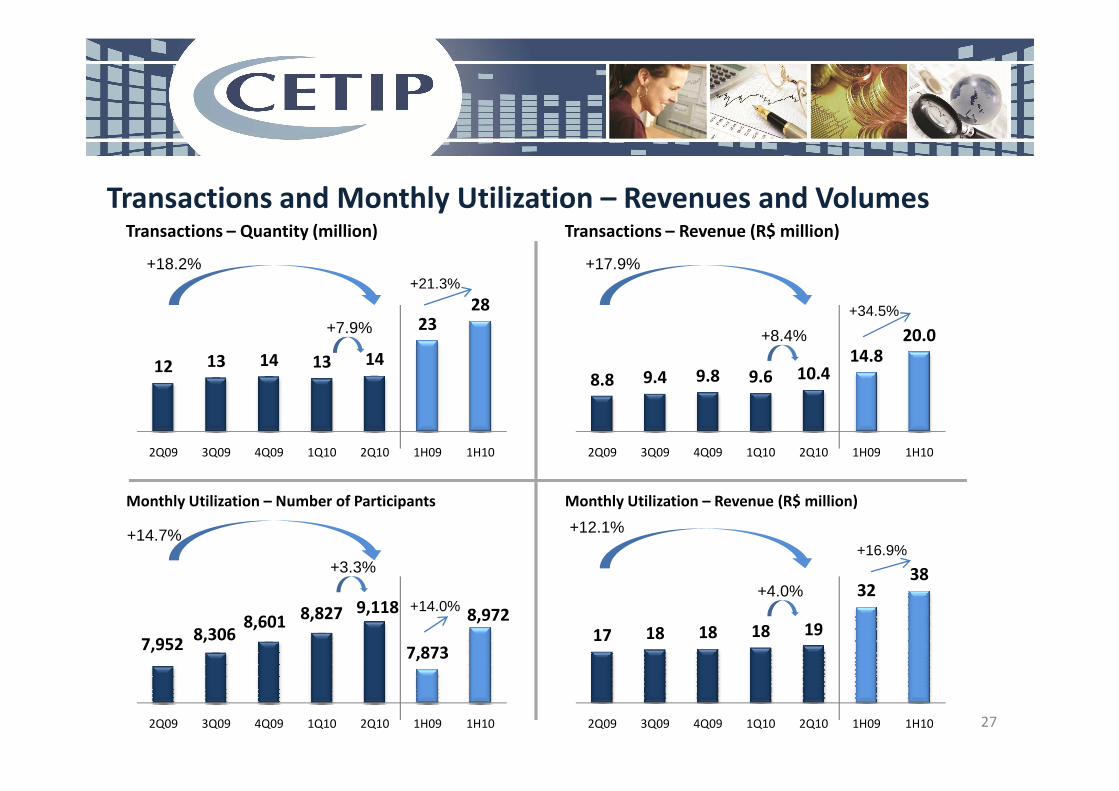
Transactions and Monthly Utilization – Revenues and Volumes
12 13 14 13 14
2328
Transactions – Quantity (million)
+18.2%
+7.9%
8.8 9.4 9.8 9.6 10.414.8
20.0
Transactions – Revenue (R$ million)
+17.9%
+8.4%
+21.3%
+34.5%
27
2Q09 3Q09 4Q09 1Q10 2Q10 1H09 1H10 2Q09 3Q09 4Q09 1Q10 2Q10 1H09 1H10
9,118
7,9528,306
8,601 8,827
7,873
8,972
2Q09 3Q09 4Q09 1Q10 2Q10 1H09 1H10
Monthly Utilization – Number of Participants
+14.7%
+3.3%
17 18 18 18 19
3238
2Q09 3Q09 4Q09 1Q10 2Q10 1H09 1H10
Monthly Utilization – Revenue (R$ million)
+12.1%
+4.0%+14.0%
+16.9%

CAPEX - % of Net Revenues
% NR 3.4% 5.0% 5.2% 5.0% 14.8%
16%
11%
6%
5% 15%6%
3%
26%7% 20%
10%4% 5% 8%
1%
3.4% 10.0%
R$ mm 1.7 2.7 2.9 3.1 9.6 3.3 12.8
28
21%
5%12%
63%
10%17%
23%
30% 59%
61%
22%
59%
26%
50%
34%
17% 4%
42%
6%
2Q09 3Q09 4Q09 1Q10 2Q10 1H09 1H10
Product Development
Technology
Office Settlement
Platform Migration
Others

Other Highlights
0.3421
Adjusted Earnings per Share – R$
+59.8%
+53.2%
Shareholder Remuneration
Remuneration Deliberation Amount (R$mm)Gross amount per
Payment
29
Note: As provided in the bylaws, dividend and/or ISE payment policy corresponds to at least 25% of adjusted net income in accordance with Brazilian law.
0.1849
0.1157 0.12660.1560 0.1577
0.2233
2Q09 3Q09 4Q09 1Q10 2Q10 1H09 1H10
+59.8%+17.3%
Remuneration Deliberation Amount (R$mm)Gross amount per
share (R$)Payment
1H09 ISE Board Meeting 08/26/09 6.88 0.030939 09/15/09
2H09 ISE Board Meeting 12/21/09 8.95 0.040025 01/13/10
2009 Dividend Board Meeting 03/10/10 50.78 0.226862 05/17/10
1H10 ISE Board Meeting 06/18/10 9.24 0.041207 07/12/10

Shareholder Base As of September 30, 2010
TOTAL SHARES: 226,014,250*
18% Advent
30
Outstanding options 5,704,659 shares
Potential future grants 3,970,807 shares
(*) Considers the capital increases in the period.
FEMCO: Federated Management Company; parent Company for Federated Kauffman Fund.
13% FEMCO
10% Itaú Unibanco
1% Santander
4% Bradesco
1% Board
Free Float 53%

12,45
16.35
25
30
35
14
16
18
Stock Performance
CTIP3 (R$) vs. Volume (R$ mm)(Oct 27, 2009 – Sep 17, 2010)
CTIP3 vs. IBOV vs. BVMF(Oct 27, 2009 – Sep 17, 2010)
26%
20%
130
140
12,45
0
5
10
15
20
25
0
2
4
6
8
10
12
29-Oct 14-Dec 1-Feb 17-Mar 30-Apr 14-Jun 27-Jul 8-Sep
Volume - R$ mm Price-R$
Oct-09 Nov-09 Dec-09 Jan-10 Feb-10 Mar-10 Apr-10 May-10 Jun-10 Jul-10 Aug-10 Sep-10
31Note: Financial volume in the first trading session amounted to R$260 million and in the second trading session, R$80 million.
6%
20%
80
90
100
110
120
IBOV CTIP3 BMFB
Oct-09 Nov-09 Dec-09 Jan-10 Feb-10 Mar-10 Apr-10 May-10 Jun-10 Jul-10 Aug-10 Sep-10

4. Appendix
32

DIs and CDBs - Volumes and Revenues
870 885701 814 756
1,992
1,569
DI – Volume (R$ billion)
7.75.3 4.8 4.9
11.413.5
19.1
DI – Revenue (R$ million)
-13.1%
-32.0%
+45.6%
-7.1%
-21.2% +41.8%
33
290 316 362 339398
618737
2Q09 3Q09 4Q09 1Q10 2Q10 1H09 1H10
2Q09 3Q09 4Q09 1Q10 2Q10 1H09 1H10 2Q09 3Q09 4Q09 1Q10 2Q10 1H09 1H10
+17.2%
CDB – Volume (R$ billion)
+37.3%
3.22.4 2.5 2.9 2.7
5.25.9
2Q09 3Q09 4Q09 1Q10 2Q10 1H09 1H10
CDB – Revenue (R$ million)+32.4%
+17.0%
+19.3%+13.1%

Swaps - Volume and Revenue
168-36.6%
SWAPS – Quantity (thousand)
5.1
7.0
SWAPS – Revenue (R$ million)
+19.7%
+22.2%
+37.4%-42.9%
34
7867 67
47 49
96
2Q09 3Q09 4Q09 1Q10 2Q10 1H09 1H10
+5.8% 3.83.1 2.9
4.2
3.2
5.1
2Q09 3Q09 4Q09 1Q10 2Q10 1H09 1H10
+19.7%
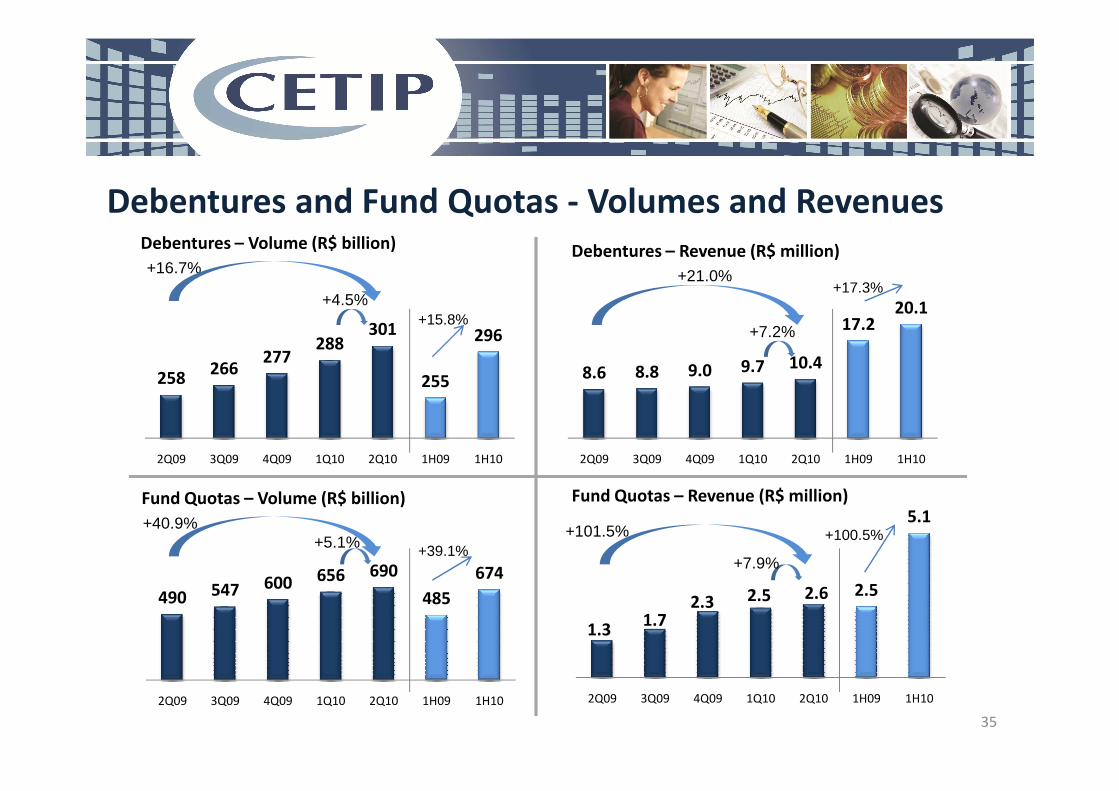
Debentures and Fund Quotas - Volumes and Revenues
258266
277288
301
255
296
Debentures – Volume (R$ billion)
+16.7%
+4.5%
8.6 8.8 9.0 9.7 10.4
17.220.1
Debentures – Revenue (R$ million)
+21.0%
+7.2%
+17.3%
+15.8%
35
2Q09 3Q09 4Q09 1Q10 2Q10 1H09 1H10 2Q09 3Q09 4Q09 1Q10 2Q10 1H09 1H10
490 547 600 656 690
485
674
2Q09 3Q09 4Q09 1Q10 2Q10 1H09 1H10
Fund Quotas – Volume (R$ billion)
+40.9%+5.1%
2.6
1.31.7
2.3 2.5 2.5
5.1
2Q09 3Q09 4Q09 1Q10 2Q10 1H09 1H10
Fund Quotas – Revenue (R$ million)
+101.5%
+7.9%
+100.5%+39.1%

CIP – Revenue and Volume
12.0 12.8
CIP – Revenue (R$ million)
-1.7%
Processed EFTs
38.3
323300293268274
+19.8%
+21.5%+7.2%
258 311
Note: Revenue refers only to services of SITRAF – Transfer Funds System.36
6.26.3 6.6 6.6 6.6
12.0 12.8
2Q09 3Q09 4Q09 1Q10 2Q10 1H09 1H10
-6.9%
Processed EFTs(Quantity – MM)
Processed EFTs/day(Quantity - thousand)
16.7 17.4 18.4 18.3 20.0
31.538.3
2Q09 3Q09 4Q09 1Q10 2Q10 1H09 1H10
+19.8%+9,5%

Adjusted Operating Expenses Breakdown – % and R$ million
21.119.8 19.0 22.3 21.4
-1.2%
+6.9%
• Depreciation and Amortization: -3.4%
• Personnel: -3.0%
37.7 42.5
+12.9%
37
Personnel
Outsourced services
Depreciation and amortization
General
Equipments and systems rental
Others expenses/revenues & taxes and fees1% 3% 1% 0% 1% 1%5% 4% 1% 1% 1% 5%
1%
9% 11%8% 9% 11%
9%10%
14% 14%12%
7% 7%
14%
7%
14%15%
15%16% 16%
13%
16%
58% 55%62% 66% 65%
58%65%
2Q09 3Q09 4Q09 1Q10 2Q10 1H09 1H10
21.119.8 19.0 22.3 21.4 37.7 42.5
Note: Personnel expenses include board members’ compensation.
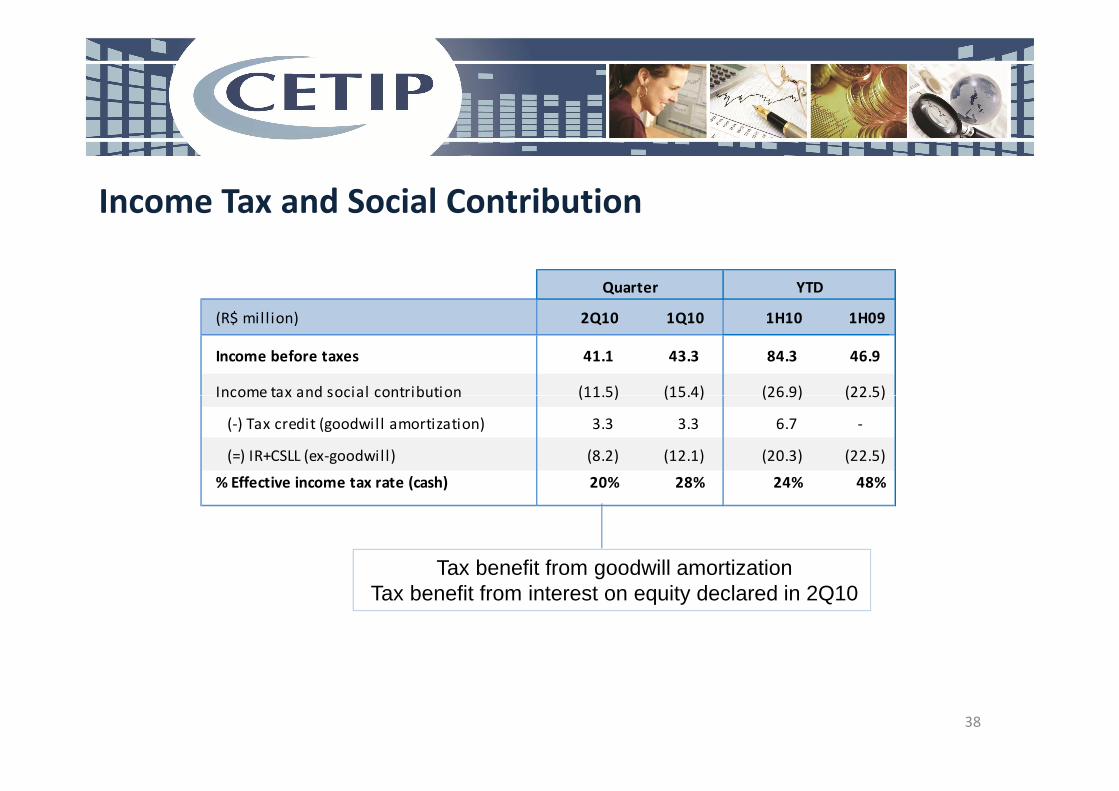
Income Tax and Social Contribution
(R$ mill ion) 2Q10 1Q10 1H10 1H09
Income before taxes 41.1 43.3 84.3 46.9
Income tax and social contribution (11.5) (15.4) (26.9) (22.5)
Quarter YTD
38
Tax benefit from goodwill amortizationTax benefit from interest on equity declared in 2Q10
Income tax and social contribution (11.5) (15.4) (26.9) (22.5)
(-) Tax credit (goodwill amortization) 3.3 3.3 6.7 -
(=) IR+CSLL (ex-goodwill) (8.2) (12.1) (20.3) (22.5)
% Effective income tax rate (cash) 20% 28% 24% 48%
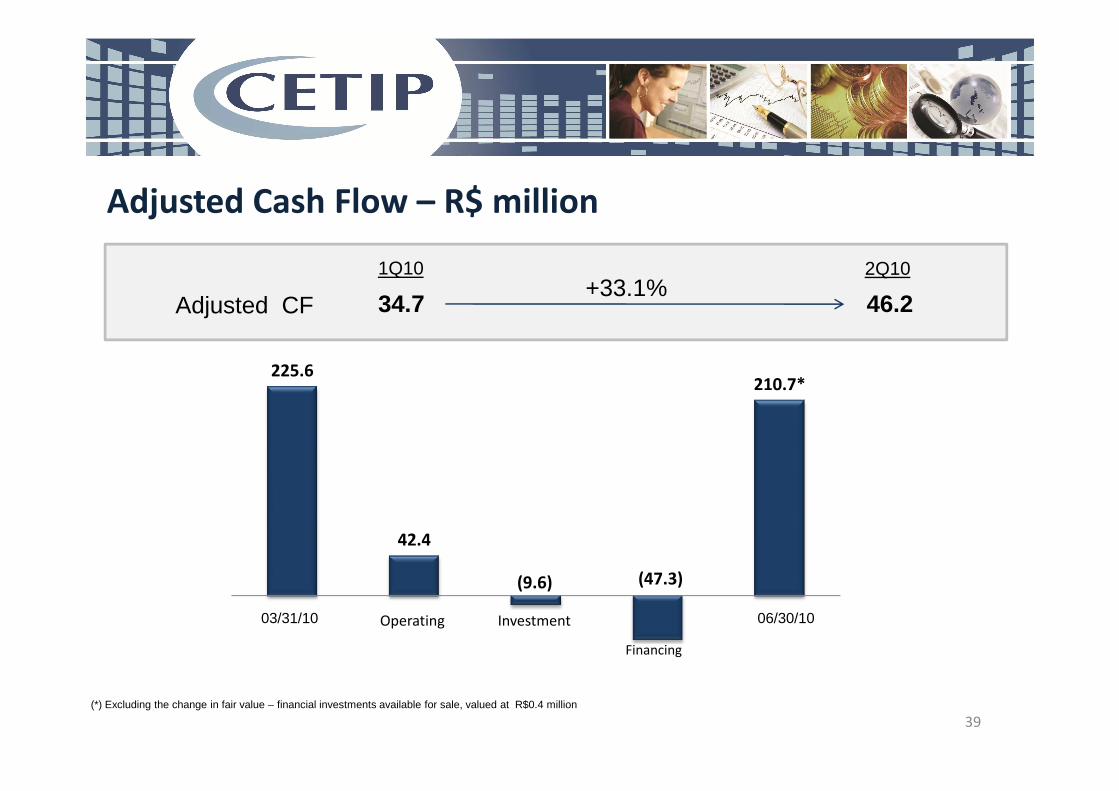
Adjusted Cash Flow – R$ million
34.7 46.2Adjusted CF+33.1%
1Q10 2Q10
225.6210.7*
39
(*) Excluding the change in fair value – financial investments available for sale, valued at R$0.4 million
42.4
(9.6) (47.3)
1Q10 Operating Investment 2Q10
Financing
03/31/10 06/30/10
Investor Relations
40
Legal Disclaimer
The forward-looking statements contained in this document relating to business prospects, projections of
operating and financial results, and those related to the growth prospects of CETIP are merely estimates and
as such are based exclusively on the Management’s expectations about the future of the business. These
forward-looking statements depend substantially on the approvals and licenses necessary for the projects,
market conditions, and performance of the Brazilian economy, the sector and international markets and
hence are subject to change without prior notice. This performance report includes accounting data and non-
accounting data such as operating, pro forma financial data and projections based on the Management’s
expectations. Non-accounting data has not been reviewed by the Company’s independent auditors.