The Institutional Foundations of China's Market Transition by Yingyi

Institutional Foundations for Innovation-Based Economic Growth
Richard Dasher (Stanford University)
Nobuyuki Harada (University of Tsukuba)
Takeo Hoshi (Stanford University)
Kenji E. Kushida (Stanford University)
Tetsuji Okazaki (University of Tokyo)
July 7, 2015
* This report is prepared for the National Institute for Research Advancement (NIRA).
We thank NIRA for financial support as well as the comments on an earlier draft by Jiro
Ushio and Reiko Kanda. Hern Hern Chua, Yaqian Fan, Yoshihiro Kaga, Satoshi
Koibuchi, Shingo Nakano, Benjamin Pham, and Michiru Sawada helped us by examining
several innovation policies in Abenomics. We benefited from our discussion with
Tomohiko Inui, Yasufumi Kanamaru, Takeshi Niinami, Hiroshi Suzuki, Ikuo Sugawara,
Sakie Fukushima Tachibana, in the NIRA Seminar in Tokyo on March 15, 2015. Ian
Myers provided research assistance. We also thank Nao Toyoda and Naoko Mori for
support of the project.
1
ABSTRACT
Innovation is essential for the growth of a matured economy like Japan. This report examines the
institutional foundations of innovation-based economic growth and explores the role of Japanese
government in encouraging innovation by Japanese companies and entrepreneurs. We start by
summarizing eleven elements that characterize the ecosystem of Silicon Valley, which is often
considered to be the best example of innovation-based economy. We then discuss how those
elements fit with six institutional foundations that support the innovation-based economic growth.
Those are (A) financial system that provides funding for risky ventures, (B) labor market that
provides high quality, diverse and mobile human resources, (C) interactions between industry,
universities, and government to generate a constant stream of innovative ideas, products, and
businesses, (D) industrial organization where large established firms and small startups grow
together, (E) social system that encourage entrepreneurship, and (F) professionals that assist
establishment and growth of startups. Japan has not yet established these institutional
foundations. The government can help by encouraging development of these institutional
foundations. If it is difficult to establish a certain institutional foundation in a short time, the
government may instead help Japanese firms and entrepreneurs to tap the Silicon Valley
ecosystem directly. The Japanese government has been trying numerous industrial policies that
may encourage development of some of the six institutional foundations, as well as policies that
directly support R&D as precursors for innovation. The latest attempts are found in the
Abenomics growth strategy. Thus, we find that the underdevelopment of those institutions in
Japan is not due to the lack of policy ideas. The problem has been the shortcoming in the efforts
of policy evaluation to find out which policy interventions are actually promising and how those
should be implemented to guarantee effectiveness. The policies that help Japanese firms and
entrepreneurs to directly benefit from the Silicon Valley ecosystem have been lacking. It is
worthwhile to try those policies if those are accompanied by rigorous policy evaluation and
adjustments to find the effective policies.

1
Introduction
Innovation is essential for the growth of a mature economy. An important reason for Japan’s
economic stagnation over the past two decades was its failure to transform its economic system
from one suited for catch-up growth to one that supports innovation-based economic growth.
This report examines the institutional foundations of innovation-based economic growth,
and suggests government policies that encourage innovation-based growth in Japan. We start by
pointing out the importance of innovation for an advanced economy like Japan to continue
growing in Section 1. Section 2 then studies the business and economy of Silicon Valley, where
we observe the most successful innovation-based economic growth in the world today. We
identify eleven defining characteristics of the Silicon Valley ecosystem. Section 3 explores the
institutions that support these eleven defining characteristics. We argue particular institutions in
(A) finance, (B) human capital, (C) industry-university-government interactions, (D) industrial
organization, (E) entrepreneurship culture, and (F) business infrastructure constitute the
foundation for a successful innovation-based economy. In Section 4, we turn our attention back
to Japan and briefly examine the challenges that Japan faces in the transition to an innovation
driven economy like Silicon Valley. Japan lacks most of the six institutional foundations that
support the Silicon Valley ecosystem. Thus, at least in theory, the government can help by
encouraging those institutional foundations or their equivalents to develop in Japan as well. For
some of the institutions, however, it would take a long time if not impossible to develop the
institution in Japan. In such cases, an attempt for Japan to utilize the institution that already
exists in Silicon Valley may be more promising. There have already been numerous attempts
by the Japanese government to stimulate innovation-based economic growth in Japan. Section 5
evaluates major industrial policy initiatives geared toward encouraging innovations that date
back to the 1980s. Innovation policy is again at the core of Abenomics’s growth strategy, also
known as the “Third Arrow.” Section 6 briefly goes through the innovation policies that are
included in Abenomics’s growth strategy. Section 7 examines the past experience of Japanese
business to benefit directly from the institutions in Silicon Valley. Section 8 concludes by
pointing out that the Japanese government has already been trying many policy interventions to
encourage innovations in Japan. Thus, the lack of policy ideas does not seem to be a problem for
the government. The Japanese government may be able to do more in assisting Japanese firms
and entrepreneurs to get direct access to the Silicon Valley ecosystem, but the main issue with
many government interventions in the past has been lack of impact evaluations and failure to
adjust the policies based on evaluation results.
1. Importance of innovation for Japan’s growth
Innovation is essential for the growth of a matured economy. This is an implication of the
simple but widely used neoclassical model of economic growth originally developed by Solow
2
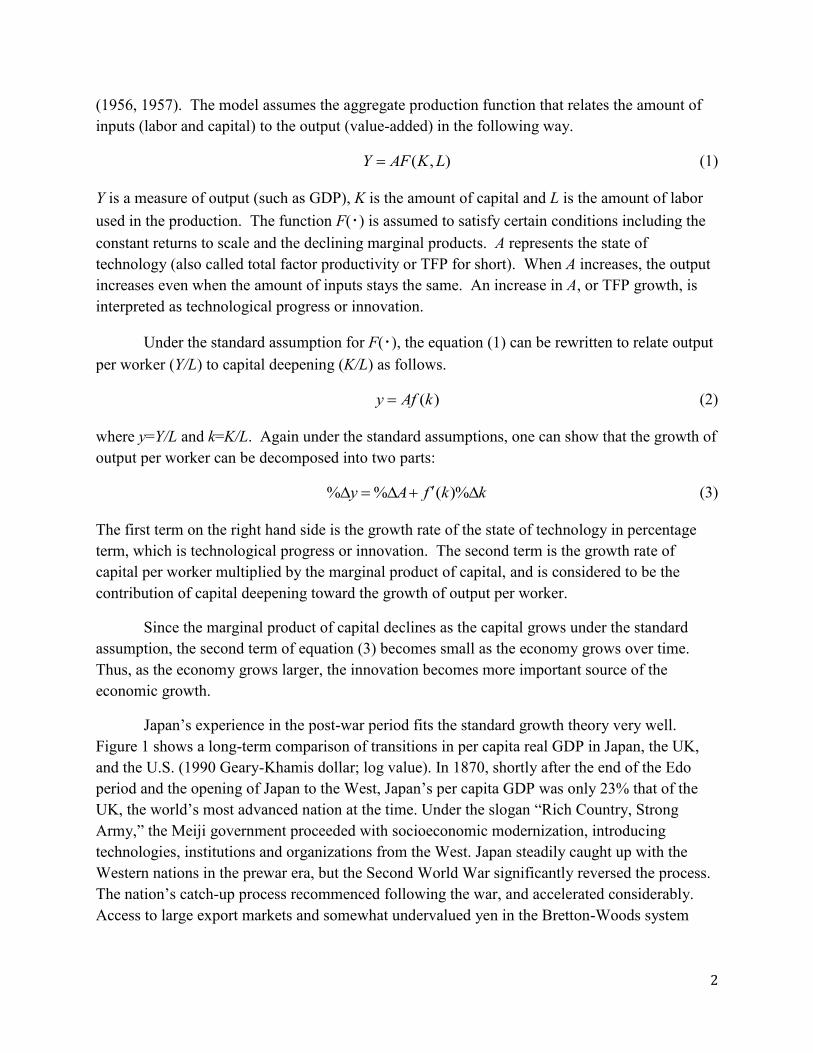
(1956, 1957). The model assumes the aggregate production function that relates the amount of
inputs (labor and capital) to the output (value-added) in the following way.
( , )Y AF K L (1)
Y is a measure of output (such as GDP), K is the amount of capital and L is the amount of labor
used in the production. The function F(・) is assumed to satisfy certain conditions including the
constant returns to scale and the declining marginal products. A represents the state of
technology (also called total factor productivity or TFP for short). When A increases, the output
increases even when the amount of inputs stays the same. An increase in A, or TFP growth, is
interpreted as technological progress or innovation.
Under the standard assumption for F(・), the equation (1) can be rewritten to relate output
per worker (Y/L) to capital deepening (K/L) as follows.
( )y Af k (2)
where y=Y/L and k=K/L. Again under the standard assumptions, one can show that the growth of
output per worker can be decomposed into two parts:
% % ( )%y A f k k (3)
The first term on the right hand side is the growth rate of the state of technology in percentage
term, which is technological progress or innovation. The second term is the growth rate of
capital per worker multiplied by the marginal product of capital, and is considered to be the
contribution of capital deepening toward the growth of output per worker.
Since the marginal product of capital declines as the capital grows under the standard
assumption, the second term of equation (3) becomes small as the economy grows over time.
Thus, as the economy grows larger, the innovation becomes more important source of the
economic growth.
Japan’s experience in the post-war period fits the standard growth theory very well.
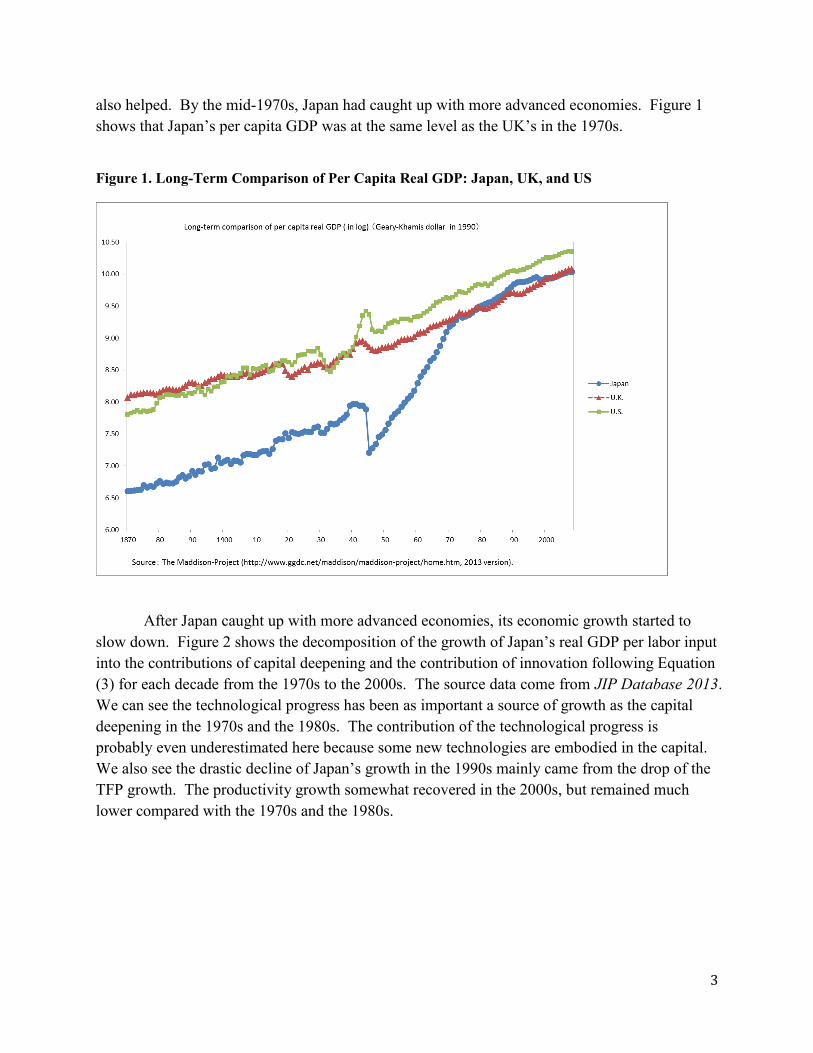
Figure 1 shows a long-term comparison of transitions in per capita real GDP in Japan, the UK,
and the U.S. (1990 Geary-Khamis dollar; log value). In 1870, shortly after the end of the Edo
period and the opening of Japan to the West, Japan’s per capita GDP was only 23% that of the
UK, the world’s most advanced nation at the time. Under the slogan “Rich Country, Strong
Army,” the Meiji government proceeded with socioeconomic modernization, introducing
technologies, institutions and organizations from the West. Japan steadily caught up with the
Western nations in the prewar era, but the Second World War significantly reversed the process.
The nation’s catch-up process recommenced following the war, and accelerated considerably.
Access to large export markets and somewhat undervalued yen in the Bretton-Woods system
3
also helped. By the mid-1970s, Japan had caught up with more advanced economies. Figure 1
shows that Japan’s per capita GDP was at the same level as the UK’s in the 1970s.
Figure 1. Long-Term Comparison of Per Capita Real GDP: Japan, UK, and US
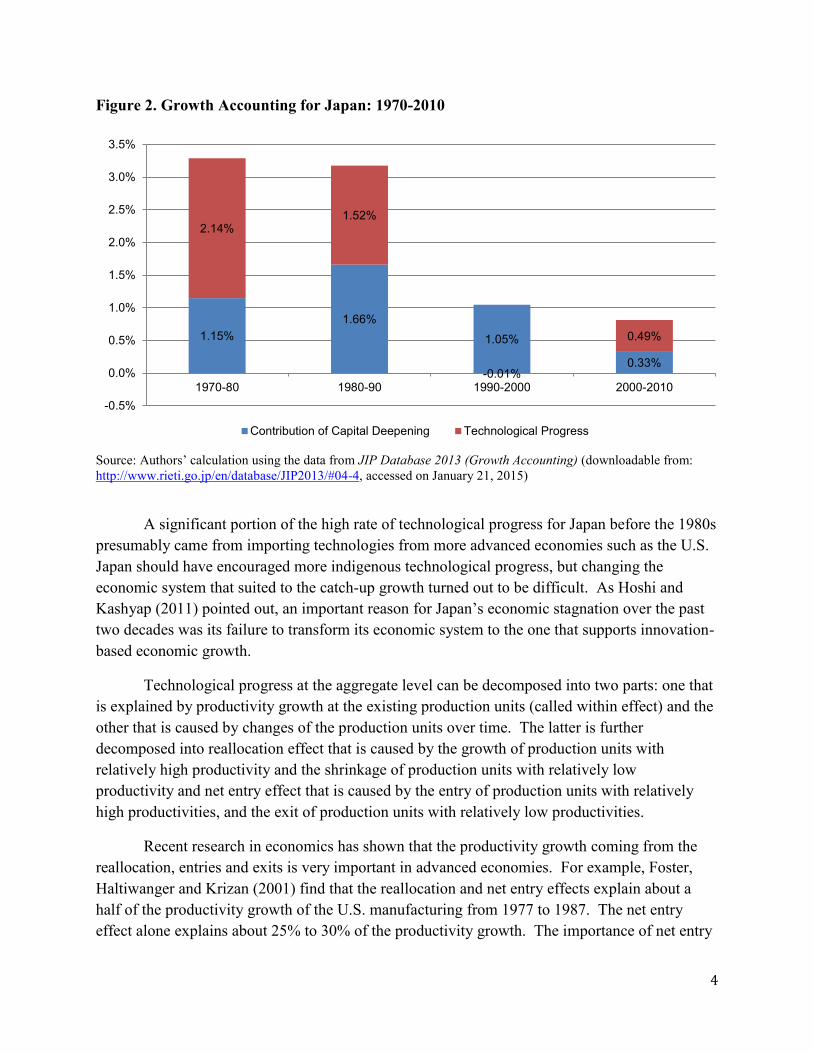
After Japan caught up with more advanced economies, its economic growth started to
slow down. Figure 2 shows the decomposition of the growth of Japan’s real GDP per labor input
into the contributions of capital deepening and the contribution of innovation following Equation
(3) for each decade from the 1970s to the 2000s. The source data come from JIP Database 2013.
We can see the technological progress has been as important a source of growth as the capital
deepening in the 1970s and the 1980s. The contribution of the technological progress is
probably even underestimated here because some new technologies are embodied in the capital.
We also see the drastic decline of Japan’s growth in the 1990s mainly came from the drop of the
TFP growth. The productivity growth somewhat recovered in the 2000s, but remained much
lower compared with the 1970s and the 1980s.
4
Figure 2. Growth Accounting for Japan: 1970-2010
Source: Authors’ calculation using the data from JIP Database 2013 (Growth Accounting) (downloadable from:
http://www.rieti.go.jp/en/database/JIP2013/#04-4, accessed on January 21, 2015)
A significant portion of the high rate of technological progress for Japan before the 1980s
presumably came from importing technologies from more advanced economies such as the U.S.
Japan should have encouraged more indigenous technological progress, but changing the
economic system that suited to the catch-up growth turned out to be difficult. As Hoshi and
Kashyap (2011) pointed out, an important reason for Japan’s economic stagnation over the past
two decades was its failure to transform its economic system to the one that supports innovation-
based economic growth.
Technological progress at the aggregate level can be decomposed into two parts: one that
is explained by productivity growth at the existing production units (called within effect) and the
other that is caused by changes of the production units over time. The latter is further
decomposed into reallocation effect that is caused by the growth of production units with
relatively high productivity and the shrinkage of production units with relatively low
productivity and net entry effect that is caused by the entry of production units with relatively
high productivities, and the exit of production units with relatively low productivities.
Recent research in economics has shown that the productivity growth coming from the
reallocation, entries and exits is very important in advanced economies. For example, Foster,
Haltiwanger and Krizan (2001) find that the reallocation and net entry effects explain about a
half of the productivity growth of the U.S. manufacturing from 1977 to 1987. The net entry
effect alone explains about 25% to 30% of the productivity growth. The importance of net entry
1.15%
1.66%
1.05%
0.33%
2.14% 1.52%
-0.01%
0.49%
-0.5%
0.0%
0.5%
1.0%
1.5%
2.0%
2.5%
3.0%
3.5%
1970-80 1980-90 1990-2000 2000-2010
Contribution of Capital Deepening Technological Progress

5
seems to be even larger for non-manufacturing. For the U.S. retail industry from 1987 to 1997,
Foster, Haltiwanger and Krizan (2006) find almost all productivity growth is accounted for by
the net entry effect.
The importance of the net entry effect implies that the technological progress in an
advanced economy happens through the process of creative destruction, where new and
technologically more advanced production units replaces old and less advanced production units.
In order to restore economic growth, Japan needs to transform its economic system to encourage
such creative destruction. How can Japan do that? To answer this question, we start by studying
Silicon Valley, where the growth has been supported by constant creation of new ideas, new
businesses and new enterprises.
2. Understanding the Silicon Valley Eco-system
Silicon Valley is widely regarded as one of the most successful innovation-based
economic systems in the world (Lee, Miller et al. 2000). Silicon Valley has a variety of business
organizations and institutions that create a business environment that has proved to be highly
conducive to the successful creation of startup firms, disruptive business models, and leadership
in a variety of high-tech areas. The various components and characteristics of Silicon Valley that
“make the system work” fit together and exhibit complementarities are best referred to as the
Silicon Valley “ecosystem.”1
What are the key components of Silicon Valley, how do they work, and how do they fit
together? In this section, we introduce the Silicon Valley ecosystem, drawing upon existing
research on Silicon Valley.
2.1. Where is Silicon Valley? The Geography of the Silicon Valley ecosystem
Silicon Valley does not show up on a map. The term Silicon Valley has always referred
to an informal collection of contiguous cities and counties that share the attributes of the region’s
ecosystem. The question of exactly which areas to include in the label “Silicon Valley” matters a
great deal in any data collected. It is also critical in the sense that there is no “Silicon Valley
government” – the region is instead a collection of counties. Until recently, the term has
generally referred to the Santa Clara valley area, stretching from Menlo Park to San Jose. Most
analyses excluded the city of San Francisco and the East Bay (Berkeley, Oakland, and other
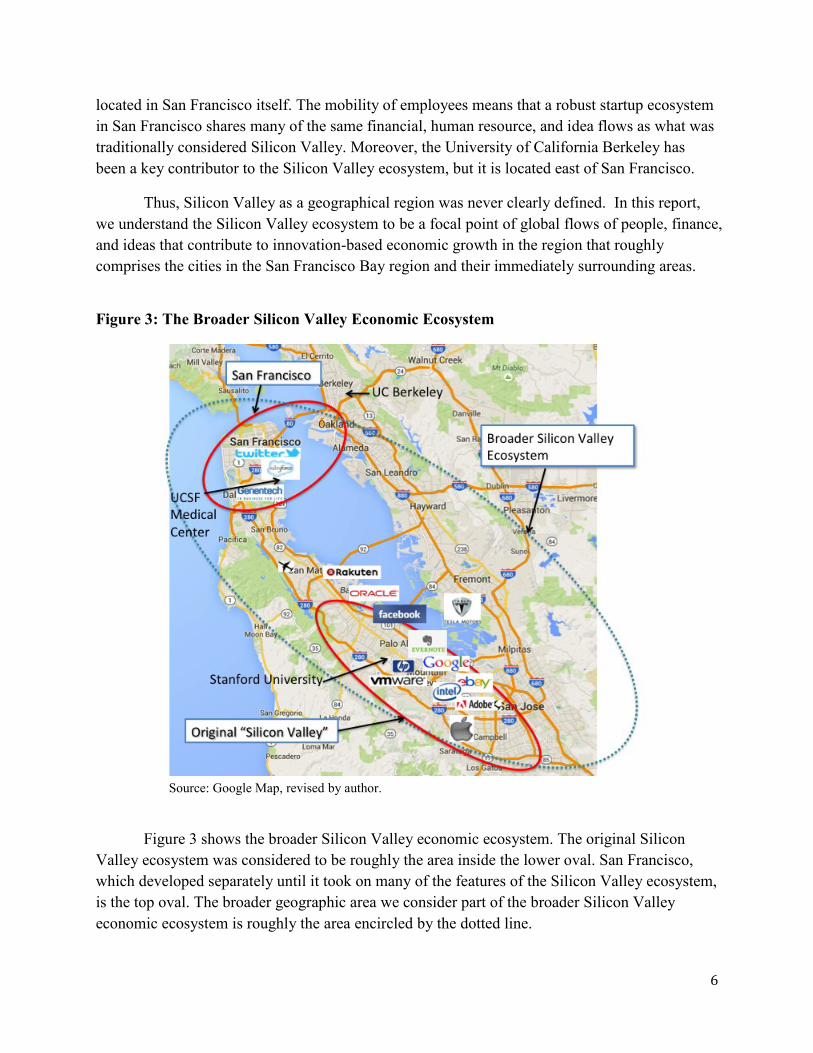
areas East of San Francisco Bay) from descriptions of Silicon Valley. (See Figure 3)
However, as an economic region, Silicon Valley has grown to encompass a far larger
portion of the San Francisco Bay Area. Firms such as Genentech and the biotech cluster it
spawned are located in South San Francisco, and startups such as Salesforce.com and Twitter are
1 It has also been referred to as a “Habitat.” We prefer “ecosystem,” since “business ecosystem” is now a
more common phrase in business writing.
6
located in San Francisco itself. The mobility of employees means that a robust startup ecosystem
in San Francisco shares many of the same financial, human resource, and idea flows as what was
traditionally considered Silicon Valley. Moreover, the University of California Berkeley has
been a key contributor to the Silicon Valley ecosystem, but it is located east of San Francisco.
Thus, Silicon Valley as a geographical region was never clearly defined. In this report,
we understand the Silicon Valley ecosystem to be a focal point of global flows of people, finance,
and ideas that contribute to innovation-based economic growth in the region that roughly
comprises the cities in the San Francisco Bay region and their immediately surrounding areas.
Figure 3: The Broader Silicon Valley Economic Ecosystem
Source: Google Map, revised by author.
Figure 3 shows the broader Silicon Valley economic ecosystem. The original Silicon
Valley ecosystem was considered to be roughly the area inside the lower oval. San Francisco,
which developed separately until it took on many of the features of the Silicon Valley ecosystem,
is the top oval. The broader geographic area we consider part of the broader Silicon Valley
economic ecosystem is roughly the area encircled by the dotted line.

7
2.2. Defining Characteristics of Silicon Valley Ecosystem
The rest of this section identifies eleven characteristics of Silicon Valley that we consider
to be essential. Table 1 lists those defining characteristics. All of these are cited by at least some
of many studies of Silicon Valley as the distinctive contributors to its success (Lee et al. 2000,
for example) These factors are examined one by one below.
Table 1: Key Characteristics of the Silicon Valley Ecosystem
Characteristic
1. Dual ecosystem of large firms and small, fast-growth startups
2. Highly competitive industries, balancing between “open innovation” and secret protection
3. High financial returns for successful entrepreneurs and startups’ early employees
4. Finance and governance of startups by venture capitals
5. High level and diverse human resources for all stages of startups
6. High labor mobility
7. Top class universities
8. Extensive government role in shaping technological trajectories and basic science
9. Business infrastructure (law firms, accounting firms, mentors, etc.)
10. Acceptance of failures
11. Legal platform
2.2.1. Dual ecosystem of large firms and small, high growth startups
First, Silicon Valley has a business ecosystem in which both large firms and startups exist
symbiotically. Silicon Valley is sometimes seen as mainly a mecca for startups, but in many
ways it is the coexistence of large firms, which provide markets for startups’ offerings, a source
of human capital, and often expertise, along with startups that make the ecosystem viable. M&A
of start-ups by large firms return capital, human resources, and knowledge to the Silicon Valley
ecosystem, benefitting future start-ups and investments. Moreover, some startups eventually
grow to become large firms, spawning new firms as employees leave to startup, fueling a
virtuous cycle.
Large firms often fulfill the important role of first customers for start-up firms. This
includes traditional large firms that have existed for a long time, such as IBM, Lockheed, and HP,

8
as well as large firms that became large relatively recently, ranging from Apple and Oracle to
Google and Facebook.
Large companies also acquire start-up companies through M&A activity. In this case, the
large company can provide its resources to make the idea of the acquired start-up company
achieve even greater and/or more rapid market success than the start-up could attain otherwise.
Large firms have traditionally acted as lead buyers of startups’ products and services.
This has enabled startups to move well beyond consumer-oriented products and services (“B2C”)
and become critical game-changers in business-oriented (“B2B”) economic activities. Firms
ranging from Citibank to Chevron, which go well beyond the IT industry, are willing to buy
software and services from startups.
The development of information technology (IT) shows critical importance of large firms
as lead users of new technology (Cohen, DeLong et al. 2000). The historical pattern in the IT
industry has been that large firms often install computer systems to solve one type of problem—
such as airlines installing reservation management systems—only to discover that they can use
that information to completely reorganize the business. In the airline case, this meant discovering
that with reservations information, they could implement a new system of supply and demand
management to effectively route their airline routes to radically increase operating efficiency.
Beyond purchasing the products and services of startup firms, large firms actively
purchase startup firms themselves. This can be a way to acquire not only a specific service or
technology, but also to acquire the entire capabilities of the firm to create the next new offerings.
It also precludes rivals from obtaining it as well.
Table 2: Venture Backed Merger & Acquisitions by Year
Year Number
Total
Number
Known
Price ($Mil) Average
($Mil)
Mean time
to Exit
(Years
Median
Time to Exit
(Years)
1985 7 3 300.2 100.1 7 4.8
1986 8 1 63.4 63.4 3.4 3.5
1987 11 4 667.2 166.8 4.9 3.5
1988 17 9 920.7 102.3 4.7 4.1
1989 21 10 746.9 74.7 4.3 3.6
1990 19 7 120.3 17.2 5.8 5.5
1991 16 4 190.5 47.6 6 5
1992 69 43 2119.1 49.3 4.7 4
1993 59 36 1332.9 37 5.3 4.7
1994 84 57 3208.4 56.3 5.8 5.3
1995 92 58 3801.8 65.5 4.6 4.1
1996 108 76 8230.8 108.3 5.2 4.1
1997 145 100 7798 78 4.5 3.1

9
1998 189 113 8002 70.8 4.5 2.8
1999 228 155 38710.6 249.7 3.6 2.8
2000 379 245 79996.4 326.5 3.2 2.7
2001 384 175 25115.6 143.5 3 2.2
2002 365 166 11913.2 71.8 3.5 2.9
2003 323 134 8240.8 61.5 4.3 3.6
2004 402 199 28846.1 145 5 4.6
2005 446 201 19717.3 98.1 5.4 5.2
2006 484 208 24291 116.8 5.7 5.7
2007 488 201 30745.5 153 5.8 6.3
2008 417 134 16236.9 121.2 5.8 5.6
2009 351 109 12364.9 113.4 5.7 5.5
2010 523 150 17707.3 118 5.8 5
2011 490 169 24093.2 142.6 5.8 5
2012 473 132 22694.2 171.9 6.2 5.6
2013 376 94 16586.5 176.5 5.9 5
Source: National Venture Capital Association (NVCA)
Large firms that have grown from successful startups themselves are particularly
prominent acquirers. For example, Cisco Systems used M&A to rapidly acquire new
technologies and capabilities, without owning its own manufacturing facilities.2 It purchased
nine startups in 1998, 23 in 2000, and 11 in 2012. It also chose to outsource virtually all of its
manufacturing, focusing on design and freeing it from owning and operating physical
manufacturing facilities.
Table 3: Selected Large M&A in 2014 Involving Startups
Firm Sold Acquired By Estimated
Amount
Service Description
WhatsApp Facebook $22 billion Free mobile messenger and social networking app
Trulia Zillow
(Merger)
$3.5 billion Online real estate portal
Nest Labs Google $3.2 billion Internet controlled thermo-stats/smoke alarms with
extensive data collection
Beats Electronics Apple $3 billion High-end headphone manufacturer with online
music store
2 Sturgeon (2002) calls this “modular production,” describing how the American model of production was
shifting towards one of modular production networks, with large companies limiting their core activities
and making use of outsourced R&D and manufacturing.

10
Oculus Facebook $2 billion Virtual reality headsets
Twitch Amazon $970 million Gaming video platform
Viber Rakuten $900 million Free messenger/phone call app
Divide Google $120 million Mobile productivity app
Convertro AOL $101 million Cross-platform advertising analytics software
Source: Quittner “2014 Was Cash-Out Time for Plenty of Startups.” (http://www.inc.com/jeremy-quittner/ten-top-
exits-of-2014.html)
2.2.2. Highly competitive industries, balancing between “open innovation” and secret
protection
Silicon Valley itself has extremely competitive industries. Competition among startups is
intense and cutthroat. Moreover, while they benefit immensely from large firms’ “open
innovation” practices that allow them to sell their offerings and often the company itself to large
firms, it is also balanced by intense secrecy.
The practice of “open innovation” is relatively new. Until the 1980s, US large
corporations resembled what we now think of as the traditional Japanese large firm model.
Lifetime employment was the norm at large blue-chip companies such as IBM, HP, AT&T,
General Electric, oil companies, and the Big 3 auto companies, for example. The innovation
models were based on in-house R&D, with AT&T’s Bell Laboratories leading the way in basic
and applied research, investing a wide range of technologies including transistors, motion
pictures, television, stereophonic sound, and laser technology. CEO compensation was not tied to
companies’ share prices on the stock market, and institutional investors did not have a major say
in corporate governance. Companies tended to be vertically integrated, controlling most aspects
of their supply chains themselves.
After the oil shocks hit the US, and the US economy experienced years of stagnant
growth combined with inflation, many large US firms faced dire financial straits. They were
outcompeted by Japanese manufacturing firms, and the US economy seemed far from recovery.
In this context, large firms in the US that survived engaged in a major transformation of how
they operated.
IBM was perhaps the most dramatic example, as it neared bankruptcy in the late 1980s
and early 1990s. Its new CEO, Louis Gerstner, appointed in 1993, transformed many of the
operating tenets of the company, jettisoning the norm of lifetime employment, engaged in major
layoffs (about 100,000 in the first few years), and terminated or sold a wide variety of business
lines, focusing on core businesses. They began acquiring other companies and services,
departing from their longstanding norm of relying almost exclusively on in-house products and
11
services. IBM shut down its PC hardware division, and then later sold its notebook PC division.
It halted development of its operating system (OS/2) that was losing badly to Windows despite
many arguing that it was a technically superior product. Gerstner, who was recruited from
outside the company after successfully turning around American Express, replaced a CEO that
had been promoted from within IBM, as had many of the top managers. He was also one of the
earliest CEOs to receive a very large compensation package, tied to the company’s performance
and aligned with the interest of shareholders. The fortunes of IBM then turned around, and it
retained a strong position in the IT industry, though never dominant as it had been during the
postwar era of mainframe computers (Lazonick 2009).
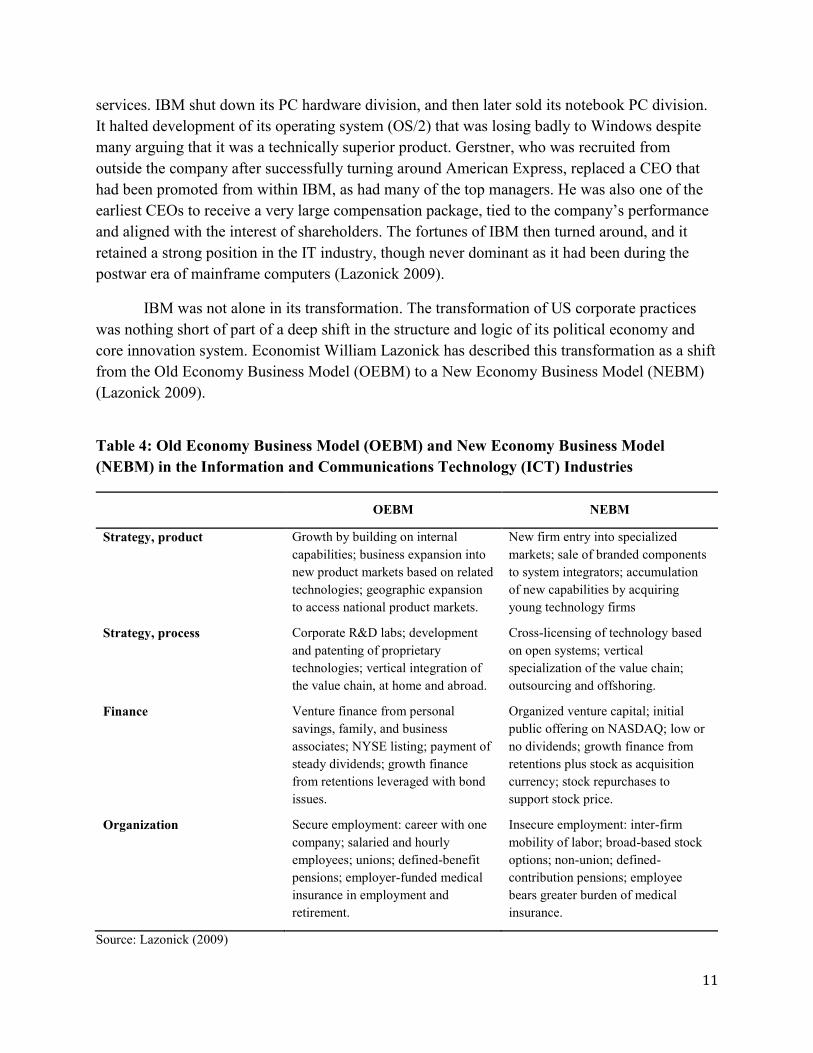
IBM was not alone in its transformation. The transformation of US corporate practices
was nothing short of part of a deep shift in the structure and logic of its political economy and
core innovation system. Economist William Lazonick has described this transformation as a shift
from the Old Economy Business Model (OEBM) to a New Economy Business Model (NEBM)
(Lazonick 2009).
Table 4: Old Economy Business Model (OEBM) and New Economy Business Model
(NEBM) in the Information and Communications Technology (ICT) Industries
OEBM NEBM
Strategy, product Growth by building on internal
capabilities; business expansion into
new product markets based on related
technologies; geographic expansion
to access national product markets.
New firm entry into specialized
markets; sale of branded components
to system integrators; accumulation
of new capabilities by acquiring
young technology firms
Strategy, process Corporate R&D labs; development
and patenting of proprietary
technologies; vertical integration of
the value chain, at home and abroad.
Cross-licensing of technology based
on open systems; vertical
specialization of the value chain;
outsourcing and offshoring.
Finance Venture finance from personal
savings, family, and business
associates; NYSE listing; payment of
steady dividends; growth finance
from retentions leveraged with bond
issues.
Organized venture capital; initial
public offering on NASDAQ; low or
no dividends; growth finance from
retentions plus stock as acquisition
currency; stock repurchases to
support stock price.
Organization Secure employment: career with one
company; salaried and hourly
employees; unions; defined-benefit
pensions; employer-funded medical
insurance in employment and
retirement.
Insecure employment: inter-firm
mobility of labor; broad-based stock
options; non-union; defined-
contribution pensions; employee
bears greater burden of medical
insurance.
Source: Lazonick (2009)
12
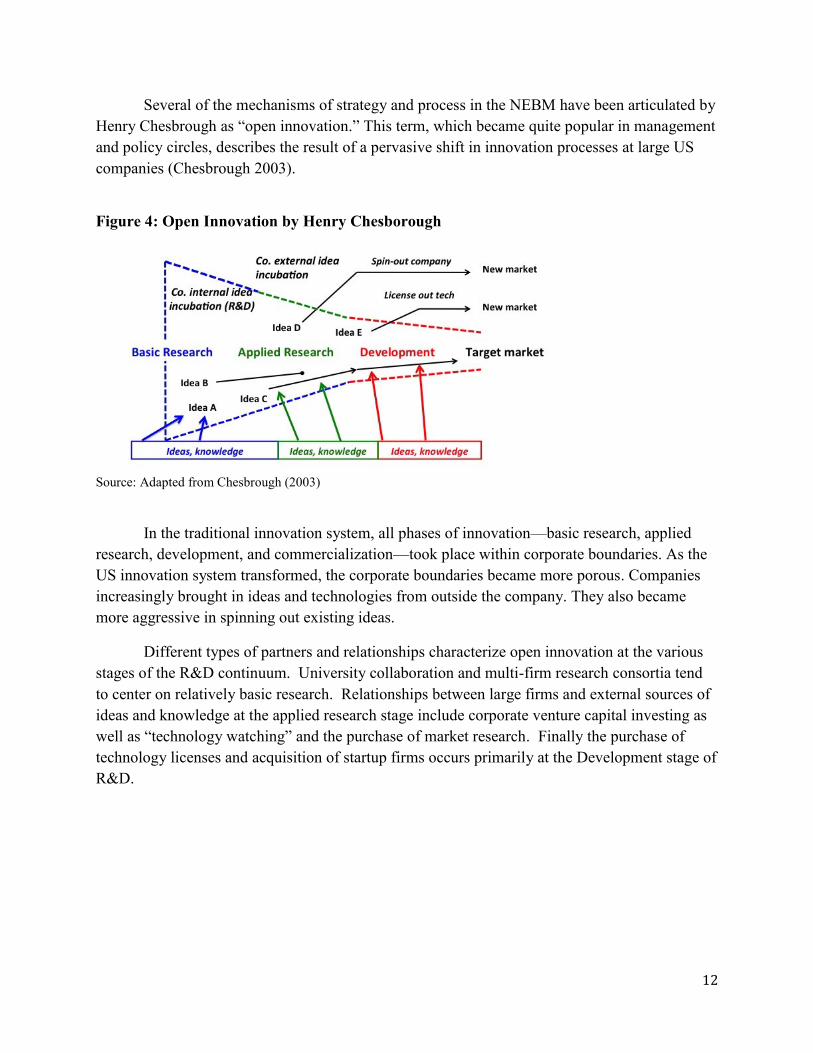
Several of the mechanisms of strategy and process in the NEBM have been articulated by
Henry Chesbrough as “open innovation.” This term, which became quite popular in management
and policy circles, describes the result of a pervasive shift in innovation processes at large US
companies (Chesbrough 2003).
Figure 4: Open Innovation by Henry Chesborough
Source: Adapted from Chesbrough (2003)
In the traditional innovation system, all phases of innovation—basic research, applied
research, development, and commercialization—took place within corporate boundaries. As the
US innovation system transformed, the corporate boundaries became more porous. Companies
increasingly brought in ideas and technologies from outside the company. They also became
more aggressive in spinning out existing ideas.
Different types of partners and relationships characterize open innovation at the various
stages of the R&D continuum. University collaboration and multi-firm research consortia tend
to center on relatively basic research. Relationships between large firms and external sources of
ideas and knowledge at the applied research stage include corporate venture capital investing as
well as “technology watching” and the purchase of market research. Finally the purchase of
technology licenses and acquisition of startup firms occurs primarily at the Development stage of
R&D.

13
Figure 5: Open Innovation and Sources of Ideas, Stages of Investment
Source: Dasher (2013)
2.2.3. High financial returns for successful entrepreneurs and startups’ early employees
Successful entrepreneurs and early employees expect high financial returns. Pay schemes
such as stock options were initially devised as mechanisms to lure employees away from stable
large firm jobs, and M&A and IPO activity enable high returns. The potential for high growth
yielding high return is an important incentive in offsetting the intrinsically high risk of starting a
new firm.
2.2.4. Finance and participation in governance of startups by venture capitalists
Silicon Valley has the world’s largest, highly sophisticated, and extremely competitive
venture capital market. The US has the world’s largest venture capital market, and in 2014,
Silicon Valley (including San Francisco) accounted for 43% of all venture capital investments in
the U.S (NVCA 2014). Not only does the amount of available funding benefit start-ups in Silicon
Valley, but the extra value that venture capitalists provide such as interpersonal networks for
startups’ key early employees and staff, and introductions to potential customers and buyers of
the firm are all important functions they provide beyond financing. The venture capital industry
in Silicon Valley benefits greatly from the angel investor community in the region, which
accounted for about 85% of all angel investments in California in 2014 (JVSV 2015). Their
initial screening of potential startups provides a critical monitoring mechanism. In Silicon
Valley, angel investors and VCs often take a hands-on approach in making significant
adjustments to growth strategy, sometimes bringing new managers to the company.
Venture capital (VC) is at the core of Silicon Valley financial system. Metrick and
Yasuda (2011) list five defining of characteristics of a venture capital.

14
1. A VC is a financial intermediary.
2. A VC invests in private companies.
3. A VC takes an active role in monitoring and helping the portfolio companies.
4. A VC’s primary goal is to maximize its financial return by exiting investments.
5. A VC funds the internal growth of companies.
First, a VC is a financial intermediary, which collects funds from investors and invests in
a portfolio of companies. At this level, a VC is not different from any other financial
intermediaries such as commercial banks, which take deposits and make loans. A VC is
different from other financial intermediaries on both funding mechanism and investment scheme.
On funding side, a VC is typically organized a limited partnership. A VC company starts a fund
as the general partner (GP) and solicits other investors to become limited partners (LP). LPs are
typically large pension funds and corporations. The contract between GP and LP is written to
give an appropriate incentive for GP to monitor the companies invested by the fund. On
investment side, a VC typically receives convertible preferred shares in the portfolio companies.
A convertible preferred share before the conversion is somewhat like bank loans:
predetermined dividends accrue to what the company owes to the investors. This feature gives a
VC fund a limited protection from downside risk. If the startup turns out not to be very
profitable, the value of equity may be close to zero, but the VC can receive accrued dividends. If
the startup turns out to be not profitable at all, which happens very often, then the VC does not
get anything, so the VC funding is still a lot riskier than the bank loans. If the startup turns out to
be very successful, the VC can convert the preferred shares into common shares and exit through
IPOs or sales to other companies. In this case, venture capitalists can enjoy substantial capital
gains. Thus, the use of convertible preferred shares allows VC funds to gain from upside risk
while providing some protection from downside risk.
Second, a VC invests only in the private companies. This makes a VC a type of private
equity. Unlike public companies, which have securities valued in formal markets, the
information on private companies is not easily available. This means that the growth potential
for the private companies is not known to general investors. This is where VCs derive great
upside value (Kenney and Florida 2000).
Even to VCs, it is difficult to get full information about private companies. This leads to
the third defining characteristic. VCs do not only provide money but actively monitor and help
startups. VCs often take representation on the firm’s board, sometimes becoming chairman (see
Box 1). By active monitoring, VCs reduce the problem of information asymmetry between them
and the portfolio companies. It is not coincident that many VCs were started by successful
entrepreneurs themselves and focus on particular industries where they have expertise and are
able to perform as competent monitors.

15
Box 1: Examples of “Hands-on” VC for a startup firm
For example, a Japanese startup at an early stage of development that entered Silicon Valley
offering specialized Japanese and Chinese language document search services for law firm during
litigation—which can create the need to search through hundreds of thousands of documents, benefitted
greatly from VC-introduced personnel. Since its services were marketed towards law firms, it became
quickly obvious to the VC that the firm needed to have the top sales manager be somebody who had
interpersonal networks into law firms. The VC appointed this type of person, who was far more effective
than his predecessor, leading to a rapid increase of sales.
In another example, the founder and president of a successful startup firm was frustrated when
the VC forced him to sell his company off to a larger competitor. The startup had been enjoying robust
growth, and was projected to catch up to the competitor in a few years if things continued smoothly, and
the employees had been motivated around the rallying call of catching up and surpassing the competitor.
However, the VC firm’s other investments were not performing as well as they had hoped. In order to
deliver sufficient returns to their limited partners (investors), the VC decided to exit this particular startup
and get the highest valuation it could. The sale was successful and the founder became wealthy, but when
interview a few years later he was still bitter that he was forced to sell his company at what he considered
too early due to the VC’s decision about other investment decisions.
Another mechanism to mitigate the informational problem is to make funding contingent
on achieving well-defined benchmarks (such as successful demonstration of a prototype product).
These benchmarks create a series of financing “rounds”: first round (or also called Series A) is
when a company receives the fund for the first time, which is followed by second round (Series
B), third round (Series C), and so on. The financing rounds are different from “stages” of startup
companies, which is discussed later.
Fourth, a VC’s goal is the maximization of financial returns. A VC tries to achieve this
by exiting investments. VC exits come in the form of sales or Initial Public Offerings (IPOs).
GPs have to realize gains to distribute to the LPs (Kenney and Florida 2000). Compensations for
GPs come in two forms. First, GP receives a fraction of committed capital (the amount of capital
the VC collected from partners) as the management fee every year as long as the VC fund exists.
The management fee typically starts at 2% but declines to lower levels in later years (Metrick
and Yasuda 2011). Second, GP receives a constant fraction of returns from the investment (exit
proceeds minus the committed capital). This is called the carried interest and it is typically 20
percent of the returns. The rest of the returns is distributed to LPs. The largest proportion of GP
compensation comes in the form of carried interest (Metrick and Yasuda 2011). This structure
gives GPs to maximize the financial returns on investment.
Finally, the proceeds a portfolio company receives from VCs are used to expand their
business, not to acquire other companies. This distinguishes VCs from other types of private
equity, such as buyout funds and distress funds.
16
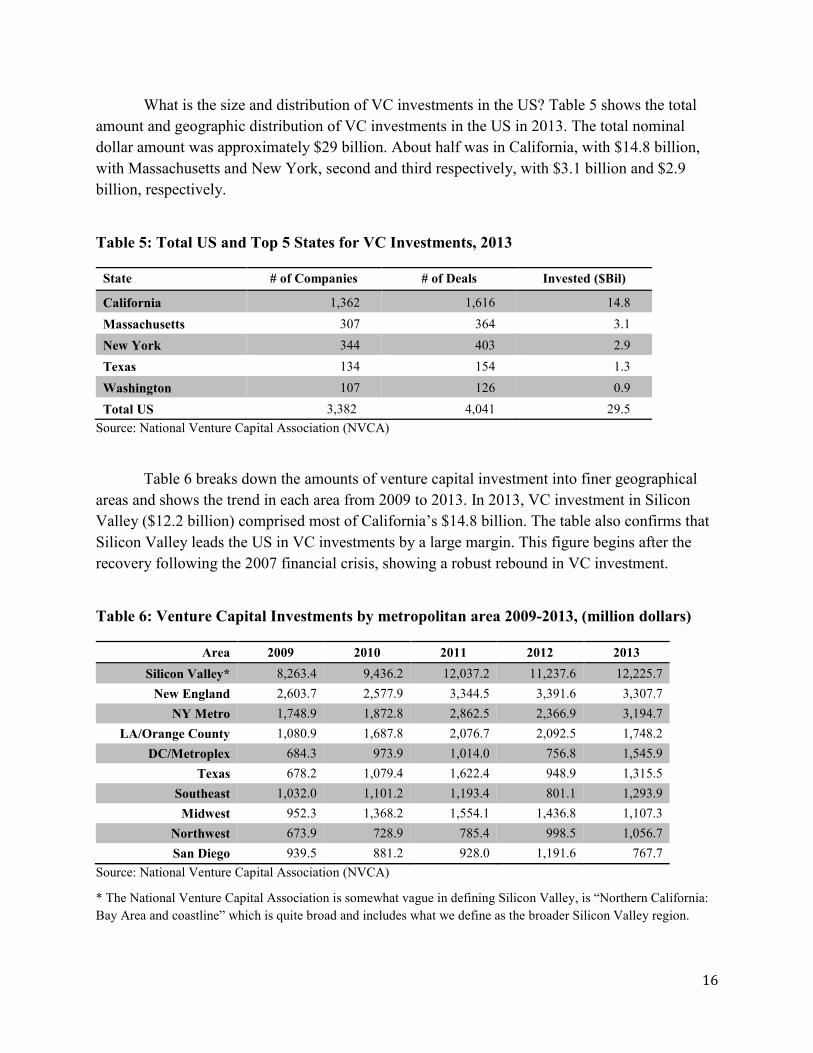
What is the size and distribution of VC investments in the US? Table 5 shows the total
amount and geographic distribution of VC investments in the US in 2013. The total nominal
dollar amount was approximately $29 billion. About half was in California, with $14.8 billion,
with Massachusetts and New York, second and third respectively, with $3.1 billion and $2.9
billion, respectively.
Table 5: Total US and Top 5 States for VC Investments, 2013
State # of Companies # of Deals Invested ($Bil)
California 1,362 1,616 14.8
Massachusetts 307 364 3.1
New York 344 403 2.9
Texas 134 154 1.3
Washington 107 126 0.9
Total US 3,382 4,041 29.5
Source: National Venture Capital Association (NVCA)
Table 6 breaks down the amounts of venture capital investment into finer geographical
areas and shows the trend in each area from 2009 to 2013. In 2013, VC investment in Silicon
Valley ($12.2 billion) comprised most of California’s $14.8 billion. The table also confirms that
Silicon Valley leads the US in VC investments by a large margin. This figure begins after the
recovery following the 2007 financial crisis, showing a robust rebound in VC investment.
Table 6: Venture Capital Investments by metropolitan area 2009-2013, (million dollars)
Area 2009 2010 2011 2012 2013
Silicon Valley* 8,263.4 9,436.2 12,037.2 11,237.6 12,225.7
New England 2,603.7 2,577.9 3,344.5 3,391.6 3,307.7
NY Metro 1,748.9 1,872.8 2,862.5 2,366.9 3,194.7
LA/Orange County 1,080.9 1,687.8 2,076.7 2,092.5 1,748.2
DC/Metroplex 684.3 973.9 1,014.0 756.8 1,545.9
Texas 678.2 1,079.4 1,622.4 948.9 1,315.5
Southeast 1,032.0 1,101.2 1,193.4 801.1 1,293.9
Midwest 952.3 1,368.2 1,554.1 1,436.8 1,107.3
Northwest 673.9 728.9 785.4 998.5 1,056.7
San Diego 939.5 881.2 928.0 1,191.6 767.7
Source: National Venture Capital Association (NVCA)
* The National Venture Capital Association is somewhat vague in defining Silicon Valley, is “Northern California:
Bay Area and coastline” which is quite broad and includes what we define as the broader Silicon Valley region.

17
Venture capital investments are commonly divided into stages. Today, venture capitalists
often specialize in a particular stage. The first round of funding for startups can often come from
wealthy investors known as “angels.” Angels are different from VCs in that they are not financial
intermediaries. Rather than raising funds from other investors, angels use their own funds to
invest in startups. The earliest stage of venture capital investments, known as seed funding, are
usually to start up and get the company going. Following that are early stage, expansion, and
later stage investments, according to the typology of the National Venture Capital Association.
Table 7 provides a sense of the relative magnitudes of VC investments in each stage.
Table 7: Venture Capital Investments by Stage (2006-2013), (million dollars)
Stage 2006 2007 2008 2009 2010 2011 2012 2013
Seed 1,292 1,837 1,923 1,735 1,676 1,079 836 966
Early 4,770 6,087 5,889 4,941 5,914 8,927 8,315 9,896
Expansion 11,124 1,066 10,725 6,841 8,707 9,829 9,447 9,814
Later 10,329 2,953 11,412 6,769 7,072 9,894 8,754 8,869
Total 27,515 11,943 29,949 20,286 23,369 29,730 27,352 29,545
Source: National Venture Capital Association (NVCA)
Venture capital had grown to a sizable industry by the early 1970s, propelled by
significant returns by prominent early VC firms. The pioneering venture capital-funded firm was
Fairchild Semiconductor, which was founded by a group of eight scientists (many with Stanford
backgrounds) who left Shockley Semiconductor. (The eight would end up founding 65 firms in
total.) When Fairchild was founded in 1957, the founders had relatively little equity shares,
contributing to the departure of Robert Noyce and Gordon Moore, who left in 1968 to found
Intel. Working closely with enterprising law firm Willson, Sonsini, Goodrich, and Rosati
(WSGR), who were specialized on startups, Intel gave founders significant equity, which became
the model for later startups (Kenney and Florida 2000).
Venture capital grew alongside the US postwar electronics industry, which experienced
waves of innovation characterized by Kenney and Florida (2000) as follows:
…even as one electronics sector stabilized with a dominant design, a stable set of market
participants, and a predictable incremental trajectory, new sectors appeared or the
dominant design experienced significant disruptions, often due to the invention of new
business models. (Kenney and Florida 2000, p.100)
As these waves of disruptive innovation began, venture capital started to evolve into its
present form, with venture capitalists investing in portfolios with the understanding that the
majority would fail, with just a few rapid growth companies from which they could benefit.

18
By the late 1970s, pension funds became major investors into venture capital funds. This
was mainly driven by a regulatory change. The Employment Retirement Income Security Act
(ERISA) of 1974 prohibited corporate pension funds from holding financial assets that are
deemed too risky. In 1978, however, the US Labor Department allowed pension funds to assess
investment risk at portfolio level, opening a way for pension funds to invest in venture capital
and other types of private equity if they can show the overall risk of the entire portfolio is not
high. This dramatically increased inflow of funds to venture capital and contributed to the rapid
growth of the VC and other private equity funds.
Typically, even for start-ups at the Seed Stage, venture capital firms are not the first
investors. Instead, the first investor(s) are so-called angel investors. Unlike venture capital firms,
which are professional investment corporations that put together funds from multiple limited
partners (that may include financial institutions and other commercial entities, as well as wealthy
individuals), angel investors are individuals who are investing their own funds in startup
companies. While venture capital investments in Silicon Valley (including San Francisco)
totaled about $14.5 billion in 2014, angel investments in the region are estimated to reach $3.3
billion in 2014 (NVCA 2014). The Silicon Valley angel investor community has long comprised
an active network that shares best practices and information about investment opportunities.
Well-known associations such as the Sand Hill Angels (http://www.sandhillangels.com/) and
Band of Angels (https://www.bandangels.com/) demonstrate the professional approach that angel
investors in Silicon Valley take toward due diligence as well as positive mentoring of their
invested companies. Although venture capital in Japan has grown greatly in recent years, a
professional angel investor community still represents a missing link in the continuum for
financing entrepreneurial innovation there.
As elsewhere in the U.S., banks in Silicon Valley may require an entrepreneur to sign a
personal guarantee for a loan made to their start-up company. Such guarantees put the
entrepreneur’s personal assets at risk and greatly increase the cost of failure. Nevertheless,
because banks in Silicon Valley must compete against other sources of venture funding, e.g.
angel investors, personal guarantees appear to be less widely used than in other regions in which
entrepreneurs have fewer alternatives.
2.2.5. High level and diverse human resources for all stages of startups
Silicon Valley enjoys an extremely deep human resources pool in which people from all
over the world come. In 2004, 36.3% of the people in Silicon Valley were foreign-born (JVSV
2015). Moreover, the Silicon Valley labor force includes people who have deep expertise in
every stage of a startup, from initial startup to rapid growth, to increasing maturity. Taking a
vision to make a company is the only the first step—expertise to manage a rapid growth startup
into a mid-sized firm and on into a large firm requires different sets of expertise, and Silicon
Valley’s long history of growing companies has led to people who have focused their careers on
particular stages of company growth.

19
The performance of Silicon Valley’s job market, including San Francisco, is in stark
contrast to that of the rest of the US, and that of California in general. As seen in Figure 6, the
job growth in San Francisco County from the second quarter of 2007 to the second quarter of
2013 was 10 percent. Santa Clara and San Mateo Counties job growth during the same time
period was 3.9%. This compares to a contraction of 2.2% for California as a state, and 1.4% for
the US overall.
Figure 6: Relative Job Growth In Silicon Valley and San Francisco vs CA, USA
Source: Joint Venture Silicon Valley (2014) Silicon Valley Index 2014, citing US Census Bureau
The positive role of immigrants, particularly those with high-end skills, has been a
dramatic feature of Silicon Valley. To take a recent snapshot, the percentage of foreign born
population in Silicon Valley was 36.4% in 2012, exceeding that of California overall (27%), and
is almost three times that of the US average (13%).
+3.9%
+10.1%
-1.1%
-2.2% -1.4%
96
98
100
102
104
106
108
110
112
�Q2 2007 �Q2 2013
To
tal J
ob
s R
ela
tive
to
Q2
20
07
(1
00
=Q
2 2
00
7
Va
lue
)
Relative Job Growth
Santa Clara and SanMateo Counties
San Francisco County
Alameda County
California
United States

20
Figure 7: Total population who are foreign born
Source: Joint Venture Silicon Valley (2014). Silicon Valley Index 2014, citing US Census Bureau
Saxenian (1994) argues that Silicon Valley has continually benefited from flows of
immigrants from various areas of the world that create bridges with the economies of their home
countries. Silicon Valley enjoys ties to places such as Israel and their strong software and
intellectual property creation. Cross-national production networks with places like Taiwan also
evolved. Entrepreneurs and scientists from Silicon Valley created fab-less semiconductor plants
in Taiwan and this allowed Silicon Valley to specialize on design.3 Flow of people from India
created the ties that enabled business process outsourcing.
2.2.6. High labor mobility
Labor mobility in Silicon Valley is higher than other areas of the country, and is
particularly high in the information technology industries. High labor mobility reduces the risk
of joining a start-up company. A fluid labor market is also important for the rapid scaling up that
successful start-up companies must accomplish in order to meet investor expectations. The
highly mobile labor market has led to focus on short term incentives as well as performance
based measures to encourage loyalty (e.g. stock options); consequently, wages have risen
3 Chenming Hu illustrates this. After an undergraduate degree in National Taiwan University, he pursued
a PhD in UC Berkeley, receiving it in 1973, and becoming faculty in the Electrical Engineering and
Computer Science department in 1976. He was a decorated academic, making critical advances in
semiconductors, publishing 4 books and over 900 papers, including co-authored ones, with over 140
patents granted. He founded a semiconductor design company in the 1990s, and become CTO of TSMC,
the world’s largest fabless semiconductor firm in Taiwan in the early 2000s.
36.4%
27.1%
13.0%
0%
5%
10%
15%
20%
25%
30%
35%
40%
Silicon Valley California United States
Percentage of the Total Population Who Are Foreign Born (2012)

21
considerably. During the recovery period (since 2010), average wages in Silicon Valley, San
Francisco, and California increased (by 9.4%, 5.2%, and 1.4%, respectively), outpacing inflation
(JVSV 2015). Moreover, even top management talent, such as top executives of firms such as
Google, can move to other firms such as Facebook or become founders of firms such as Twitter,
revealing how talent can move around at all levels. These positive effects of high labor mobility
reflect that the human capital relevant in Silicon Valley is general (not firm-specific) and is
invested by the workers themselves.
2.2.7. Top class universities
Globally top-class research universities, Stanford University and University of California
(UC Berkeley and UC San Francisco Medical Center) anchor Silicon Valley in scientific and
applied research, forming communities of expertise and interpersonal networks that continue to
drive innovations in the region. These research universities were instrumental in developing
Silicon Valley in the first place, and they derived benefit from being in or near Silicon Valley to
remain globally leading universities. The universities provide focal points of human resource
clusters.
Top talents from all over the world have come to Silicon Valley through universities,
firms, and temporary immigration visas. Historically younger than East Coast counterparts,
Stanford and UC Berkeley populated their faculty with top immigrants, who came in various
waves throughout the past century—Europeans, South Asians, and various Asians (Saxenian
2006).
The university-industries ties that contribute to the Silicon Valley ecosystem are
multifaceted, diverse, and not easily captured by a single set of metrics. This in itself has caused
much confusion for actors wishing to learn about Silicon Valley. This is partly because of the
close relationship between the multifaceted university-government ties that anchor much of the
university-industry ties.
The core research universities are Stanford University and the University of California.
Among the University of California schools, UC Berkeley and UC San Francisco Medical Center
are within the broader Silicon Valley region, with UC Davis also playing an important role,
particularly in agricultural science. Other universities in the area include Santa Clara University,
San Jose State, San Francisco State, University of San Francisco, and numerous community
colleges. These other universities play an important role in the Silicon Valley ecosystem by
providing large numbers of tech-savvy graduates to the workforce, but here we focus on Stanford
and UC.
There is a pervasive image that funding often flows from the government and industry
into major research universities, which then patent commercializable technologies and inventions
through a technology licensing office, which then spins out the intellectual property into the
commercial sector, deriving major revenue for the university. The image of this system as

22
successful has led to policies by governments around the world imitating it. As we will see
below, this image is misleading. This simple model is not as successful as it may seem from the
outside. The major successful research universities in Silicon Valley have far more complex and
multidimensional relationships to industry. Therefore, simply copying this image of a
“technology licensing office-centric university-industry coordination model” is not likely to
succeed elsewhere.
The US academic technology licensing model was legislated in 1980 with the Bayh-Dole
Act, also known as the Government Patent Policy Act of 1980. It was passed in the context of
grave concerns about the economic competitiveness of the US as its economy suffered from
recessions and stagflation following the oil shocks beginning in 1971. The Bayh-Dole Act
allowed the ownership of an invention from federal research funding to reside with the university,
small business, or non-profit organization. Previously, ownership was required to go to the
federal government. Given the government’s $75 billion or so budget assigned to research in the
1970s, this was a game-changer, providing strong economic incentives to commercialize the
products of research (Stevens 2004).
After the Bayh-Dole was enacted, research universities almost all established technology
transfer offices that aimed to become a central hub for patents from universities and to negotiate
licensing arrangements with industry. The degrees to which these were successful are mixed. We
will introduce specific Stanford examples below, but a few notable points should be emphasized.
The university-industry relationships are multi-faceted and complex. Universities and
industry in Silicon Valley interact in all the following areas: licensing, academic spin-offs,
collaborative research, contract research, consulting, ad-hoc advice and networking for
practitioners, teaching, personnel exchanges, and student supervision (Grimaldi, Kenney et al.
2011). Almost all of these mechanisms are outside “the technology transfer office centered
coordination” model.
Industry visitors spending time in universities, and university faculty and researchers
taking sabbaticals or other time to spend in company labs are common mechanisms of
bidirectional exchange.
In an analysis of the origins of Silicon Valley, Lécuyer (2006) notes the critical
importance of the bidirectional ties between university and industry. He show how Stanford
researchers relied heavily on technologies developed in Silicon Valley to advance their own
research. Only by having close relations with cutting edge industry, whose personnel they could
invite to Stanford as collaborators, were Stanford researchers able to make technological
innovations of their own, while training engineers to become the workforce of the newest
technologies. Stanford and UC Berkeley provided much of the basis for Silicon Valley, but they
could not have done so without feedback loops from Silicon Valley helping them stay at the
forefront of industry.

23
This is a point echoed by Kenney and Mowery (2014) analyzing the role of University of
California schools in their respective economies, such as Silicon Valley, San Diego, Los Angeles,
Santa Barbara, and Davis (and Napa Valley). The industry environment surrounding the
university was critical in shaping how the universities could contribute to local economic
development (Lécuyer 2014). They point out that university-industry ties are not a one-way
street with university technologies harvested by industry, but that successful universities depend
on effective ties with the surrounding industry.
In fact, while developing Stanford into a world-class research university in the 1950s,
Dean and later Provost Fredrick Terman explicitly made efforts to encourage faculty to tackle
problems that were facing industry, which could possibly lead to major breakthroughs if
theoretical problems were solved. Subsequent breakthroughs in solid-state physics and other
areas drove the revolution from vacuum tubes to semiconductors, placing Stanford at the center
of the computer revolution from the 1960s onward.
Another channel for bidirectional university-industry interaction at Stanford is corporate
affiliate programs. Such programs are scattered throughout the university, which includes 7
schools: Business, Earth Sciences, Education, Engineering, Humanities and Sciences, Law, and
Medicine. They serve as a platform for real-time industry involvement with university research,
including strategic discussions between corporate executives and faculty, industry expert
mentoring of Ph.D. student research, and channels for arranging student internships in the
companies. Many of the corporate affiliate programs include the ability for corporate sponsors
to send researchers into university labs. Engaging in joint research with PhD students can give
them access to valuable employment recruitment opportunities. For professors, having corporate
affiliate sponsors can help employ PhD students in their lab. This can enable a virtuous cycle of
professors engaged in important areas of research getting a large number of corporate affiliate
sponsors who can fund a large number of PhD students, which in turn enables the professor to do
more research in the area, thereby attracting more corporate sponsors. UC Berkeley, the other
core of Silicon Valley, was the first UC campus to enter semiconductor research, with a former
Bell Labs engineer establishing the first integrated circuits laboratory at any US university.4
Faculty interested in semiconductors took sabbaticals in Silicon Valley firms, transferring
innovative designs to industry, facilitating the hiring of students by local startups, and licensing
intellectual property (Lécuyer 2014).
Technology licensing office at Stanford University is commonly considered the most
successful in the U.S. The Office of Technology Licensing was established in 1970, and over
10,000 patents and invention disclosures have come to the office since then, with approximately
4200 licenses. Of those, about 1200 are active. While approximately $1.66 billion has been
4 Donald Pederson received a PhD from Stanford University in electrical engineering in 1951, working
for Bell Laboratories until 1955, when was hired by UC Berkeley’s department of Electrical Engineering
and Computer sciences.

24
generated by royalties—which sounds like a very large number—it turns out that over $1.0
billion came from only three big inventions. In short, three out of ten thousand were big winners,
generating 2/3 of all income over the course of 44 years. Only 33 cases generated over $5
million, with 87 generating $1 million or more in royalties. In 2014, there was approximately
$108 million in royalty revenue; 644 inventions generated income, but only brought in royalties
of over $100,000, with 6 cases bringing in $1 million or more. The legal expenses were a
staggering $9.8 million, just under 10% of the revenue (OTL 2014).5
These amounts may seem large, but put in perspective, Stanford University’s total
operating budget for FY 2012-2013 was $4.4 billion. It received $1.27 billion in sponsored
research, with 84% of that coming from government sponsors. The industry affiliate programs,
of which the campus has 56, generated $193 million. The university’s endowment was $17
billion, and pre-specified returns from investments of the endowment can be used toward
operating expenses.6
Yet, income from licenses and patenting is clearly not the primary reason Stanford and
UC Berkeley engage in these activities and encourage technology transfers to industry. The value
lies in the long-term relationships with industry that ensure that faculty and research are defining
cutting edge new technological trajectories. This gives faculty competitiveness for the next round
of federally funded research, which is actually the main portion of the university’s research
income, as covered in the next section (Lenoir 2014). Strong university-industry ties can also
anchor relationships that can lead to philanthropic gifts. In 2001, for example, Stanford received
a $400 million gift from the Hewlett Foundation, set up by Hewlett-Packard co-founder William
Hewlett; Stanford’s total gift income from FY 2012 was over $1 billion.
Strong industry university ties can also lead to new private-public partnerships, such as
the $500 million, ten year contract between BP and primarily UC Berkeley, which led to the
creation of a new Energy Biosciences Institute.
Academic entrepreneurship is a focal point for much of the discussion around the Silicon
Valley ecosystem that other areas try to emulate.
Stanford University was ranked first in Forbes’ most entrepreneurial research universities
in the US for 2014. The ranking was based on their entrepreneurial ratio (the number of alumni
and students who identified themselves as founders and business owners on LinkedIn divided by
the school’s total graduate and undergraduate students).7 The same survey ranked UC Berkeley
as third in the U.S. Pitchbook (a database for M&A, private equity, and venture capital) created
a list of schools whose alumni founded VC-funded companies between 2010 and the third 5 Stanford Office of Technology Licensing Annual Report 2013.
http://otl.stanford.edu/documents/otlar13.pdf 6 http://facts.stanford.edu
7 http://www.forbes.com/sites/liyanchen/2014/07/30/startup-schools-americas-most-entrepreneurial-
universities/

25
quarter of 2013. Stanford leads with 190 companies, and UC Berkeley is second with 160
companies.8
Neither Stanford nor Berkeley has explicit incentives for faculty or students to become
involved in entrepreneurship. Entrepreneurship is instead viewed as a way to retain high quality
faculty by allowing them to pursue their business interests while remaining at the university.
Being involved in entrepreneurship can also be a way to maintain a strong connection with
working on cutting edge areas and help with faculty’s teaching and research (Lenoir 2014).
2.2.8. Extensive government role in shaping technological trajectories and basic science
While many entrepreneurs tend to downplay the role of government, government R&D
funding was critical to the establishment of Silicon Valley, and the government continues to fund
much basic and applied research in the area. Some have referred to government R&D funding as
a “de facto” industrial policy. Local governments in Silicon Valley have likewise helped to
create a favorable environment for entrepreneurial activity through the establishment of
incubators and ombudsman-like offices that help start-up companies navigate their way among
government regulations that are often complex.
A crucial point in understanding the roles of government in Silicon Valley is that there is
no “Silicon Valley” government. Silicon Valley was not created by strategic government policy.
Instead, it developed organically. This does not mean that particular characteristics of Silicon
Valley cannot be duplicated elsewhere by government efforts. However, it does mean that there
is no particular set of “best practice” strategies that built Silicon Valley, which can be directly
exported to other governments.
The role of the US Federal government in funding Silicon Valley startups has already
been discussed above. An important facet to emphasize is that the major research programs by
the US government, through institutions such as the National Institute of Health, National
Science Foundation, and the military, have exerted substantial influence on the trajectory of
scientific inquiry. Universities have played a crucial role in transforming government
investments into scientific knowledge, which is then taken by industry and applied towards
commercial ends.
The two significant federal government policy shifts for the growth of Silicon Valley
venture capital were the relaxation of pension fund investment criteria and drastic cut in the
capital gains tax. The capital gains tax was lowered from 49.5% to 28% in the 1978 Revenue Act.
The early venture capitalists and American Electronics Association strongly supported this bill.
The relaxation of ERISA (Employment Retirement Income Security Act) restrictions in
1978 by the US Labor Department under the “prudent man rule” allowed corporate pension
8 http://www.geekwire.com/2013/top-universities-producing-vcbacked-entrepreneurs/
26
funds to invest in venture capital, which was among the riskier asset classes. Pension funds
quickly became the prime funder of venture capital, rising from $100-200 million per year in the
1970s, to over $4 billion by the late 1980s (Kenney and Florida 2000).
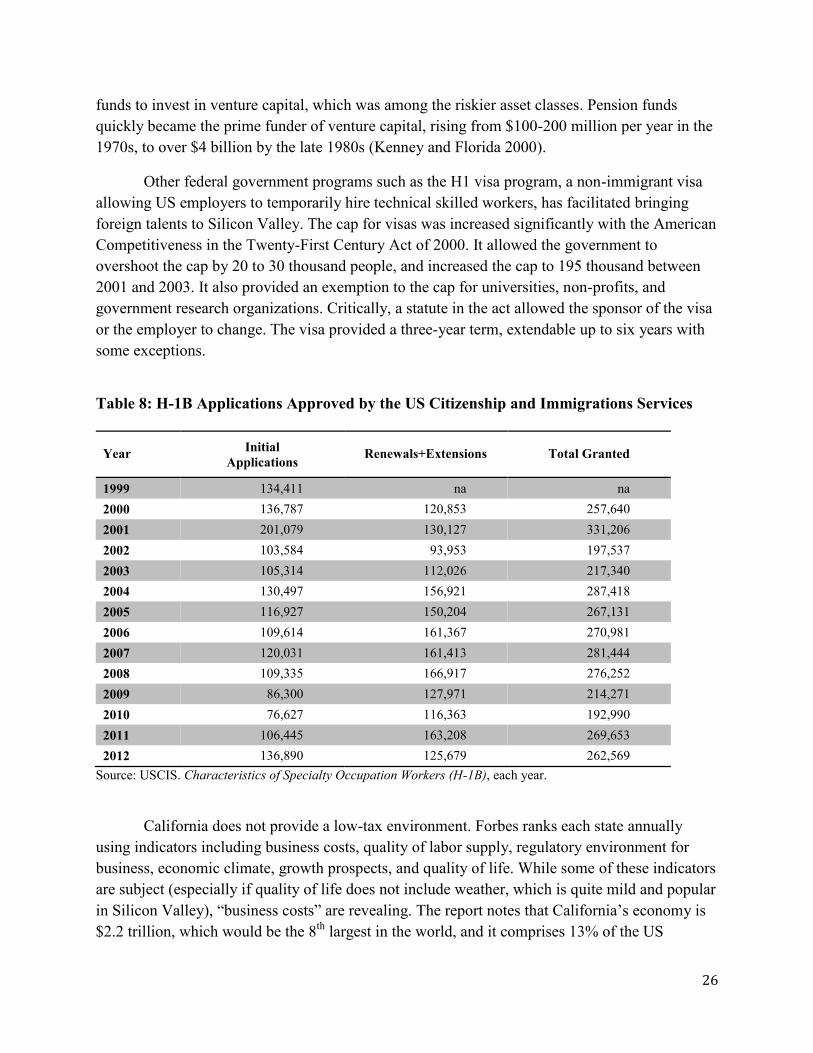
Other federal government programs such as the H1 visa program, a non-immigrant visa
allowing US employers to temporarily hire technical skilled workers, has facilitated bringing
foreign talents to Silicon Valley. The cap for visas was increased significantly with the American
Competitiveness in the Twenty-First Century Act of 2000. It allowed the government to
overshoot the cap by 20 to 30 thousand people, and increased the cap to 195 thousand between
2001 and 2003. It also provided an exemption to the cap for universities, non-profits, and
government research organizations. Critically, a statute in the act allowed the sponsor of the visa
or the employer to change. The visa provided a three-year term, extendable up to six years with
some exceptions.
Table 8: H-1B Applications Approved by the US Citizenship and Immigrations Services
Year Initial
Applications Renewals+Extensions Total Granted
1999 134,411 na na
2000 136,787 120,853 257,640
2001 201,079 130,127 331,206
2002 103,584 93,953 197,537
2003 105,314 112,026 217,340
2004 130,497 156,921 287,418
2005 116,927 150,204 267,131
2006 109,614 161,367 270,981
2007 120,031 161,413 281,444
2008 109,335 166,917 276,252
2009 86,300 127,971 214,271
2010 76,627 116,363 192,990
2011 106,445 163,208 269,653
2012 136,890 125,679 262,569
Source: USCIS. Characteristics of Specialty Occupation Workers (H-1B), each year.
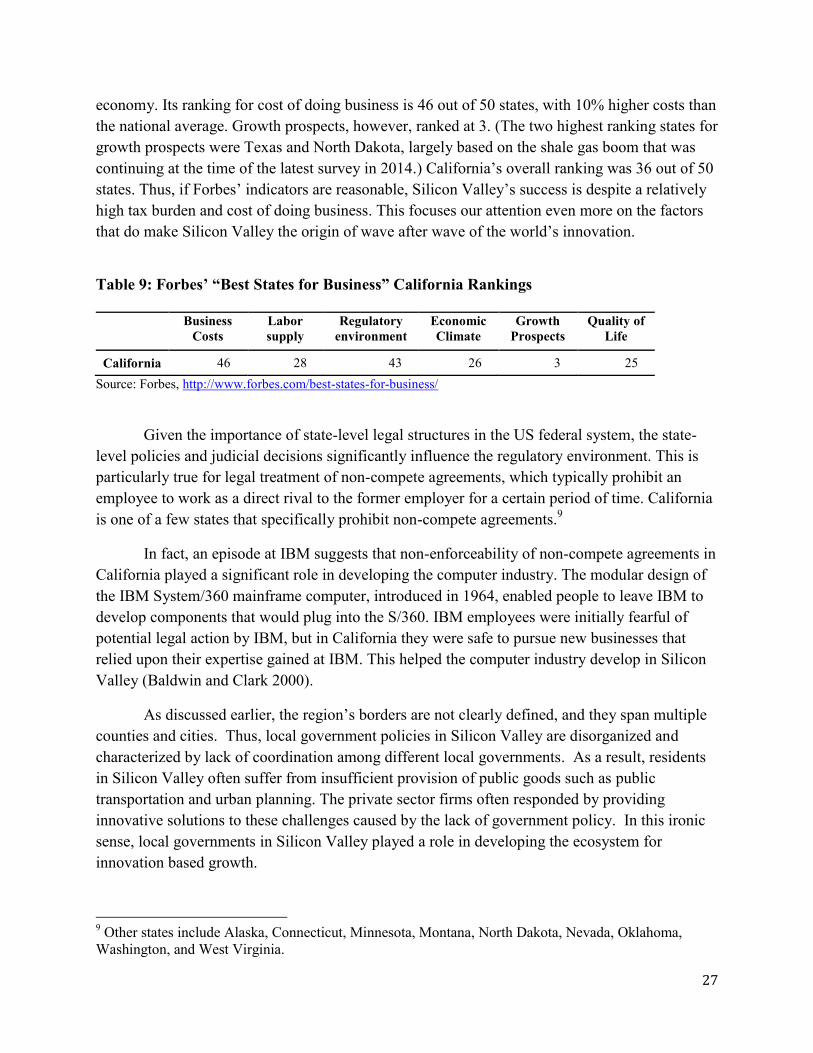
California does not provide a low-tax environment. Forbes ranks each state annually
using indicators including business costs, quality of labor supply, regulatory environment for
business, economic climate, growth prospects, and quality of life. While some of these indicators
are subject (especially if quality of life does not include weather, which is quite mild and popular
in Silicon Valley), “business costs” are revealing. The report notes that California’s economy is
$2.2 trillion, which would be the 8th
largest in the world, and it comprises 13% of the US
27
economy. Its ranking for cost of doing business is 46 out of 50 states, with 10% higher costs than
the national average. Growth prospects, however, ranked at 3. (The two highest ranking states for
growth prospects were Texas and North Dakota, largely based on the shale gas boom that was
continuing at the time of the latest survey in 2014.) California’s overall ranking was 36 out of 50
states. Thus, if Forbes’ indicators are reasonable, Silicon Valley’s success is despite a relatively
high tax burden and cost of doing business. This focuses our attention even more on the factors
that do make Silicon Valley the origin of wave after wave of the world’s innovation.
Table 9: Forbes’ “Best States for Business” California Rankings
Business
Costs
Labor
supply
Regulatory
environment
Economic
Climate
Growth
Prospects
Quality of
Life
California 46 28 43 26 3 25
Source: Forbes, http://www.forbes.com/best-states-for-business/
Given the importance of state-level legal structures in the US federal system, the state-
level policies and judicial decisions significantly influence the regulatory environment. This is
particularly true for legal treatment of non-compete agreements, which typically prohibit an
employee to work as a direct rival to the former employer for a certain period of time. California
is one of a few states that specifically prohibit non-compete agreements.9
In fact, an episode at IBM suggests that non-enforceability of non-compete agreements in
California played a significant role in developing the computer industry. The modular design of
the IBM System/360 mainframe computer, introduced in 1964, enabled people to leave IBM to
develop components that would plug into the S/360. IBM employees were initially fearful of
potential legal action by IBM, but in California they were safe to pursue new businesses that
relied upon their expertise gained at IBM. This helped the computer industry develop in Silicon
Valley (Baldwin and Clark 2000).
As discussed earlier, the region’s borders are not clearly defined, and they span multiple
counties and cities. Thus, local government policies in Silicon Valley are disorganized and
characterized by lack of coordination among different local governments. As a result, residents
in Silicon Valley often suffer from insufficient provision of public goods such as public
transportation and urban planning. The private sector firms often responded by providing
innovative solutions to these challenges caused by the lack of government policy. In this ironic
sense, local governments in Silicon Valley played a role in developing the ecosystem for
innovation based growth.
9 Other states include Alaska, Connecticut, Minnesota, Montana, North Dakota, Nevada, Oklahoma,
Washington, and West Virginia.

28
The rail system BART (Bay Area Rapid Transit) is the best example of the lack of local
government coordination. Planning began in the early 1950s, with plans to seamlessly connect
the entire Bay Area from San Francisco to San Jose on both sides of the bay in a large loop,
including San Francisco International Airport, Oakland Airport, and San Jose International
Airport, were vetoed by local politics. The counties initially participating in the planning
involved included Alameda, Contra Costa, Santa Clara, San Mateo, and Marin. Critically, Santa
Clara County exited in 1957, followed by San Mateo in 1961. Santa Clara’s elected official were
reportedly upset that the first stage of construction did not cover the entire county, but ended in
Palo Alto, with extensions in the subsequent stages. San Mateo’s exit was reportedly partly
influenced by a real estate agent who convinced county supervisors that the train line would
decrease potential property values along a newly constructed freeway. Although Marin County,
across the Golden Gate Bridge from San Francisco, had voted for part with almost 90% of voters
supporting it, the exit of San Mateo led to a major decrease in the tax base of BART—its critical
funding support—making Marin county too expensive to connect to BART. Marin therefore
exited in 1962. As a result of failure to coordinate the adoption of BART across these separate
counties, BART operated for almost 30 years without connections to the San Francisco
International airport, limited its usefulness. In the 1990s, although Santa Clara County passed
sales taxes to extend a different light rail system to Fremont, across the bay was ruled invalid,
and a different measure that passed to extend BART into Santa Clara county was later
canceled.10
The BART was also built with a proprietary rail gauge and electrical and control
systems that differed from all other US systems, making system maintenance and upgrades
costly.
The main public transportation system linking the heart of Silicon Valley and San
Francisco is the Caltrain rail system, which connects San Jose to San Francisco. Operated by a
different public entity from BART, Caltrain runs only once an hour during non-peak hours and
on weekends. It does not connect to BART in San Francisco. It also does not connect to the US
long distance train line Amtrak, which connects the Bay Area to California’s capital Sacramento,
and beyond.
Startups such as Uber appeared in order to fill much needed demand for people to move
easily around the Bay Area without their own cars. The fact that Uber’s 2014 revenue far
exceeded that of the entire taxi industry in previous years suggests that rather than just replacing
existing demand for taxis, Uber is fulfilling untapped demand by users in search of an easy and
low-cost transportation solution.
The government played a critical role in the establishment and growth of the research
universities at the heart of Silicon Valley. Even beyond their historical legacy, government
continues to provide a large portion of research funding for these universities. What is critical to
10
San Jose Mercury News (2005) "History of BART to the South Bay." Posted on January 8, 2005.
(http://www.mercurynews.com/bart/ci_5162648 Accessed January 15, 2015.).

29
note, however, is that the research budgets are allocated through multiple different agencies, with
evaluations of grant approval based on blind peer-reviewed boards comprised of scientists and
other members who do not necessarily work at the agencies. In other words independent
advisory boards evaluate the merits of proposals, and those winners are awarded on a project
basis. Even University of California, a public university, has a majority of its operating budgets
for research come from competitive rather than state funding sources. For many disciplines,
therefore, faculty members’ ability to receive government grants plays a role in hiring and
promotion.
For FY 2014, $1.27 billion (out of $4.4 billion total operating budget) at Stanford was
from government sponsored research. For UC Berkeley’s sponsored research funding, which
totaled $738.5 million in 2013, the federal government accounted for 66% ($486.3 million). The
state of California contributed only 10% ($73.7 million).
Most U.S. government grant competitions promote matching funds from non-government
sources. The government views private sector matching funds as a validation of the research’s
promise by an important third party. Matching funds also leverage the government funds.
Government expectations of matching funds in the U.S. thus serve to promote closer university-
industry ties.
Finally, the government plays the role of a major lead buyer for Silicon Valley startups’
products and services, as is often understated in analyses of Silicon Valley—particularly among
many participants themselves in Silicon Valley. The government, which includes the military
and aerospace, played a critical role in the historical development of Silicon Valley, and
continues to exert a significant presence in shaping technological trajectories.
Government as a lead buyer has been a crucial driver of startup growth in Silicon Valley
since its early days (Leslie 2000). Many of the early radio technologies were sold to the US Navy,
which was rapidly expanding into the Pacific as the US projected its power towards Asia.
Aeronautics and aerospace were areas of concentration in the Bay Area even before
World War II. In 1933, the U.S. government commissioned Moffett Airfield as a Naval Air
Station, around which grew both government and industry laboratories. One of these, the Ames
Aeronautics Laboratory, was transferred to NASA along with the creation of the space agency in
1958. Lockheed Missiles and Space (which later became Lockheed-Martin) was the largest
employer in the area for much of the postwar period (28,000 at its peak), with a majority of its
sales going to government. Semiconductors and other specialized technologies pioneered by
startups also had government as a key lead buyer. As of 2000, Silicon Valley was one of the
leading recipients of defense contracts, receiving about four times the national average and twice
per worker what Los Angeles—another focus point of military-industrial collaboration, receives
(Leslie 2000).

30
The military played a critical historical role in growing startup companies from Silicon
Valley into large companies during the Cold War. Varian Associates11
, Watkins-Johnson12
, and
Hewlett Packard owed much of their growth to military contracts. Hoping to benefit from the
local expertise, established East coast companies such as General Electric, Sylvania, and Zenith
all set up outposts in the form of laboratories and production facilities in the Bay Area. Many
spinoffs from these large companies provided a growing ecosystem of startup firms with
specialized technologies and know-how.
Firms that were specialized in primarily selling to the government broadened to
commercial areas as procurement budgets decreased and the government became a more difficult
customer, beginning in the 1960s. Some of the specialty firms such as Varian Associates suffered,
but people left those companies went on to more successfully diversified companies such as
Hewlett Packard and various semiconductor firms that became the core of Silicon Valley (Lenoir
2014).
2.2.9. Business infrastructure
The business infrastructure of Silicon Valley, such as law firms, accounting firms, mentor
networks, and other aspects provides value to entrepreneurs and startups beyond the direct
financing or services rendered. Law firms that specialize in serving startups, for instance, often
accept equity in exchange for a large portion of their fees, so that their payment depends on the
success of the startup. Consequently, they do their own screening when taking on new firms as
clients. They can also act as business advisors and deal-makers, having dealt with a very large
number of successful startups.
11
Varian Associates was founded in 1948 by brothers Russell and Sigurd Varian, with Russell holding a
bachelor’s and master’s in physics from Stanford, along with the Stanford’s physics department head at
the time, Leonard Schoff, and Edward Ginzton, a professor of physics who had done undergraduate and
PhD work at Stanford in physics, and several others. Varian Labs pioneered the klystron, which is a tube
that can amplify electromagnetic waves at microwave frequencies. Its technological specialties also
included small linear accelerators to generate photons, and nuclear magnetic resonance technology. It
held numerous contacts with the military, developing the fuse for atomic weapons, for example. Varian
Associates was the first firm to occupy space in the Stanford Industrial Park in 1958, widely recognized
as one of the initial sites from which Silicon Valley in its postwar form was born. Edward Ginzton, one of
its founders and its CEO for a time—considered one of the founding fathers of Silicon Valley—has an
applied physics labs at Stanford named after him. The Ginzton Laboratory, which pursues research in
“quantum electronics, semiconductor lasers, picosecond pulse techniques, optical microscopy, tunneling
and force microscopy, fiber optics, condensed matter, superconductive materials and their microwave
applications, and acoustic techniques for nondestructive evaluation of semiconductors and other
materials.” (https://ginzton.stanford.edu/history)
12 Watkins-Johnson is described as the most financially successful of the Stanford spinoffs in the early
postwar period. Co-founder Dean Watkins was a Stanford professor, and Watkins-Johnson, located in
Stanford Industrial Park, developed and manufactured microwave tubes, mostly for surveillance,
reconnaissance, countermeasures, and telemetry. These technologies came from Watkin’s research efforts
at his Stanford lab. (Leslie 2000).

31
Most professional service providers in Silicon Valley, such as accountants, lawyers,
recruiters, market research consultants, and others, have developed startup practice experts who
can provide assistance to startup companies. Silicon Valley is also home to numerous for-profit
and non-profit business incubators. The success of new-type accelerators like Y-Combinator and
500 Startups has transformed the incubator industry into a model that provides shorter term pro-
active education and mentoring programs for entrepreneurs and equity financing, as well as
collocation space for rent. New accelerators continue to be created. StartX was formed in 2011
as a spin-off of Stanford Student Enterprises, the non-profit financial arm of the Associated
Students of Stanford University (Stanford’s student union). Although StartX is a nonprofit
organization and takes no equity in tenant companies, it provides education and introduction
services similar to a for-profit incubator. More than 220 startup companies have gone through
the program so far.
2.2.10. Acceptance of Failures
Silicon Valley is widely known to have a culture of accepting failure as a positive
experience if the failure led to important lessons. Underlying this culture is an effective set of
mechanisms for evaluating and monitoring entrepreneurs and startups, allowing “successful
failures” to become the stepping stone for subsequent successes. Many noteworthy startups were
not the first, but rather the second or third attempt by the entrepreneurs before becoming
successful.
2.2.11. Legal platform
Law firms perform positive functions in the Silicon Valley ecosystem for start-up
company creation and growth that differ from the primarily adversarial roles they play in many
industrial regions in the U.S. Silicon Valley start-up companies tend to engage lawyers from the
very beginning of their existence and maintain their relationship with the same law firm all the
way to exit (Suchman 2000). Because of the high fees involved in a successful IPO or
acquisition, Silicon Valley law firms are motivated to help their clients achieve business success,
not just avoid legal problems. Law firms in Silicon Valley thus serve as facilitators for start-up
companies, helping to solve problems for the entrepreneurs, rather than only making the
entrepreneur aware of legal and regulatory constraints. Beyond providing advice on legal
aspects of general corporate, intellectual property, and financing issues, law firms may also
contribute to the success of their clients in other ways. They often introduce client companies to
potential investors (a function noted by observers as early as Friedman et al. 1989). Some major
law firms, e.g. Wilson Sonsini Goodrich & Rosati (WSGR), have established investment
companies that allow the firms to profit from stock options that are granted by clients in lieu of
cash for some portion of their fees. Conversely, the ability of a start-up company to engage a top
law firm serves as a vetting mechanism that identifies the company as having particularly strong
prospects for success (at least in the opinion of the law firm partners, who have seen many start-
ups).

32
The legal industry infrastructure of Silicon Valley evolved from a situation that was not
different from that of other urban business regions in the U.S. Until the 1960s, the region that
would become Silicon Valley included a number of individual lawyers and small firms, but most
major law firms with corporate practices were located in San Francisco and represented
established interests. In the early 1960s, these small firms (e.g. McCloskey Wilson & Mosher,
the ancestor of WSGR, founded in 1961) began to capitalize on their location close to Stanford
University to provide advice to emerging start-up companies and early venture capital companies.
The law firms developed mechanisms that would allow themselves to accept stock options from
cash-poor start-up companies and yet avoid conflicts of interest. Then, the firms expanded their
services and their size in order to keep client relationships as the start-ups grew, rather than hand
off their functions to larger law firms with more diverse staffs of experts (Rao 2012). WSGR,
which had 10 attorneys in 1974, had grown to over 600 attorneys by 2000 (Johnson 2000). One
event that served to establish the validity of the full service practice by law firms for growing
start-ups was the IPO by Apple Computer in 1980, which was the largest IPO in the U.S. since
that of Ford Motor Company in 1956. The IPO was handled by two Silicon Valley firms,
WSGR and Fenwick, thereby establishing them as players on the national stage (Rao 2012).
Some aspects of the California legal code and its enforcement have been cited as factors
in the success of Silicon Valley. In particular, California does not enforce post-employment
covenants not to compete against a former employer. Gilson (1999) argues that this legal feature
encourages greater labor mobility than is found in areas that do enforce such non-compete
contracts, e.g. Massachusetts, the location of the Route 128 ecosystem, which used to be
considered as promising as the Silicon Valley ecosystem to foster innovation. Early studies, e.g.
Friedman et al (1989), noted that written contracts in Silicon Valley tend to be a bit shorter than
those in other regions. They attribute this to a “congruence of legal and business styles” that
amounts to the above-mentioned focus by lawyers on business success for their clients at the
expense of not specifying the disposition of every contingency to protect investors. Moreover,
California law has a provision that may favor entrepreneurs over outside investors. A majority
of the holders of each class of shares must approve a corporate change, such as a merger,
acquisition, or IPO in California, while the cumulative majority of shareholders of all classes of
shares is sufficient to effect such a change in other states (such as Delaware). This means that
the creation of certain classes of shares with special voting privileges may provide better control
to entrepreneurs in California than it would elsewhere.
3. Institutional Foundations of Silicon Valley
The eleven defining characteristics of Silicon Valley ecosystem that we identified above
are supported by distinct institutions. Here we follow Aoki (2001) and consider an institution to
be “a self-sustaining system of shared beliefs about a salient way in which the game is repeatedly
played” (Aoki 2001, p.10). Thus, an institution includes not only formal rule of the game but
also the equilibrium strategies and observed actions by the players. As Aoki (2007, p.2) points

33
out, “An institution thus conceptualized is essentially endogenous, but appears to be an
exogenous constraint to the individual agents.”
We find it useful to distinguish six institutions that support Silicon Valley ecosystem.
Those are (A) financial system that provides funding for risky ventures, (B) labor market that
provides high quality, diverse and mobile human resources, (C) interactions between industry,
universities, and government to generate a constant stream of innovative ideas, products, and
businesses, (D) industrial organization where large established firms and small startups grow
together, (E) social system that encourage entrepreneurship, and (F) professionals that assist
establishment and growth of startups. Table 10 shows which institutions support each of the
eleven defining characteristics of Silicon Valley.
Table 10: Institutional Foundation of the Silicon Valley Ecosystem
Defining Characteristic Supporting
Institutions
1. Dual ecosystem of large firms and small startups C, D
2. Highly competitive industries, balancing between “open innovation” and secret protection C, D
3. High financial returns for successful entrepreneurs and startups’ early employees A, B
4. Finance and governance of startups by venture capitals A
5. High level and diverse human resources for all stages of startups B
6. High labor mobility B
7. Top class universities B, C
8. Extensive government role in shaping technological trajectories and basic science C
9. Business infrastructure (law firms, accounting firms, mentors, etc.) F
10. Acceptance of failures A, B, E
11. Legal platform F
Supporting Institutions:
A. Financial system that continue provides funding for risky ventures
B. High quality and diverse human resources that are highly mobile
C. Interactions between industry, universities, and government to generate a constant stream of innovative ideas,
products, and businesses
D. Industrial organization where large established firms and small startups grow together
E. Social system that encourage entrepreneurship
F. Professionals that assist establishment and growth of startups
3.1. Financial System
The outcome of innovation cannot be predicted with certainty. Thus, financing
innovation is much riskier than financing traditional manufacturing companies or retailers.
Financing of innovation also suffers from more serious asymmetric information between
34
lenders/investors and borrowers/entrepreneurs than usual. In the financial system in Silicon
Valley, venture capital firms are expected to do (and indeed do) much more than just lending to
or investing in risky startups, as shown in Section 2. Venture capitalists are often involved in
management of startups and closely monitor the progress of startups that they invest in. In return,
they are rewarded handsomely when the startups succeeds. The entrepreneurs and early
employees of successful startups also enjoy high financial returns. The financial wealth of
successful entrepreneurs is often “recycled” and used to finance new startups through venture
capital funds. Since venture capitalists maximizing returns by exiting investments, primarily
through M&A and IPOs, this creates pressure for startups to get bought out or IPO. Finally,
acceptance of failures that we observe in Silicon Valley ecosystem is also partially supported by
the financial system where venture capital firms conduct thorough monitoring of startups.
Failures inevitably happen, but venture capitalists can often see that the failures happened despite
best efforts of the entrepreneur, making them willing to give another chance to the failed
entrepreneur (Kenney and Florida 2000, Metrick and Yasuda 2011).
3.2. Market for High Quality Human Capital
Several of the defining characteristics of Silicon Valley ecosystem rely on high quality
human capital. These are supported by the labor institution of Silicon Valley, where high quality
scientists and engineers are trained mainly at top class universities (where they receive more
specialized training than through on the job training at corporations), both large established firms
and small startups compete intensely for skilled workers, talent moves across different
corporations frequently, and people involved in successful startups are highly rewarded both
financially and socially (Kenney ed., 2000). The mechanism is highly merit-based and attracts
talent from all over the world (Saxenian 1994, 2006). Diversity of human capital encourages
innovation, and the knowledge that many corporations value diversity at workplace, which
further increases the diversity. With flows of outsiders into Silicon Valley ready to disrupt
existing businesses and displace existing workers, firms face greater competition and workers are
pressure to accumulate skills and knowledge that transfer across corporate boundaries. Tolerance
of failures is also observed in the labor market, which, combined with potentially very high
financial rewards, encourages high skilled people to engage in risky startups repeatedly.
3.3. Industry-University-Government Interactions
Multi-faceted interactions between corporations, universities, and governments constitute
another institutional foundation for Silicon Valley ecosystem. Many innovative ideas are
developed through collaboration among top level universities, start-up companies, and
government agencies and research institutes. Ties are multi-faceted, going well beyond a
unidirectional flow of funding from government to universities, and ideas or intellectual property
from universities to industry. Interactions range from formal licensing and collaborative research,
to consulting, ad-hoc advice, networking, personnel exchanges, and other mechanisms (Grimaldi
et al. 2011). Universities have strong ties with their local economic environments, harnessing

35
cutting-edge industry developments to inform research at the forefront of various disciplines.
Theoretical breakthroughs and advancements at universities in turn enable technological progress
of the surrounding industry (Kenney and Mowery 2014, Grimaldi et al. 2011, Lenoir 2014). The
government was historically a major lead buyer (Leslie 2000), and continues to be a significant
buyer of Silicon Valley firms’ products and services.
3.4. Industrial Organization
Another institutional foundation is the industrial organization where large established
corporations co-exist with small startups. Large firms often become the first buyers for
successful startups, helping their growth rather than trying to frustrate the future potential
competitors (Kenney and Florida 2000). Many large firms also actively purchase startups in
order to enter new market areas (Sturgeon 2002). Large firms usually collaborate with startups,
universities, and other large firms in early stages of research and development (Chesborough
2003, Lazonick 2009), although they may start to be highly secretive in the commercialization
stage.
3.5. Entrepreneurship Culture
Silicon Valley’s culture of accepting failures and giving second chance to failed
entrepreneurs are supported by the institutions for finance and labor. Financial institutions
expect a high rate of failure, and highly developed mechanisms for monitoring and evaluating
failed startup firms take into account the possibility of “good failures.” High levels of labor
market mobility facilitate both entrepreneurs and employees of failed startups to find jobs or
opportunities for starting anew elsewhere. In addition, however, social norms emphasize and
value repeated risk taking, viewing failures as useful experiences.13
3.6. Professionals that Function as Business Infrastructure
Finally, we consider the network of various professionals such as law firms, accounting
firms, mentors, and incubators that provide business infrastructure for startups as another
institution, rather than results of other institutional arrangements. These business infrastructure
firms have evolved to support the Silicon Valley business ecosystem in concrete ways. For
example, mentors and incubators/accelerators provide additional layers of screening startups.
Law firms in Silicon Valley offer legal services to financially constrained startups with low or no
upfront fees. Together these business infrastructure firms reduce the time and efforts expended
by entrepreneurs and early startups on non-core activities (Suchman 2000).
13 The commencement speech at Stanford by Steve Jobs, co-founder of Apple, is the paradigmatic example of how this social norm is continually re-emphasized. http://news.stanford.edu/news/2005/june15/jobs-061505.html

36
4. Institutional Challenges for Innovation-Based Economic Growth in Japan
Six institutional foundations for Silicon Valley ecosystem do not seem to have been
established in Japan. Japanese institutions in the corresponding areas are quite different. For
example, in financing startups, banks or bank-owned VC firms dominated the market until
recently. Japan has globally competitive engineers, but the mobility of those high skilled
workers has been low. Relatively few of them become entrepreneurs partly because they know
they are not likely to get second chance if they fail. Japan has both large firms and startups, but
large firms often prefer to keep research and development strictly in house and seem reluctant to
involve startups in collaborative efforts or to acquire superior technology of outside startups over
the technology developed inside the companies.
At least in theory, those institutional foundations can develop in Japan. Such institutional
changes would transform the Japanese economic system from the one that worked well during
the catchup phase of growth to the one fit for innovation-based growth. Indeed, as we see in
Section 5, the Japanese government saw such transformation inevitable by the 1980s at the latest
and tried to encourage it through various industrial policies. Many of the policies were not
effective, and similar policies to encourage innovations in Japan are an important part of
Abenomics policy package, which is the subject of Section 6.
Some of the institutions, however, may be too hard to develop in Japan in the near future.
For example, developing the social norm to accept failures may be very difficult and may take a
long time. Moreover, there may be little that the government can do to help the development. In
such a case, a better approach is for Japanese businesses and entrepreneurs to be directly
involved in the dynamics of Silicon Valley ecosystem. Section 7 reviews the past experiences of
Japanese businesses to directly benefit from Silicon Valley ecosystem. The lack of systematic
information on Japanese businesses in Silicon Valley severely limits our analysis. Many
findings that we report in the section are hypotheses at best that rely on just anecdotes at this
point. These hypotheses should be tested by collecting data systematically and analyzing those
rigorously.
5. Industrial policies for innovation: evaluation of past policies in Japan
In the late 1970s, the Ministry of International Trade and Industry (MITI) correctly
recognized that Japan had already finished the catch-up stage of economic growth, and
formulated the “vision” for the post-catch-up Japanese economy. Since then, MITI and the rest
of the Japanese government have implemented a number of policies to promote innovation. This
section examines three types of industrial policies that were aimed at encouraging innovation in
Japan: policies to promote innovative industrial clusters, direct financial support for R&D, and
policies to encourage entrepreneurship. All the three types of government interventions can be
justified in theory by the presence of externalities that could be fixed by government.
37
Promotion of industrial clusters is an attempt to achieve economies of agglomeration.
Individual firms/plants benefit from the presence of other firms/plants in the same or related
industries in the same region. Agglomeration of firms enhances efficiency in such channels as
knowledge spillover and pooling of specialized workers (Marshall 1920, Rosenthal and Strange
2004). Since it takes at least some numbers of firms to achieve economy of agglomeration,
nobody would have an incentive to be the first one in an industrial cluster unless other firms are
expected to join soon. The government can encourage creation of industrial clusters by
coordinating the entries by several core firms and/or subsidizing early entrants to the clusters.
Similarly, the externalities associated with R&D investment are well known. Since
important innovations spawn more innovations by spilling over to other firms/researchers, the
social benefit of innovation is often much larger than the private benefit. At least in theory, the
government can subsidize R&D so that innovators can internalize the social benefit.
Finally, founding up new startups may be too risky for many individual entrepreneurs
although those ventures collectively bring net benefits to the society through the law of large
numbers. Again in theory, the government can help mitigate the under-supply of
entrepreneurship by encouraging startups through subsidies and other means.
The next subsection starts out by examining how the industrial policy toward innovation
has evolved over the last 40 years. Then, we review each of the three types of policies in turn in
Sections 5.2, 5.3, and 5.4. When possible, we examine the results of rigorous policy evaluations,
but we have not found many evaluations that are useful in judging whether the policies had the
intended impacts.
5.1. “Vision” of innovation policies
In Japan, the concept of industrial policy to promote economic growth based on
technological innovation dates back to the 1980s. In 1979, MITI proposed the concept of Japan
as a “technology-intensive nation” as a part of its “Vision for Industrial Policy in the 1980s”. In
the background of this concept was the recognition that the nation had completed the process of
catching-up with the advanced economies of the West by the 1970s. As we saw in Section 1, this
recognition was correct. With Japan’s technological level largely identical to the West’s, the
Vision claimed that “a turning point is coming, a move away from an industrial pattern of
“reaping” technologies developed in the seedbeds of the West, to a pattern of “sowing and
cultivating” that displays greater creativity. With the century of catch-up modernization at an end,
from the 1980s onwards we will enter a new and unexplored phase.” In the same period, the
spiraling increase of oil prices due to the first and second oil shocks also increased expectations
on technological innovation as a means of conserving energy from oil or discovering alternative
energies.
In the 1990s, the Japanese economy faced a long-term recession, and the hollowing-out
of industry became a problem as the strong yen drove manufacturing industries offshore. Against
38
this background, the government came to envision a new role for technological innovation. In
November 1996, the second Hashimoto Cabinet took power, with the LDP as the single ruling
party. Prime Minister Ryutaro Hashimoto advocated what were known then as the “Six
Reforms”: administrative reform, economic structural reform, reform of the financial system,
structural reform of the social security system, structural reform of public finances, and
educational reform. Speaking of economic structural reform in his policy speech to the Cabinet
in November 1996, Prime Minister Hashimoto stated “It is essential that we move quickly to
effect comprehensive policies for economic restructuring. The creation and expansion of new
industries is central to stemming hollowing out, and this means it is essential that we respond in
the three areas of capital, science and technology, and human resources so that new business
sectors can take root and grow strong. Looking at science and technology in particular, just as we
will promote enhanced basic research and closer ties among business, academia, and government,
we will also promote technology development policies in telecommunications, biotechnology,
and other fields as necessary.” Clearly, the government looked towards technological innovation
to resolve the issue of hollowing-out via creation of new industries.
This way of thinking was embodied in the “Program for Economic Structural Reform”
(approved by the Cabinet in December 1996), and the “Government Action Plan on Economic
Structural Reform” (approved by the Cabinet in May 1997). Seeking to “realize a vigorous and
affluent economy that achieves a balance between economic activity and public burden by
promoting the creation of new industries and the development of an attractive business
environment in Japan and cultivating vigorous industries that provide a guarantee of excellent
employment opportunities, in addition to controlling to the fullest possible extent the burden on
citizens, the working generation and companies,” the Program for Economic Structural Reform
focused on 15 areas (medical care and welfare, lifestyle, information and communications, new
manufacturing technologies, distribution, environment, support for business, oceans,
biotechnology, revivification of urban environments, aerospace, new energies and energy
conservation, human resources, international relations, and housing), and outlined visions for
their future. According to the Program, the scale of employment provided in Japan by the 15
areas in total was 10.66 million jobs, and their market scale was 198 trillion yen at the time that
the measure was passed by the Cabinet. The program expected that these figures would grow to
18.27 million jobs and 561 trillion yen by 2010 if the structural reform was successfully
implemented. In particular, three areas (medical care and welfare, lifestyle, and information and
communications) were deemed especially important for the job creation. The government
indicated that it would “work boldly and rapidly to effect fundamental reforms of Japan’s
economic structure while respecting international rules, emphasizing the promotion of measures
including deregulation, systemic reform, and research and development via organic cooperation
between the relevant ministries and agencies on the basis of the Program.” The Government
Action Plan on Economic Structural Reform concretely spelled out the structural reforms in each
of the 15 areas.

39
In March 2000, MITI announced “Economic and Industrial Policy for the 21st Century:
Issues and Outlook,” which provided a concrete vision for industrial policy in the first quarter of
the new century (Industrial Structure Council 2000). The new vision was distinctive in
considering Japan’s socioeconomic sustainability with shrinking labor force as the nation’s birth
rate declines and its population ages. The ministry projected that the government debt to GDP
ratio would come down to 50% and the national burden rate (defined as total taxes and social
security contributions divided by national income) would stay below 50% if the economy grows
at 2% in real term. To achieve 2% real growth with declining labor force, it was essential for the
total factor productivity (TFP) growth to be very high based on research and development and
investment in information technology. Thus, the new vision emphasized the importance of
innovation in a broad sense, encompassing economic structural reform and technological
innovation.
The ministry sought “a transformation towards a system of technological innovation
tailored to the “frontrunner era,” which will oversee the process from the creation of original
basic technologies to the realization of businesses based on them.” A new system to promote
open and cooperative technological innovation was proposed:
Contemporary technological innovation proceeds on the basis of the integration of a
range of fields of technology and cooperation between researchers of diverse nationalities,
and its pace is exceedingly rapid. Japan needs a new system to promote technological
innovation that is suited to a new era and a new environment. This means a transition
from the nation’s previous self-contained system of technological innovation to an open
and cooperative system. By means of open cooperation between the company or
individual at the center of the innovation process in question and other companies,
universities, individuals, etc. in Japan and overseas, this system will draw out the full
potential of research and development resources and generate original outcomes via a
process of organic integration. Under this system, universities and research institutes will
cooperate with companies, conducting basic technological research producing original
outcomes and actively making these outcomes known, and will become the key sources
of human resources for research. The key to technological innovation is motivated
organizations able to make rapid decisions and sound judgments and able to assign clear
responsibility, irrespective of their size. We must make the development of horizontal
and organic relationships that transcend organizational boundaries between researchers
involved in inter-organization cooperation into the impetus for the bold and rapid creation
of research outcomes. It will be essential for the government to put in place a variety of
environments in order to make this possible (Industrial Structure Council 2000, pp.39-40).
This vision was modeled after the system of technological innovation observed in the
U.S., Silicon Valley in particular, which attracted considerable attention at the time. To achieve
the vision, MITI introduced several measures including 1) provision of support for collaboration
and the creation of structures to promote open cooperation (the promotion of exchanges between

40
different types of industries both within and across regions, the easing of restrictions on joint
industry-university research, the establishment of a consolidated taxation system and a system
for the taxation of donations, etc.); 2) promotion of smooth technology transfers from
universities and research institutes to the industry (easing of rules regarding the holding of joint
appointments, easing of rules concerning absence from work, expansion of TLO, provision of
support by technological intermediaries (discerning experts), etc.); and 3) strategic use of the
intellectual property system, standardization policies, etc. All of these measures were
implemented in the 2000s.
5.2. Promoting industrial clusters
Industrial policies focusing on regions have a long history in Japan going back to such
policies proposed by the Home Ministry and the Rikken Seiyukai (Friends of Constitutional
Government) in the prewar era. In the postwar era, policies were implemented to realize
balanced development between the nation’s regions, i.e. to reduce income disparities between
regions, from the 1960s onwards, as exemplified by the Comprehensive National Development
Plan (1962) and associated laws such as the New Industrial Cities Construction Act (1962) and
the Act for Promoting Development of Special Areas for Industrial Consolidation (1964).
However, the policy focus was not trained on technological innovation in Japan’s regional areas
until the Act to Promote High-tech Industrial Agglomeration and Development (the Technopolis
Act) in 1983.
“Vision for Industrial Policy in the 1980s,” which introduced the concept of Japan as a
“technology-intensive nation” resulted in the Technopolis Act in 1983. The Technopolis Act
aimed at autonomous growth of regional economies. The technopolis project was supposed to
create spaces that fused industry (advanced technological industries such as electronics and
machinery), academia (science and engineering universities, private research institutes, etc.), and
living all together. Regional governments and industries welcomed the idea. In 1981 MITI
established the Technopolis 90 Committee in the Japan Industrial Location Center and
formulated a plan to establish technopolises in 20 regions throughout Japan (this would become
19 regions following the amalgamation of two of the original regions). These 20 regions were
selected on the basis of two criteria: 1) the regions featured cities with a population of 200,000 or
more that could be integrated, and 2) the regions had a day trip access to Japan’s three main
metropolitan areas.
The Technopolis Act provided a framework for government approval of development
plans formulated by regional governors following the development guidelines. The approved
plans received assistance from the central government through various measures including
special depreciation, exemption from fixed assets tax for test and research facilities, exemption
from special landholding tax, and interest-free loans for training facilities. In fiscal 1984, 1985,
and 1986 respectively, 14, four and eight regions (26 regions in total) were designated as
Technopolis Regions.
41
The Technopolis Act was oriented towards the manufacturing industry, but from the
second half of the 1980s onwards, the Japanese economy started to pick up its pace of shifting
into the service industry. Realizing this trend, the government promulgated the Intelligent
Location Act in 1988, which sought to advance technologies focusing on the service industry, in
parallel with the Technopolis Act. The concept was to promote concentration of businesses in the
“smart sector” (industrial research laboratories, corporate product development divisions and
information processing divisions, software developers, design divisions, etc.) in regional areas.
Similar to the Technopolis Act, the Intelligent Location Act solicited plans from prefectural
governments following the guidelines. Approved plans received assistances from the central
government including tax breaks and debt guarantees from government financial institutions.
Between 1989 and 1992, 23 plans received approval. Many of the regions with approved plans
were either close to or had overlaps with the Technopolis regions.14
While the Technopolis Act and the Intelligent Location Act focused on technological
innovation, they inherited the traditional approach to encourage dispersion of industries clustered
in cities to regional areas, which goes back to the Comprehensive National Development Plan in
the 1960s. In the 1990s, when it became clear that the Japanese economy had entered long-term
stagnation, the main policy attention shifted to the creation of new businesses based on
technological innovation throughout Japan. “Government Action Plan on Economic Structural
Reform” approved by the Cabinet in December 1996 reflected this new attention and led to the
“Economic and Industrial Policy for the 21st Century: Issues and Outlook” in 2000, which
advocated an open and cooperative system for technological innovation modeled after the system
observed in Silicon Valley.
As a key industrial policy under this new vision, the Industrial Cluster Plan of 2001
sought to “form industrial clusters (broad-area industrial agglomerations formed around a core of
industries possessing a competitive advantage, through the establishment of a business
environment promoting the successive creation of new businesses) in areas including IT,
biotechnology, the environment, and manufacturing, by promoting the use of seeds created by
universities, research institutes, etc. by regional SMEs and venture companies, in order to
increase Japan’s competitiveness.”15
The Industrial Cluster Plan was a long-term plan in three
phases, spanning 20 years from 2001 to 2020. In the first phase (2001-05; launch phase), the
government would launch about 20 industrial clusters. The plan claims that “project evaluations
introducing the PDCA approach” will be conducted, but we have not any systematic evidence of
the actual use of such PDCA (Plan-Do-Check-Act) approach. In the third phase (2011-20;
autonomous development phase), the businesses developed up to that point would be maintained,
while promoting the financial independence from the government. As of 2009, the following 19
14
Description of the Technopolis Act and the Intelligent Location Act relies heavily on Editorial
Committee of the History of the Policies on International Trade and Industry and Haruhito Takeda
(2011), pp.53-107. 15
Ministry of Economy Trade and Industry, “Industrial Cluster Plan,” 2009。

42
industrial cluster projects had been launched, involving 10,200 regional SMEs and a total of 560
universities and technical colleges.
① Hokkaido IT Innovation Strategy (IT)
② Hokkaido Biotechnology Industry Growth Strategy (Biotechnology)
③ Tohoku Manufacturing Corridor (Manufacturing, collaboration between medicine and
engineering, environment, IT)
④ Regional Revitalization Project (Manufacturing)
⑤ Tokyo Biotechnology Network (Biotechnology)
⑥ Tokyo Venture Forum (Information)
⑦ Tokai Manufacturing Industry Creation Project (Manufacturing)
⑧ Tokai Biotechnology Industry Creation Project (Biotechnology)
⑨ Hokuriku Manufacturing Industry Creation Project (Manufacturing, biotechnology)
⑩ Kansai Biotechnology Cluster Project (Biotechnology)
⑪ Kansai Front-runner Project (Manufacturing, energy)
⑫ Kansai Environmental Business Project (Environment)
⑬ Next-generation Core Industry Development Project (Manufacturing, biotechnology, IT)
⑭ Project for the Creation of a Recycling-based Environmentally-aware Society (Environment)
⑮ Shikoku Techno-bridge Plan (Manufacturing, health, biotechnology)
⑯ Kyushu Region Environmental and Recycling Industry Exchange Plaza (Environment)
⑰ Kyushu Silicon Cluster Plan (Semiconductors)
⑱ Kyushu Regional Biotechnology Cluster Plan (Biotechnology)
⑲ Project for Promotion of Okinawa-style Industry (IT, health, environment, processing and
trade)
There has been little research on the economic impacts of innovation policy targeting
Japan’s regional areas. A notable exception is Okubo and Tomiura (2012), which studies the
effects of the Technopolis Act and the Intelligent Location Act. They examine the data on the
companies with multiple plants in Japan from Census of Manufacturers in 1978, 1980, 1983,
1985, 1988, and 1990. They find that the regions targeted by the Technopolis Act or the
Intelligent Location Act added substantially more plants than other regions. For example, the
share of plants located in the regions targeted by the Technopolis Act in total number of plants in
Japan increased from 10.1% in 1983 to 10.6% in 1988. Similarly, the share of plants in the
regions targeted by the Intelligent Location Act (for which designation happened in 1989-1992)
increased from 16.1% in 1985 to 16.6% in 1990. From this finding, Okubo and Tomiura (2012)
conclude that both programs were successful in attracting new industrial plants.
Okubo and Tomiura (2012) also estimate regression models that allow them to estimate
the impacts of the policies on labor productivity (measured as the value added per employee).
More specifically, they estimate the following regression:
1 2 3j j j j jDPROD const SIZE MAT LABOR POLICY IND (4)

43
where DPRODj is the deviation of the productivity of plant j from the industry mean, SIZEj,
MATj, and LABORj are the size (measured as the number of regular employees), the material
intensity (measured as expenditures on materials divided by output), and the labor intensity
(measured as the total wage bills divided by output) respectively for plant j, IND is the vector of
industry dummies, and ε is the disturbance term. POLICY is a dummy variable which takes one
if the plant is located in the region that was designated by the program (Technopolis or
Intelligent Location).
Table 11 reproduces the estimates the coefficient on the POLICY dummy for cross-
sectional regression for each year of 1983, 1985, 1988, and 1990 for each program. The
estimated coefficients are negative and statistically significant from zero at conventional level for
every year and for both programs. Thus, the plants in the targeted regions tended to have lower
productivities than those in other regions both before and after the policy interventions.
Table 11. Coefficient Estimates on the “Policy” Variable in Okubo and Tomiura (2012)
Census Year 1983 1985 1988 1990
Technopolis -0.148
(-9.91)
-0.12
(-8.45)
-0.099
(-2.99)
-0.114
(-8.63)
Intelligent Location -0.109
(-8.81)
-0.088
(-7.53)
-0.075
(-6.76)
-0.086
(-7.82)
Notes: t-statistics are reported in the parentheses. The shaded cells are coefficient estimates from samples after the
policy had started.
Note that the Technopolis designation was done during the period between 1984 and
1986, and the Intelligent Location designation happened between 1989 and 1992. Thus, to see
the impact of the policy, we need to compare the coefficient estimate from 1983 regression to
those from 1985-1990 regressions for the Technopolis Act and the coefficient estimates from
1983-1988 regressions to that from 1990 regression for the Intelligent Location Act. The table
shows the coefficient estimates for the years after each policy was introduced in the shaded cells.
To see the impact of the Technopolis designation, for example, we can compare the
coefficient estimate from 1983 regression to that from 1990 regressions. The difference is 0.034.
Noting that the 1983 regression and the 1985 are completely separate regressions, so that the
covariance of the two coefficient estimates are zero, we can calculate the standard error for the
difference as 0.0199. Thus, the difference is not different from zero under conventional
significance levels. There is no evidence that the Technopolis Act increased the productivity of
plants in the designated areas. Similarly, to see the impact of the Intelligent Location Act, we
can compare the coefficient estimate from 1988 regression to that from 1990 regression. Again
we find the difference is insignificant, leading us to conclude the Intelligent Location Act did not
increase the productivity in the designated areas, either.

44
5.3. Subsidizing R&D projects
The Japanese government launched numerous industry policies to provide assistance to
research and development projects. The most important policy has been a series of the National
Projects, in which the government corrals private companies into research consortiums for new
technology. The first National Project was the Large-scale Industrial Technology Development
System launched in 1966. This was followed by the Systems for Research and Development in
the Areas of Medical and Assistive Technologies in 1976 and the Next-generation Basic
Industrial Technologies in 1981. The Next-generation Basic Industrial Technologies was based
on the aforementioned “Vision for Industrial Policy in the 1980s,” which advocated the
“technology-intensive nation” (Odagiri and Iwasa 2000). These three projects were integrated
into the Industrial Science and Technology Research and Development System in 1993. In
addition, the Science and Technology Basic Law was promulgated in 1995 to coordinate the
policies on science and technology. The Law highlights the cooperation between national
research laboratories, universities, and the private sector. It also emphasizes the balance between
basic research and applied research. In accordance with S&T Basic Law, the S&T Basic Plan has
been formulated every five years and the government has decided to execute systematic and
integrated S&T policies with long-term perspectives.
The Program for Economic Structural Reform (approved by the Cabinet in December
1996) and the Government Action Plan on Economic Structural Reform mentioned above also
had a significant impact on the National Projects. Positioning the creation of new industries as an
urgent issue and technological innovation as the key to addressing it, the government launched
the System for Applied Research on Industrial Technologies and the System for Scientific
Research and Development by Industry in collaboration with Universities in 1998. These
systems were grouped together with the existing industrial science and technology research and
development system under the umbrella Scientific and Technological Research and Development
System for the Creation of New Industries.
Figure 8 shows that the size of budget for the National Projects increased steadily in the
1980s and 1990s. The amount includes funding from the Special Accounts as well as that from
the General Account. In particular, it is remarkable that it continued to increase while the total
size of the General Account stagnated in the 1990s.

45
Figure 8. Government Budget for National Research and Development Projects
Source: Tsusho Sangyo Sho Nenpo, each year.
The Industrial Science and Technology Research and Development System launched in
1993 focused on 1) research and development in fundamental and original fields (basic and
original research and development that would contribute to the further development of Japan’s
society and economy via the creation and cultivation of new technological frameworks or
technological breakthroughs) , and 2) research and development in the areas of public
administration, society and welfare (essential research and development that would respond to
social needs by providing the necessary foundation for greater quality of life, increased stability
in the supply of resources, and increased promotion of science and technology). An oversight
agency was established for each area of superconductivity, new materials, biotechnology,
electronics, information and communication, machinery, aeronautics and space, raw materials,
people, lifestyle and society, and health and medical care within the National Institute of
Advanced Industrial Science and Technology.
The System for Applied Research on Industrial Technologies established in 1998 focused
on supporting research at development stage, which is often considered too risky undertaking for
0
100,000
200,000
300,000
400,000
500,000
600,000
700,000
800,000
900,000
1,000,000
0
5,000
10,000
15,000
20,000
25,000
30,000
35,000
Large-scale Industrial Technology Development System
Next-generation Basic Industrial Technologies
Sum of "large scale" and "next generation"
Industrial Science and Technology Research and Development System
Scientific and Technological Research and Development System for the Creation ofNew IndustriesMITI related expenditures in General Account (Right Axis)
¥ Million ¥ Million

46
private enterprises. The focus was on the 15 fields specified by the Program for Economic
Structural Reform. The System for Scientific Research and Development by Industry in
collaboration with Universities, also launched in 1998, sought to accelerate the creation of new
industries by providing subsidies to collaborative R&D projects between private enterprises and
universities.
There few studies that evaluate the impacts of the National Project policy. An exception
is Odagiri and Iwasa (2000), which examined the Next-generation Basic Industrial Technologies.
The Next-generation Basic Industrial Technologies started in 1981, and was integrated into the
Industrial Science and Technology Research and Development System in 1993. While it started
with three fields (new materials, biotechnology and new functional elements), superconductivity
and software were added in 1988 and 1990 respectively. Twenty three projects were carried out
in these five subjects. The researchers of those projects came from private enterprises,
universities, and national research institutes. The R&D funds were disbursed by the Agency of
Industrial Science and Technology of the MITI until 1988. After the establishment of the New
Energy and Industrial Technology Development Organization (NEDO) in that year, however, the
responsibility of fund disbursement shifted to NEDO. On average, 11.4 private enterprises
participated in a project. Some firms participated in many projects. The most frequent repeater
was Sumitomo Electric, which participated in seven projects. In total 83 private enterprises
joined at least one project. The participation of universities and national research institutes was
much smaller. On average, a project had only 3.5 universities and 2.8 national research institutes.
Odagiri and Iwasa (2000) find spillover effects in the projects of biotechnology and fine
ceramics through interviews with the participants. The projects were successful in creating
networks of researchers across the borders between firms and institutes. In the biotechnology
project, a new research field on genetic engineering was established and it spawned a new
industry based on that.
5.4. Institutional reforms for the promotion of innovative venture businesses
Policies to promote venture businesses in Japan have been conducted as a part of the
small and medium-sized enterprise (SME) policy. Traditionally, Japan’s SME policy was based
on the Small and Medium-sized Enterprise Basic Act of 1963, which was based on the
assumption that SMEs are disadvantaged in their transactions and competition with larger
corporations. This made the SME policy essentially a social policy to provide protections for
SMEs and their employees.
The emphasis of SME policy changed as the Japanese economy matured. By the 1990s,
SMEs were now regarded as a “source of dynamism in the Japanese economy,” and SME policy
focused on cultivation of diverse and vigorous SMEs with less dependency on government
protection. This change led to a revision of the Small and Medium-sized Enterprise Basic Act in
1999 for the first time in 36 years. The Basic Act specified “Promotion of Business Innovation

47
and Start-ups,” “Strengthening of Business Fundamentals,” and “Improvement of the Safety Net”
(Small and Medium Enterprise Agency, 2000) as the main objectives for the government to
pursue. Thus, policies to promote venture businesses were elevated to a main policy goal. The
following two articles were added to “CHAPTER II BASIC MEASURES, CLAUSE 1
Promotion of Business Innovation and Start-Ups of SMEs”.
Article 13 (Promotion of Start-Ups): In order to promote start-ups of SMEs, the State
shall provide information on and improve training for start-ups, facilitate the financing of
start-up expenses, and take any other necessary measures, and shall also endeavor to
increase public interest in and understanding of the importance and need for start-ups.
Article 14 (Promotion of Creative Business Activity): In order to promote the creative
business activities of SMEs, the State shall promote research and development
concerning remarkably original techniques related to the production or sale of products or
provision of services, develop systems to facilitate the acquisition of the necessary human
resources and financing through such means as shares and corporate bonds, and take any
other necessary measures.
“Creative business activity” is defined as follows.
CHAPTER I, Article 2, Item 3: The term “creative business activity” as used in this Law
shall mean those business activities which are the object of business innovation or start-
ups and which involve the use of remarkably original techniques or remarkably creative
methods of business management.
Legislation for promotion of start-ups and promotion of creative business activity
actually predated the revision of the Basic Act. It was a part of the Temporary Law concerning
Measures for the Promotion of Creative Business Activities of Small and Medium Enterprises
(Creative Business Promotion Law) in 1995. The Creative Business Promotion Law allowed the
government to provide SME policy supports for individuals intending to establish a business but
not having done so (Nakata, 2013, pp. 651-652).16
In addition to the revision of the SME Basic Act, a couple of financial reforms were
implemented to promote venture companies. First, a series of revisions of the Securities
Exchange Act in the late 1990s and the early 2000s, implemented as a part of the “Big Bang”
financial deregulation, prompted stock exchanges to open new markets for start-ups. The Tokyo
Stock Exchange established the Mothers in 1999. Nasdaq Japan started on the Osaka Securities
Exchange in 2000.17
Second, the Act on Limited Partnership for Venture Capital Investment by
16
The Creative Business Promotion Law had a 10 year sunset clause. The content of the law was
permanently legislated as a part of the Act for Facilitating New Business Activities of Small and Medium-
sized Enterprises in 2005. 17
After Nasdaq Japan failed in 2002, the Osaka Securities Exchange continued to operate the market
under the name of Hercules. Other stock exchanges for startups that were created around this time

48
Small and Medium Enterprises was promulgated in 1998. The law allowed investors to join a
venture capital fund as limited partners that are not involved in the management of portfolio
companies (Nakata, 2013, pp. 691-696).
These reforms helped attracting more attention to entrepreneurial activities in Japan, but
they did not increase the number of startups significantly. Figure 9 shows the number of IPOs in
Japan for every year from 1996 to 2014. Every year from 1999 to 2007, there were more than
100 IPOs. Then, the number of IPOs suddenly dropped. Many observers identify the collapse of
the stock price of Livedoorin 2006, following the scandal on accounting fraud ,as the turning
point. Livedoor was a fast growing company on Mothers and attracted many first-time
individual investors to the market for startups. The demise of Livedoor disappointed many of
these investors and drove them away from Mothers and other stock markets for startups. The
recovery of Japan’s IPO market after this “Livedoor shock” has been slow. The global financial
crisis that started in 2007 also depressed the capital markets in general and the markets for
startups in particular.
Figure 9: IPOs in Japan
Source: Kabusiki Koukai Hakusyo (PRONEXUS Inc.)
In 2001, the government announced a yet another plan to promote startups. The goals of
the plan that was called Hiranuma Plan, associated with the name of the then Minister for
Economy, Trade and Industry, included doubling of the number of new startups in five years and
creating 1,000 academic spinoffs in three years. Although the use of numerical targets in
Hiranuma Plan grabbed attention of critics, a more important point is that the plan included
include the Centrex market on the Nagoya Stock Exchange (1999), the Ambitious market on the Sapporo
Securities Exchange (2000), and the Q-Board market on the Fukuoka Stock Exchange (2000).
0
50
100
150
200
199
6
199
7
199
8
199
9
200
0
200
1
200
2
200
3
200
4
200
5
200
6
200
7
200
8
200
9
201
0
201
1
201
2
201
3
201
4

49
systemic reforms to replicate the system of creating businesses from academic research findings
as observed in Silicon Valley (Section 2.2.7). As Table 12 shows, various reforms on the
treatment of intellectual property by universities and technology transfer organizations were
implemented in this period. The plan was successful in creating 1,000 academic spinoffs in three
years (Harada and Mitsuhashi 2011).18
Meanwhile, the other goal of doubling of the total number
of startups in five years was not achieved.
Table 12: Summary of Regulatory Reforms Related to Academic Spinoffs
Another reform to reduce the financial cost of starting up a venture business was
introduced in 2006. The Companies Act of 2006 abolished the ¥10 million minimum capital
requirement for joint-stock companies. The minimum capital requirement was already waived
for a certain type of startup companies during the first five years of its existence under the Law
18
To offer one notable example, CYBERDYNE Inc. (President and CEO: Professor Yoshiyuki Sankai,
University of Tsukuba), which developed Robot Suit HAL, was founded in 2004 (Listed on the Mothers
exchange in 2014).
Guidelines for promotion of science and technology
Formulation of the Science and Technology Basic Plan
Increase in the total government investment in R&D: JPY 17 trillion
Promotion of coordination between industry, academia and government
1998
Law for Promoting Technology
Transfer from Universities to
Industry
Establishment of approved TLO system
Japan’s version of Bayh-Dole Act
Reduced patent fees for TLOs and procurement of patents from government-
funded research projects
2000Industrial Technology
Enhancement ActIncreased flexibility of researchers’ status
Raising the total government investment in R&D to JPY 24 trillion
Reform of coordination between industry, academia and government
Hiranuma Plan Policy target of reaching 1000 academic spin-offs
Basic ideas about creation, protection, and exploitation of intellectual properties
Establishment of the Intellectual Property Policy Headquarters in the Cabinet
Outlines of academic institutions’ responsibilities and rights in intellectual
property rights management
Establishment of intellectual property headquarters at universities
Obtaining corporate status
Staff without civil servant status
2004Incorporation of National
UniversitiesImplementation of the Incorporation Law (April, 2004)
JPY 25 trillion on total government investment in R&D
Building a sustainable and progressive industry–university–government
collaboration system
Source: Harada and Mitsuhashi (2011)
1999Law on Special Measures for
Industrial Revitalization
1995Science and Technology Basic
Law
1996Science and Technology Basic
Plan (FY1996–2000)
2006Third Science and Technology
Basic Plan (FY2006–2010)
2001
Second Science and Technology
Basic Plan (FY2001–2005)
2002Basic Law on Intellectual
Property
2003
Intellectual Property Strategic
Program
National University Incorporation
Law

50
for the Support of Small and Medium Enterprise Challenges in 2003, but the Companies Act
extended this to all joint-stock companies.
Various measures to promote venture businesses that were originally introduced in the
late 1990s and the 2000s are still in effect today. In the 2013 White Paper on Small and Medium
Enterprises in Japan, published just before the start of Abenomics, the specific measures detailed
below are listed under “Support for Startups” as SME policies implemented in fiscal 2012 (Small
and Medium Enterprise Agency, 2013, pp. 243-244).19
For example, the measures related to fund
procurement includes:
- New Startup Loan Program: Under this program, unsecured, unguaranteed loans are provided
by the Japan Finance Corporation (JFC) to persons embarking on new ventures and persons
who have just started up in business.
- Guarantees for founders: The purpose of this program is to boost lending to startup
entrepreneurs by private financial institutions through the provision of guarantees by credit
guarantee corporations to individuals who are starting up in business or who started up in
business less than five years ago.
- Promotion of startups of regional demand-creating enterprises: Support was given to
businesses and similar entities that generate local demand by soliciting business plans from
women and young persons newly starting a business or carrying out second startups and
partially defraying the costs needed to implement those plans.
- Angel tax system: The purpose of this system is to assist the financing of newly founded
SMEs and similar businesses by individual investors (“angels”), and it works by granting
SMEs meeting certain conditions income tax rebates when an individual investor makes and
investment and when their shares are transferred.
- Improving supply of “risk money” needed when starting a business: A venture investment
division was created at the Innovation Network Corporation of Japan (INCJ) and use was
made of the Development Bank of Japan (DBJ) and Shoko Chukin both to improve the
supply of the “risk money” needed when starting/founding a business and commercializing a
product, and to facilitate procuring funds from private investors and encourage venture
investments by private enterprises. The framework to encourage entrepreneurs to take on new
business ventures will also be improved by, for example, reconsideration of personal
guarantees when procuring funds.
<Measures related to procedures>
- Program to support business creation by SMEs and micro-enterprises
19
Measures implemented by the Small and Medium Enterprise Agency are discussed here, but different
measures have also been put in place by other ministries and agencies and local administrations.
51
<Measures related to management knowhow>
- “Small Enterprises” Growth Headquarters
<Measures related to human resource acquisition>
- Human resource countermeasures program for SMEs and micro-enterprises
<Measures related to management knowhow and human resource acquisition>
- Development of support personnel for new business creation
Of these measures, the most widely used are the subsidized loan program and
government guarantees for founders. The Angel Tax System was established in 1997 based on
the Creative Business Promotion Law, and has undergone a number of revisions since then.
Expectations were high for the tax reliefs for angel investment, but the policy did not increase
the amount of angel funding in Japan (Small and Medium Enterprise Agency, 2014, pp. 243-
244). A public-private fund established in 2009 by the Innovation Network Corporation of Japan
became active in venture funding (as a direct investor or as a limited partner) in 2012. The
Organization for Small and Medium Enterprises and Regional Innovation, JAPAN (at that time
known as the Japan Small Business Corporation) has operated a Fund Investment Program since
1999. Under this program, the organization provides funds as a limited partner to investment
funds operated by private-sector investment companies. These policies continue to be core
venture business promotion policies in the Abenomics reform.
6. Innovation policies in Abenomics
Abenomics’s growth strategy, also known as the “Third Arrow,” includes various
policies to make Japan more innovative. The original version of the growth strategy that was
announced in June 2013 included numerous innovation policies, most of which were already
proposed by METI and other ministries in the past. Too many reform ideas without clear focus
were a problem for the original growth strategy of Abenomics. In response to this criticism, the
updated version that was disclosed in June 2014 specified ten focus areas, which include
innovation as one of the focus areas. The June 2015 revision, which has just come out, points out
the “third arrow” reforms to increase the productivity are even more important now that the first
two arrows on expansionary macroeconomic policies have succeeded in addressing the demand
shortage problem. Although the 2015 revision does little to sharpen the focus further and
actually adds some new directions, especially for policies to promote local economies,
innovation policies continue to form a core of the “third arrow” reforms.
Going through the implementation schedule as of June 2014, we can identify the
following nine policy areas that are directly related to innovation.

52
i. Promote investment in venture businesses and investment by failed entrepreneurs
ii. Establish a system which enables challenges to frontiers being free from anxiety
iii. Realize a virtuous cycle of venture creation
iv. Promote business innovation
v. Strengthen the Council for Science and Technology Policy’s functions as headquarter,
strengthen functions of research and development agencies, and promote research and
development by both public and private sectors
vi. Establish a “Innovation National System”
vii. Promotion of Local Innovations
viii. Strengthen strategies for intellectual properties and standardization
ix. Implement ”Robotics New Strategy”
Appendix 1 contains description of each policy area including concrete policies. Unlike growth
strategies before the Abe administration, the current growth strategy specifies KPIs (Key
Performance Indicators) for many policy areas. KPIs are potentially useful in evaluating the
policies and making necessary adjustments over time. The appendix lists KPIs (Key
Performance Indicators) for each of the nine policy areas if any KPIs are listed.
Some of the policies included in this list could indeed encourage innovation in Japan. A
problem of innovation policy in Japan in the past, however, has been the lack of rigorous policy
evaluation rather than the lack of policy ideas (and attempts), as we saw in the previous section
and will point out in the conclusion.
7. Harnessing Silicon Valley
As described in Section 4, some of the institutions that support the Silicon Valley
ecosystem may be very difficult to develop in Japan at least in the near future. If this is the case,
a better approach is for Japanese businesses and entrepreneurs to be directly involved in the
Silicon Valley ecosystem. This section reviews the past experiences of Japanese firms to
“harness” the Silicon Valley ecosystem.
Following the discussion in Section 3, we consider the experience of Japanese firms in
harnessing each of the six institutions underpinning Silicon Valley: (A) finance, (B) human
capital, (C) industry-university-government interactions, (D) industrial organization, (E)
entrepreneurship culture, and (F) business infrastructure. The potential benefits that a Japanese
firm could achieve by tapping a Silicon Valley institution differ depending on whether they are
large established firms or new startups. For example, in finance, large firms and small firms sit
on the opposite sides of venture capital; large firms are more interested in becoming limited
partners (LPs) in existing venture capital firms or setting up Corporate Venture Capital (CVC)
operations, while young startups are interested in receiving funding from VCs. So, we
distinguish three types of Japanese firms when it is useful: large established firms (large firms),

53
developed startups that have already listed in financial markets in Japan (advanced startups), and
young startups in early stages of development (early startups).
It turns out that an attempt to analyze Japanese firms’ activities in Silicon Valley is
severely constrained by the lack of information. There is no open database of all the Japanese
firms that have a presence in Silicon Valley. There are some open databases of early startups
backed by Silicon Valley-based venture capital firms, but it is very difficult to identify which are
“Japanese” startups.
The only major surveys of Japanese firms in Silicon Valley are from JETRO in
cooperation with the Japanese Chamber of Commerce of Northern California. The survey has
been published annually since 1992. The report presumably identifies Japanese companies using
the list from the Japanese Consulate General of San Francisco, but neither the exact source nor
the list of Japanese firms surveyed has been made public.
Given the lack of systematic information on Japanese firms’ activities in Silicon Valley,
the discussion in this section relies heavily on anecdotes and autobiographies of Japanese
entrepreneurs. There have been a number of books and reports written especially about small
startups (Kushida and Brooks 2012, Wahl 2015a). They can provide detailed insights into
individual experiences and observations, but they are far from systematic studies. Thus, the
findings in this section are hypotheses that should be tested against systematic information.
In addition to how Japanese firms and entrepreneurs have been trying to make use of the
Silicon Valley ecosystem, these anecdotes point to some common challenges that many large
firms in Japan face in gathering information, establishing local offices, setting up CVC
operations, and conducting M&A. We include this analysis at the end of this section.
7.1. Japanese Firms’ attempts to utilize Silicon Valley Institutions
7.1.1. Finance
JAFCO was the first Japanese venture capital company to set up a San Francisco branch
in 1984. The branch eventually became an independent US entity and currently operates under
the name of Icon Ventures. A different pattern of Japanese venture capital companies in Silicon
Valley is represented by Scrum Ventures, which began as social networking service company
Mixi’s US investment arm. Mixi was the sole LP in the first fund, but for subsequent funds,
Scrum took other investors as well. World Innovation Lab (WiL), established in 2013, is another
venture capital company with approximately $400 million in funds headquartered in Palo Alto
but with a sizable operation in Japan, focused on taking Japanese LPs and providing a variety of
value-added services in addition to investments, including large corporate carve-outs.
Large Japanese firms have been increasingly active as LPs in Silicon Valley venture
capital firms. LPs of WiL, for example, include ANA, Sony, NTT DoCoMo, Nissan, Mizuho

54
Financial Group, Seven Bank, Benesse, Isetan, Mitsukoshi Holdings, Hakuhodo, and others.
Firms such as Omron and Komatsu have also invested in other Silicon Valley venture capital
firms such as Draper Nexus and Fenox Capital.
Many Japanese companies established corporate venture capital companies (CVCs) in
Silicon Valley in the late 1990s, during the IT boom. Many are still active. For example,
Presidio Ventures (wholly owned by Sumitomo Corporation) and Panasonic Ventures were both
established in 1998, both headquartered in Silicon Valley. Others, such as Cyberagent Ventures
and Itochu Technology Ventures are headquartered in Tokyo, with offices in Silicon Valley.
Softbank Capital was established in 1995 headquartered in Massachusetts, but with an office in
Silicon Valley. DoCoMo Capital, established in 2005 in Palo Alto, enjoyed a notable success of
orchestrating the entry of popular note-taking application Evernote into Japan while gaining on
substantial early investments.
There are a range of challenges and opportunities for large Japanese firms utilizing
Silicon Valley venture capital firms. The major opportunity is that they can potentially get access
to promising young startups through the VC’s network. It is also potentially easier for them to
get promising startups to talk to them.
The primary challenge for large Japanese firms to invest in VCs or set up their own
CVCs is not uniquely Japanese, but it is a significant one: getting caught between the goals of
maximizing returns and investing to seek for potential strategic partnerships. If maximizing
financial returns, the common wisdom is that it is unwise to bias the selection of startups to
invest in by limiting them to areas that may be potentially of business interest to the investor. By
doing so, the returns are likely to be lower. Moreover, investors with strategic interest in
particular startups tend to hold on to not yet profitable companies longer than pure VC investors
would do. Since Japanese large firms tend to be interested in strategic partnerships at the expense
of forgoing maximum financial returns, their returns tend to be lower—but it is not clear whether
they are getting enough strategic value to justify the lower returns.
For early startups, VCs can provide not only funding but also valuable interpersonal
networks. Indeed several Japanese startups with Silicon Valley VC funding self-reported that
they benefitted greatly from VCs’ introductions to team members as well as customers (Kushida
and Brooks 2012). Many Japanese startups that already had Japanese VC funding before coming
to Silicon Valley, however, did not benefit from Silicon Valley VCs’ interpersonal networks, and
were ultimately unsuccessful. SmartNews and Metaps recently conducted follow-on investments
from Silicon Valley VCs in excess of 20 million each. Whether they also benefit from
interpersonal networks of these VCs remains to be seen.
Advanced startups, which have already completed IPOs in Japan, face a different
challenge. VCs in Silicon Valley are not interested in financing these publically traded
companies. Moreover, IPOs in Japanese markets tend to be in smaller size compared to IPOs in

55
the U.S. markets. Thus, Japanese advanced startups that come to Silicon Valley actually face a
disadvantage of having less funding, or payment schemes such as stock options, at their disposal
compared to their competitors in Silicon Valley.
7.1.2. Human Capital
The labor institution that produces quality human capital with high mobility and diversity
may not be easily developed in Japan. Thus, Japanese companies may be better off trying to
utilize the human capital available in Silicon Valley. There are some critical challenges that
Japanese firms face, however, when they attempt to do so.
First, salaries are rather high in Silicon Valley. Companies face the issue of having teams
working together with individuals on vastly different levels of pay. This can be exacerbated by
different working cultures. For example, Japanese employees may get frustrated if their Silicon
Valley teammates get paid four times their salary but often leave work at 5pm to attend
children’s school functions, while Japanese workers end up staying to 10pm, finishing the work
that Silicon Valley colleagues left behind. Managers of such teams can become extremely
stressed (Wahl 2015b).
Second is the lack of experience evaluating top talent. The problem is especially serious
for small firms that are not well known since the candidates that they could attract are not
obvious top quality (Watanabe 2015).
Third is difficulty of retaining top employees because of limited internal promotion
opportunities. For firms with headquarters in Japan, the top person in the Silicon Valley office is
typically Japanese. For non-Japanese local hires, this may suggest an upper limit to how far they
can rise within the company. While some Japanese firms have created a career path for
employees to become country managers, it is very rare for Japanese firms to promote non-
Japanese local hires to executive positions at their headquarters.
Of these three challenges, the second (experience in screening talent) is probably the
easiest to address. Japanese firms could get the services of competent consultants. The other
two, however, are more difficult. The Japanese firms may not be able to solve these problems
without changing their human capital management practices in Japan. If the practices in Japan
can change, however, building a labor institution that produces high quality human capital with
high mobility and diversity would not be very difficult. If such a labor institution can develop in
Japan, Japanese firms will not have to utilize this aspect of the Silicon Valley ecosystem.
7.1.3. Industry-University-Government Interactions
Multi-faceted interactions between industry, universities, and government may be an
institution that is difficult to develop in a short time. Japan has actually been trying to develop
the interactions through national projects and other science and technology policies. The success

56
of those policies to date has been limited. Abenomics also includes several policies to try
working on industry-university-government interactions, but it will be also useful for Japanese
firms and entrepreneurs to try benefiting from Silicon Valley in this aspect. Indeed many
Japanese companies seem to be doing fairly well already in connecting with major universities in
Silicon Valley. Still some challenges remain.
Large Japanese firms have been actively involved in university research projects at places
such as Stanford and UC Berkeley for a long time. Japanese researchers are found in many of the
industry-university joint project labs, which Japanese corporations join as funders. Dozens of
visiting researchers from Japan can be found at each university at any time in various areas,
ranging from technical research labs to less technical departments.
A challenge is for large companies to make use of technologies that employees are
exposed to. For example, when personnel are sent from the R&D department, they can engage in
cutting-edge research. However, when they return to Japan, those projects may not be grounded
in new business development or any strategic part of the company. Without internal support, the
project gets stuck in the R&D department. Some large firms that have had this experience are
focusing now more on linking university-generated research with strategic businesses. To ensure
strong support in headquarters, others are beginning to send employees who report to groups
directly controlled by the CTO’s office rather than the R&D division.
Another challenge is the lack of track record of many Japanese companies in serious
research conducted in collaboration with US universities. One solution is to successfully receive
grants from sources such as the NIH or DOD and use those as the evidence for their legitimacy
to be involved in cutting-edge research. Thus, a number of Japanese startups decide to
incorporate in Silicon Valley to apply for large grants by the US government. Some hire
specialists who have successful experiences with US government grants.
Another solution is to have a scientific advisory board. Bio Architecture Lab, for example,
co-founded by a Japanese scientist, established a scientific advisory board in 2008. The board
included prominent UC Berkeley scientists, who helped attract other scientists and created
inroads for the company into the scientific community. The company also received a highly
competitive US Department of Energy grant.20
Bio Architecture Lab eventually succeeded in
developing a way to convert biomass from seaweed into ethanol and published a breakthrough
article that was featured on the cover of Science.21
20 http://www.marketwired.com/press-release/Science-Magazine-Showcases-Groundbreaking-Bio-Architecture-Lab-Technology-That-1608865.htm 21http://ctt.marketwire.com/?release=842707&id=1178500&type=1&url=http%3a%2f%2fwww.sciencemag.org%2flookup%2fdoi%2f10.1126%2fscience.1214547

57
7.1.4. Industrial Organization
Large firms in Silicon Valley often become the early buyers of startups’ offerings or
purchase startups in a context of “open innovation.” Such industrial organization can develop in
Japan, but at the same time, large Japanese firms may want to work with startups in Silicon
Valley and Japanese startups may want to deal with large companies in Silicon Valley.
Indeed some large firms in Japan have already been active in acquiring startups in Silicon
Valley. The most active are new firms such as Rakuten, which became the largest shareholders
of ride-sharing company Lyft ($300 million), invested substantially in social media companies
such as Pinterest ($50 million), and purchased several other Silicon Valley firms such as online
retail tracker Slice. DeNA also used M&A as its entry strategy into Silicon Valley, purchasing
gaming company ngMoco for approximately $400 million in 2010.
Yahoo!Japan under the Softbank Group has also been active. It bought a mobile
advertising company Cirius Technologies in 2010. Although it was the Silicon Valley office of
Cirius Technologies that caught the eye of Yahoo!Japan, this type of transaction could have
happened without involving Silicon Valley at all. Thus, Japan seems to be on its way to develop
a coexisting relationship between large and small firms that is very similar to Silicon Valley. If
that happens, Japan does not need to rely on Silicon Valley in this aspect.
7.1.5. Entrepreneurship Culture
Culture may be hard to change. If that is the case, this is an area where it makes sense for
Japan to utilize the Silicon Valley ecosystem. The entrepreneurs who would be reluctant to start
business fearing the consequences of failures in Japan can come to Silicon Valley and start
businesses. Indeed one of the strongest motivations for Japanese entrepreneurs and startups
moving to Silicon Valley is to benefit from the startup culture. The fact that some large Japanese
firms worry about sending their employees to MBA programs at Stanford and UC Berkeley
because they quit their company implies that the Japanese large firms believe in the strength of
the culture of entrepreneurship in Silicon Valley.
7.1.6. Business Infrastructure
Some business infrastructure firms may be hard to develop in Japan. Rather than waiting
for the development of those firms domestically, it may be better for Japanese entrepreneurs to
use services provided by Silicon Valley firms. Indeed many business support firms in Silicon
Valley have started to cater to Japanese firms. For example, the large Silicon Valley law firms
such as Wilson Sonsini have select lawyers who specialize in dealing with Japanese clients.
There are other law firms that focus on immigration and visa issues for Japanese clients. A
variety of smaller businesses and consultants that offer training and business incubation cater to
Japanese large firms and startups. There are several Japanese tenants at accelerator Plug and Play,

58
and several others host Japanese startups, too. Some, such as Sunbridge focus on bringing
Japanese startups to Silicon Valley, and US firms to Japan.
7.2. Large Japanese Firms and Silicon Valley
In addition to the challenges described above, informal conversations with Japanese
employees of large firms stationed in Silicon Valley reveals a particular set of problems that
arise from interactions with their headquarters in Japan. For example, many report frustrations
with headquarters’ template-like approach to industry research. When given some information
about potentially disruptive firms that the employees find, many large firms always ask for the
information of current market size, projected market size, current players, and relative market
share. However, for the type of startup firms that are attempting to disrupt existing markets, there
is no market yet, no competitors, and a great deal of uncertainty. Traditional market analyses
would not capture the potential disruptions until after they occur, at which point the benefits of
being local to Silicon Valley are lost.
Startups with potentially valuable technologies or business models can be the source of
valuable information, but large firms without a strong track record of buying, investing in, or
working with startups in Silicon Valley often confront a particular adverse selection problem
when attempting to talk to them. This is that the startups which are most promising can be the
ones least likely to have the time or interest in spending precious time talking to firms that may
not benefit them. This is not a problem unique to Japanese firms, but they seem more severe,
given the greater contrast in internal corporate cultures and relative paucity of experience
purchasing outside firms.
Employees of large firms posted in Silicon Valley often end up need to pitch different
things in two directions, which they might not have experience doing. Towards Silicon Valley,
they need to pitch to startups that although they may not have a strong track record, they are
serious about potential investments or tie-ups, meriting the time for startups to meet them. This
type of skill may not have been necessary at all in the Japanese market if they were well known,
or had a wide range of suppliers with whom they had hierarchical relationships. Towards
headquarters, they need to convince those overseeing their operations that some commitments
may be necessary to access in-depth information from particularly promising startups.
Headquarters may not understand that their standing in Silicon Valley may be very weak, despite
being very powerful and respected in the Japanese market. Thus, this necessity of local
operations of “selling” different ideas in two different directions is a common and well-
documented challenge for multinational companies in general, but the extreme contrast between
the Silicon Valley ecosystem and large Japanese firms’ typical operations in the Japanese market
can magnify the challenge. Moreover, employees advocating on behalf of Silicon Valley often
need to ensure that their superior continues to sponsor their mission—a job rotation by the
person in charge of oversight may relegate them to a peripheral status.
59
A common complaint of Japanese large firm employees stationed in Silicon Valley
regarding headquarters is a lack of funding, speed, and overall autonomy. When there is a
promising deal, they are not allowed to act on their own decision. Even if they are allowed to act,
the funding they can control would not be sufficient anyway. Thus, they need to consult
headquarters in Tokyo, which moves extremely slowly.
Another problem for many large firms that come to Silicon Valley is the lack of a clear
strategy, as Menjo (2015) points out. While formulating a strategy before establishing a presence
in Silicon Valley entails its own risks, not having any strategy is problematic. A strategy does
not have to be precise in every detail. Indeed an ideal strategy would have some flexibility, since
many opportunities in Silicon Valley are likely to be unexpected.
8. Conclusion
Innovation is essential to the continued growth of a mature economy like Japan. In this
report, we have studied the ecosystem of Silicon Valley, where we observe continuous
innovations, and identified six institutional foundations for innovation-based economic growth.
Those are (A) financial system that provides funding for risky ventures, (B) labor market that
provides high quality, diverse and mobile human resources, (C) interactions between industry,
universities, and government to generate a constant stream of innovative ideas, products, and
businesses, (D) industrial organization where large established firms and small startups grow
together, (E) social system that encourage entrepreneurship, and (F) professionals that assist
establishment and growth of startups. It is not necessary that Japan replicates all the institutions
of Silicon Valley exactly to achieve innovation-based economic growth, but having the functions
of those institutions is essential. Japan needs to have appropriate institutions that play the
functional roles that their Silicon Valley counterparts play. Alternatively, Japanese firms may be
able to use Silicon Valley institutions for those functions that Japanese institutions do not
provide.
The government can help Japan’s transition to an innovation-based growth economy if it
successfully encourages the development of the six institutional foundations in Japan. Or the
government may be able to help Japanese firms and entrepreneurs in utilizing some Silicon
Valley institutions. Indeed many of the industrial policies that we reviewed in Section 5 and
innovation policies listed in Section 6 aimed at building some of the institutional foundations.
Table 13 shows which of the six institutional foundations each policy tried to address at least
initially.

60
Table 13. Japanese Government Policies for Innovation-Based Economic Growth
Policies to build financial system that provides funding
for risky ventures
Promotion of venture businesses (Section 5.4), Promote
investment in venture businesses and investment by
failed entrepreneurs (Section 6), Realize a virtuous cycle
of venture creation (Section 6)
Policies to develop high quality and diverse human
resources that are highly mobile
Policies to establish close interactions between industry,
universities, and government to generate a constant
stream of innovative ideas, products, and businesses
Policies to promote industrial clusters (Section 5.2),
R&D subsidies (Section 5.3), Strengthen the Council for
Science and Technology Policy’s functions as
headquarter, strengthen functions of research and
development agencies, and promote research and
development by both public and private sectors (Section
6), Establish “Innovation National System” (Section 6),
Strengthen strategies for intellectual properties and
standardization (Section 6), Strengthen strategies for
intellectual properties and standardization (Section 6),
Create the headquarter for medical research (Section 6)
Policies to build industrial organization where large
established firms and small startups grow together
Policies to promote industrial clusters (Section 5.2)
Policies to promote social system that encourage
entrepreneurship
Promotion of venture businesses (Section 5.4), Promote
investment in venture businesses and investment by
failed entrepreneurs (Section 6), Establish a system
which enables challenges to frontiers being free from
anxiety (Section 6)
Policies to encourage professionals that assist
establishment and growth of startups
Promotion of venture businesses (Section 5.4), Realize a
virtuous cycle of venture creation (Section 6)
Policies to assist Japanese firms and entrepreneurs to
harness the Silicon Valley ecosystem
Policies that are not related to building institutional
foundations or assist Japanese firms to harness the
Silicon Valley ecosystem
Promote business innovation (Section 6), New industrial
revolution by robotics (Section 6)
Looking at the table, we find one institutional foundation that is not addressed by any
industrial policies that we reviewed in this report. It is the flexible market for high quality and
diverse human capital. This is not because the Japanese government has not done anything to
reform the labor market. In fact, there have been some attempts to increase the mobility of the
labor market in Japan or to improve the quality of human capital—but those policies are not
usually tied directly to innovation policies. Abenomics structural reforms also include labor
market reforms to make it more flexible. We should understand that those labor market policies
can have significant implications for the institutional foundations for innovation-based economic
growth.

61
Another policy area that is missing in Table 13 is a policy to assist Japanese firms and
entrepreneurs to tap the Silicon Valley ecosystem. In addition to promoting the institutional
foundations for innovation at home, the government can encourage firms and entrepreneurs to
utilize the Silicon Valley ecosystem. Japanese government does not seem to have tried this
approach, yet.
Given the paucity of information about Japanese firms’ activities in Silicon Valley that
we pointed out in Section 7, the first role that the Japanese government can play is to commit
resources to collect such data. JETRO (Japanese External Trade Organization) and NEDO (New
Energy and Industrial Technology Development Organization), in combination with universities,
are obvious vehicles. Providing a basis for open information is critical, because there has been a
great deal of learning occurring in Japanese firms in Silicon Valley. Such knowledge, however,
is mostly decentralized. Much of the information not only remains within each firm, but in many
cases it also tends to be atomized among individuals who have been sent to Silicon Valley.
Potentially valuable lessons have been learned but not shared.
The lack of reform attempts to encourage Japanese firms and entrepreneurs to harness
Silicon Valley is an exception rather than the rule. For many other reforms to promote
innovation, the lack of ideas was not a binding constraint. On the contrary, the Japanese
government has tried to provide many of the institutional foundations for innovation-based
economic growth since the 1980s. The problem has been the shortcomings of attempts to
evaluate the effectiveness of those policies and to adjust the policies accordingly. As a result,
many policies (such as the promotion of industrial clusters) have been implemented repeatedly
with slight variations without clear evidences of intended effects.
For example, the Japanese government has made numerous attempts to jumpstart VC
funding for risky ventures. The key players in these policies have been public financial
institutions such as the Development Bank of Japan and Shoko Chukin Bank. Yet, the track
record of the public financial institutions in providing risk capital has been spotty at best. There
were also some spectacular failures like ShinGinko Tokyo. Founded in 2005 by the initiative of
Mr. Shintaro Ishihara, then Governor of Tokyo, the mission of the public bank was to fund
promising small and medium-sized firms that somehow had trouble raising funds in the private
sector. The attempt to compensate the underdevelopment of funding market for startups by
creating a government financial institution, however, was a complete failure. Almost
immediately the bank started to accumulate a huge amount of non-performing loans and the
Tokyo Metropolitan government eventually had to bail out the bank.
Even if a government financing program were able to identify promising startups and
recorded appropriate returns, it would not imply the success of the program. The government
program may have just replaced the private funding that would have happened if the government
program did not exist. Thus, a policy must be evaluated against the counter-factual that would
62
have prevailed in the absence of the policy. It is this type of rigorous policy evaluation that the
Japanese innovation policies lacked.22
To end the stagnation that lasted for more than a couple of decades and restore the
economic growth, Japan needs to transform the economic structure to fit innovation-based
economic growth. As this report points out, there are several institutional foundations for the
innovation-based economy and the government can potentially encourage the development of
those foundations. Fortunately, the Japanese government was aware of the importance of the
policies to encourage the development of innovation-based economy and has been trying many
policies. Unfortunately, numerous policies have been tried without rigorous policy evaluations
so that we have not found effective policies to develop the institutional foundations for the
innovation-based economic growth. In Abenomics, the government is again experimenting with
many interventions that may help the development of innovation-based economic growth. It is
important to develop analytical metrics and conduct rigorous policy evaluations, as these
experiments are being developed and implemented, so that we can learn from those experiments
this time before it is too late.
22 The problem of the lack of rigorous policy evaluation is not peculiar to Japan. Indeed this is
where many innovation policies all over the world failed, as Lerner (2009) points out. He also
points out that a policy’s outcome is evaluated too quickly even when such analysis is conducted.
It often takes time for an innovation policy to have discernable effects. A useful policy
evaluation would take this into account and consider a long enough time horizon to measure the
impacts of the policy.

63
References:
Aoki, M. (2001). Toward a Comparative Institutional Analysis. Cambridge, MA: MIT Press.
Aoki, M. (2007). “Endogenizing Institutions and Institutional Changes,” Journal of Institutional
Economics, 3 (1), 1-31. Reprinted in Masahiko Aoki (2013) Comparative Institutional
Analysis. Northampton, MA: Edward Elgar, pp.268-297.
Baldwin, C. Y. and K. B. Clark (2000). Design rules. Cambridge, Mass., MIT Press.
Chesbrough, H. W. (2003). Open innovation : the new imperative for creating and profiting from
technology. Boston, Mass., Harvard Business School Press.
Cohen, S., J. B. DeLong and J. Zysman (2000). Tools for Thought: What is New and Important
about the "E-conomy". Berkeley, CA, Berkeley Roundtable on the International
Economy, University of California at Berkeley.
Dasher, R. (2013). "Disruptive Ideas, Open Innovation, and New Value Chains: Trends in Asia."
Accessed June 15. http://asia.stanford.edu/us-atmc/wordpress/wp-
content/uploads/2013/10/131003-Dasher-EE402A.pdf.
Editorial Committee of the History of the Policies on International Trade and Industry and
Haruhito Takeda, Eds. (2011). History of the Policies on International Trade and
Industry, vol.5.
Fallick, B., C. A. Fleischman and J. B. Rebitzer (2006). "Job-hopping in Silicon Valley: Some
evidence concerning the microfoundations of a high-technology cluster." The Review of
Economics and Statistics 88(3), pp.472-481.
Fernandez, L. and N. Miranda. (2014). "Nation's Largest Homeless Encampment, "The Jungle,"
Dismantled." Retrieved January 20, 2015, from
http://www.nbcbayarea.com/news/local/Game-of-Whack-a-Mole-Homeless-Upset-to-be-
Evicted-by-Police-From-The-Jungle-in-San-Jose-284745461.html
Foster, L., J.C. Haltiwanger, and C. J. Krizan (2001). "Aggregate Productivity Growth: Lessons
from Microeconomic Evidence, " in Charles R. Hulten, Edwin R. Dean and Michael J.
Harper (Eds.) New Developments in Productivity Analysis. Chicago, IL: University of
Chicago Press, pp.303-372.
Foster, L., J. Haltiwanger and C. J. Krizan (2006). "Market Selection, Reallocation, and
Restructuring in the U.S. Retail Trade Sector in the 1990s," The Review of Economics
and Statistics, 88 (4), pp.748-758.
Friedman, L., R. Gordon, S. Pirie, and E. Whatley (1989). "Law, lawyers, and legal practice in
Silicon Valley: A preliminary report." Indiana Law Journal, Volume 64, pp.555 - 567.

64
Gilson, R. J. (1999) "The legal infrastructure of high technology industrial districts: Silicon
Valley, Route 128, and covenants not to compete." NYU Law Review, June 1999,
Volume 74, Number 3, pp. 575 - 629.
Grimaldi, R., M. Kenney, D. S. Siegel and M. Wright (2011). "30 years after Bayh-Dole:
Reassessing academic entrepreneurship." Research Policy 40, pp.1045-1057.
Harada, N. and H. Mitsuhashi (2011). "Academic Spin-offs in Japan: Institutional Revolution
and Early Outcomes." in C. Usui. Comparative Entrepreneurship Initiatives: Studies in
China, Japan and the US, Palgrave Macmillan, pp.138-163.
Hogan, M. (2014) "Living in a Fool's Paradise." Boom: A Journal of California Summer 2014,
Vol 4, No 2.
Hoshi, T., and A. Kashyap (2011), Why Did Japan Stop Growing? NIRA Report.
Industrial Structure Council (2000) "21 Seiki Keizai Sangyo Seisaku no Kadai to Tenbo
[Economic and Industrial Policy for the 21st Century: Issues and Outlook], " Industrial
Structure Council.
Johnson, B. (2000) Advising the new economy: the role of lawyers. In Lee, Chong-Moon,
William Miller, Marguerite Hancock, and Henry Rowen, eds., The Silicon Valley Edge,
pp. 325 - 341. Stanford: Stanford University Press.
JVSV (2014). 2014 Silicon Valley Index, Joint Venture Silicon Valley Institute for Regional
Studies.
Kenney, M. and R. Florida (2000). Venture Capital in Silicon Valley: Fueling New Firm
Formation. Understanding Silicon Valley : the anatomy of an entrepreneurial region. M.
Kenney. Stanford, CA: Stanford University Press, pp.98-123.
Kenney, M. and D. Mowery, Eds (2014). Public Universities and Regional Growth: Insights
from the University of California, Stanford University Press.
Kushida, K. E., and T. Brooks. (2012). "Japanese Entrepreneurship and Human Capital in
Silicon Valley." New Energy and Industrial Development Organization (NEDO).
Kushida, K. E., J. Murray and J. Zysman (2013). "Clouducopia: Into the Era of Abundance."
CLSA Blue Book. January.
Kushida, K. E., J. Murray and J. Zysman (2015). "Cloud Computing: From Scarcity to
Abundance." Journal of Industry, Competition and Trade.
Lazonick, W. (2009). "The New Economy Business Model and the Crisis of U.S. Capitalism."
Capitalism and Society 4(2).
Lecuyer, C. (2006). Making Silicon Valley : innovation and the growth of high tech, 1930-1970.
Cambridge, Mass: MIT Press.

65
Lécuyer, C. (2014). Semiconductor Innovation and Entrepreneurship at Three University of
California Campuses. in M. Kenney and D. C. Mowery. Public universities and regional
growth : insights from the University of California.. Stanford, CA: Stanford University
Press, pp. 20-63.
Lee, C.-M., W. F. Miller, M. G. Hancock and H. S. Rowen, Eds. (2000). The Silicon Valley
edge : a habitat for innovation and entrepreneurship. Stanford, CA: Stanford University
Press.
Lenoir, T. (2014). Inventing the entrepreneurial university: Stanford and the co-evolution of
Silicon Valley. in T. J. Allen and R. P. O'Shea. Building Technology Transfer Within
Research Universities: An Entrepreneurial Approach. Cambridge, UK, Cambridge
University Press, pp.88-128.
Lerner, J. (2009). Boulevard of Broken Dreams: Why Public Efforts to Boost Entrepreneurship
and Venture Capital Have Failed – and What to Do About It. Princeton, NJ: Princeton
University Press.
Leslie, S. (2000). The Biggest "Angel" of Them All: The Military and the Making of Silicon
Valley. in M. Kenney. Understanding Silicon Valley : the anatomy of an entrepreneurial
region. Stanford, CA: Stanford University Press.
Marshall, A. (1920). Principles of Economics. London, McMillan.
Menjo, H. (2015). "Shirikon baree chuzai ga muda ni owaru mittsu no akuhei [Three bad habits
that waste a Silicon Valley posting]." Nihon Keizai Shimbun, April 26.
http://www.nikkei.com/article/DGXKZO85904140Q5A420C1X12000/.
Metrick, A. and A. Yasuda (2011). "Venture capital and other private equity: a survey."
European Financial Management 17(4): 619-654.
Nakata, T. (2013). History of Japan's Trade and Industry Policy, 1980-2000 (12): Small and
Medium-sized Enterprise Policy. Research Institute of Economy, Trade and Industry. [In
Japanese]
NVCA (2014). National Venture Capital Association Annual Report.
Odagiri, H. and T. Iwasa (2000). "1980-1990 nendaino sangyou gijutsukaihatsu seisaku – jirei
kenkyu: jisedai sangyoukiban kenkyukaihatsu seido [Industrial technology development
policy in the 1980s and 1990s –Case study: The Next-generation Basic Industrial
Technologies]." Tsushou sangyou seisaku shi kenkyu [Research on History of Japan's
Trade and Industry Policy]. Keizai Sangyo Chosakai. [in Japanese]
Okubo, T. and E. Tomiura (2012). "Industrial relocation policy, productivity and heterogeneous
plants: Evidence from Japan, " Regional Science and Urban Economics, 42(1–2),
pp.230–239.
OTL. (2014). "Stanford University Office of Technology Licensing Annual Report 2013."
Retrieved January 10, 2015, from http://otl.stanford.edu/documents/otlar13.pdf.

66
Rao, A. (2012). "Chapter 13: Helpers – lawyers and investment bankers (1970 – 2000)." In
Scaruffi, Piero, and Arun Rao, A History of Silicon Valley. Accessed at
http://www.scaruffi.com/svhistory/sv/chap85.html on June 9, 2015.
Rosenthal, S. S. and W. C. Strange (2004). "Evidence on the nature and sources of
agglomeration economies," Handbook of Regional and Urban Economics, vol.4,
Amsterdam, Elsevier
San Jose Mercury News (2005). "History of BART to the South Bay." Accessed at
<http://www.mercurynews.com/bart/ci_5162648> on January 15, 2015.
Saxenian, A. (1994). Regional Advantage: Culture and Competition in Silicon Valley and Route
128, Harvard University Press
Saxenian, A. (2006). The new argonauts : regional advantage in a global economy. Cambridge,
Mass., Harvard University Press.
Small and Medium Enterprise Agency (2000). "Points of White Paper on Small and Medium
Enterprises in Japan, 2000."
Small and Medium Enterprise Agency (2013). "2013 White Paper on Small and Medium
Enterprises in Japan."
Small and Medium Enterprise Agency (2014). "2014 White Paper on Small and Medium
Enterprises in Japan."
Stevens, A. J. (2004). "The Enactment of Bayh-Dole." Journal of Technology Transfer 29,
pp.93-99.
Suchman, M. (2000). Dealmakers and counselors: Law firms as intermediaries in the
development of Silicon Valley. In Martin Kenney, ed., Understanding Silicon Valley:
Anatomy of an Entrepreneurial Region, pp. 71-97. Stanford: Stanford University Press.
Sturgeon, T. J. (2002). "Modular production networks: a new American model of industrial
organization." Industrial and corporate change 11(3), pp.451-496.
Tan, G. (2014). "Making Things People Want." Stanford University, Stanford US-Asia
Technology Management Center Seminar Series. Dec 4, 2014.
Wahl, C. (2015a). Insights to the Japanese Entrepreneurial Mind. Tokyo, Japan: Next
Publishing.
Wahl, C. (2015b). "Recruiting Top Talent for Japanese and American Startups - Differences,
Opportunities, and Challenges." Stanford Silicon Valley - New Japan Public Forum,
Stanford University. May 14, 2015.
Watanabe, D. (2015). "Business Expansion From Japan Into Silicon Valley, Opportunities And
Challenges ~The Case Of Dena~." Stanford Silicon Valley - New Japan Public Forum,
Stanford University. February 17, 2015.

67
68
Appendix 1. Nine Innovation Policies in Abenomics
The list is based on the information on Kōtei-hyo (Table of Schedule) for the 2015
revised growth strategy (http://www.kantei.go.jp/jp/singi/keizaisaisei/skkkaigi/dai22/siryou1-
3.pdf).
i. Promote investment in venture businesses and investment by failed entrepreneurs
Innovations are often carried out by small startups. Thus, encouraging investment in
those startups would lead to more innovations. This policy area also includes policies to help
entrepreneurs who tried but failed to start new businesses. It has been often pointed out that the
Japanese business environment does not tolerate failures. Once failed, an entrepreneur cannot
get the second chance, and this discourages business formation to start with. By making it easier
for failed entrepreneurs to try again, the policy tries to increase the number of startups. The
concrete policies are:
a. Training personnel who have mature judgment and supporting personnel for new
business creation
b. Promotion of the tax break for angels
c. Tax system to promote investment in venture businesses
d. Streamline the decision making process at the Innovation Network Corporation of
Japan to enhance support for venture companies
e. Promote the investment type crowd funding
f. Establish “Guideline for Personal Guarantee by Business Owner-Manager”
g. Support spin-offs and carve-outs
h. Creation of “Competitiveness Fund” by the Japan Development Bank
i. Creation of Otemachi Innovation Hub
The KPI for this policy area is:
Increase both entry rate and exit rate to 10% by FY2016 (from 4.5% in 2004-2009
average) with positive net entry
The policy area also has the following as a supplementary KPI:
Double the Total Early-Stage Entrepreneurial Activity (TEA) in the Global
Entrepreneurship Monitor Survey in the next 10 years.
TEA is defined to be the percentage of 18-64 population who are either nascent entrepreneur or
owner-manager of new business. The most recent TEA for Japan is 3.8% (2014). Thus, the
supplemental KPI aims to increase the percentage to 7.6% by 2024.
Because a substantial part of innovation in advanced countries happens through net entry effects
as we saw in Section 1, targeting entry and exit rates may make sense. Various policies in this

69
policy area, if successful, are likely to increase entry rate, but it is not clear any of them could
increase exit rate, except for competition effects through increase of entry
ii. Establish a system which enables challenges to frontiers being free from anxiety
The idea behind this policy area is that legal and regulatory uncertainties on new products
and new businesses are holding back innovations and commercialization of them. Then,
mitigating the uncertainties would encourage innovations. The concrete policies included in this
area are:
a. Corporate Field Test System to allow testing of new products and technology that
would violate current regulation
b. Gray Zone Elimination System to confirm legality of new businesses
c. Study of the healthy longevity enhancing industries by Next Generation
Healthcare Industry Council (METI)
The first two systems have already been established by the Industrial Competitiveness
Enhancement Act of 2013 and started in January 2014. The last policy is geared specifically for
legal and regulatory uncertainties concerning health enhancing food and products, and the
Council published the interim report in June 2014.
This policy area does not have any KPIs as of this writing.
iii. Realize a virtuous cycle of venture creation
Venture capital firms set up venture capital funds and invest in startups. If a startup firm
turns out to be successful, the venture capital firm can make profits by selling the shares to the
public investors through IPO (initial public offering) or by selling the entire business to another
(typically large) corporation. The profits can be used to start a new venture capital fund, which
invest in more startups. The entrepreneur of a successful startup also makes profits, which can
be invested in a venture fund. Sometimes successful entrepreneurs start their own venture
capital firms to help other startups. The “virtuous” cycle of venture creation refers to this
dynamics of ever expanding venture funding and creation of new startups. This policy area
includes various policies to encourage such dynamics of venture business creation. The concrete
policies include:
a. Establish the Venture Business Creation Council (VBCC)
b. Encourage new entrants to government procurements
c. Public awareness reform and train entrepreneurs
d. Build a global venture ecosystem (Kakehashi Project between Silicon Valley and
Japan)
e. Collaborate with other global venture ecosystems
f. Nurture next generation global ventures

70
The VBCC was established in April 2014 as the organization to implement various policies in
this area. Their activities are reported on their website (http://vbcc.jp/).
This policy area shares the KPI with the first policy area (promote investment in venture
businesses and investment by failed entrepreneurs), and it is:
Increase both entry rate and exit rate to 10% by FY2016 (from 4.5% in 2004-2009
average) with positive net entry
The policy area also has the following as a supplementary KPI:
Double the Total Early-Stage Entrepreneurial Activity (TEA) in the Global
Entrepreneurship Monitor Survey in the next 10 years.
TEA is defined to be the percentage of 18-64 population who are either nascent entrepreneur or
owner-manager of new business. The most recent TEA for Japan is 3.8% (2014). Thus, the
supplemental KPI aims to increase the percentage to 7.6% by 2024.
As discussed above, a substantial part of innovation in advanced countries happens through net
entry effects so targeting entry and exit rates can make sense.
iv. Promote business innovation
Business innovation can mean commercialization of academic innovation, process for
innovation inside an organization, innovation in business models, or some other things. Here the
term seems to be used to describe innovation in business models especially in the service
industry. The policies seem to be motivated by the observation that innovation is especially
lacking in the service industry. To promote more innovations in the service industry, the
following policies are proposed.
a. Creation of “Japan Service Award”
b. Creation of “Service Management Programs” in colleges and graduate schools
c. Introduce certification of the quality of business support services
d. Establish “Service Guideline”
e. Enhance productivities of the service sector
The KPI for this policy area is:
Increase the labor productivity growth rate of the service sector to 2.0% by 2020
(0.8% in 2013).
v. Strengthen the Council for Science and Technology Policy’s functions as
headquarter, strengthen functions of research and development agencies, and
promote research and development by both public and private sectors

71
These are three separate policy areas in Kōtei-hyo, but we combined into one because
they are all attempts to enhance and strengthen the science and technology policy. Council for
Science and Technology Policy is a government council that was established in 2001 to be in
charge of Japan’s science and technology policy. The council is chaired by Prime Minister.
Many policies here are led by the Council. The policies include:
a. Reorganize the Council for Science and Technology Policy into the Council for
Science, Technology and Innovation Policy
b. Prioritization of the government budget for science and technology led by the
Council for Science, Technology and Innovation Policy
c. Recruiting new staff members and retention of current staff members
d. Establish “Comprehensive Strategy for Science, Technology, and Innovation
2014”
e. Creation of “Strategic Innovation Creation Program” (SIP)
f. Creation of “Innovative Research and Development Promotion Program”
(ImPACT)
g. Create new system of research and development agencies with world top level
quality
h. Reform on remuneration, salary, procurement, and self-revenue
i. Secure budget for research support personnel
The KPIs for this policy area are:
Becoming ranked top in the WEF (World Economic Forum) innovation ranking
in 5 years (by the end of March 2018)
Increase the ratio of R&D investment, including both public and private sectors,
to 4% of GDP in 5 years (by the end of March 2016)
The WEF innovation ranking is a part of the competitiveness rankings published in The Global
Competitiveness Report that the WEF publishes every year. The innovation ranking is one of the
twelve rankings that are aggregated into the competitiveness index. According to the report for
2014-2015, Japan is ranked 4th
in the innovation ranking.23
Finland, Switzerland, and Israel are
ahead of Japan. The U.S. is ranked 5th
.
vi. Establish “Innovation National System”
The core of this policy is the reform of national universities to increase their role in
creating innovations. The concrete policies include:
a. University reform
23
The report is accessible at: http://reports.weforum.org/global-competitiveness-report-2014-2015/,
accessed February 7, 2015.

72
b. Rebuild the system to allocate research grants
c. Strengthen the function of the research and development agencies such as the
National Institute of Advanced Industrial Science and Technology (AIST) and the
New Energy and Industrial Technology Development Organization (NEDO) and
Promote “Cross Appointment System”
d. Improve program management at research institutions
e. Build a new innovation cycle system to promote open innovation
The KPIs for this policy area are:
More than 10 Japanese universities in the world top 100 in 10 years (by 2023)
More than 20 new industries started by universities in 10 years (by 2023)
Increase the number of university researchers on annual salary (or mixed salary
system) to 6,000 by March 2015 and 10,000 by March 2016.
Increase the proportion of the government allocations to universities that depend
on the reform efforts to 30%-40%.
New fulltime university posts for young researchers and foreign researchers by
1,500 in 3 years (by 2016)
Becoming ranked top in the WEF (World Economic Forum) innovation ranking
in 5 years (by the end of March 2018)
Increase the number of large scale joint research projects between universities (or
research and development agencies) and corporations by 30% by the end of
March 2019.
vii. Promotion of Local Innovations
This is a policy area that has been added in the 2015 revision of the growth strategy. This
is considered to be a core policy area of “Local Abenomics,” which aims to increase productivity
growth in regional economies. The policies include:
a. Create opportunities for information exchanges in local areas by strategic area
coordinators and matching planners
b. Create regional centers for interdisciplinary research and development
c. Support local SMEs to strengthen the intellectual property strategies
d. Promote strategic standardization for SMEs
The KPIs for this policy area are:
Increase the proportion of patent applications by SMEs to 15% by March 2020.
More than 2,000 intellectual property supports per year to SMEs by 2016.
More than 1,000 patent application interviews per year at Traveling Patent
Agency by 2020.

73
More than 100 standardization of technologies and products developed by SMEs
by 2020.
viii. Strengthen strategies for intellectual properties and standardization
This is a set of policies to help Japanese corporations to acquire and protect intellectual
property rights and to make Japan play more important role in setting international standards.
The policies include:
a. Reduce wait time for examination for intellectual properties
b. Patent Law reform
c. Reform the rule on on-the-job invention
d. Promote protection of business secrecy
e. Reform of systems for standardization and certification
The KPIs for this policy area are:
Reduce the time to grant of the patent right to less than 36 months by the end of
March 2016 (already achieved by 2015)
Reduce the time to grant of the patent right to 14 months on average by the end of
March 2024
Increase the number of undertaking secretariats in the international
standardization organizations to the level to be the third in the world (95
committees) by the end of March 2016 (already achieved by 2015)
ix. Implement ”Robotics New Strategy”
This area includes policies to promote robotics industry. The policies listed are:
a. Implement “Robotics New Strategy” formulated in February 2015 by “Robotics
Revolution Realization Council”
b. “Robot Olympic” in 2020
c. Promote basic technology for Robotics
The KPIs for this policy area are:
Increase the total sales of domestically produced robots by 100% in
manufacturing and by twenty fold in non-manufacturing by 2020.
Raise the labor productivity of manufacturing by more than 2% per year.