INSTITUTIONAL DATA IN SUPPORT OF THE RESOURCE …
48
1 OIA 2008/11/28 (Rev. 2008/12/03) INSTITUTIONAL DATA IN SUPPORT OF THE RESOURCE ALLOCATION PROCESS, 2009-10 Office of Institutional Analysis TABLE OF CONTENTS Table Table Name # Page # Demographics 1. Participation of Males and Females at the University of Manitoba, 1981-2007 2. Province of Manitoba Grade 11 Enrolment, Grade 12 Graduates and Sequential Enrolment at the University of Manitoba, 1994 to 2007 Student Data 3. Undergraduate and Graduate Enrolment by Faculty/School, Full and Part-time Status, Fall Term 2007 and 2008 4. Student Enrolment Report, by Faculty/School, Full and Part-time, Fall Term 2007 and 2008 5. Undergraduate Students by Program or Area of Study and Year, Fall Term 2008 6. Graduate Enrolment, Ph.D. and Masters Students by Department, Fall Term 2008 7. A Profile of Canadian Aboriginal Students, Fall Term 2007 and 2008 8. Undergraduate Student Credit Hours, Taught by Faculty/School and Department, Fall Term 2007 and 2008 9. Matrix of Undergraduate Student Credit Hours Taught by Faculty/School, Fall Term 2008 10. Analysis of Undergraduate Student Credit Hours by Course Level, by Faculty/School, Fall Term 2008 11. International Undergraduate and Graduate Students by Faculty/ School, Full-time and Part-time, Fall Term 2007 and 2008 3 4 5 7 16 25 29 30 33 34 36
Transcript of INSTITUTIONAL DATA IN SUPPORT OF THE RESOURCE …

1OIA 2008/11/28 (Rev. 2008/12/03)
INSTITUTIONAL DATA
IN SUPPORT OF THE RESOURCE ALLOCATION PROCESS, 2009-10
Office of Institutional Analysis
TABLE OF CONTENTS
Table Table Name #
Page#
Demographics
1. Participation of Males and Females at the University of Manitoba, 1981-2007
2. Province of Manitoba Grade 11 Enrolment, Grade 12 Graduates and Sequential Enrolment at the University of Manitoba, 1994 to 2007
Student Data
3. Undergraduate and Graduate Enrolment by Faculty/School, Full and Part-time Status, Fall Term 2007 and 2008
4. Student Enrolment Report, by Faculty/School, Full and Part-time, Fall Term 2007 and 2008
5. Undergraduate Students by Program or Area of Study and Year, Fall Term 2008
6. Graduate Enrolment, Ph.D. and Masters Students by Department, Fall Term 2008
7. A Profile of Canadian Aboriginal Students, Fall Term 2007 and 2008
8. Undergraduate Student Credit Hours, Taught by Faculty/School and Department, Fall Term 2007 and 2008
9. Matrix of Undergraduate Student Credit Hours Taught by Faculty/School, Fall Term 2008
10. Analysis of Undergraduate Student Credit Hours by Course Level, by Faculty/School, Fall Term 2008
11. International Undergraduate and Graduate Students by Faculty/ School, Full-time and Part-time, Fall Term 2007 and 2008
3
4
5
7
16
25
29
30
33
34
36

OIA 2008/11/28 (Rev. 2008/12/03) 2
TABLE OF CONTENTS
Table Table Name #
Page#
12. Degrees, Diplomas and Certificates Conferred by Faculty/School, Undergraduate and Graduate, 2004 to 2008
13. Undergraduate Three-Year Average Program Cost 2004-2005 to 2006-2007, Excludes Amortization of Capital Assets
14. Graduate Total Cost per FTE Student – 2005-2006 to 2006-2007 Excludes Amortization of Capital Assets
15. Rebated Tuition Fees as a Percentage of Total Program Costs, by Faculty/School 2006-2007
Staff and Financial
16. Full-Time Equivalent Academic and Support Staff Baseline Positions, by Faculty/School, Operating Funds (as at April 1), 2008-2009 and 2007-2008
17. Full-Time Equivalent Academic and Support Staff Baseline Positions, by type of position, Operating Funds (as at April 1), Summary Report, 2007-2008 and 2008-2009
Research
18. Research Revenues from External Sources per Full-Time EquivalentStaff, by Faculty/School/Unit, 2005-2008
19. Canadian Foundation for Innovation and Manitoba Innovation Fund Awards, by Faculty/School/Unit, 2006 to 2008
38
39
40
43
44
46
47
48

3OIA 2008/11/28 (Rev. 2008/12/03)
Table 1
PAR
TIC
IPA
TIO
N O
F M
ALE
S A
ND
FEM
ALE
S A
T TH
E U
NIV
ERSI
TY O
F M
AN
ITO
BA
1981
-200
7
8%9%10%
11%
12%
13%
14%
15%
16%
17%
18%
1981
1983
1985
1987
1989
1991
1993
1995
1997
1999
2001
2003
2005
2007
Year
Participation Rate
Fem
ales
*M
ales
*
*Par
ticip
atio
n R
ates
for 1
8-24
yea
r-ol
ds in
Man
itoba
, by
sex,
198
1-20
07.
In th
e pe
riod
1981
-198
7, m
ore
men
than
wom
en a
ttend
ed U
of M
. S
ince
198
8, m
ore
wom
en th
an m
en h
ave
enro
lled.

OIA 2008/11/28 (Rev. 2008/12/03) 4
Table 2
Province of Manitoba Province of Manitoba Grade 12 GraduatesGrade 11 Enrolment 1 Grade 12 Graduates 2 Enrolled at the U of M 3
Year Grade 11 Year Grade 12 % Grade 11 Year Sequential % Grade 12 % Grade 11(Sept) Enrolment (June) Graduates Enrolment (Nov.1) Students Graduates Enrolment
1992 15,494 1994 11,270 72.7% 1994 2,443 21.7% 15.8%
1993 15,062 1995 11,074 73.5% 1995 2,087 18.8% 13.9%
1994 14,844 1996 10,993 74.1% 1996 2,161 19.7% 14.6%
1995 14,723 1997 11,138 75.7% 1997 2,117 19.0% 14.4%
1996 14,653 1998 11,181 76.3% 1998 2,256 20.2% 15.4%
1997 15,053 1999 11,026 73.2% 1999 2,289 20.8% 15.2%
1998 15,252 2000 11,428 74.9% 2000 2,403 21.0% 15.8%
1999 15,313 2001 11,488 75.0% 2001 2,529 22.0% 16.5%
2000 15,699 2002 11,489 73.2% 2002 2,562 22.3% 16.3%`
2001 15,342 2003 11,962 78.0% 2003 2,699 22.6% 17.6%
2002 15,438 2004 12,274 79.5% 2004 2,695 22.0% 17.5%
2003 15,174 2005 12,096 79.7% 2005 2,683 22.2% 17.7%
2004 15,313 2006 12,135 79.2% 2006 2,645 21.8% 17.3%
2005 15,722 2007 12,143 77.2% 2007 2,690 22.2% 17.1%
2. Includes public and private schools. Excludes mature graduates (age 21 & over) prior to 2002 and
PROVINCE OF MANITOBA GRADE 11 ENROLMENT, GRADE 12 GRADUATESAND SEQUENTIAL ENROLMENT AT THE UNIVERSITY OF MANITOBA
Source: Manitoba Education, Citizenship and Youth, Schools' Finance Branch; Enrolment Report.1. Includes public and private schools.
sequential students, the highest level experienced to date. Data as at November 1st from 1995 onward. Previous years as at December 1st. Source: Office of Institutional Analysis, The University of Manitoba.
Adult Learning Centres graduates from 2002 onward. Source: Manitoba Education, Citizenship and Youth.3. Includes full and part-time students first admitted to the university in a direct entry program. Sequential students enter university directly from high school. In 1987 and 1988, 24.6% of the Grade 12 graduates enrolled as

5OIA 2008/11/28 (Rev. 2008/12/03)
Table 3
Faculty/School Fall Term 2008 Fall Term 2007
FULL PART TOTAL FULL PART TOTAL % CHANGE
AGRICULTURAL AND FOOD SCIENCESUndergraduate 376 25 401 372 23 395 1.5Graduate 192 8 200 209 13 222 -9.9Total Faculty/School 568 33 601 581 36 617 -2.6
ARCHITECTUREUndergraduate 287 21 308 273 19 292 5.5Graduate 228 2 230 231 5 236 -2.5Total Faculty/School 515 23 538 504 24 528 1.9
ART, SCHOOL OFUndergraduate 307 75 382 319 91 410 -6.8Total Faculty/School 307 75 382 319 91 410 -6.8
ARTSUndergraduate 2514 786 3300 2725 824 3549 -7.0Graduate 451 74 525 455 69 524 0.2Total Faculty/School 2965 860 3825 3180 893 4073 -6.1
BUSINESS, ASPER SCHOOL OFUndergraduate 1461 140 1601 1422 108 1530 4.6Graduate 104 70 174 104 70 174 0.0Total Faculty/School 1565 210 1775 1526 178 1704 4.2
DENTAL HYGIENEUndergraduate 52 0 52 53 0 53 -1.9Total Faculty/School 52 0 52 53 0 53 -1.9
DENTISTRYUndergraduate 155 0 155 138 0 138 12.3Graduate 22 0 22 24 0 24 -8.3Total Faculty/School 177 0 177 162 0 162 9.3
EDUCATION 1,2
Undergraduate 518 377 895 578 417 995 -10.1Graduate 132 294 426 101 302 403 5.7Total Faculty/School 650 671 1321 679 719 1398 -5.5
ENGINEERINGUndergraduate 1033 84 1117 1094 104 1198 -6.8Graduate 263 46 309 275 39 314 -1.6Total Faculty/School 1296 130 1426 1369 143 1512 -5.7
ENVIRONMENT, EARTH, AND RESOURCES CLAYTON H. RIDDELL, FACULTY OFUndergraduate 318 89 407 322 90 412 -1.2Graduate 166 18 184 183 26 209 -12.0Total Faculty/School 484 107 591 505 116 621 -4.8
EXTENDED EDUCATIONUndergraduate 399 762 1161 393 787 1180 -1.6Total Faculty/School 399 762 1161 393 787 1180 -1.6
GRADUATE STUDIESTotal Faculty/School 55 13 68 55 14 69 -1.4
HUMAN ECOLOGY1
Undergraduate 386 56 442 430 46 476 -7.1Graduate 32 8 40 31 6 37 8.1Total Faculty/School 418 64 482 461 52 513 -6.0
KINESIOLOGY & RECREATION MANAGEMENTUndergraduate 338 69 407 341 62 403 1.0Graduate 23 6 29 20 9 29 0.0Total Faculty/School 361 75 436 361 71 432 0.9
UNDERGRADUATE AND GRADUATE ENROLMENTBY FACULTY/SCHOOL, FULL AND PART-TIME STATUS: FALL TERM 2007 AND 2008

OIA 2008/11/28 (Rev. 2008/12/03) 6
Table 3
Faculty/School Fall Term 2008 Fall Term 2007
FULL PART TOTAL FULL PART TOTAL % CHANGE
LAWUndergraduate 287 4 291 288 4 292 -0.3Graduate 3 0 3 3 0 3 0.0Total Faculty/School 290 4 294 291 4 295 -0.3
MEDICAL REHABILITATIONUndergraduate 185 6 191 190 3 193 -1.0Graduate 115 13 128 121 17 138 -7.2Total Faculty/School 300 19 319 311 20 331 -3.6
MEDICINEUndergraduate 479 0 479 468 0 468 2.4Graduate 270 36 306 257 41 298 2.7Total Faculty/School 749 36 785 725 41 766 2.5
MUSIC 2, 3
MARCEL A. DESAUTELS FACULTY OFUndergraduate 193 22 215 191 22 213 0.9Graduate 18 1 19 7 7 14 35.7Total Faculty/School 211 23 234 198 29 227 3.1
NURSINGUndergraduate4 940 238 1178 930 219 1149 2.5Graduate 36 54 90 40 52 92 -2.2Total Faculty/School 976 292 1268 970 271 1241 2.2
PHARMACYUndergraduate 189 5 194 178 17 195 -0.5Graduate 14 1 15 11 2 13 15.4Total Faculty/School 203 6 209 189 19 208 0.5
SCIENCEUndergraduate 2344 382 2726 2398 400 2798 -2.6Graduate 254 13 267 265 13 278 -4.0Total Faculty/School 2598 395 2993 2663 413 3076 -2.7
SOCIAL WORKUndergraduate 401 267 668 394 274 668 0.0Graduate 74 115 189 95 118 213 -11.3Total Faculty/School 475 382 857 489 392 881 -2.7
UNIVERSITY 1 5Undergraduate 5183 791 5974 5270 767 6037 -1.0Total Faculty/School 5183 791 5974 5270 767 6037 -1.0
SUMMARYUndergraduate 18345 4199 22544 18767 4277 23044 -2.2Graduate 2452 772 3224 2487 803 3290 -2.0
Undergraduate and graduate totals 25768 26334 -2.1
Post-Graduate Medical Education (P.G.M.E.) 470 480 -2.1
TOTALS 26238 26814 -2.1
1. Students who are enrolled in the integrated B.H.Ecol./B.Ed. Program are shown in the Faculty of Human Ecology for years 3 and 4 and in Education for year 5.2. Enrolment in the integrated B.Mus./B.Ed. Program is shown in Music for years 3 & 4 and in Education for year 5.3. The Faculty of Music changed its name to the Marcel A. Desautels Faculty of Music in 2008.4. Students entering the baccalaureate nursing program may take courses at alternate sites. Enrolments shown in this table reflect students taking U of M courses only.5. The University 1 program was introduced in 1998-1999. Most "new" students, with limited or no university experience, have registered under this program. Students must complete 24 credit hours under University 1 (and may complete up to 30), with a minimum GPA of 2.0, before transferring into a degree program.

7OIA 2008/11/28 (Rev. 2008/12/03)
Table 4
FALL
TER
M 2
008
FALL
TER
M 2
007
FULL
PAR
TFU
LLPA
RT
Fem
ale
Mal
eTo
tal
Fem
ale
Mal
eTo
tal
Fem
ale
Mal
eTo
tal
Fem
ale
Mal
eTo
tal
Fem
ale
Mal
eTo
tal
Fem
ale
Mal
eTo
tal%
Chg
AG
RIC
ULT
UR
AL
& F
OO
D S
CIE
NC
ESU
ND
ER
GR
AD
UA
TEB
.Sc.
5645
101
13
457
4810
553
4497
43
757
4710
4B
.Sc.
(Agr
ibus
ines
s)24
6286
65
1130
6797
3871
109
07
738
7811
6B
.Sc.
(Agr
oeco
logy
)8
614
00
08
614
64
101
01
74
11B
.Sc.
(Foo
d S
cien
ce)
2714
414
15
3115
4629
1342
21
331
1445
Pre
-Vet
erin
ary
00
00
00
00
01
12
00
01
12
Dip
lom
a27
9912
60
33
2710
212
916
7793
22
418
7997
Int'l
Edu
c. A
grol
ogis
t Pro
gram
(IE
AP
)12
57
11
23
69
66
120
11
67
13S
peci
al o
r Vis
iting
01
10
00
01
15
27
00
05
27
SU
BTO
TAL
144
232
376
1213
2515
624
540
115
421
837
29
1423
163
232
395
1.5%
GR
AD
UA
TEP
re-M
aste
rs0
11
10
11
12
20
20
11
21
3M
aste
rs81
4312
40
44
8147
128
7954
133
25
781
5914
0P
h.D
.20
4767
11
221
4869
1856
743
14
2157
78O
ccas
iona
l or V
isiti
ng S
tude
nt
00
00
11
01
10
00
01
10
11
SU
BTO
TAL
101
9119
22
68
103
9720
099
110
209
58
1310
411
822
2-9
.9%
TOTA
L FA
CU
LTY
/SC
HO
OL
245
323
568
1419
3325
934
260
125
332
858
114
2236
267
350
617
-2.6
%
AR
CH
ITEC
TUR
EU
ND
ER
GR
AD
UA
TEB
.E.D
.15
413
328
715
621
169
139
308
148
125
273
118
1915
913
329
2S
peci
al o
r Vis
iting
00
00
00
00
00
00
00
00
00
SU
BTO
TAL
154
133
287
156
2116
913
930
814
812
527
311
819
159
133
292
5.5%
GR
AD
UA
TEP
re-M
aste
rs16
1127
00
016
1127
1410
240
00
1410
24M
aste
rs11
585
200
02
211
587
202
127
7920
60
44
127
8321
0P
h.D
.0
11
00
00
11
00
00
00
00
0O
ccas
iona
l or V
isiti
ng S
tude
nt
00
00
00
00
00
11
01
10
22
SU
BTO
TAL
131
9722
80
22
131
9923
014
190
231
05
514
195
236
-2.5
%
TOTA
L FA
CU
LTY
/SC
HO
OL
285
230
515
158
2330
023
853
828
921
550
411
1324
300
228
528
1.9%
AR
T, S
CH
OO
L O
FU
ND
ER
GR
AD
UA
TEB
.F.A
.15
751
208
4211
5319
962
261
163
5521
845
1661
208
7127
9B
.F.A
. (H
ons.
)43
2164
78
1550
2979
4432
769
413
5336
89B
.F.A
. Art
His
tor y
74
112
02
94
137
07
21
39
110
B.F
.A. A
rt H
isto
ry (H
ons.
)6
06
10
17
07
11
21
01
21
3D
iplo
ma
135
182
13
156
2111
415
65
1117
926
Spe
cial
or V
isiti
ng0
00
01
10
11
10
10
22
12
3S
UB
TOTA
L22
681
307
5421
7528
010
238
222
792
319
6328
9129
012
041
0-6
.8%
TOTA
L FA
CU
LTY
/SC
HO
OL
226
8130
754
2175
280
102
382
227
9231
963
2891
290
120
410
-6.8
%
STU
DEN
T EN
RO
LMEN
T R
EPO
RT
As
at N
ovem
ber 1
st
TOTA
LTO
TAL

OIA 2008/11/28 (Rev. 2008/12/03) 8
Table 4
FALL
TER
M 2
008
FALL
TER
M 2
007
FULL
PAR
TFU
LLPA
RT
Fem
ale
Mal
eTo
tal
Fem
ale
Mal
eTo
tal
Fem
ale
Mal
eTo
tal
Fem
ale
Mal
eTo
tal
Fem
ale
Mal
eTo
tal
Fem
ale
Mal
eTo
tal%
Chg
TOTA
LTO
TAL
AR
TSU
ND
ER
GR
AD
UA
TEB
. Arts
1177
871
2048
413
290
703
1590
1161
2751
1238
994
2232
410
326
736
1648
1320
2968
B. A
rts (A
dvan
ced)
130
7720
725
1641
155
9324
814
981
230
2418
4217
399
272
B. A
rts (H
onou
rs)
122
8320
519
625
141
8923
013
084
214
1612
2814
696
242
Spe
cial
or V
isiti
ng22
1133
84
1230
1545
1410
243
811
1718
35S
t. B
onifa
ce2
174
214
15
215
2623
225
70
730
232
SU
BTO
TAL
1468
1046
2514
469
317
786
1937
1363
3300
1554
1171
2725
460
364
824
2014
1535
3549
-7.0
%
GR
AD
UA
TEP
re-M
aste
rs12
1022
63
918
1331
615
219
615
1521
36Jo
int M
aste
rs3
2825
5314
1024
4235
7728
3361
1110
2139
4382
Mas
ters
130
7320
314
822
144
8122
514
272
214
128
2015
480
234
Mas
ters
- S
t. B
onifa
ce2
55
100
00
55
108
513
00
08
513
Ph.
D.
108
5316
14
15
112
5416
692
5214
43
14
9553
148
Occ
asio
nal o
r Vis
iting
Stu
dent
2
02
95
1411
516
02
27
29
74
11S
UB
TOTA
L28
516
645
147
2774
332
193
525
276
179
455
4227
6931
820
652
40.
2%
TOTA
L FA
CU
LTY
/SC
HO
OL
1753
1212
2965
516
344
860
2269
1556
3825
1830
1350
3180
502
391
893
2332
1741
4073
-6.1
%
BU
SIN
ESS,
ASP
ER S
CH
OO
L O
FU
ND
ER
GR
AD
UA
TEB
. Com
m. H
ons.
595
764
1359
6062
122
655
826
1481
588
739
1327
3262
9462
080
114
21B
. Com
m. H
ons
- AC
C4
Join
t pro
gram
01
10
00
01
10
22
00
00
22
B. C
omm
. Hon
s - É
TP4 J
oint
pro
gram
00
00
00
00
01
12
00
01
12
B. C
omm
. Hon
s - R
RC
4Jo
int p
rogr
am34
3367
107
1744
4084
2033
537
411
2737
64A
dvan
ced
Dip
lom
a - A
ctua
rial S
tudi
es0
00
00
00
00
00
00
00
00
0S
peci
al o
r Vis
iting
1613
290
00
1613
2917
1027
01
117
1128
St.
Bon
iface
22
35
10
13
36
83
110
22
85
13S
UB
TOTA
L64
781
414
6171
6914
071
888
316
0163
478
814
2239
6910
867
385
715
304.
6%
GR
AD
UA
TEP
re-M
aste
rs0
00
00
00
00
00
00
00
00
0M
aste
rs33
4982
2941
7062
9015
236
4783
2641
6762
8815
0P
h.D
.12
1022
00
012
1022
138
210
00
138
21O
ccas
iona
l or V
isiti
ng S
tude
nt
00
00
00
00
00
00
12
31
23
SU
BTO
TAL
4559
104
2941
7074
100
174
4955
104
2743
7076
9817
40.
0%
TOTA
L FA
CU
LTY
/SC
HO
OL
692
873
1565
100
110
210
792
983
1775
683
843
1526
6611
217
874
995
517
044.
2%
DEN
TAL
HYG
IEN
EU
ND
ER
GR
AD
UA
TED
iplo
ma
in D
enta
l Hyg
iene
466
520
00
466
5251
253
00
051
253
Spe
cial
or V
isiti
ng0
00
00
00
00
00
00
00
00
0S
UB
TOTA
L46
652
00
046
652
512
530
00
512
53-1
.9%
TOTA
L FA
CU
LTY
/SC
HO
OL
466
520
00
466
5251
253
00
051
253
-1.9
%

9OIA 2008/11/28 (Rev. 2008/12/03)
Table 4FA
LL T
ERM
200
8FA
LL T
ERM
200
7
FULL
PAR
TFU
LLPA
RT
Fem
ale
Mal
eTo
tal
Fem
ale
Mal
eTo
tal
Fem
ale
Mal
eTo
tal
Fem
ale
Mal
eTo
tal
Fem
ale
Mal
eTo
tal
Fem
ale
Mal
eTo
tal%
Chg
TOTA
LTO
TAL
DEN
TIST
RY
UN
DE
RG
RA
DU
ATE
Doc
tor o
f Den
tal M
edic
ine
(DM
D)
5564
119
00
055
6411
953
6311
60
00
5363
116
Int'l
Den
tist D
egre
e P
rogr
am (I
DD
P)
74
110
00
74
116
511
00
06
511
B.S
c. (D
entis
try)5
817
250
00
817
255
611
00
05
611
Spe
cial
or V
isiti
ng0
00
00
00
00
00
00
00
00
0S
UB
TOTA
L70
8515
50
00
7085
155
6474
138
00
064
7413
812
.3%
GR
AD
UA
TEP
re-M
aste
rs0
00
00
00
00
00
00
00
00
0M
aste
rs11
1122
00
011
1122
1211
230
00
1211
23P
h.D
.0
00
00
00
00
01
10
00
01
1O
ccas
iona
l or V
isiti
ng S
tude
nt
00
00
00
00
00
00
00
00
00
SU
BTO
TAL
1111
220
00
1111
2212
1224
00
012
1224
-8.3
%
TOTA
L FA
CU
LTY
/SC
HO
OL
8196
177
00
081
9617
776
8616
20
00
7686
162
9.3%
EDU
CA
TIO
NU
ND
ER
GR
AD
UA
TEB
.Ed.
(Ear
ly Y
ears
)92
1811
03
03
9518
113
101
2312
43
03
104
2312
7B
.Ed.
(Mid
dle
Yea
rs)
7344
117
50
578
4412
272
5512
71
34
7358
131
B.E
d. (S
enio
r Yea
rs)
115
9721
25
27
120
9921
913
010
323
37
411
137
107
244
B.E
d. (M
iddl
e Y
ears
) Wee
kend
Col
lege
1713
300
11
1714
3123
831
00
023
831
B.H
.Eco
l./B
.Ed.
6- Y
ear 5
40
40
00
40
47
07
00
07
07
B.M
us./B
.Ed.
7 - Y
ear 5
126
181
01
136
1915
217
10
116
218
Pos
t-Bac
cala
urea
te C
ertif
icat
e in
Edu
c.0
00
81
98
19
10
113
417
144
18P
ost-B
acca
laur
eate
Dip
lom
a in
Edu
c.12
416
278
6133
929
065
355
215
2629
671
367
317
7639
3In
tern
atio
nally
Edu
cate
d Te
ache
rs (I
ET)
64
101
01
74
116
410
10
17
411
Spe
cial
or V
isiti
ng1
01
00
01
01
00
00
00
00
0S
t. B
onifa
ce2
00
09
211
92
112
02
112
1313
215
SU
BTO
TAL
332
186
518
310
6737
764
225
389
537
820
057
833
384
417
711
284
995
-10.
1%
GR
AD
UA
TEP
re-M
aste
rs0
00
00
00
00
00
00
00
00
0M
aste
rs37
1148
177
7224
921
483
297
419
5017
179
250
212
8830
0P
h.D
.28
1240
142
1642
1456
2011
3113
215
3313
46O
ccas
iona
l or V
isiti
ng S
tude
nt
00
01
01
10
11
01
10
12
02
Pre
-Mas
ters
- S
t. B
onifa
ce2
10
11
01
20
20
00
10
11
01
Mas
ters
- S
t. B
onifa
ce2
2320
4319
827
4228
7014
519
2213
3536
1854
SU
BTO
TAL
8943
132
212
8229
430
112
542
676
2510
120
894
302
284
119
403
5.7%
TOTA
L FA
CU
LTY
/SC
HO
OL
421
229
650
522
149
671
943
378
1321
454
225
679
541
178
719
995
403
1398
-5.5
%
ENG
INEE
RIN
GU
ND
ER
GR
AD
UA
TEB
.Sc.
in E
ngin
eerin
g (B
iosy
stem
s)24
3963
03
324
4266
2544
691
67
2650
76B
.Sc.
in E
ngin
eerin
g (C
ivil )
3919
823
72
1113
4120
925
039
197
236
313
1642
210
252
B.S
c. in
Eng
inee
ring
(Com
pute
r)6
8086
24
68
8492
986
951
78
1093
103
B.S
c. in
Eng
inee
ring
(Ele
ctric
al)
1611
413
02
79
1812
113
917
126
143
013
1317
139
156
B.S
c. in
Eng
inee
ring
(Man
ufac
turin
g)1
2324
03
31
2627
324
270
22
326
29B
.Sc.
in E
ngin
eerin
g (M
echa
nica
l)17
290
307
026
2617
316
333
2329
231
53
2225
2631
434
0

OIA 2008/11/28 (Rev. 2008/12/03) 10
Table 4
FALL
TER
M 2
008
FALL
TER
M 2
007
FULL
PAR
TFU
LLPA
RT
Fem
ale
Mal
eTo
tal
Fem
ale
Mal
eTo
tal
Fem
ale
Mal
eTo
tal
Fem
ale
Mal
eTo
tal
Fem
ale
Mal
eTo
tal
Fem
ale
Mal
eTo
tal%
Chg
TOTA
LTO
TAL
ENG
INEE
RIN
G(C
ontin
ued)
UN
DE
RG
RA
DU
ATE
B.S
c. in
Eng
inee
ring
- Und
ecla
red
2713
616
33
1316
3014
917
930
161
191
620
2636
181
217
Int'l
Edu
c. E
ngin
eers
Qua
lific
atio
n (IE
EQ
)3
69
17
84
1317
16
72
24
38
11S
peci
al o
r Vis
iting
410
140
00
410
141
1011
03
31
1314
SU
BTO
TAL
137
896
1033
1074
8414
797
011
1714
894
610
9416
8810
416
410
3411
98-6
.8%
GR
AD
UA
TEP
re-M
aste
rs0
00
00
00
00
00
00
00
00
0M
aste
rs21
100
121
722
2928
122
150
2310
813
14
2125
2712
915
6P
h.D
.20
122
142
112
1321
134
155
2012
414
42
911
2213
315
5O
ccas
iona
l or V
isiti
ng S
tude
nt
00
01
34
13
40
00
03
30
33
SU
BTO
TAL
4122
226
39
3746
5025
930
943
232
275
633
3949
265
314
-1.6
%
TOTA
L FA
CU
LTY
/SC
HO
OL
178
1118
1296
1911
113
019
712
2914
2619
111
7813
6922
121
143
213
1299
1512
-5.7
%
ENVI
RO
NM
ENT,
EA
RTH
, AN
D R
ESO
UR
CES
, C
LAYT
ON
H. R
IDD
ELL
FAC
ULT
Y O
FU
ND
ER
GR
AD
UA
TEG
ener
al27
2855
1120
3138
4886
4034
7411
1627
5150
101
Adv
ance
d0
55
00
00
55
15
61
01
25
7M
ajor
9012
121
116
1834
106
139
245
8912
121
012
1931
101
140
241
Hon
ours
2220
423
25
2522
4715
1328
50
520
1333
Spe
cial
or V
isiti
ng1
45
136
1914
1024
13
422
426
237
30S
UB
TOTA
L14
017
831
843
4689
183
224
407
146
176
322
5139
9019
721
541
2-1
.2%
GR
AD
UA
TEP
re-M
aste
rs0
00
00
00
00
00
00
00
00
0M
aste
rs67
5011
77
815
7458
132
7154
125
139
2284
6314
7P
h.D
.19
3049
12
320
3252
2236
580
11
2237
59O
ccas
iona
l or V
isiti
ng S
tude
nt
00
00
00
00
00
00
30
33
03
SU
BTO
TAL
8680
166
810
1894
9018
493
9018
316
1026
109
100
209
-12.
0%
TOTA
L FA
CU
LTY
/SC
HO
OL
226
258
484
5156
107
277
314
591
239
266
505
6749
116
306
315
621
-4.8
%
EXTE
ND
ED E
DU
CA
TIO
N
UN
DE
RG
RA
DU
ATE
Abo
rigin
al F
ocus
Dip
lom
aA
borig
inal
Chi
ld &
Fam
ily S
ervi
ces
31
40
00
31
412
113
40
416
117
Abo
rigin
al C
omm
unity
Wel
lnes
s13
417
94
1322
830
83
1112
315
206
26G
ener
al S
tudi
esA
uditi
ng, S
peci
al o
r Vis
iting
212
166
378
513
235
748
725
401
1126
205
164
369
512
232
744
717
396
1113
1.2%
Oth
er Firs
t Nat
ion
Hea
lth0
00
00
00
00
00
012
214
122
14La
bour
Rel
atio
ns &
Wor
kpla
ce S
t. 0
00
01
10
11
00
00
33
03
3S
t. B
onifa
ce2
00
00
00
00
00
00
52
75
27
SU
BTO
TAL
228
171
399
522
240
762
750
411
1161
225
168
393
545
242
787
770
410
1180
-1.6
%
TOTA
L FA
CU
LTY
/SC
HO
OL
228
171
399
522
240
762
750
411
1161
225
168
393
545
242
787
770
410
1180
-1.6
%

11OIA 2008/11/28 (Rev. 2008/12/03)
Table 4
FALL
TER
M 2
008
FALL
TER
M 2
007
FULL
PAR
TFU
LLPA
RT
Fem
ale
Mal
eTo
tal
Fem
ale
Mal
eTo
tal
Fem
ale
Mal
eTo
tal
Fem
ale
Mal
eTo
tal
Fem
ale
Mal
eTo
tal
Fem
ale
Mal
eTo
tal%
Chg
TOTA
LTO
TAL
GR
AD
UA
TE S
TUD
IES
Mas
ters
Inte
rdis
cipl
inar
y1
01
00
01
01
00
00
00
00
0D
isab
ility
Stu
die s
56
118
08
136
197
512
71
814
620
Ph.
D. App
lied
Hea
lth S
cien
ces8
100
102
02
120
127
07
10
18
08
Can
cer C
ontro
l0
00
10
11
01
10
10
00
10
1Fo
od &
Nut
ritio
nal S
cien
ces
66
121
01
76
138
412
10
19
413
Inte
rdis
cipl
inar
y6
17
01
16
28
81
91
12
92
11P
eace
& C
onfli
ct S
tudi
es9
514
00
09
514
104
140
00
104
14O
ccas
iona
l or V
isiti
ng S
tude
nt
00
00
00
00
00
00
20
22
02
SU
BTO
TAL
3718
5512
113
4919
6841
1455
122
1453
1669
-1.4
%
TOTA
L FA
CU
LTY
/SC
HO
OL
3718
5512
113
4919
6841
1455
122
1453
1669
-1.4
%
HU
MA
N E
CO
LOG
YU
ND
ER
GR
AD
UA
TEB
. Hea
lth S
cien
ces
71
81
01
81
93
14
00
03
14
B. H
ealth
Stu
dies
70
70
00
70
73
03
00
03
03
B. H
uman
Eco
logy
911
65
121
210
2113
75
142
150
915
911
112
161
1017
1B
. Sc.
(Hum
an N
utrit
iona
l Sci
.)21
218
230
195
2423
123
254
218
1523
322
325
240
1825
8B
. Sc.
(Tex
tile
Sci
. )19
019
70
726
026
280
281
01
290
29B
.H. E
col./
B.E
d.6
00
00
00
00
02
02
10
13
03
Spe
cial
or V
isiti
ng0
11
30
33
14
01
17
07
71
8S
UB
TOTA
L36
125
386
515
5641
230
442
404
2643
042
446
446
3047
6-7
.1%
GR
AD
UA
TEP
re-M
aste
rs2
02
00
02
02
10
10
00
10
1M
aste
rs29
130
80
837
138
282
306
06
342
36O
ccas
iona
l or V
isiti
ng S
tude
nt
00
00
00
00
00
00
00
00
00
SU
BTO
TAL
311
328
08
391
4029
231
60
635
237
8.1%
TOTA
L FA
CU
LTY
/SC
HO
OL
392
2641
859
564
451
3148
243
328
461
484
5248
132
513
-6.0
%
KIN
ESIO
LOG
Y an
d R
ECR
EATI
ON
MA
NA
GEM
ENT
UN
DE
RG
RA
DU
ATE
B. P
hysi
cal E
duca
tion
4352
9510
1121
5363
116
5459
113
713
2061
7213
3B
. Kin
esio
log y
101
8418
57
714
108
9119
990
7516
54
610
9481
175
B. R
ec. M
gmt.
& C
omm
unity
Dev
elop
men
t35
1954
1814
3253
3386
4023
6320
1232
6035
95S
peci
al o
r Vis
iting
22
42
02
42
60
00
00
00
00
SU
BTO
TAL
181
157
338
3732
6921
818
940
718
415
734
131
3162
215
188
403
1.0%
GR
AD
UA
TEP
re-M
aste
rs1
01
01
11
12
00
01
01
10
1M
aste
rs11
1122
23
513
1427
911
202
68
1117
28O
ccas
iona
l or V
isiti
ng S
tude
nt
00
00
00
00
00
00
00
00
00
SU
BTO
TAL
1211
232
46
1415
299
1120
36
912
1729
0.0%
TOTA
L FA
CU
LTY
/SC
HO
OL
193
168
361
3936
7523
220
443
619
316
836
134
3771
227
205
432
0.9%

OIA 2008/11/28 (Rev. 2008/12/03) 12
Table 4
FALL
TER
M 2
008
FALL
TER
M 2
007
FULL
PAR
TFU
LLPA
RT
Fem
ale
Mal
eTo
tal
Fem
ale
Mal
eTo
tal
Fem
ale
Mal
eTo
tal
Fem
ale
Mal
eTo
tal
Fem
ale
Mal
eTo
tal
Fem
ale
Mal
eTo
tal%
Chg
TOTA
LTO
TAL
LAW
UN
DE
RG
RA
DU
ATE
Bac
helo
r of L
aws
(L.L
.B.)
116
156
272
00
011
615
627
212
414
326
70
11
124
144
268
Bac
helo
r of L
aws
(L.L
.B.)
- Hal
f-tim
e3
69
21
35
712
94
131
12
105
15S
peci
al o
r Vis
iting
24
60
11
25
75
38
01
15
49
SU
BTO
TAL
121
166
287
22
412
316
829
113
815
028
81
34
139
153
292
-0.3
%
GR
AD
UA
TEM
aste
rs1
23
00
01
23
21
30
00
21
3O
ccas
iona
l or V
isiti
ng S
tude
nt
00
00
00
00
00
00
00
00
00
SU
BTO
TAL
12
30
00
12
32
13
00
02
13
0.0%
TOTA
L FA
CU
LTY
/SC
HO
OL
122
168
290
22
412
417
029
414
015
129
11
34
141
154
295
-0.3
%
MED
ICA
L R
EHA
BIL
ITA
TIO
NU
ND
ER
GR
AD
UA
TEB
.M.R
. Phy
sica
l The
rap y
107
3414
12
02
109
3414
311
335
148
10
111
435
149
B.M
.R. R
espi
rato
ry T
hera
py
3113
442
02
3313
4628
1442
20
230
1444
Spe
cial
or V
isiti
ng0
00
02
20
22
00
00
00
00
0S
UB
TOTA
L13
847
185
42
614
249
191
141
4919
03
03
144
4919
3-1
.0%
GR
AD
UA
TEM
aste
rs10
213
115
103
1311
216
128
106
1512
113
417
119
1913
8O
ccas
iona
l or V
isiti
ng S
tude
nt
00
00
00
00
00
00
00
00
00
SU
BTO
TAL
102
1311
510
313
112
1612
810
615
121
134
1711
919
138
-7.2
%
TOTA
L FA
CU
LTY
/SC
HO
OL
240
6030
014
519
254
6531
924
764
311
164
2026
368
331
-3.6
%
MED
ICIN
EU
ND
ER
GR
AD
UA
TED
octo
r of M
edic
ine
(M.D
. )19
620
840
40
00
196
208
404
180
207
387
00
018
020
738
7E
xter
nals
2016
360
00
2016
3619
1938
00
019
1938
B.S
c. (M
edic
ine)
516
2339
00
016
2339
1528
430
00
1528
43S
peci
al o
r Vis
iting
00
00
00
00
00
00
00
00
00
SU
BTO
TAL
232
247
479
00
023
224
747
921
425
446
80
00
214
254
468
2.4%
GR
AD
UA
TEP
re-M
aste
rs0
11
10
11
12
00
01
12
11
2M
aste
rs10
103
4314
69
615
112
4916
191
4313
410
313
101
4614
7D
iplo
ma
11
20
00
11
21
12
00
01
12
Ph.
D.
6556
121
111
1276
5713
363
5712
011
112
7458
132
Occ
asio
nal o
r Vis
iting
Stu
dent
0
00
71
87
18
10
19
514
105
15S
UB
TOTA
L16
910
127
028
836
197
109
306
156
101
257
3110
4118
711
129
82.
7%
PO
STG
RA
DU
ATE
ME
DIC
AL
ED
UC
ATI
ON
11
Pos
tgra
duat
e M
edic
al E
duca
tion
180
290
470
00
018
029
047
020
028
048
00
00
200
280
480
SU
BTO
TAL
180
290
470
00
018
029
047
020
028
048
00
00
200
280
480
-2.1
%
TOTA
L FA
CU
LTY
/SC
HO
OL
581
638
1219
288
3660
964
612
5557
063
512
0531
1041
601
645
1246
0.7%

13OIA 2008/11/28 (Rev. 2008/12/03)
Table 4FA
LL T
ERM
200
8FA
LL T
ERM
200
7
FULL
PAR
TFU
LLPA
RT
Fem
ale
Mal
eTo
tal
Fem
ale
Mal
eTo
tal
Fem
ale
Mal
eTo
tal
Fem
ale
Mal
eTo
tal
Fem
ale
Mal
eTo
tal
Fem
ale
Mal
eTo
tal%
Chg
TOTA
LTO
TAL
MU
SIC
, MA
RC
EL A
. DES
AU
TELS
FA
CU
LTY
OF12
UN
DE
RG
RA
DU
ATE
B. J
azz
Stu
dies
135
1924
01
15
2025
00
00
00
00
0B
. Mus
. - C
ompo
sitio
n0
11
01
10
22
13
40
00
13
4B
. Mus
. - G
ener
al62
3910
18
412
7043
113
6445
109
26
866
5111
7B
. Mus
. - H
isto
r y0
00
00
00
00
10
11
01
20
2B
. Mus
. - P
erfo
rman
ce14
620
32
517
825
1714
317
29
2416
40M
usic
- U
ndec
lare
d0
22
00
00
22
35
80
00
35
8B
.Mus
./B.E
d.7
2713
401
01
2813
4123
1134
10
124
1135
Pos
t-Bac
cala
urea
te -
Dip
lom
a5
05
20
27
07
30
32
02
50
5S
peci
al o
r Vis
iting
00
00
00
00
00
11
01
10
22
SU
BTO
TAL
113
8019
314
822
127
8821
511
279
191
139
2212
588
213
0.9%
GR
AD
UA
TEM
aste
rs9
918
10
110
919
34
77
07
104
14O
ccas
iona
l or V
isiti
ng S
tude
nt
00
00
00
00
00
00
00
00
00
SU
BTO
TAL
99
181
01
109
193
47
70
710
414
35.7
%
TOTA
L FA
CU
LTY
/SC
HO
OL
122
8921
115
823
137
9723
411
583
198
209
2913
592
227
3.1%
NU
RSI
NG
UN
DE
RG
RA
DU
ATE
14
B. o
f Nur
sing
(B.N
.)62
491
715
3312
4565
710
376
062
890
718
355
4066
395
758
B.N
. - A
ccel
erat
ed
21
31
01
31
42
02
11
23
14
B.N
. - N
orw
ay H
ouse
152
02
30
35
05
40
43
03
70
7B
.N. -
UM
/Red
Riv
er C
olle
ge12
210
132
305
3515
215
167
107
1812
519
221
126
2014
6B
.N. -
UM
/Uni
v. C
olle
ge o
f the
Nor
th16
793
8219
322
986
104
524
567
07
594
63B
acc.
Pro
gram
for R
eg. N
urse
s (B
PR
N)
51
612
48
132
129
913
88
08
138
814
614
68
154
Spe
cial
or V
isiti
ng0
00
00
00
00
134
170
00
134
17S
UB
TOTA
L83
410
694
021
028
238
1044
134
1178
814
116
930
203
1621
910
1713
211
492.
5%
GR
AD
UA
TEM
aste
rs32
436
513
5483
790
373
4045
550
828
90P
h.D
.0
00
00
00
00
00
00
00
00
0O
ccas
iona
l or V
isiti
ng S
tude
nt
00
00
00
00
00
00
20
22
02
SU
BTO
TAL
324
3651
354
837
9037
340
475
5284
892
-2.2
%
TOTA
L FA
CU
LTY
/SC
HO
OL
866
110
976
261
3129
211
2714
112
6885
111
997
025
021
271
1101
140
1241
2.2%
PHA
RM
AC
YU
ND
ER
GR
AD
UA
TEB
.Sc.
in P
harm
acy
121
6818
93
25
124
7019
412
355
178
107
1713
362
195
Spe
cial
or V
isiti
ng0
00
00
00
00
00
00
00
00
0S
UB
TOTA
L12
168
189
32
512
470
194
123
5517
810
717
133
6219
5-0
.5%
GR
AD
UA
TEM
aste
rs2
24
10
13
25
10
11
12
21
3P
h.D
.6
410
00
06
410
64
100
00
64
10O
ccas
iona
l or V
isiti
ng S
tude
nt
00
00
00
00
00
00
00
00
00
SU
BTO
TAL
86
141
01
96
157
411
11
28
513
15.4
%
TOTA
L FA
CU
LTY
/SC
HO
OL
129
7420
34
26
133
7620
913
059
189
118
1914
167
208
0.5%

OIA 2008/11/28 (Rev. 2008/12/03) 14
Table 4
FALL
TER
M 2
008
FALL
TER
M 2
007
FULL
PAR
TFU
LLPA
RT
Fem
ale
Mal
eTo
tal
Fem
ale
Mal
eTo
tal
Fem
ale
Mal
eTo
tal
Fem
ale
Mal
eTo
tal
Fem
ale
Mal
eTo
tal
Fem
ale
Mal
eTo
tal%
Chg
TOTA
LTO
TAL
SCIE
NC
EU
ND
ER
GR
AD
UA
TEB
.Sc.
817
746
1563
171
143
314
988
889
1877
809
809
1618
158
188
346
967
997
1964
B.S
c. (M
ajor
)17
725
943
625
3257
202
291
493
204
238
442
1227
3921
626
548
1B
.Sc.
(Hon
ours
)11
711
523
21
01
118
115
233
114
124
238
11
211
512
524
0B
. Com
pute
r Sc.
(Hon
ours
)9
9099
05
59
9510
48
8290
04
48
8694
Spe
cial
or V
isiti
ng3
58
30
36
511
32
54
26
74
11S
t. B
onifa
ce2
51
62
02
71
82
35
12
33
58
SU
BTO
TAL
1128
1216
2344
202
180
382
1330
1396
2726
1140
1258
2398
176
224
400
1316
1482
2798
-2.6
%
GR
AD
UA
TEP
re-M
aste
rs0
00
12
31
23
01
10
00
01
1M
aste
rs42
9814
02
35
4410
114
555
9515
01
78
5610
215
8P
h.D
.39
7511
41
23
4077
117
3777
114
01
137
7811
5O
ccas
iona
l or V
isiti
ng S
tude
nt
00
02
02
20
20
00
22
42
24
SU
BTO
TAL
8117
325
46
713
8718
026
792
173
265
310
1395
183
278
-4.0
%
TOTA
L FA
CU
LTY
/SC
HO
OL
1209
1389
2598
208
187
395
1417
1576
2993
1232
1431
2663
179
234
413
1411
1665
3076
-2.7
%
SOC
IAL
WO
RK
UN
DE
RG
RA
DU
ATE
B.S
.W.
8014
9425
631
105
2012
582
2010
216
420
9824
122
B.S
.W. -
Con
cent
rate
d52
860
32
555
1065
4812
604
15
5213
65B
.S.W
. - D
ista
nce
Del
iver
y88
1910
715
425
179
242
4428
674
983
157
2818
523
137
268
B.S
.W. -
Inne
r City
Soc
ial W
ork17
109
811
735
540
144
1315
710
110
111
4112
5314
222
164
B.S
.W. -
Nor
ther
n pr
ogra
m (A
cces
s en
try)
191
208
19
272
2927
229
71
834
337
B.S
.W. -
Nor
ther
n pr
ogra
m (E
xter
nal e
ntry
)3
03
20
25
05
71
80
00
71
8S
peci
al o
r Vis
iting
00
00
11
01
10
11
30
33
14
SU
BTO
TAL
351
5040
122
740
267
578
9066
833
955
394
228
4627
456
710
166
80.
0%
GR
AD
UA
TEP
re-M
aste
rs0
00
172
1917
219
60
610
010
160
16M
aste
rs49
1160
7219
9112
130
151
6515
8081
1910
014
634
180
Ph.
D.
104
141
01
114
158
19
31
411
213
Occ
asio
nal o
r Vis
iting
Stu
dent
0
00
31
43
14
00
02
24
22
4S
UB
TOTA
L59
1574
9322
115
152
3718
979
1695
9622
118
175
3821
3-1
1.3%
TOTA
L FA
CU
LTY
/SC
HO
OL
410
6547
532
062
382
730
127
857
418
7148
932
468
392
742
139
881
-2.7
%
UN
IVER
SITY
118
UN
DE
RG
RA
DU
ATE
Firs
t Yea
r - n
ew19
1961
1526
3487
182
148
330
2143
1674
3817
2009
1550
3559
136
150
286
2145
1700
3845
-0.7
% C
ontin
uing
884
802
1686
230
229
459
1114
1031
2145
852
850
1702
264
215
479
1116
1065
2181
-1.7
%S
peci
al o
r Vis
iting
00
00
00
00
00
00
00
00
00
St.
Bon
iface
23
710
11
24
812
72
91
12
83
11S
UB
TOTA
L28
4823
3551
8341
337
879
132
6127
1359
7428
6824
0252
7040
136
676
732
6927
6860
37-1
.0%
TOTA
L FA
CU
LTY
/SC
HO
OL
2848
2335
5183
413
378
791
3261
2713
5974
2868
2402
5270
401
366
767
3269
2768
6037
-1.0
%

15OIA 2008/11/28 (Rev. 2008/12/03)
Table 4FA
LL T
ERM
200
8FA
LL T
ERM
200
7
FULL
PAR
TFU
LLPA
RT
Fem
ale
Mal
eTo
tal
Fem
ale
Mal
eTo
tal
Fem
ale
Mal
eTo
tal
Fem
ale
Mal
eTo
tal
Fem
ale
Mal
eTo
tal
Fem
ale
Mal
eTo
tal%
Chg
TOTA
LTO
TAL
SUM
MA
RY:
UN
DER
GR
AD
UA
TED
egre
e95
5679
0317
459
1808
1197
3005
1136
491
0020
464
9723
8178
1790
117
0912
8629
9511
432
9464
2089
6D
iplo
ma
119
119
238
291
7036
141
018
959
912
292
214
322
8440
644
417
662
0B
.Sc.
(Den
tistry
)58
1725
00
08
1725
56
110
00
56
11B
.Sc.
(Med
icin
e)5
1623
390
00
1623
3915
2843
00
015
2843
Spe
cial
or V
isiti
ng s
tude
nts
263
217
480
542
250
792
805
467
1272
265
211
476
551
254
805
816
465
1281
Oth
er31
3162
119
2042
4082
3436
7028
937
6245
107
St.
Bon
iface
stu
dent
s227
1542
174
2144
1963
4210
5225
934
6719
86U
ND
ERG
RA
DU
ATE
TO
TAL
1002
083
2518
345
2669
1530
4199
1268
998
5522
544
1020
685
6118
767
2635
1642
4277
1284
110
203
2304
4-2
.2%
GR
AD
UA
TE20
Pre
-Mas
ters
3123
5426
834
5731
8829
2655
218
2950
3484
Join
t Mas
ters
328
2553
1410
2442
3577
2833
6111
1021
3943
82M
aste
rs88
162
215
0339
819
459
212
7981
620
9593
562
815
6340
121
361
413
3684
121
77D
iplo
ma
11
20
00
11
21
12
00
01
12
Ph.
D.
358
426
784
3822
6039
644
884
433
343
676
938
1856
371
454
825
Occ
asio
nal o
r Vis
iting
stu
dent
s2
02
2311
3425
1136
23
529
1847
3121
52S
t. B
onifa
ce s
tude
nts2
2925
5420
828
4933
8222
1032
2313
3645
2368
GR
AD
UA
TE T
OTA
L13
3011
2224
5251
925
377
218
4913
7532
2413
5011
3724
8752
328
080
318
7314
1732
90-2
.0%
PO
STG
RA
DU
ATE
ME
DIC
AL
ED
UC
ATI
ON
1118
029
047
00
00
180
290
470
200
280
480
00
020
028
048
0-2
.1%
TOTA
L ST
UD
ENTS
1153
097
3721
267
3188
1783
4971
1471
811
520
2623
811
756
9978
2173
431
5819
2250
8014
914
1190
026
814
-2.1
%N
otes
:
1.Th
e In
tern
atio
nally
Edu
cate
d A
grol
ogis
t Pilo
t pro
gram
(IE
AP
) was
intro
duce
d in
Fal
l Ter
m 2
007.
2.
St.
Bon
iface
Col
lege
stu
dent
s ar
e in
clud
ed in
hea
dcou
nts
whe
n re
gist
ered
in c
ours
es a
t the
Uni
vers
ity o
f Man
itoba
.3.
In F
all T
erm
200
8 (a
t Nov
embe
r 1st
), th
ere
wer
e 10
9 Jo
int M
aste
rs P
rogr
am s
tude
nts
in th
e pr
ogra
ms
shar
ed b
y th
e U
nive
rsity
of M
anito
ba a
nd th
e U
nive
rsity
of W
inni
peg
(116
in F
all T
erm
200
7).
Bas
ed o
n w
orkl
oad
calc
ulat
ions
, the
follo
win
g JM
Ps
have
bee
n re
porte
d un
der t
he U
nive
rsity
of M
anito
ba:
FTP
TFT
PT
In th
e Fa
culty
of A
rtsH
isto
ry36
636
7P
ublic
Adm
inis
tratio
n13
1818
14R
elig
ion
40
70
Tota
l53
2461
214.
Tran
sfer
cre
dit p
rogr
ams
for g
radu
ates
of t
he B
usin
ess
Adm
inis
tratio
n di
plom
a pr
ogra
ms
at É
cole
tech
niqu
e et
pro
fess
ionn
elle
(ÉTP
) and
Ass
inib
oine
(AC
C) a
nd R
ed R
iver
(RR
C) C
olle
ges.
5.B
.Sc.
(Den
tistry
) (M
edic
ine)
are
sec
ond
and
third
-yea
r Den
tal a
nd M
edic
al s
tude
nts
who
regi
ster
ed fo
r the
B.S
c. p
rogr
ams
in th
e su
mm
er te
rm. I
nclu
des
all s
tude
nts
activ
e in
the
prog
ram
.6.
Stu
dent
s w
ho a
re e
nrol
led
in th
e in
tegr
ated
B.H
.Eco
l./B
.Ed.
pro
gram
are
sho
wn
in th
e Fa
culty
of H
uman
Eco
logy
for y
ears
3 a
nd 4
and
in E
duca
tion
for y
ear 5
.7.
Enr
olm
ent i
n th
e in
tegr
ated
B.M
us./B
.Ed.
pro
gram
is s
how
n in
Mus
ic fo
r yea
rs 3
and
4 a
nd in
Edu
catio
n fo
r yea
r 5.
8.Th
e P
h.D
. in
App
lied
Hea
lth S
cien
ces
is o
ffere
d jo
intly
by
Hum
an E
colo
gy, K
ines
iolo
gy a
nd R
ecre
atio
n M
anag
emen
t, N
ursi
ng a
nd th
e S
choo
l of M
edic
al R
ehab
ilita
tion.
9.In
clud
es s
tude
nts
in th
e A
fter D
egre
e pr
ogra
m in
Fam
ily S
ocia
l Sci
ence
s, n
ew in
Fal
l Ter
m 2
007.
10.
Incl
udes
stu
dent
s in
the
Phy
sici
an A
ssis
tant
Edu
catio
n pr
ogra
m, i
ntro
duce
d in
Fal
l Ter
m 2
008.
11.
Pos
tgra
duat
e M
edic
al E
duca
tion
stud
ents
are
phy
sici
ans
who
hav
e co
mpl
eted
thei
r und
ergr
adua
te m
edic
al d
egre
e w
ho a
re n
ow re
gist
ered
in c
linic
al re
side
ncy
prog
ram
s.12
.Th
e Fa
culty
of M
usic
cha
nged
its
nam
e to
the
Mar
cel A
. Des
aute
ls F
acul
ty o
f Mus
ic in
200
8.13
.B
ache
lor o
f Jaz
z S
tudi
es n
ew in
Fal
l Ter
m 2
008.
14.
Stu
dent
s en
terin
g th
e ba
ccal
aure
ate
nurs
ing
prog
ram
may
take
cou
rses
at a
ltern
ate
site
s. E
nrol
men
ts s
how
n in
this
tabl
e re
flect
stu
dent
s re
gist
ered
in U
of M
cou
rses
onl
y.15
.S
tude
nts
appl
y to
Nur
sing
onc
e fir
st-y
ear s
tudi
es a
re c
ompl
ete.
Firs
t-yea
r stu
dent
s ar
e no
w a
dmitt
ed to
Ext
ende
d E
duca
tion
as s
peci
al s
tude
nts.
16.
The
U o
f M o
ffers
sel
ecte
d co
urse
s, a
nd th
e m
ajor
ity o
f fou
rth-y
ear c
ours
es, f
or th
e U
nive
rsity
Col
lege
of t
he N
orth
via
dis
tanc
e ed
ucat
ion
mod
aliti
es.
17.
The
Inne
r-C
ity S
ocia
l Wor
k pr
ogra
m w
as p
revi
ousl
y re
porte
d as
Win
nipe
g E
duca
tion
Cen
tre.
18.
Uni
vers
ity 1
pro
gram
intro
duce
d in
199
8-99
. Mos
t "ne
w" s
tude
nts,
with
lim
ited
or n
o un
iver
sity
exp
erie
nce,
hav
e re
gist
ered
und
er th
is p
rogr
am.
Stu
dent
s ha
ve to
com
plet
e 24
-30
cred
it ho
urs
unde
r Uni
vers
ity 1
bef
ore
mov
ing
into
a d
egre
e pr
ogra
m. B
egin
ning
in 2
007,
the
requ
irem
ents
to tr
ansi
t cha
nged
requ
iring
a m
inim
um G
PA
of 2
.0.
This
pol
icy
chan
ge h
as im
pact
ed th
e in
take
of s
tude
nts
into
Arts
and
Sci
ence
.19
.A
new
met
hodo
logy
was
use
d to
det
erm
ine
new
and
con
tinui
ng s
tude
nts
in F
all T
erm
200
8. T
he F
all T
erm
200
7 da
ta w
as re
vise
d fo
r com
para
bilit
y.20
.G
radu
ate
figur
es fo
r Fal
l Ter
m 2
007
incl
ude
stud
ents
that
wer
e ca
ncel
led
for n
on p
aym
ent o
f fee
s.
Fall
Term
200
8Fa
ll Te
rm 2
007

OIA 2008/11/28 (Rev. 2008/12/03) 16
Table 5
FACULTY/SCHOOL/PROGRAM YEAR 1 YEAR 2 YEAR 3 YEAR 4 YEAR 5 OTHER TOTAL
AGRIC. & FOOD SCI. (DEGREE)Agribusiness
Agribusiness 23 24 15 27 0 0 89Business Management 0 6 2 0 0 0 8SUBTOTAL 23 30 17 27 0 0 97
AgricultureAgronomy 11 9 9 10 0 0 39Animal Systems 14 15 13 11 0 0 53Plant Biotechnology 1 1 1 2 0 0 5Plant Science 0 0 1 0 0 0 1Plant Systems 0 2 1 0 0 0 3SUBTOTAL 26 27 25 23 0 0 101
Agroecology 4 4 5 1 0 0 14Food Science 6 13 14 13 0 0 46
Co-op 0 0 0 0 0 0 0Pre-Veterinary 0 0 0 0 0 0 0Undeclared 0 3 1 0 0 0 4Int'l Educated Agrologist Program (IEAP)3 0 0 0 0 0 9 9Special or Visiting 0 0 0 0 0 1 1TOTAL FACULTY/SCHOOL/PROGRAM 59 77 62 64 0 10 272
AGRIC. & FOOD SCI. (DIPLOMA)Agricultural Finance 3 2 0 0 0 0 5Business Management 2 6 0 0 0 0 8Crop Management 0 14 0 0 0 0 14General Agriculture 3 8 0 0 0 0 11Livestock Management 1 8 0 0 0 0 9Undeclared 78 4 0 0 0 0 82TOTAL FACULTY/SCHOOL/PROGRAM 87 42 0 0 0 0 129
ARCHITECTUREEnvironmental Design 0 111 96 101 0 0 308TOTAL FACULTY/SCHOOL/PROGRAM 0 111 96 101 0 0 308
ART (DEGREE)Art History 3 9 1 0 0 0 13Art History (Honours) 1 0 5 1 0 0 7Fine Arts 111 98 51 1 0 0 261Fine Arts (Honours) 0 0 26 53 0 0 79Special or Visiting 0 0 0 0 0 1 1TOTAL FACULTY/SCHOOL/PROGRAM 115 107 83 55 0 1 361
ART (DIPLOMA)Fine Arts 11 6 3 1 0 0 21TOTAL FACULTY/SCHOOL/PROGRAM 11 6 3 1 0 0 21
ARTSAnthropology
Major (3-Year) 0 13 36 0 0 0 49Advanced (4-Year) 0 3 13 19 0 0 35SUBTOTAL 0 16 49 19 0 0 84
Art HistoryMajor (3-Year) 0 0 4 0 0 0 4SUBTOTAL 0 0 4 0 0 0 4
Asian StudiesMajor (3-Year) 0 3 6 0 0 0 9SUBTOTAL 0 3 6 0 0 0 9
Canadian StudiesMajor (3-Year) 0 0 0 0 0 0 0Honours (4-Year) 0 0 1 0 0 0 1SUBTOTAL 0 0 1 0 0 0 1
ClassicsClassics
Major (3-Year) 0 0 0 0 0 0 0Advanced (4-Year) 0 0 0 0 0 0 0SUBTOTAL 0 0 0 0 0 0 0
Classical StudiesMajor (3-Year) 0 4 10 0 0 0 14Advanced (4-Year) 0 0 2 6 0 0 8SUBTOTAL 0 4 12 6 0 0 22
UNDERGRADUATE STUDENTS BY PROGRAM OR AREA OF STUDY 1 AND YEAR 2
Fall Term 2008
******PLEASE READ FOOTNOTE 2 DETAILING THE CHANGE IN THE METHOD OF CALCULATING YEAR.******
As at November 1st

17OIA 2008/11/28 (Rev. 2008/12/03)
Table 5
FACULTY/SCHOOL/PROGRAM YEAR 1 YEAR 2 YEAR 3 YEAR 4 YEAR 5 OTHER TOTAL
UNDERGRADUATE STUDENTS BY PROGRAM OR AREA OF STUDY 1 AND YEAR 2
Fall Term 2008
******PLEASE READ FOOTNOTE 2 DETAILING THE CHANGE IN THE METHOD OF CALCULATING YEAR.******
As at November 1st
ARTS (Continued)Drama
Major (3-Year) 0 3 6 0 0 0 9Advanced (4-Year) 0 0 0 4 0 0 4SUBTOTAL 0 3 6 4 0 0 13
EconomicsMajor (3-Year) 2 62 218 0 0 0 282Advanced (4-Year) 0 1 11 14 0 0 26Honours (4-Year) 0 0 5 7 0 0 12SUBTOTAL 2 63 234 21 0 0 320
English, Film & TheatreEnglish
Major (3-Year) 1 32 87 0 0 0 120Advanced (4-Year) 0 0 6 7 0 0 13Honours (4-Year) 0 2 7 15 0 0 24SUBTOTAL 1 34 100 22 0 0 157
Film StudiesMajor (3-Year) 1 10 24 0 0 0 35Advanced (4-Year) 0 0 4 5 0 0 9SUBTOTAL 1 10 28 5 0 0 44
TheatreMajor (3-Year) 0 0 0 0 0 0 0SUBTOTAL 0 0 0 0 0 0 0
French, Spanish & ItalianFrench
Major (3-Year) 1 6 14 0 0 0 21Advanced (4-Year) 0 0 0 0 0 0 0Honours (4-Year) 0 0 0 2 0 0 2SUBTOTAL 1 6 14 2 0 0 23
ItalianMajor (3-Year) 0 0 0 0 0 0 0SUBTOTAL 0 0 0 0 0 0 0
Italian StudiesMajor (3-Year) 0 0 0 0 0 0 0SUBTOTAL 0 0 0 0 0 0 0
SpanishMajor (3-Year) 0 1 5 0 0 0 6Advanced (4-Year) 0 0 0 2 0 0 2SUBTOTAL 0 1 5 2 0 0 8
Geography4
Major (3-Year) 1 0 2 0 0 0 3SUBTOTAL 1 0 2 0 0 0 3
German & Slavic StudiesGerman
Major (3-Year) 0 4 3 0 0 0 7Honours (4-Year) 0 0 0 1 0 0 1SUBTOTAL 0 4 3 1 0 0 8
RussianMajor (3-Year) 0 0 2 0 0 0 2SUBTOTAL 0 0 2 0 0 0 2
UkrainianMajor (3-Year) 0 0 0 0 0 0 0SUBTOTAL 0 0 0 0 0 0 0
Global Political EconomyMajor (3-Year) 0 5 9 0 0 0 14Advanced (4-Year) 0 2 13 13 0 0 28SUBTOTAL 0 7 22 13 0 0 42
HistoryMajor (3-Year) 2 44 131 0 0 0 177Advanced (4-Year) 0 0 7 8 0 0 15Honours (4-Year) 0 4 4 12 0 0 20SUBTOTAL 2 48 142 20 0 0 212
IcelandicMajor (3-Year) 0 0 0 0 0 0 0SUBTOTAL 0 0 0 0 0 0 0
Labour StudiesMajor (3-Year) 0 3 14 0 0 0 17Advanced (4-Year) 0 0 0 3 0 0 3SUBTOTAL 0 3 14 3 0 0 20

OIA 2008/11/28 (Rev. 2008/12/03) 18
Table 5
FACULTY/SCHOOL/PROGRAM YEAR 1 YEAR 2 YEAR 3 YEAR 4 YEAR 5 OTHER TOTAL
UNDERGRADUATE STUDENTS BY PROGRAM OR AREA OF STUDY 1 AND YEAR 2
Fall Term 2008
******PLEASE READ FOOTNOTE 2 DETAILING THE CHANGE IN THE METHOD OF CALCULATING YEAR.******
As at November 1st
ARTS (Continued)Linguistics
Major (3-Year) 1 10 16 1 0 0 28Advanced (4-Year) 0 1 5 11 0 0 17SUBTOTAL 1 11 21 12 0 0 45Sign Language
Major (3-Year) 3 8 1 0 0 0 12SUBTOTAL 3 8 1 0 0 0 12
MathematicsMajor (3-Year) 0 3 13 0 0 0 16SUBTOTAL 0 3 13 0 0 0 16Mathematics-Economics
Honours (4-Year) 0 0 1 0 0 0 1SUBTOTAL 0 0 1 0 0 0 1
Medieval & Renaissance StudiesAdvanced (4-Year) 0 0 0 0 0 0 0SUBTOTAL 0 0 0 0 0 0 0
Native StudiesMajor (3-Year) 0 6 23 0 0 0 29Advanced (4-Year) 0 0 1 0 0 0 1SUBTOTAL 0 6 24 0 0 0 30
PhilosophyMajor (3-Year) 0 7 21 0 0 0 28Advanced (4-Year) 0 0 0 2 0 0 2Honours (4-Year) 0 0 2 1 0 0 3SUBTOTAL 0 7 23 3 0 0 33
Political StudiesMajor (3-Year) 2 21 64 0 0 0 87Advanced (4-Year) 0 2 5 12 0 0 19Honours (4-Year) 0 7 18 29 0 0 54SUBTOTAL 2 30 87 41 0 0 160
PsychologyMajor (3-Year) 10 161 302 0 0 0 473Advanced (4-Year) 0 6 19 38 0 0 63Honours (4-Year) 0 5 35 43 0 0 83SUBTOTAL 10 172 356 81 0 0 619
ReligionMajor (3-Year) 0 4 19 0 0 0 23Advanced (4-Year) 0 0 2 0 0 0 2Honours (4-Year) 0 0 2 6 0 0 8SUBTOTAL 0 4 23 6 0 0 33
SociologyMajor (3-Year) 0 13 75 0 0 0 88Advanced (4-Year) 0 0 0 0 0 0 0Honours (4-Year) 0 3 9 9 0 0 21SUBTOTAL 0 16 84 9 0 0 109Criminology
Major (3-Year) 0 30 74 0 0 0 104SUBTOTAL 0 30 74 0 0 0 104
Women's & Gender StudiesMajor (3-Year) 0 7 6 0 0 0 13Advanced (4-Year) 0 0 0 1 0 0 1Honours (4-Year) 0 0 0 0 0 0 0SUBTOTAL 0 7 6 1 0 0 14
UndeclaredMajor (3-Year) 143 835 103 0 0 0 1081
St. Boniface students5 2 10 14 0 0 0 26Special or Visiting 0 0 0 0 0 45 45SUMMARY:Major (3-Year) 167 1295 1288 1 0 0 2751Advanced (4-Year) 0 15 88 145 0 0 248Honours (4-Year) 0 21 84 125 0 0 230St. Boniface students5 2 10 14 0 0 0 26Special or Visiting 0 0 0 0 0 45 45TOTAL FACULTY/SCHOOL/PROGRAM 169 1341 1474 271 0 45 3300

19OIA 2008/11/28 (Rev. 2008/12/03)
Table 5
FACULTY/SCHOOL/PROGRAM YEAR 1 YEAR 2 YEAR 3 YEAR 4 YEAR 5 OTHER TOTAL
UNDERGRADUATE STUDENTS BY PROGRAM OR AREA OF STUDY 1 AND YEAR 2
Fall Term 2008
******PLEASE READ FOOTNOTE 2 DETAILING THE CHANGE IN THE METHOD OF CALCULATING YEAR.******
As at November 1st
BUSINESS, ASPER SCHOOL OF 6
Aboriginal Business Studies 0 0 1 0 0 0 1Accounting & Finance
Accounting 2 4 71 178 0 0 255Finance 0 1 34 112 0 0 147Management Information Systems 0 1 2 5 0 0 8SUBTOTAL 2 6 107 295 0 0 410
Actuarial Studies, Warren CentreActuarial Mathematics 0 2 12 24 0 0 38Actuarial Studies and Research 0 0 0 0 0 0 0SUBTOTAL 0 2 12 24 0 0 38
Business AdministrationHuman Res. Mgmt & Industrial Relations 0 0 11 43 0 0 54Management of Organizations 0 0 7 6 0 0 13SUBTOTAL 0 0 18 49 0 0 67
Generalist 13 319 406 64 0 0 802Interdisciplinary 0 0 1 0 0 0 1International Business 0 1 12 18 0 0 31Marketing
Entrepreneurship & Small Business 0 0 9 13 0 0 22Marketing 0 1 41 119 0 0 161SUBTOTAL 0 1 50 132 0 0 183
Supply Chain ManagementLogistics & Supply Chain Management 0 0 9 24 0 0 33SUBTOTAL 0 0 9 24 0 0 33
St. Boniface students5 3 1 0 2 0 0 6Visiting 0 0 0 0 0 29 29TOTAL FACULTY/SCHOOL/PROGRAM 18 330 616 608 0 29 1601
DENTAL HYGIENEDental Hygiene 26 26 0 0 0 0 52TOTAL FACULTY/SCHOOL/PROGRAM 26 26 0 0 0 0 52
DENTISTRY7
Dentistry 29 30 28 32 0 0 119Int'l Dentist Degree Program (IDDP)3 0 0 8 3 0 0 11TOTAL FACULTY/SCHOOL/PROGRAM 29 30 36 35 0 0 130
EDUCATIONEarly Years
English 12 9 0 0 0 0 21Fine Arts 0 2 0 0 0 0 2French 2 1 0 0 0 0 3General Science Education 7 6 0 0 0 0 13Geography 8 12 0 0 0 0 20Heritage, Aboriginal or World Languages 1 0 0 0 0 0 1History 12 11 0 0 0 0 23Mathematics 4 0 0 0 0 0 4Music 1 3 0 0 0 0 4Native Studies 2 2 0 0 0 0 4Physical Education 10 7 0 0 0 0 17Theatre 1 0 0 0 0 0 1SUBTOTAL 60 53 0 0 0 0 113
Middle YearsComputer Science 2 0 0 0 0 0 2English 18 5 0 0 0 0 23Fine Arts 2 1 0 0 0 0 3French 3 3 0 0 0 0 6General Human Ecology 5 2 0 0 0 0 7General Science Education 17 11 0 0 0 0 28Geography 10 11 0 0 0 0 21Heritage, Aboriginal or World Languages 2 1 0 0 0 0 3History 18 10 0 0 0 0 28Mathematics 4 2 0 0 0 0 6Native Studies 2 1 0 0 0 0 3Physical Education 11 10 0 0 0 0 21Undeclared 1 1 0 0 0 0 2SUBTOTAL 95 58 0 0 0 0 153

OIA 2008/11/28 (Rev. 2008/12/03) 20
Table 5
FACULTY/SCHOOL/PROGRAM YEAR 1 YEAR 2 YEAR 3 YEAR 4 YEAR 5 OTHER TOTAL
UNDERGRADUATE STUDENTS BY PROGRAM OR AREA OF STUDY 1 AND YEAR 2
Fall Term 2008
******PLEASE READ FOOTNOTE 2 DETAILING THE CHANGE IN THE METHOD OF CALCULATING YEAR.******
As at November 1st
EDUCATION (Continued)Senior Years
Biology 11 14 0 0 0 0 25Chemistry 2 1 0 0 0 0 3Computer Science 1 2 0 0 0 0 3English 13 12 0 0 0 0 25Fine Arts 9 9 0 0 0 0 18French 1 1 0 0 0 0 2General Human Ecology 7 3 0 0 0 0 10General Science Education 5 4 0 0 0 0 9Geography 4 7 0 0 0 0 11Heritage, Aboriginal or World Languages 2 0 0 0 0 0 2History 15 6 0 0 0 0 21Mathematics 15 16 0 0 0 0 31Music 2 0 0 0 0 0 2Native Studies 3 1 0 0 0 0 4Physical Education 21 24 0 0 0 0 45Physics & Astronomy 3 1 0 0 0 0 4Theatre 0 2 0 0 0 0 2Undeclared 2 0 0 0 0 0 2SUBTOTAL 116 103 0 0 0 0 219
B.H.Ecol./B.Ed. (Year 5)8 0 0 0 0 4 0 4B.Mus./B.Ed. (Year 5)9 1 3 0 0 15 0 19Post Baccalaureate Certificate10 0 0 0 0 0 9 9Post Baccalaureate Diploma10 0 0 0 0 0 355 355Int'l Educated Teachers (IET)3 0 0 0 0 0 11 11St. Boniface students5 11 0 0 0 0 0 11Special 0 0 0 0 0 1 1TOTAL FACULTY/SCHOOL/PROGRAM 283 217 0 0 19 376 895
ENGINEERINGCommon First Year Program 153 0 0 0 0 0 153Biosystems 17 14 18 17 0 0 66
Co-op 0 0 0 0 0 0 0SUBTOTAL 17 14 18 17 0 0 66
Civil 21 88 53 68 1 0 231Co-op 1 0 0 8 10 0 19SUBTOTAL 22 88 53 76 11 0 250
Electrical & ComputerComputer 7 27 13 45 0 0 92Electrical 16 37 37 49 0 0 139SUBTOTAL 23 64 50 94 0 0 231
Mechanical & ManufacturingManufacturing 3 5 5 9 0 0 22
Co-op 1 0 1 2 1 0 5Mechanical 24 113 75 64 0 0 276
Co-op 1 5 8 25 18 0 57SUBTOTAL 29 123 89 100 19 0 360
Undeclared 0 7 1 0 0 0 8Access Program 18 0 0 0 0 0 18Visiting 0 0 0 0 0 14 14Int'l Educ. Engineers Qualification (IEEQ)3 0 0 0 0 0 17 17TOTAL FACULTY/SCHOOL/PROGRAM 262 296 211 287 30 31 1117
ENVIRONMENT, EARTH, AND RESOURCES,CLAYTON H. RIDDELL FACULTY OF
Environmental Science4
General (3-Year) 0 0 3 0 0 0 3Major (4-Year) 0 21 20 18 0 0 59Major Co-op (4-Year) 0 3 8 8 0 0 19Honours (4-Year) 0 0 2 4 0 0 6Honours Co-op (4-Year) 0 0 0 0 0 0 0SUBTOTAL 0 24 33 30 0 0 87
Environmental StudiesGeneral (3-Year) 0 1 3 0 0 0 4Major (4-Year) 0 19 25 19 0 0 63Major Co-op (4-Year) 0 2 8 4 0 0 14Honours (4-Year) 0 0 3 6 0 0 9SUBTOTAL 0 22 39 29 0 0 90

21OIA 2008/11/28 (Rev. 2008/12/03)
Table 5
FACULTY/SCHOOL/PROGRAM YEAR 1 YEAR 2 YEAR 3 YEAR 4 YEAR 5 OTHER TOTAL
UNDERGRADUATE STUDENTS BY PROGRAM OR AREA OF STUDY 1 AND YEAR 2
Fall Term 2008
******PLEASE READ FOOTNOTE 2 DETAILING THE CHANGE IN THE METHOD OF CALCULATING YEAR.******
As at November 1st
ENVIRONMENT, EARTH, AND RESOURCES (Continued)Geography4
General (3-Year) 6 18 51 0 0 0 75Advanced (4-Year) 0 2 1 2 0 0 5Honours (4-Year) 0 1 2 2 0 0 5SUBTOTAL 6 21 54 4 0 0 85
Geological SciencesGeological Sciences
General (3-Year) 0 2 2 0 0 0 4SUBTOTAL 0 2 2 0 0 0 4
GeologyMajor (4-Year) 1 29 16 16 0 0 62Honours (4-Year) 0 5 7 9 0 0 21SUBTOTAL 1 34 23 25 0 0 83
GeophysicsMajor (4-Year) 0 1 1 0 0 0 2Honours (4-Year) 0 1 1 2 0 0 4SUBTOTAL 0 2 2 2 0 0 6
Physical GeographyMajor (4-Year) 0 11 12 2 0 0 25Major Co-op (4-Year) 0 0 0 1 0 0 1Honours (4-Year) 0 0 0 2 0 0 2SUBTOTAL 0 11 12 5 0 0 28
Special or Visiting 0 0 0 0 0 24 24SUMMARY:General (3-Year) 6 21 59 0 0 0 86Major, Advanced & Major Co-op (4-Year) 1 88 91 70 0 0 250Honours & Honours Co-op (4-Year) 0 7 15 25 0 0 47Special or Visiting 0 0 0 0 0 24 24TOTAL FACULTY/SCHOOL/PROGRAM 7 116 165 95 0 24 407
EXTENDED EDUCATIONAboriginal Focus Diploma
Aboriginal Child & Family Services 0 0 0 0 0 4 4Aboriginal Community Wellness 0 0 0 0 0 30 30
First Nation Health 0 0 0 0 0 0 0Labour Relations & Workplace Studies 0 0 0 0 0 1 1Special, Visiting, Auditing 0 0 0 0 0 1126 1126St. Boniface students5 0 0 0 0 0 0 0TOTAL FACULTY/SCHOOL/PROGRAM 0 0 0 0 0 1161 1161
HUMAN ECOLOGYFamily Social Sciences 1 44 38 40 0 0 123
Second Degree Program 0 0 3 1 0 0 4Health Sciences 0 6 1 2 0 0 9Health Studies 0 3 3 1 0 0 7Human Ecology 0 6 1 7 0 0 14Human Nutritional Sci.
Foods 0 1 1 6 0 0 8Food Industry Option 0 1 1 2 0 0 4Nutrition 0 74 72 72 0 0 218Second Degree Program 0 0 7 17 0 0 24
Textile Sciences11
Product Dev. In Textile Sci. 0 6 5 7 0 0 18Textile Dev. In Textile Sci. 0 3 5 0 0 0 8
Clothing & Textiles11 0 0 0 1 0 0 1B.H.Ecol./B.Ed. (Year 3,4)8 0 0 0 0 0 0 0Special 0 0 0 0 0 4 4TOTAL FACULTY/SCHOOL/PROGRAM 1 144 137 156 0 4 442
KINESIOLOGY & RECREATION MANAGEMENT Kinesiology 0 77 23 1 0 0 101
Athletic Therapy 0 26 14 20 0 0 60Exercise and Sport Science 0 0 1 3 0 0 4Physical Health and Wellness 0 2 10 22 0 0 34SUBTOTAL 0 105 48 46 0 0 199
Physical Education 0 64 52 0 0 0 116Recreation Mgmt. & Community Development 0 48 23 15 0 0 86Special or Visiting 0 0 0 0 0 6 6TOTAL FACULTY/SCHOOL/PROGRAM 0 217 123 61 0 6 407

OIA 2008/11/28 (Rev. 2008/12/03) 22
Table 5
FACULTY/SCHOOL/PROGRAM YEAR 1 YEAR 2 YEAR 3 YEAR 4 YEAR 5 OTHER TOTAL
UNDERGRADUATE STUDENTS BY PROGRAM OR AREA OF STUDY 1 AND YEAR 2
Fall Term 2008
******PLEASE READ FOOTNOTE 2 DETAILING THE CHANGE IN THE METHOD OF CALCULATING YEAR.******
As at November 1st
LAWLaw 127 84 73 0 0 0 284Special or Visiting 0 0 0 0 0 7 7TOTAL FACULTY/SCHOOL/PROGRAM 127 84 73 0 0 7 291
MEDICAL REHABILITATIONPhysical Therapy 51 47 45 0 0 0 143Respiratory Therapy 20 13 15 0 0 0 48TOTAL FACULTY/SCHOOL/PROGRAM 71 60 60 0 0 0 191
MEDICINE12
Medicine 112 96 101 95 0 0 404TOTAL FACULTY/SCHOOL/PROGRAM 112 96 101 95 0 0 404
MUSIC, MARCEL A. DESAUTELS FACULTY OF13
Music - General 56 36 12 9 0 0 113Music - Composition 0 0 1 1 0 0 2Music - Performance 0 2 8 15 0 0 25Music - Undeclared 2 0 0 0 0 0 2
SUBTOTAL 58 38 21 25 0 0 142Jazz Studies14 15 9 1 0 0 0 25B.Mus./B.Ed. (Year 3,4)9 0 0 16 25 0 0 41Post Baccalaureate Diploma 0 0 0 0 0 7 7Special 0 0 0 0 0 0 0TOTAL FACULTY/SCHOOL/PROGRAM 73 47 38 50 0 7 215
NURSING15
Fort Garry 26 255 262 221 0 0 764Norway House 0 0 0 5 0 0 5Joint Programs
Red River College (RRC) 81 8 8 70 0 0 167University College of the North (UCN) 46 7 26 25 0 0 104
Post Baccalaureate for Registered Nurses 96 42 0 0 0 0 138Special 0 0 0 0 0 0 0TOTAL FACULTY/SCHOOL/PROGRAM 249 312 296 321 0 0 1178
PHARMACYPharmacy 53 45 47 49 0 0 194TOTAL FACULTY/SCHOOL/PROGRAM 53 45 47 49 0 0 194
SCIENCEActuarial Mathematics
Honours (4-Year) 0 3 7 9 0 0 19SUBTOTAL 0 3 7 9 0 0 19
BiochemistryMajor (4-Year) 2 2 4 13 0 0 21Major Co-op (4-Year) 0 1 0 4 0 0 5Honours (4-Year) 1 5 4 9 0 0 19Honours Co-op (4-Year) 0 1 2 2 0 0 5SUBTOTAL 3 9 10 28 0 0 50
Biological SciencesBiology
Major (4-Year) 1 4 10 18 0 0 33SUBTOTAL 1 4 10 18 0 0 33
BotanyMajor (4-Year) 1 0 0 6 0 0 7Honours (4-Year) 0 0 0 3 0 0 3SUBTOTAL 1 0 0 9 0 0 10
EcologyMajor (4-Year) 0 0 1 0 0 0 1Major Co-op (4-Year) 0 0 0 1 0 0 1Honours (4-Year) 0 0 1 2 0 0 3SUBTOTAL 0 0 2 3 0 0 5
ZoologyMajor (4-Year) 1 4 10 15 0 0 30Major Co-op (4-Year) 0 0 3 3 0 0 6Honours (4-Year) 1 7 7 7 0 0 22SUBTOTAL 2 11 20 25 0 0 58
BiotechnologyHonours (4-Year) 0 1 1 1 0 0 3SUBTOTAL 0 1 1 1 0 0 3

23OIA 2008/11/28 (Rev. 2008/12/03)
Table 5
FACULTY/SCHOOL/PROGRAM YEAR 1 YEAR 2 YEAR 3 YEAR 4 YEAR 5 OTHER TOTAL
UNDERGRADUATE STUDENTS BY PROGRAM OR AREA OF STUDY 1 AND YEAR 2
Fall Term 2008
******PLEASE READ FOOTNOTE 2 DETAILING THE CHANGE IN THE METHOD OF CALCULATING YEAR.******
As at November 1st
SCIENCE (Continued)Chemistry
Major (4-Year) 2 1 4 7 0 0 14Major Co-op (4-Year) 0 0 0 2 0 0 2Honours (4-Year) 0 1 5 4 0 0 10Honours Co-op (4-Year) 0 0 2 2 0 0 4SUBTOTAL 2 2 11 15 0 0 30
Chemistry-PhysicsHonours (4-Year) 0 1 4 0 0 0 5SUBTOTAL 0 1 4 0 0 0 5
Computer ScienceMajor (4-Year) 5 39 42 36 0 0 122Major Co-op (4-Year) 3 3 16 29 0 0 51Honours (4-Year) 0 8 3 1 0 0 12Honours Co-op (4-Year) 2 33 32 37 0 0 104SUBTOTAL 10 83 93 103 0 0 289
Computer Science-PhysicsHonours (4-Year) 1 0 1 0 0 0 2SUBTOTAL 1 0 1 0 0 0 2
GeneticsHonours (4-Year) 0 6 7 20 0 0 33Honours Co-op (4-Year) 0 0 2 6 0 0 8SUBTOTAL 0 6 9 26 0 0 41
MathematicsApplied Mathematics
Major (4-Year) 2 1 2 5 0 0 10SUBTOTAL 2 1 2 5 0 0 10
MathematicsMajor (4-Year) 1 2 5 1 0 0 9Honours (4-Year) 0 2 1 2 0 0 5SUBTOTAL 1 4 6 3 0 0 14
Mathematics-Physics & AstronomyHonours (4-Year) 0 1 0 2 0 0 3SUBTOTAL 0 1 0 2 0 0 3
Mathematics-StatisticsHonours (4-Year) 0 0 1 0 0 0 1SUBTOTAL 0 0 1 0 0 0 1
MicrobiologyMajor (4-Year) 3 10 35 53 0 0 101Major Co-op (4-Year) 1 0 8 15 0 0 24Honours (4-Year) 1 6 11 12 0 0 30Honours Co-op (4-Year) 0 0 4 9 0 0 13SUBTOTAL 5 16 58 89 0 0 168
Physics & AstronomyMajor (4-Year) 0 5 2 3 0 0 10Honours (4-Year) 0 3 1 4 0 0 8SUBTOTAL 0 8 3 7 0 0 18
PsychologyMajor (4-Year) 3 9 10 12 0 0 34Honours (4-Year) 2 4 5 6 0 0 17SUBTOTAL 5 13 15 18 0 0 51
StatisticsMajor (4-Year) 0 1 6 5 0 0 12Honours (4-Year) 0 3 0 0 0 0 3SUBTOTAL 0 4 6 5 0 0 15
Statistics-Actuarial MathematicsHonours (4-Year) 0 0 0 5 0 0 5SUBTOTAL 0 0 0 5 0 0 5
Science - UndeclaredGeneral (3-Year) 188 1004 684 1 0 0 1877
St. Boniface students5 0 2 5 1 0 0 8Special or Visiting 0 0 0 0 0 11 11
SCIENCESUMMARY:General (3-Year) 188 1004 684 1 0 0 1877Major & Major Co-op (4-Year) 25 82 158 228 0 0 493Honours & Honours Co-op (4-Year) 8 85 101 143 0 0 337St. Boniface students5 0 2 5 1 0 0 8Special or Visiting 0 0 0 0 0 11 11TOTAL FACULTY/SCHOOL/PROGRAM 221 1173 948 373 0 11 2726

OIA 2008/11/28 (Rev. 2008/12/03) 24
Table 5
FACULTY/SCHOOL/PROGRAM YEAR 1 YEAR 2 YEAR 3 YEAR 4 YEAR 5 OTHER TOTAL
UNDERGRADUATE STUDENTS BY PROGRAM OR AREA OF STUDY 1 AND YEAR 2
Fall Term 2008
******PLEASE READ FOOTNOTE 2 DETAILING THE CHANGE IN THE METHOD OF CALCULATING YEAR.******
As at November 1st
SOCIAL WORKConcentrated Program (2-Year) 42 23 0 0 0 0 65Regular Program (3-Year) 61 13 51 0 0 0 125Inner City Social Work 34 37 20 0 0 66 157Northern Program 5 2 5 0 0 17 29Northern External 1 1 3 0 0 0 5Distance Delivery 102 64 23 0 0 97 286Special 0 0 0 0 0 1 1TOTAL FACULTY/SCHOOL/PROGRAM 245 140 102 0 0 181 668
UNIVERSITY 116
University 1 5962 0 0 0 0 0 5962St. Boniface students5 12 0 0 0 0 0 12TOTAL FACULTY/SCHOOL/PROGRAM 5974 0 0 0 0 0 5974
UNDERGRADUATE TOTAL 8192 5017 4671 2622 49 1893 22444
NOTES:
1.2. The calculation of year in program has changed under Aurora. Previously, faculties could elect one of three different methods of calculating year.
In Aurora, a single method - prior passed hours - is used for the calculation of year. Because of this, the breakdown by year is not strictly comparablewith data prior to the change in the student information system. Please note that the processes for calculating year are still being fine tunedwith the transition to the new student information system, with the potential for some students to have an incorrect year.
3. Program for internationally educated professionals to reach Canadian standards.4. Effective September 2003, the Bachelor of Arts degree programs in Geography and the Bachelor of Science programs in Environmental
Science moved under the Clayton H. Riddell Faculty of Environment, Earth and Resources. Students admitted prior to September 2003had the option to complete their program under Arts or Science.
5. St. Boniface students are included in headcounts when taking courses at the University of Manitoba.6. Includes transfer credit programs for graduates of the Business Administration Diploma programs at Assiniboine and Red River Colleges, University
College of the North and Ecole technique et professionnelle.7. Does not include B.Sc.(Dentistry) students, second and third year students who registered for the B.Sc. program in the summer term.8. Students in the B.H.Ecol./B.Ed. program are shown in the Faculty of Human Ecology for years 3 & 4 and in Education for year 5.
Last intake was the 2006-07 session.9. Students in the integrated B.Mus./B.Ed. program are shown in Music for years 3 & 4 and in Education for year 5.
10. The Post Baccalaureate program changed from a certificate to a diploma in 2004. Students had the option to switch to the diploma.11. The Textile Sciences program replaced the Clothing and Textiles program in 2005. Students enrolled in the Clothing and Textiles program
prior to this change were permitted to continue their program until graduation.12. Does not include B.Sc.(Medicine) students, second and third year students who registered for the B.Sc. program in the summer term,
or external doctors taking Continuing Medical Education courses.13. The Faculty of Music changed its name to the Marcel A. Desautels Faculty of Music in 2008.14. New program in 2008.15. The Bachelor of Nursing program is offered at alternate sites. Enrolments in this table reflect students taking U of M courses only.16. The University 1 program was introduced in 1998-99. Most "new" students, with limited or no university experience, have registered under this
program. Students must complete 24 credit hours under University 1 (and may complete up to 30), with a minimum cumulative GPA of 2.0, before transferring into a degree program.
Students in Double Major or Double Honours programs are reported under their first declared major.

25OIA 2008/11/28 (Rev. 2008/12/03)
Table 6
Are
a of
Stu
dyTo
tal
Tota
lG
rand
Fu
ll-tim
ePa
rt-ti
me
Tota
lFu
ll-tim
ePa
rt-ti
me
Tota
lFu
ll-tim
ePa
rt-ti
me
Tota
l
Agr
icul
tura
l & F
ood
Scie
nces
Agr
ibus
ines
s an
d A
gric
. Eco
n.0
00
281
2928
129
Ani
mal
Sci
ence
110
1114
014
250
25B
iosy
stem
s E
ngin
eerin
g22
123
181
1940
242
Ent
omol
ogy
60
68
08
140
14Fo
od S
cien
ce0
00
190
1919
019
Pla
nt S
cien
ce20
121
202
2240
343
Soi
l Sci
ence
80
817
017
250
25Su
btot
al67
269
124
412
819
16
197
Arc
hite
ctur
eA
rchi
tect
ure
00
056
056
560
56C
ity P
lann
ing
00
059
160
591
60D
esig
n an
d P
lann
ing 2
10
10
00
10
1In
terio
r Des
ign
00
035
136
351
36La
ndsc
ape
Arc
hite
ctur
e0
00
500
5050
050
Subt
otal
10
120
02
202
201
220
3
Art
s3
Ant
hrop
olog
y15
015
221
2337
138
Cla
ssic
s0
00
30
33
03
Eco
nom
ics
200
2011
112
311
32E
nglis
h19
019
223
2541
344
Fren
ch4
04
71
811
112
Ger
man
& S
lavi
c S
tudi
es0
00
21
32
13
His
tory
90
936
642
456
51Ic
elan
dic
Stu
dies
00
03
03
30
3Li
ngui
stic
s4
15
51
69
211
Nat
ive
Stu
dies
00
012
012
120
12P
hilo
soph
y0
00
90
99
09
Pol
itica
l Stu
dies
00
021
728
217
28P
sych
olog
y78
381
380
3811
63
119
S
choo
l Psy
chol
ogy
00
018
018
180
18P
ublic
Adm
inis
tratio
n 4
00
013
1831
1318
31R
elig
ion
70
74
04
110
11S
ocio
logy
51
630
737
358
43
Can
adia
n S
tudi
es (C
US
B) 5
00
010
010
100
10Su
btot
al16
15
166
266
4631
242
751
478
Ph.D
. M
aste
rs
PH.D
. AN
D M
AST
ERS
STU
DEN
TS B
Y D
EPA
RTM
ENT
As
at N
ovem
ber 1
GR
AD
UA
TE E
NR
OLM
ENT
1
Fall
Term
200
8

OIA 2008/11/28 (Rev. 2008/12/03) 26
Table 6
Are
a of
Stu
dyTo
tal
Tota
lG
rand
Fu
ll-tim
ePa
rt-ti
me
Tota
lFu
ll-tim
ePa
rt-ti
me
Tota
lFu
ll-tim
ePa
rt-ti
me
Tota
l Ph
.D.
Mas
ters
Fall
Term
200
8
Bus
ines
s, A
sper
Sch
ool o
fM
anag
emen
t22
022
00
022
022
Man
agem
ent I
nter
disc
iplin
ary
00
082
7015
282
7015
2Su
btot
al22
022
8270
152
104
7017
4
Den
tistr
yO
ral &
Max
illof
acia
l Sur
gery
00
01
01
10
1O
ral B
iolo
gy0
00
80
88
08
Per
iodo
ntic
s0
00
40
44
04
Pre
vent
ive
Den
tal S
cien
ces
00
09
09
90
9Su
btot
al0
00
220
2222
022
Educ
atio
n E
duca
tion
00
00
00
00
0
Ad
Hoc
2411
350
00
2411
35
Adm
inis
tratio
n9
211
00
09
211
L
angu
age
and
Lite
ratu
re7
310
00
07
310
Edu
c A
dmin
, Fnd
ns &
Psy
chol
ogy
00
00
1111
011
11
Adu
lt &
Pos
t Sec
onda
ry E
duc.
00
01
45
14
5
Adu
lt E
duca
tion
00
01
1314
113
14
Cou
nsel
lor E
duca
tion
00
011
1728
1117
28
Edu
catio
n A
dmin
istra
tion
00
07
7784
777
84
Inc
lusi
ve S
peci
al E
duca
tion
00
01
1920
119
20
Pos
t Sec
onda
ry E
duca
tion
00
01
67
16
7
Soc
ial F
ound
atio
ns o
f Edu
c.0
00
414
184
1418
Cur
ricul
um,T
each
ing
& L
earn
ing
00
04
2832
428
32
Eng
lish
as a
Sec
ond
Lang
uage
00
04
610
46
10
Gen
eral
Cur
ricul
um0
00
729
367
2936
L
angu
age
and
Lite
racy
00
02
2224
222
24
Sec
ond
Lang
uage
Edu
catio
n0
00
53
85
38
Edu
catio
n (C
US
B) 6
00
043
2770
4327
70Su
btot
al40
1656
9127
636
713
129
242
3
Engi
neer
ing
Civ
il E
ngin
eerin
g38
240
3714
5175
1691
Ele
ctric
al a
nd C
ompu
ter E
ng.
649
7351
1162
115
2013
5M
echa
nica
l & M
anuf
actu
ring
Eng
.40
242
334
3773
679
Subt
otal
142
1315
512
129
150
263
4230
5
Envi
ronm
ent,
Eart
h an
d R
esou
rces
, C
layt
on H
. Rid
dell,
Fac
ulty
of
Env
ironm
ent a
nd G
eogr
aphy
00
049
756
497
56G
eogr
aphy
262
280
00
262
28G
eolo
gica
l Sci
ence
s4
04
83
1112
315
Nat
ural
Res
ourc
es &
Env
. Mgm
t.19
120
00
019
120
Nat
ural
Res
ourc
es In
stitu
te0
00
605
6560
565
Subt
otal
493
5211
715
132
166
1818
4

27OIA 2008/11/28 (Rev. 2008/12/03)
Table 6
Are
a of
Stu
dyTo
tal
Tota
lG
rand
Fu
ll-tim
ePa
rt-ti
me
Tota
lFu
ll-tim
ePa
rt-ti
me
Tota
lFu
ll-tim
ePa
rt-ti
me
Tota
l Ph
.D.
Mas
ters
Fall
Term
200
8
Gra
duat
e St
udie
sA
pplie
d H
ealth
Sci
ence
s 710
212
00
010
212
Can
cer C
ontro
l 80
11
00
00
11
Dis
abili
ty S
tudi
es0
00
118
1911
819
Food
& N
utrit
iona
l Sci
ence
s12
113
00
012
113
Inte
rdis
cipl
inar
y P
rogr
am 9
71
80
00
71
8P
eace
& C
onfli
ct S
tudi
es14
014
10
115
015
Subt
otal
435
4812
820
5513
68
Hum
an E
colo
gyFa
mily
Soc
ial S
cien
ces
00
010
717
107
17H
uman
Nut
ritio
nal S
cien
ces
00
018
119
181
19Te
xtile
Sci
ence
s0
00
20
22
02
Subt
otal
00
030
838
308
38
Kin
esio
logy
& R
ecre
atio
n M
anag
emen
t
Kin
esio
logy
100
00
70
77
07
Phy
sica
l Edu
catio
n 10
00
09
110
91
10R
ecre
atio
n S
tudi
es0
00
64
106
410
Subt
otal
00
022
527
225
27
Law
Law
00
03
03
30
3Su
btot
al0
00
30
33
03
Med
ical
Reh
abili
tatio
nM
edic
al R
ehab
ilita
tion
00
09
1322
913
22O
ccup
atio
nal T
hera
py0
00
106
010
610
60
106
Subt
otal
00
011
513
128
115
1312
8
Med
icin
eB
ioch
em. a
nd M
edic
al G
enet
ics
190
1917
219
362
38C
omm
unity
Hea
lth S
cien
ces
1710
2725
833
4218
60 D
iplo
ma,
Com
mun
ity H
ealth
Sci
ence
s 11
00
02
46
24
6H
uman
Ana
tom
y &
Cel
l Sci
ence
70
710
010
170
17Im
mun
olog
y8
08
110
1119
019
Med
ical
Mic
robi
olog
y33
033
400
4073
073
Pat
holo
gy0
00
40
44
04
Pha
rmac
olog
y &
The
rape
utic
s12
012
70
719
019
Phy
sici
an A
ssis
tant
Edu
catio
n 12
00
012
012
120
12P
hysi
olog
y25
227
191
2044
347
Sur
gery
00
01
01
10
1Su
btot
al12
112
133
148
1516
326
927
296
Mus
ic, M
arce
l A. D
esau
tels
Fac
ulty
of 13
Com
posi
tion
00
01
01
10
1C
ondu
ctin
g0
00
41
54
15
Mus
ic0
00
10
11
01
Per
form
ance
00
012
012
120
12Su
btot
al0
00
181
1918
119

OIA 2008/11/28 (Rev. 2008/12/03) 28
Table 6
Are
a of
Stu
dyTo
tal
Tota
lG
rand
Fu
ll-tim
ePa
rt-ti
me
Tota
lFu
ll-tim
ePa
rt-ti
me
Tota
lFu
ll-tim
ePa
rt-ti
me
Tota
l Ph
.D.
Mas
ters
Fall
Term
200
8
Nur
sing
Nur
sing
00
036
5490
3654
90Su
btot
al0
00
3654
9036
5490
Phar
mac
yP
harm
acy
100
104
15
141
15Su
btot
al10
010
41
514
115
Scie
nce
Bot
any
121
1314
216
263
29C
hem
istry
180
1818
018
360
36C
ompu
ter S
cien
ce15
116
373
4052
456
Mat
hem
atic
s5
05
80
813
013
Mic
robi
olog
y17
017
170
1734
034
Phy
sics
and
Ast
rono
my
230
2316
016
390
39S
tatis
tics
90
914
014
230
23Zo
olog
y15
116
160
1631
132
Subt
otal
114
311
714
05
145
254
826
2
Soci
al W
ork
Soc
ial-C
linic
al In
terv
entio
n0
00
3859
9738
5997
Soc
ial S
ervi
ces
Adm
in.
00
014
1529
1415
29S
ocia
l Wor
k14
115
66
1220
727
Soc
ial W
ork
Dis
tanc
e0
00
211
132
1113
Subt
otal
141
1560
9115
174
9216
6
Tota
l78
460
844
1611
643
2254
2395
703
3098
1. G
radu
ate
figur
es in
clud
e st
uden
ts c
ontin
uing
in a
cou
rse
or th
esis
ove
r mor
e th
an o
ne te
rm.
2. P
h.D
. in
Des
ign
and
Pla
nnin
g is
new
.3.
At N
ovem
ber 1
(Fal
l Ter
m 2
008)
, the
re w
ere
109
Join
t Mas
ter's
Pro
gram
stu
dent
s in
the
prog
ram
s sh
ared
by
the
Uni
vers
ity o
f Man
itoba
and
the
Uni
vers
ity o
f Win
nipe
g.
Bas
ed o
n w
orkl
oad
calc
ulat
ions
, the
follo
win
g JM
Ps
have
bee
n re
porte
d un
der t
he U
nive
rsity
of M
anito
ba:
In th
e Fa
culty
of A
rtsFT
PT
FTP
TH
isto
ry36
636
7P
ublic
Adm
inis
tratio
n13
1818
14R
elig
ion
40
70
Tota
l53
2461
21
4. P
ublic
Adm
inis
tratio
n pr
evio
usly
repo
rted
unde
r Gra
duat
e S
tudi
es.
5. In
clud
es s
tude
nts
in th
e C
anad
ian
Stu
dies
pro
gram
at S
t. B
onifa
ce ta
king
cou
rses
at t
he U
of M
.6.
Incl
udes
stu
dent
s in
the
Edu
catio
n pr
ogra
m a
t St.
Bon
iface
taki
ng c
ours
es a
t the
U o
f M.
7. A
pplie
d H
ealth
Sci
ence
s is
a n
ew P
h.D
. pro
gram
in F
all T
erm
200
7 of
fere
d jo
intly
by
Hum
an E
colo
gy, K
ines
iolo
gy a
nd R
ecre
atio
n M
anag
emen
t, N
ursi
ng a
nd th
e S
choo
l of M
edic
al R
ehab
ilita
tion.
8. In
terd
isci
plin
ary
Ph.
D. p
rogr
am in
Can
cer C
ontro
l is
shar
ed b
etw
een
the
Facu
lty o
f Nur
sing
and
the
Dep
artm
ent o
f Com
mun
ity H
ealth
Sci
ence
s.9.
Effe
ctiv
e 20
03, n
ewly
adm
itted
stu
dent
s in
inte
rdis
cipl
inar
y gr
adua
te p
rogr
ams
are
refle
cted
in th
e Fa
culty
of t
heir
advi
sor.
10. P
hysi
cal E
duca
tion
rena
med
Kin
esio
logy
in 2
008.
Stu
dent
s ad
mitt
ed in
200
8 an
d la
ter a
re re
flect
ed u
nder
Kin
esio
logy
; tho
se a
dmitt
ed e
arlie
r rem
ain
unde
r Phy
sica
l Edu
catio
n.11
. Inc
lude
s th
ose
stud
ents
taki
ng a
Dip
lom
a in
Pop
ulat
ion
Hea
lth.
12. P
hysi
cian
Ass
ista
nt E
duca
tion
Pro
gram
new
in F
all T
erm
200
8.13
. Fac
ulty
of M
usic
rena
med
the
Mar
cel A
. Des
aute
ls F
acul
ty o
f Mus
ic in
200
8.
Fall
Term
200
8Fa
ll Te
rm 2
007

29OIA 2008/11/28 (Rev. 2008/12/03)
Table 7
% of Aboriginal % of AboriginalTotal Students Total Students
Undergraduate Students 1638 92.8% 1513 91.8%Graduate Students 123 7.0% 127 7.7%Post-Graduate Medical Education 5 0.3% 8 0.5%
Total 1766 1648
Graduate StudentsPre-Masters Students 2 0.1% 4 0.2%Masters Students 116 6.6% 116 7.0%Ph.D. Students 5 0.3% 7 0.4%
% of Undergraduates 7.3% 6.6%% of University 1 class 8.3% 7.1%
By Aboriginal IdentityFirst Nations 812 46.0% 789 47.9%Metis 940 53.2% 836 50.7%Inuit 8 0.5% 11 0.7%Identity not specified 6 0.3% 12 0.7%
By SexMale 571 32.3% 543 32.9%Female 1195 67.7% 1105 67.1%
By Full/Part StatusFull-Time 1329 75.3% 1280 77.7%Part-Time 437 24.7% 368 22.3%
By Type of StudentNew 472 26.7% 420 25.5%Continuing 1294 73.3% 1228 74.5%
By Faculty/SchoolAgricultural & Food Sciences 12 0.7% 11 0.7%Architecture 10 0.6% 11 0.7%Art, School of 20 1.1% 27 1.6%Arts 192 10.9% 215 13.0%Business, Asper School of 51 2.9% 39 2.4%Dental Hygiene 5 0.3% 5 0.3%Dentistry 7 0.4% 6 0.4%Education 82 4.6% 20 1.2%Engineering 62 3.5% 63 3.8%Environment, Earth and Resources, Clayton H. Riddell Faculty of 18 1.0% 25 1.5%Extended Education 131 7.4% 112 6.8%Graduate Studies 123 7.0% 127 7.7%Human Ecology 23 1.3% 25 1.5%Kinesiology & Recreation Management 24 1.4% 33 2.0%Law 23 1.3% 19 1.2%Medical Rehabilitation 11 0.6% 14 0.8%Medicine 17 1.0% 14 0.8%Music, Marcel A. Desautels Faculty of 2 7 0.4% 4 0.2%Nursing 121 6.9% 103 6.3%Pharmacy 11 0.6% 14 0.8%Post-Graduate Medical Education 5 0.3% 8 0.5%Science 114 6.5% 107 6.5%Social Work 200 11.3% 218 13.2%University 1 497 28.1% 428 26.0%
Notes:1. Aboriginal identity is self-declared on the Admission form. Because the self-declaration is voluntary, the numbers reported are less than the total population of Candian Aboriginal students on campus. Undergraduate data collection began in 2000-2001. Data collection for graduate students began in 2002-2003.
A PROFILE OF CANADIAN ABORIGINAL STUDENTS1
Fall Term 2008 Fall Term 2007
2. The Faculty of Music changed its name to the Marcel A. Desautels Faculty of Music in 2008.

OIA 2008/11/28 (Rev. 2008/12/03) 30
Table 8
% ChangeFall Term 2007 -
Faculty/School Fall Term 2008 Fall Term 2007 Fall Term 2008
Agricultural & Food SciencesAgriculture Diploma 3,062 2,237 36.9%Agribusiness & Agric. Economics 756 840 -10.0%Animal Science 471 441 6.8%Biosystems Engineering 579 732 -20.9%Entomology 54 54 *Food Science 858 831 3.2%General Agriculture 640 567 12.9%Plant Science 405 462 -12.3%Soil Science 324 291 11.3%
Subtotal 7,148 6,455 10.7%
ArchitectureArchitecture 0 297 *City Planning 0 0 *Environmental Design 7,115 6,439 10.5%Interior Design 354 0 *Landscape Architecture 153 27 *
Subtotal 7,622 6,763 12.7%
Art, School of 5,079 5,071 0.2%
ArtsAnthropology 3,513 3,780 -7.1%Asian Studies 960 1,050 -8.6%Canadian Studies 51 57 *Catholic Studies 333 303 9.9%Classics 1,383 1,584 -12.7%Economics 7,041 7,803 -9.8%English, Film, and Theatre4 8,189 9,395 -12.8%French, Spanish & Italian 2,274 2,406 -5.5%German and Slavic Studies 744 777 -4.2%Global Political Economy 93 60 *History 5,505 5,922 -7.0%Icelandic Studies 120 117 2.6%Interdisciplinary 2,370 2,112 12.2%Labour and Workplace Studies 291 369 -21.1%Linguistics 981 1,173 -16.4%Native Studies 2,538 2,355 7.8%Near Eastern & Judaic Studies 63 84 *Philosophy 4,599 5,121 -10.2%Political Studies 2,583 2,730 -5.4%Psychology 16,965 17,682 -4.1%Religion 2,502 2,679 -6.6%Sociology 8,472 9,084 -6.7%Ukrainian Canadian Heritage Studies 6 0 *Women's and Gender Studies5 1,227 897 36.8%
Subtotal 72,803 77,540 -6.1%
Business, Asper School ofAccounting & Finance 6,102 6,651 -8.3%Actuarial Science 240 345 -30.4%Business Administration 7,044 6,933 1.6%Interdisciplinary 45 15 *Marketing 3,093 3,048 1.5%Supply Chain Management 1,779 1,731 2.8%
Subtotal 18,303 18,723 -2.2%
DentistryDental Hygiene 991 1,022 -3.0%Dental Diagnostic & Surgical Sciences 1,551 1,524 1.8%Dentistry 804 804 0.0%Oral Biology 1,005 981 2.4%Preventive Dental Science 801 789 1.5%Restorative Dentistry 1,539 1,491 3.2%
Subtotal 6,691 6,611 1.2%
EducationCurriculum,Teaching & Learning 5,904 6,248 -5.5%Educational Admin., Foundations & Psychology 3,225 3,549 -9.1%
Subtotal 9,129 9,797 -6.8%
The University of ManitobaUndergraduate Student Credit Hours
Taught by Faculty/School and Department1,2,3
As at November 1 - Fall Terms

31OIA 2008/11/28 (Rev. 2008/12/03)
Table 8
% ChangeFall Term 2007 -
Faculty/School Fall Term 2008 Fall Term 2007 Fall Term 2008
EngineeringCivil Engineering 3,296 3,611 -8.7%Electrical & Computer Engineering 2,987 3,347 -10.8%Engineering 2,436 2,301 5.9%Mechanical & Manufacturing Engineering 4,016 4,011 0.1%
Subtotal 12,735 13,270 -4.0%
Environment, Earth, and Resources, Clayton H. Riddell Faculty of
Environment and Geography 5,325 5,975 -10.9%Geological Sciences 1,425 1,479 -3.7%
Subtotal 6,750 7,454 -9.4%
Human EcologyCore Human Ecology 387 423 -8.5%Family Social Sciences 2,652 3,150 -15.8%Human Nutritional Sciences 4,464 4,413 1.2%Textile Sciences 364 451 -19.2%
Subtotal 7,867 8,437 -6.8%
Kinesiology and Recreation Management 5,748 5,833 -1.5%
Law 4,990 4,636 7.6%
MedicineHuman Anatomy & Cell Science 150 150 0.0%Biochemistry and Medical Genetics 78 78 *Medical Microbiology 0 9 *Medical Rehabilitation 1,260 1,359 -7.3%
Occupational Therapy 1,025 999 2.7%Physical Therapy 2,016 2,176 -7.4%Respiratory Therapy 659 624 5.6%
Pharmacology & Therapeutics 243 174 39.7%Physiology 126 132 -4.5%
Subtotal 5,557 5,701 -2.5%
Music, Marcel A. Desautels Faculty of 6 2,562 2,604 -1.6%
Nursing 12,156 12,310 -1.3%
Pharmacy 2,795 2,635 6.1%
ScienceBiological Sciences 15,155 14,025 8.1%Chemistry 7,983 8,012 -0.4%Computer Science 7,884 8,058 -2.2%Mathematics 12,327 12,954 -4.8%Microbiology 5,049 4,941 2.2%Physics & Astronomy 2,928 3,354 -12.7%Statistics 7,035 7,251 -3.0%
Subtotal 58,361 58,595 -0.4%
Social Work 5,979 5,906 1.2%
On-Load 6,133 5,556 10.4%
Total 258,405 263,892 -2.1%
1. This report includes: (a) all distance education credit hours, including Independent Study, on-line courses, Campus Manitoba courses and group based study; (b) all courses taught off-campus with stipend from other than faculty or school resources. (c) all 'on-load' credit hours taught during the summer. Fall 2008 includes Inter-Universities Services courses. This report excludes credit hours declared as "Challenge for Credit". 2. Due to rounding, some totals may not match the sum of the individual department, or faculty, figures.3. An asterisk (*) indicates that the number of credit hours were below 100 in either year. Changes in faculties containing less than 100 credit hours can show abnormally large differences, therefore these are not reported. 4. The Department of English changed its name to the Department of English, Film, and Theatre in January 2008.5. Women's and Gender Studies was previously reported as Women's Studies.6. The Faculty of Music changed its name to the Marcel A. Desautels Faculty of Music in 2008.

OIA 2008/11/28 (Rev. 2008/12/03) 32
Table 8
% ChangeFall Term 2007 -
Faculty/School Fall Term 2008 Fall Term 2007 Fall Term 2008
Agricultural & Food SciencesGeneral Agriculture 36 27 *
Subtotal 36 27 *
Art, School of 378 414 -8.7%
ArtsAnthropology 384 384 0.0%Canadian Studies 51 54 *Classics 189 114 65.8%Economics 378 441 -14.3%English, Film, and Theatre 678 591 14.7%German and Slavic Studies 48 30 *History 423 348 21.6%Interdisciplinary 45 27 *Native Studies 336 507 -33.7%Philosophy 435 459 -5.2%Political Studies 309 336 -8.0%Psychology 2,877 2,535 13.5%Religion 450 168 167.9%Sociology 684 807 -15.2%Women's and Gender Studies 84 117 *
Subtotal 7,371 6,918 6.5%
EducationEducational Admin., Foundations & Psychology 585 741 -21.1%
Subtotal 585 741 -21.1%
EngineeringEngineering 30 36 *
Subtotal 30 36 *
Environment, Earth, and Resources, Clayton H. Riddell Faculty of
Environment and Geography 615 648 -5.1%Geological Sciences 39 105 *
Subtotal 654 753 -13.1%
Human EcologyFamily Social Sciences 114 171 -33.3%Human Nutritional Sciences 441 0 *
Subtotal 555 171 224.6%
Nursing 0 172 *
ScienceBiological Sciences 312 381 -18.1%Computer Science 513 471 8.9%Mathematics 627 546 14.8%Microbiology 333 492 -32.3%Statistics 378 372 1.6%
Subtotal 2,163 2,262 -4.4%
Social Work 1,707 1,728 -1.2%
Total 13,479 13,222 1.9%
1. Distance Education credit hours include - Independent Study (formerly correspondence), on-line courses, Campus Manitoba courses and group based study.2. An asterisk (*) indicates that the number of credit hours were below 100 in either year. Changes in faculties containing less than 100 credit hours can show abnormally large differences, therefore these are not reported.
The University of ManitobaUndergraduate Student Credit Hours
Taught by Faculty/School and Department
As at November 1 - Fall Terms Distance and Online Education1,2

33OIA 2008/11/28 (Rev. 2008/12/03)
Table 9
Taug
ht B
y2A
gric
.A
rch.
Art
,A
rts
Bus
.D
ent.
Den
t.Ed
uc.
Engi
n.En
viro
.Ex
t.H
um.
Kin
es. &
Law
Med
.M
ed.
Mus
icN
urs.
Phar
m.
Sci.
Soc.
U13
Pre-
Gra
d.To
tal4
& F
.S.
Sch.
of
Hyg
.Ed
uc.
Ecol
.R
ecM
gmt.
Reh
.W
ork
Mas
ters
Stud
.
Agr
ic. &
F.S
.5,
039
3
7881
48
915
046
285
114
336
40
315
737,
112
Arc
h.
5,00
117
252
12
3
993
3
6
42
1,
707
447
307,
622
Art,
Sch
. of
514
3,42
726
611
5
510
43
4
23
382
9
64,
701
Arts
333
2163
921
,693
1,39
1
93
564
420
2,46
935
736
03
261
456
65,
298
387
30,1
9230
018
965
,432
Bus
ines
s I.H
. A
sper
Sch
. O
f28
53
61,
266
13,8
21
3
180
1536
620
739
726
387
9
504
18,3
03
Edu
catio
n
18
8,34
0
60
6
6
114
8,54
4
Eng
inee
ring
6
6
11,3
36
195
338
66
1
163
12,7
05
Env
ironm
ent -
C
layt
on H
. Rid
dell
Fac.
of
279
1884
963
1527
2,46
625
727
84
93
62
93
1,58
7
246,
096
Hum
an E
col.
213
1275
911
1
12
315
189
3,34
090
9
171
72
045
1,77
924
97,
312
Kin
esio
logy
& R
ec.
Mgm
t.33
3
333
117
313
842
3,59
4
19
59
1,26
615
5,
748
Law
17
275
4,69
5
34,
990
Mus
ic -
Mar
cel A
. D
esau
tels
Fac
. of5
22
42
31
24
1,
995
14
66
182,
562
Nur
sing
66
3
169
5812
10,4
06
171
271,
244
12,1
56
Pha
rmac
y
9
2,
786
2,
795
Sci
ence
615
57
3,34
51,
659
213,
621
639
1,49
648
347
4
4262
437
219
,556
2123
,025
2712
256
,198
Soc
ial W
ork
10
5
69
3
9
93,
720
246
8427
4,27
2
Tota
l46,
364
5,05
44,
179
29,0
6917
,271
00
8,91
216
,221
3,71
95,
963
4,80
84,
776
4,69
80
02,
332
11,6
693,
164
28,0
564,
218
63,8
8491
21,
282
226,
546
1. In
clud
es a
ll co
urse
s nu
mbe
red
0400
-699
9. D
oes
not i
nclu
de D
ista
nce
Edu
catio
n co
urse
s an
d cr
edit
hour
s ta
ught
on-
load
dur
ing
the
prev
ious
sum
mer
.2.
The
Fac
ultie
s/S
choo
ls o
f Med
icin
e, D
entis
try, M
edic
al R
ehab
ilita
tion
and
Den
tal H
ygie
ne d
eter
min
e th
eir w
orkl
oad
by n
umbe
rs o
f stu
dent
s in
stea
d of
by
cred
it ho
urs.
The
y ar
e in
clud
ed in
the
"Tau
ght T
o" c
alcu
latio
ns b
ecau
se th
eir s
tude
nts
can
take
cre
dit h
ours
in o
ther
facu
lties
/sch
ools
. 3.
Uni
vers
ity 1
(U1)
is in
clud
ed in
the
"Tau
ght T
o" c
ateg
ory
as s
tude
nts
in th
is p
rogr
am ta
ke c
redi
t hou
rs fr
om o
ther
facu
lties
/sch
ools
.4.
Due
to ro
undi
ng, s
ome
tota
ls m
ay n
ot m
atch
the
sum
of t
he in
divi
dual
facu
lty fi
gure
s.
5. T
he F
acul
ty o
f Mus
ic c
hang
ed it
s na
me
to th
e M
arce
l A. D
esau
tels
Fac
ulty
of M
usic
in 2
008.
MA
TRIX
OF
UN
DER
GR
AD
UA
TE S
TUD
ENT
CR
EDIT
HO
UR
S TA
UG
HT
BY
FAC
ULT
Y/SC
HO
OL
1
Fall
Term
200
8A
s at
Nov
embe
r 1
Taug
ht T
o

OIA 2008/11/28 (Rev. 2008/12/03) 34
Table 10
TotalFaculty/School Hours 1000 2000 3000 4000-6999 1000 2000 3000 4000-6999
Agricultural & Food SciencesAgriculture Diploma 3,062 3,062 100% Agribusiness & Agric. Economics 756 354 63 231 108 47% 8% 31% 14%Animal Science 471 237 156 78 50% 33% 17%Biosystems Engineering 579 212 115 252 37% 20% 44%Entomology 54 39 15 72% 28%Food Science 858 186 3 90 579 22% 0% 10% 67%General Agriculture 604 378 150 72 4 63% 25% 12% 1%Plant Science 405 111 201 93 27% 50% 23%Soil Science 324 213 111 66% 34%
Subtotal - all 7,112 3,980 815 1,078 1,240 56% 11% 15% 17%Subtotal - excl. Ag. Diploma 4,051 918 815 1,078 1,240 23% 20% 27% 31%
ArchitectureArchitecture 0 City Planning 0 Environmental Design 7,115 2,133 1,884 1,970 1,128 30% 26% 28% 16%Interior Design 354 354 100% Landscape Architecture 153 144 9 94% 6%
Subtotal 7,622 2,133 1,884 2,468 1,137 28% 25% 32% 15%
Art, School of 4,701 2,066 1,182 950 504 44% 25% 20% 11%
ArtsAnthropology 3,129 1,941 1,050 132 6 62% 34% 4% 0%Asian Studies 960 654 243 63 68% 25% 7% Canadian Studies 0 Catholic Studies 333 279 54 84% 16% Classics 1,194 624 474 96 52% 40% 8% Economics 6,663 3,933 1,725 873 132 59% 26% 13% 2%English, Film, and Theatre4 7,511 4,974 1,580 906 51 66% 21% 12% 1%French, Spanish & Italian 2,274 1,779 360 114 21 78% 16% 5% 1%German and Slavic Studies 696 330 183 156 27 47% 26% 22% 4%Global Political Economy 93 54 39 58% 42%History 5,082 2,262 1,959 627 234 45% 39% 12% 5%Icelandic Studies 120 39 36 36 9 33% 30% 30% 8%Interdisciplinary 2,325 2,325 100% Labour and Workplace Studies 291 135 48 84 24 46% 16% 29% 8%Linguistics 981 483 306 192 49% 31% 20% Native Studies 2,202 1,632 333 210 27 74% 15% 10% 1%Near Eastern & Judaic Studies 63 63 100% Philosophy 4,164 2,820 1,257 39 48 68% 30% 1% 1%Political Studies 2,274 561 771 489 453 25% 34% 22% 20%Psychology 14,088 7,917 4,245 1,641 285 56% 30% 12% 2%Religion 2,052 1,608 291 75 78 78% 14% 4% 4%Sociology 7,788 5,118 1,857 660 153 66% 24% 8% 2%Ukrainian Canadian Heritage Studies 6 6 100% Women's and Gender Studies5 1,143 894 171 78 78% 15% 7%
Subtotal 65,432 40,371 16,997 6,477 1,587 62% 26% 10% 2%
Business, Asper School ofAccounting & Finance 6,102 1,959 1,875 1,395 873 32% 31% 23% 14%Actuarial Science 240 84 63 93 35% 26% 39%Business Administration 7,044 4,899 990 1,155 70% 14% 16%Interdisciplinary 45 45 100%Marketing 3,093 1,032 1,464 597 33% 47% 19%Supply Chain Management 1,779 1,560 168 51 88% 9% 3%
Subtotal 18,303 1,959 9,450 4,080 2,814 11% 52% 22% 15%
Credit Hours - by Course Level Proportion of Credit Hours - by Level
Analysis of Undergraduate Student Credit Hours1,2,3 - By Course LevelAs at November 1 - Fall Term 2008

35OIA 2008/11/28 (Rev. 2008/12/03)
Table 10
TotalFaculty/School Hours 1000 2000 3000 4000-6999 1000 2000 3000 4000-6999
Credit Hours - by Course Level Proportion of Credit Hours - by Level
EducationCurriculum,Teaching & Learning 5,904 3,018 2,683 204 51% 45% 3%Educational Admin., Foundations & Psychology 2,640 1,341 627 672 51% 24% 25%
Subtotal 8,544 4,359 3,310 0 876 51% 39% - 10%
EngineeringCivil Engineering 3,296 678 1,306 1,312 21% 40% 40%Electrical & Computer Engineering 2,987 682 960 1,345 23% 32% 45%Engineering 2,406 2,034 348 24 85% 14% 1%Mechanical & Manufacturing Engineering 4,016 1,630 1,177 1,209 41% 29% 30%
Subtotal 12,705 2,034 3,338 3,443 3,890 16% 26% 27% 31%
Environment, Earth, and Resources, Clayton H. Riddell Faculty of
Environment and Geography 4,710 2,277 1,511 572 351 48% 32% 12% 7%Geological Sciences 1,386 417 513 225 231 30% 37% 16% 17%
Subtotal 6,096 2,694 2,024 797 582 44% 33% 13% 10%
Human EcologyCore Human Ecology 387 330 45 12 85% 12% 3%Family Social Sciences 2,538 1,584 162 591 201 62% 6% 23% 8%Human Nutritional Sciences 4,023 2,229 480 696 618 55% 12% 17% 15%Textile Sciences 364 141 106 48 69 39% 29% 13% 19%
Subtotal 7,312 3,954 1,078 1,380 900 54% 15% 19% 12%
Kinesiology and Recreation Management 5,748 2,409 1,266 1,710 363 42% 22% 30% 6%
Law 4,990 2,083 1,199 1,708 0 42% 24% 34% -
Music, Marcel A. Desautels Faculty of 6 2,562 920 642 591 410 36% 25% 23% 16%
Nursing 12,156 1,650 3,359 3,597 3,550 14% 28% 30% 29%
Pharmacy 2,795 196 577 846 1,176 7% 21% 30% 42%
ScienceBiological Sciences 14,843 10,565 3,012 978 288 71% 20% 7% 2%Chemistry 7,983 3,687 3,672 219 405 46% 46% 3% 5%Computer Science 7,371 4,413 1,071 1,467 420 60% 15% 20% 6%Mathematics 11,700 9,204 1,791 603 102 79% 15% 5% 1%Microbiology 4,716 765 1,749 1,482 720 16% 37% 31% 15%Physics & Astronomy 2,928 2,568 228 105 27 88% 8% 4% 1%Statistics 6,657 4,947 1,332 264 114 74% 20% 4% 2%
Subtotal 56,198 36,149 12,855 5,118 2,076 64% 23% 9% 4%
Social Work 4,272 441 849 1,464 1,518 10% 20% 34% 36%
Total 226,546 107,396 60,823 35,705 22,623 47% 27% 16% 10%
1. Includes all courses numbered 0400-6999. Does not include Distance Education courses and credit hours taught "on load" during the summer. 2. The faculties/schools of Medicine, Dentistry, Medical Rehabilitation and Dental Hygiene determine their workload by numbers of students instead of by credit hours. For that reason they are not included in this report. 3. Due to rounding, some totals may not match the sum of the individual level, department or faculty figures. 4. The Department of English changed its name to the Department of English, Film, and Theatre in January 2008.5. Women's and Gender Studies was previously reported as Women's Studies.6. The Faculty of Music changed its name to the Marcel A. Desautels Faculty of Music in 2008.

OIA 2008/11/28 (Rev. 2008/12/03) 36
Table 11
FACULTY/SCHOOL Full Part Total Full Part Total
Agric. & Food Sci. Degree Undergraduate 27 3 30 39 1 40 -25.0
Graduate 69 1 70 94 0 94 -25.5Diploma Undergraduate 0 0 0 0 0 0 0.0
Subtotal 96 4 100 133 1 134 -25.4
Architecture Undergraduate 17 1 18 16 0 16 12.5Graduate 12 0 12 8 0 8 *Subtotal 29 1 30 24 0 24 25.0
Art, School of Undergraduate 22 2 24 23 1 24 0.0Subtotal 22 2 24 23 1 24 0.0
Arts Undergraduate2 287 41 328 341 62 403 -18.6Graduate 32 0 32 42 3 45 -28.9Subtotal 319 41 360 383 65 448 -19.6
Business, Asper School of Undergraduate 218 15 233 262 13 275 -15.3Graduate 6 0 6 11 1 12 *Subtotal 224 15 239 273 14 287 -16.7
Dentistry Undergraduate3 0 0 0 1 0 1 *Graduate 4 0 4 5 0 5 *Subtotal 4 0 4 6 0 6 *
Education 4, 5 Undergraduate 0 1 1 0 1 1 0.0Graduate 13 0 13 13 1 14 *Subtotal 13 1 14 13 2 15 *
Engineering Undergraduate 149 18 167 166 23 189 -11.6Graduate 112 1 113 105 2 107 5.6Subtotal 261 19 280 271 25 296 -5.4
Environment, Earth, and Resources Clayton H. Riddell Faculty of Undergraduate 17 11 28 21 15 36 -22.2
Graduate 33 0 33 30 3 33 0.0Subtotal 50 11 61 51 18 69 -11.6
Extended Education Undergraduate 22 13 35 24 25 49 -28.6Subtotal 22 13 35 24 25 49 -28.6
Graduate Studies - Interdisciplinary Graduate 13 0 13 12 0 12 *Subtotal 13 0 13 12 0 12 *
Human Ecology 4 Undergraduate 32 3 35 34 2 36 -2.8Graduate 8 0 8 7 0 7 *Subtotal 40 3 43 41 2 43 0.0
Kinesiology and Recreation Management Undergraduate 2 1 3 4 0 4 *
Graduate 6 0 6 3 0 3 *Subtotal 8 1 9 7 0 7 *
Law Undergraduate 0 0 0 0 0 0 0.0Graduate 2 0 2 1 0 1 *Subtotal 2 0 2 1 0 1 *
MedicineMedicine Undergraduate 0 0 0 0 0 0 0.0
Graduate 54 1 55 48 0 48 14.6Medical Rehabilitation Undergraduate 0 0 0 0 0 0 0.0
Graduate 4 0 4 4 0 4 0.0Subtotal 58 1 59 52 0 52 13.5
Music 5, 6 Undergraduate 2 0 2 1 1 2 * Marcel A. Desautels Faculty of Graduate 0 0 0 1 0 1 *
Subtotal 2 0 2 2 1 3 *
INTERNATIONAL UNDERGRADUATE AND GRADUATE STUDENTS
Fall Term 2007 and Fall Term 2008(As at November 1)
2007 to 2008% Change
Fall Term 2007Fall Term 2008
BY FACULTY/SCHOOL, FULL-TIME AND PART-TIME 1

37OIA 2008/11/28 (Rev. 2008/12/03)
Table 11
FACULTY/SCHOOL Full Part Total Full Part Total 2007 to 2008% Change
Fall Term 2007Fall Term 2008
Nursing Undergraduate 29 3 32 32 3 35 -8.6Graduate 1 0 1 0 0 0 *Subtotal 30 3 33 32 3 35 -5.7
Pharmacy Undergraduate 0 0 0 0 0 0 0.0Graduate 5 0 5 3 0 3 *Subtotal 5 0 5 3 0 3 *
Science Undergraduate 208 20 228 249 24 273 -16.5Graduate 72 0 72 75 2 77 -6.5Subtotal 280 20 300 324 26 350 -14.3
Social Work Undergraduate 3 0 3 4 1 5 *Graduate 3 4 7 4 1 5 *Subtotal 6 4 10 8 2 10 0.0
University 1 Undergraduate 373 51 424 404 54 458 -7.4Subtotal 373 51 424 404 54 458 -7.4
OTHERS7 Undergraduate 6 0 6 9 0 9 *
Total Undergraduate 1414 183 1597 1630 226 1856 -14.0
Total Graduate 449 7 456 466 13 479 -4.8
Total 1863 190 2053 2096 239 2335 -12.1
P.G.M.E.8 81 0 81 84 0 84 -3.6
Grand Totals 1944 190 2134 2180 239 2419 -11.8
1. Includes Joint Master's students from both the University of Manitoba and the University of Winnipeg, and Distance Education students. 2. Includes Master's of Public Administration students.3. Includes students enrolled in the International Dentist Degree Program.4. Students who are enrolled in the integrated B.H.Ecol./B.Ed. Program are shown in the Faculty of Human Ecology for years 3 and 4 and in Education for year 5.5. Enrolment in the old integrated B.Mus./B.Ed. Program is shown in Music for years 2 & 3, and in Education for years 4 & 5. In the revised program, enrolment is shown in Music for years 3 & 4 and in Education for year 5.6. Faculty of Music renamed the Marcel A. Desautels Faculty of Music in 2008.7. Includes all undergraduate students in specifically arranged programs.8. Post-Graduate Medical Education Students.
* Percentages not shown due to low numbers of students.

OIA 2008/11/28 (Rev. 2008/12/03) 38
Table 12
Facu
lty/S
choo
lU
.G
.U
.G
.U
.G
.U
.G
.U
.G
.-
8-
10-
8-
6-
812
367
125
4999
4192
4711
940
7962
100
8580
5984
4782
5280
-87
-67
-67
-69
-10
3911
710
1211
310
1012
695
411
696
510
243
151
401
4343
751
468
5144
240
366
4311
417
377
339
26-
27-
24-
24-
26-
558
8345
083
558
7350
867
493
6321
864
155
7218
167
154
9018
581
124
4689
2410
829
7823
3416
12-
9-
20-
18-
22-
19-
6-
3-
5-
8-
-1
-2
-1
-1
--
-3
-4
-6
-4
-1
-1
-2
-2
-5
-6
140
1111
810
116
1185
1891
1313
59
117
612
18
9811
108
798
184
174
384
596
6
111
5310
561
118
6711
363
9961
6260
6247
5445
5424
82-
466
399
2811
365
2110
344
2232
027
327
1837
420
377
1946
043
649
445
943
050
655
517
6747
560
491
5948
356
149
3914
327
175
3113
718
131
35
4382
757
4052
749
4165
720
4006
690
4009
617
4382
765
4052
759
4165
728
4006
696
4009
625
1.Th
e re
porti
ng o
f deg
rees
is b
ased
on
a ca
lend
ar y
ear (
Febr
uary
, May
and
Oct
ober
gra
duan
ds).
2.In
clud
es d
egre
es a
nd c
ertif
icat
es c
onfe
rred
at S
t. B
onifa
ce C
olle
ge.
3.C
ontin
uing
Edu
catio
n w
as re
nam
ed E
xten
ded
Edu
catio
n in
200
6.4.
The
Facu
lty o
f Phy
sica
l Edu
catio
n an
d R
ecre
atio
n S
tudi
es w
as re
nam
ed th
e Fa
culty
of K
ines
iolo
gy a
nd R
ecre
atio
n M
anag
emen
t in
2007
.5.
4702
4634
TOTA
L(in
clud
ing
Hon
orar
y de
gree
s)51
4748
1148
93
Soc
ial W
ork
TOTA
L(e
xclu
ding
Hon
orar
y de
gree
s)
Nur
sing
Pha
rmac
yS
cien
ce2
Med
icin
e
Med
icin
e
Med
ical
Reh
abili
tatio
nM
usic
, Mar
cel A
. Des
aute
ls F
acul
ty o
f 5
F
ood
& N
utrit
iona
l Sci
ence
s
Inte
rdis
cipl
inar
yH
uman
Eco
logy
Law
Kin
esio
logy
and
Rec
reat
ion
Man
agem
ent4
Gra
duat
e S
tudi
es
Dis
abili
ty S
tudi
es
Env
ironm
ent,
Ear
th, a
nd R
esou
rces
Ext
ende
d E
duca
tion3
A
borig
inal
Chi
ld &
Fam
ily S
ervi
ces
C
omm
unity
Wel
lnes
s
2007
2004
4626
4801
2006
4696
Agr
icul
tura
l & F
ood
Sci
ence
sA
rchi
tect
ure
Art,
Sch
ool o
fA
rts2
D
entis
try
Den
tal H
ygie
neE
duca
tion2
Eng
inee
ring
Cla
yton
H. R
idde
ll Fa
culty
of
2008
The
Facu
lty o
f Mus
ic c
hang
ed it
s na
me
to th
e M
arce
l A. D
esau
tels
Fac
ulty
of M
usic
in 2
008.
5139
DEG
REE
S, D
IPLO
MA
S A
ND
CER
TIFI
CA
TES
CO
NFE
RR
ED1
BY
FAC
ULT
Y/SC
HO
OL,
UN
DER
GR
AD
UA
TE A
ND
GR
AD
UA
TE
Bus
ines
s, A
sper
Sch
ool o
f 2
4885
2005
Den
tistry
Hon
orar
y

39OIA 2008/11/28 (Rev. 2008/12/03)
Table 13
Prog
ram
/Fac
ulty
Dip
lom
a2-
Year
3-Ye
ar4-
Year
4-Ye
ar A
dvan
ced
4-Ye
ar H
onou
rs5-
year
Inte
grat
ed
Agr
icul
tura
l & F
ood
Sci
ence
s51
,543
90,1
63A
rchi
tect
ure
Env
ironm
enta
l Des
ign
20,9
70A
rt, S
choo
l of
H
isto
ry31
,894
42,4
08
Stu
dio
35,0
4847
,666
Arts
22,8
4730
,462
27,4
16B
usin
ess,
Asp
er S
choo
l of
34,6
15D
entis
try
Den
tistry
232
7,35
3
Den
tal H
ygie
ne3
105,
716
Edu
catio
n
Edu
catio
n 2-
Yea
r 21
,080
H
uman
Eco
logy
/Edu
catio
n In
tegr
ated
45,8
72
Mus
ic/E
duca
tion
Inte
grat
ed11
1,98
7E
ngin
eerin
g61
,118
Env
ironm
ent,
Ear
th, a
nd R
esou
rces
, C
layt
on H
. Rid
dell
Facu
lty o
f 430
,941
41,2
5441
,254
Hum
an E
colo
gy36
,456
Law
67,5
68M
edic
ine
M
edic
ine2
199,
441
M
edic
al R
ehab
ilita
tion
53,1
98
Res
pira
tory
The
rapy
41,1
39M
usic
102,
101
Nur
sing
18,5
8555
,755
Pha
rmac
y86
,116
Phy
sica
l Edu
catio
n &
Rec
reat
ion
Stu
dies
P
hysi
cal E
duca
tion
45,2
58
Rec
reat
ion
Stu
dies
58,3
83
Exe
rcis
e an
d S
port
Sci
ence
54,3
10S
cien
ce24
,357
32,4
7632
,476
Soc
ial W
ork
34,8
8945
,065
1.
Pro
gram
cos
ts a
re c
alcu
late
d by
mul
tiply
ing
the
aver
age
cost
per
cre
dit h
our i
n a
give
n fa
culty
by
the
num
ber o
f cre
dit h
ours
requ
ired
to a
ttain
a d
egre
e.
Th
e nu
mbe
r of c
redi
t hou
rs th
at a
re re
quire
d fo
r a d
egre
e ar
e ta
ken
from
the
Gen
eral
Cal
enda
r.2.
Th
e co
st fo
r pro
gram
s in
the
Facu
lties
of D
entis
try a
nd M
edic
ine
are
calc
ulat
ed b
y m
ultip
lyin
g th
e co
st p
er s
tand
ard
stud
ent b
y th
e nu
mbe
r of y
ears
requ
ired
to a
ttain
a d
egre
e.3.
Th
e D
iplo
ma
prog
ram
in D
enta
l Hyg
iene
is a
two-
year
pro
gram
but
requ
ires
a qu
alify
ing
year
in th
e Fa
culti
es o
f Arts
or S
cien
ce.
Thes
e co
sts
refle
ct th
e tw
o-ye
ar c
ompo
nent
.4.
D
ue to
the
dive
rsity
of d
egre
es a
vaila
ble
thro
ugh
the
Cla
yton
H. R
idde
ll Fa
culty
of E
nviro
nmen
t, E
arth
, and
Res
ourc
es, t
hese
pro
gram
cos
ts a
re a
n ap
prox
imat
ion
base
d on
90
cred
it ho
urs
for a
thre
e-ye
ar d
egre
e an
d 12
0 cr
edit
hour
s fo
r a fo
ur-y
ear d
egre
e.S
ourc
e of
Dat
a: A
nnua
l Fin
anci
al R
epor
t Mar
ch 3
1, 2
007
Deg
rees
2004
-200
5 to
200
6-20
07Ex
clud
es A
mor
tizat
ion
of C
apita
l Ass
ets
UN
DER
GR
AD
UA
TE T
HR
EE-Y
EAR
AVE
RA
GE
PRO
GR
AM
CO
ST 1
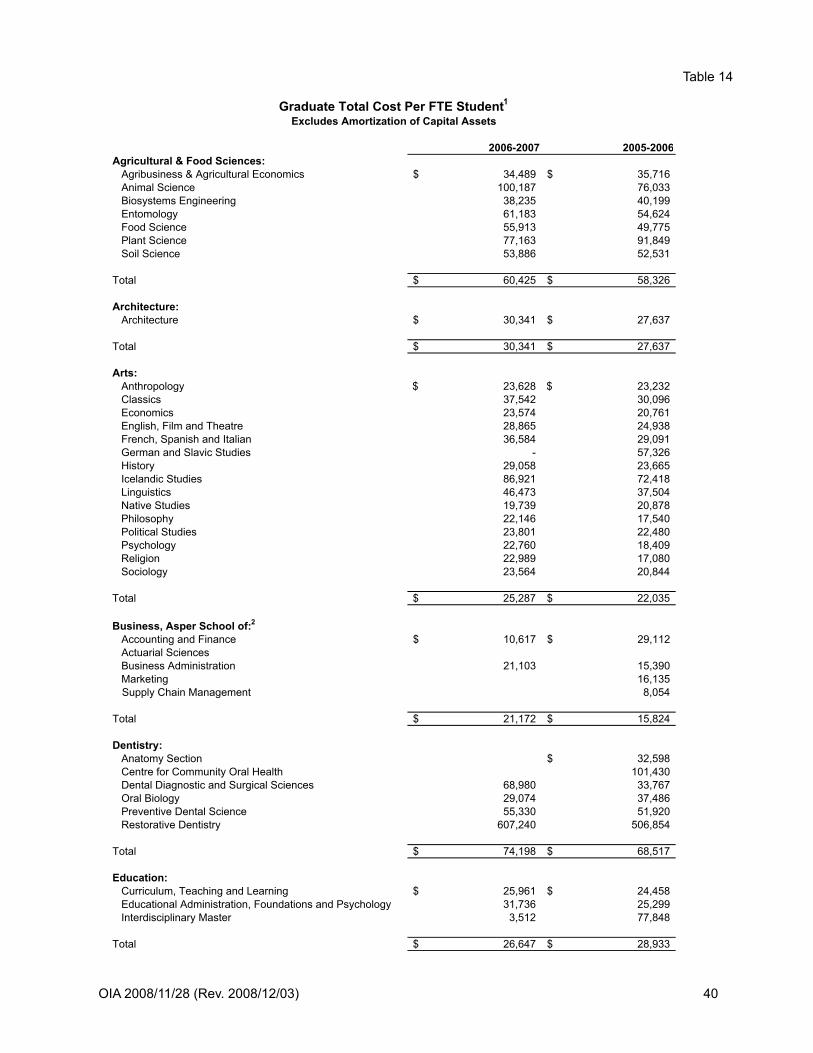
OIA 2008/11/28 (Rev. 2008/12/03) 40
Table 14
2006-2007 2005-2006Agricultural & Food Sciences: Agribusiness & Agricultural Economics 34,489$ 35,716$ Animal Science 100,187 76,033 Biosystems Engineering 38,235 40,199 Entomology 61,183 54,624 Food Science 55,913 49,775 Plant Science 77,163 91,849 Soil Science 53,886 52,531
Total 60,425$ 58,326$
Architecture: Architecture 30,341$ 27,637$
Total 30,341$ 27,637$
Arts: Anthropology 23,628$ 23,232$ Classics 37,542 30,096 Economics 23,574 20,761 English, Film and Theatre 28,865 24,938 French, Spanish and Italian 36,584 29,091 German and Slavic Studies - 57,326 History 29,058 23,665 Icelandic Studies 86,921 72,418 Linguistics 46,473 37,504 Native Studies 19,739 20,878 Philosophy 22,146 17,540 Political Studies 23,801 22,480 Psychology 22,760 18,409 Religion 22,989 17,080 Sociology 23,564 20,844
Total 25,287$ 22,035$
Business, Asper School of:2
Accounting and Finance 10,617$ 29,112$ Actuarial Sciences Business Administration 21,103 15,390 Marketing 16,135 Supply Chain Management 8,054
Total 21,172$ 15,824$
Dentistry: Anatomy Section 32,598$ Centre for Community Oral Health 101,430 Dental Diagnostic and Surgical Sciences 68,980 33,767 Oral Biology 29,074 37,486 Preventive Dental Science 55,330 51,920 Restorative Dentistry 607,240 506,854
Total 74,198$ 68,517$
Education: Curriculum, Teaching and Learning 25,961$ 24,458$ Educational Administration, Foundations and Psychology 31,736 25,299 Interdisciplinary Master 3,512 77,848
Total 26,647$ 28,933$
Graduate Total Cost Per FTE Student1Excludes Amortization of Capital Assets

41OIA 2008/11/28 (Rev. 2008/12/03)
Table 14
2006-2007 2005-2006
Engineering: Civil Engineering 41,182$ 36,114$ Electrical and Computer Engineering 42,782 32,523 Mechanical and Manufacturing Engineering 47,821 39,064
Total 43,862$ 35,068$
Environment, Earth, and Resources, Clayton H. Riddell Faculty of: Environment and Geography 24,591$ 26,122$ Geological Sciences 114,800 68,570 Natural Resources Institute 22,549 22,696
Total 29,442$ 27,832$
Human Ecology: Family Social Sciences 26,489$ 26,345$ Human Nutritional Sciences 17,359 19,564 Textile Sciences 72,905 58,298
Total 23,727$ 23,993$
Kinesiology and Recreation Management: Kinesiology and Recreation Management 38,972$ 39,773$
Total 38,972$ 39,773$
Law: Law 51,759$ 56,665$
Total 51,759$ 56,665$
Medicine:3
Anesthesia 1,059,631$ 1,030,514$ Biochemistry and Molecular Biology 128,127 107,152 Centre for the Advancement of Medicine 253,248 Clinical Health Psychology 204,942 256,878 Community Health Sciences 57,512 57,949 Family Medicine 2,194,355 Human Anatomy and Cell Science 69,855 72,297 Immunology 57,641 51,916 Internal Medicine 4,245,351 4,957,660 Microbiology - Medicine 28,441 27,759 Obstetrics and Gynecology 1,274,781 1,294,391 Ophthalmology 75,114 75,349 Otolaryngology 242,173 296,450 Pediatrics and Child Health 1,916,376 2,046,958 Pathology 106,518 253,964 Pharmacology and Therapeutics 99,205 115,639 Physiology 74,786 75,300 Psychiatry 1,010,078 1,141,222 Radiology 447,361 526,469 School of Medical Rehabilitation 33,352 33,951 Surgery 1,863,351 1,120,144
Total 92,750$ 96,094$
Music: Music 46,438$ 41,295$
Total 46,438$ 41,295$

OIA 2008/11/28 (Rev. 2008/12/03) 42
Table 14
2006-2007 2005-2006
Nursing: Nursing 28,555$ 25,325$
Total 28,555$ 25,325$
Pharmacy: Pharmacy 54,734$ 46,097$
Total 54,734$ 46,097$
Science: Botany 39,837$ 38,783$ Chemistry 33,680 30,043 Computer Science 29,729 26,112 Mathematics 23,005 22,315 Microbiology 29,847 26,692 Physics and Astronomy 62,410 46,429 Statistics 18,031 16,377 Zoology 32,656 30,748
Total 34,241$ 30,397$
Social Work: Social Work 19,017$ 14,424$
Total 19,017$ 14,424$
University Total: 43,026$ 40,077$
1. The cost per FTE student is, by definition, sensitive to the number of FTE students within a given faculty in any given year. Much of the variation in the costs between years can be attributed to the normal fluctuation in student counts. As such, programs of study with smaller numbers of graduate students may record higher degrees of volatility in costs between years as compared to programs with larger populations. Also, graduate programs of study that do not have graduate students will show the entire allocated cost. 2. A methodology change in calculating the graduate program costs in the I.H. Asper School of Business was implemented in 2004-2005. These new program costs should not be compared to those shown in previous years.3. Graduate FTE students in the Faculty of Medicine do not include Post Graduate Medical Education (P.G.M.E.) students.

43OIA 2008/11/28 (Rev. 2008/12/03)
Table 15
REB
ATE
D T
UIT
ION
FEE
S A
S A
PER
CEN
TAG
E O
F TO
TAL
PRO
GR
AM
CO
STS 1
2006
-200
7
0%10%
20%
30%
40%
50%
60%
70%
80%
90%
100%
Dental Hygiene
Music
Agric. (Diploma)
Agric. (Degree)
Medicine
Dentistry
Pharmacy
Law
Social Work
Kinesiology and Recreation Management
Nursing
Medical Rehab.
Environment, Earth, and Resources,Clayton H. Riddell Faculty of
Education
Business, Asper School of
Art, School of
Engineering
Arts
Human Ecology
Science
Architecture
Facu
lty/S
choo
l
% of Total Program Costs
1. P
rogr
am F
ees
and
Tota
l Pro
gram
Cos
ts a
re u
sed
for t
he F
acul
ties
of D
entis
try a
nd M
edic
ine,
and
for t
he S
choo
l of D
enta
l Hyg
iene
.

OIA 2008/11/28 (Rev. 2008/12/03) 44
Table 16
SUPP
OR
T2TO
TAL
SUPP
OR
T2TO
TAL
Full-
Tim
e3Pa
rt-T
ime4
Tota
lFu
ll/Pa
rt-T
ime
Full-
Tim
e3Pa
rt-T
ime4
Tota
lFu
ll/Pa
rt-T
ime
FAC
ULT
Y/SC
HO
OL
Agr
icul
tura
l and
Foo
d S
cien
ces
- Fa
culty
of
72.3
24.
2276
.54
73.1
114
9.65
76.3
74.
2080
.57
70.0
315
0.60
Arc
hite
ctur
e - F
acul
ty o
f35
.90
11.5
847
.48
16.8
364
.31
35.7
012
.92
48.6
217
.18
65.8
0
Arts
- Fa
culty
of
227.
774.
1123
1.88
68.1
530
0.03
238.
024.
3124
2.33
67.6
530
9.98
Art
- Sch
ool o
f19
.67
6.00
25.6
77.
8233
.49
17.6
76.
0023
.67
8.57
32.2
4
Bus
ines
s - I
.H. A
sper
Sch
ool o
f57
.01
4.29
61.3
038
.55
99.8
555
.45
3.29
58.7
436
.65
95.3
9
Den
tistry
- Fa
culty
of
44.0
40.
0044
.04
74.6
111
8.65
44.0
40.
0044
.04
69.4
511
3.49
Edu
catio
n - F
acul
ty o
f44
.43
4.19
48.6
227
.70
76.3
245
.15
7.04
52.1
926
.64
78.8
3
Eng
inee
ring
- Fac
ulty
of
63.1
119
.67
82.7
843
.25
126.
0366
.11
18.6
784
.78
50.0
013
4.78
Env
ironm
ent,
Ear
th, a
nd R
esou
rces
- C
layt
on H
. Rid
dell
Facu
lty o
f38
.50
4.61
43.1
124
.96
68.0
739
.50
4.61
44.1
124
.80
68.9
1
Gra
duat
e S
tudi
es -
Facu
lty o
f 54.
000.
004.
002.
006.
003.
000.
003.
002.
005.
00
Hum
an E
colo
gy -
Facu
lty o
f22
.70
0.00
22.7
012
.13
34.8
319
.70
0.00
19.7
011
.13
30.8
3
Kin
esio
logy
and
Rec
reat
ion
Man
agem
ent -
Fac
ulty
of
20.0
01.
4021
.40
4.96
26.3
618
.00
1.40
19.4
06.
1725
.57
Law
- Fa
culty
of
20.8
01.
0021
.80
15.2
037
.00
19.5
03.
3022
.80
15.2
038
.00
Med
icin
e - F
acul
ty o
f16
8.65
54.3
522
3.00
127.
8535
0.85
177.
8532
.03
209.
8812
4.04
333.
92
Mus
ic -
Mar
cel A
. Des
aute
ls F
acul
ty o
f 622
.00
4.89
26.8
92.
0028
.89
22.0
04.
8926
.89
5.00
31.8
9
Nur
sing
- Fa
culty
of
57.0
034
.00
91.0
020
.90
111.
9055
.00
46.0
010
1.00
22.9
012
3.90
Pha
rmac
y - F
acul
ty o
f18
.00
3.00
21.0
06.
0527
.05
18.0
01.
0019
.00
8.05
27.0
5
Sci
ence
- Fa
culty
of
161.
3432
.05
193.
3974
.34
267.
7316
6.34
33.4
119
9.75
72.6
227
2.37
Soc
ial W
ork
- Fac
ulty
of
41.1
05.
6046
.70
17.3
564
.05
41.3
53.
0044
.35
17.8
062
.15
Uni
vers
ity 1
3.00
5.22
8.22
16.0
024
.22
3.00
5.48
8.48
16.7
425
.22
Facu
lty/S
choo
l Sum
mar
y71,
141.
3420
0.18
1,34
1.52
673.
762,
015.
281,
161.
7519
1.55
1,35
3.30
672.
622,
025.
92
2007
-200
8
AC
AD
EMIC
FULL
-TIM
E EQ
UIV
ALE
NT
AC
AD
EMIC
AN
D S
UPP
OR
T ST
AFF
BA
SELI
NE
POSI
TIO
NS
1
Ope
ratin
g Fu
nds
(As
at A
pril
1)
AC
AD
EMIC
2008
-200
9

45OIA 2008/11/28 (Rev. 2008/12/03)
Table 16
SUPP
OR
T2TO
TAL
SUPP
OR
T2TO
TAL
Full-
Tim
e3Pa
rt-T
ime4
Tota
lFu
ll/Pa
rt-T
ime
Full-
Tim
e3Pa
rt-T
ime4
Tota
lFu
ll/Pa
rt-T
ime
2007
-200
8
AC
AD
EMIC
FULL
-TIM
E EQ
UIV
ALE
NT
AC
AD
EMIC
AN
D S
UPP
OR
T ST
AFF
BA
SELI
NE
POSI
TIO
NS
1
Ope
ratin
g Fu
nds
(As
at A
pril
1)
AC
AD
EMIC
2008
-200
9
AC
AD
EMIC
SU
PPO
RT
AN
D
AD
MIN
ISTR
ATI
VE U
NIT
S
Pre
side
nt1.
000.
001.
0011
.92
12.9
21.
000.
001.
0011
.57
12.5
7
Vic
e-P
resi
dent
(Aca
dem
ic) a
nd P
rovo
st28
2.63
46.1
332
8.76
498.
7982
7.55
261.
5245
.57
307.
0950
1.47
808.
56
Vic
e-P
resi
dent
(Adm
inis
tratio
n)0.
000.
000.
0078
1.57
781.
570.
000.
000.
0075
6.45
756.
45
Vic
e-P
resi
dent
(Ext
erna
l)0.
000.
000.
0055
.80
55.8
00.
000.
000.
0056
.30
56.3
0
Vic
e-P
resi
dent
(Res
earc
h)1.
500.
201.
7040
.04
41.7
41.
500.
201.
7040
.89
42.5
9
Aca
dem
ic S
uppo
rt &
Adm
inis
trat
ive
Uni
ts S
umm
ary
285.
1346
.33
331.
461,
388.
121,
719.
5826
4.02
45.7
730
9.79
1,36
6.68
1,67
6.47
Uni
vers
ity T
otal
s (e
xclu
des
Anc
illar
y Se
rvic
es)
1,42
6.47
246.
511,
672.
982,
061.
883,
734.
861,
425.
7723
7.32
1,66
3.09
2,03
9.30
3,70
2.39
Anc
illar
y S
ervi
ces
0.00
0.00
0.00
121.
4012
1.40
0.00
0.00
0.00
127.
9312
7.93
Uni
vers
ity T
otal
s (in
clud
es A
ncill
ary
Serv
ices
)1,
426.
4724
6.51
1,67
2.98
2,18
3.28
3,85
6.26
1,42
5.77
237.
321,
663.
092,
167.
233,
830.
32
1. F
or th
e pu
rpos
es o
f cal
cula
ting
FTE
pos
ition
s, fu
ll-tim
e is
def
ined
as
a co
ntin
uous
twel
ve-m
onth
app
oint
men
t, an
d pa
rt-tim
e as
eith
er a
s
essi
onal
app
oint
men
t (le
ss th
an 1
2 m
onth
s), o
r cas
ual.
In M
edic
ine,
'Geo
grap
hic
Full-
Tim
e' (G
.F.T
.) ar
e in
clud
ed in
full-
time.
2. I
nclu
des
acad
emic
libr
aria
ns.
3. F
ull-T
ime
Aca
dem
ic in
clud
es P
rofe
ssor
s, A
ssoc
iate
s, A
ssis
tant
s, L
ectu
rers
and
Ful
l-Tim
e In
stru
ctor
s.4.
Par
t-Tim
e A
cade
mic
incl
udes
Par
t-Tim
e In
stru
ctor
s an
d al
l Spe
cial
Aca
dem
ics.
5. T
he a
dmin
istra
tive
FTE
com
pone
nt o
f Gra
duat
e S
tudi
es is
incl
uded
und
er 'V
ice-
Pre
side
nt(A
cade
mic
) and
Pro
vost
' in
the
'
Aca
dem
ic S
uppo
rt an
d A
dmin
istra
tive
Uni
ts' s
ectio
n.6.
In
2008
the
Facu
lty o
f Mus
ic c
hang
ed it
s na
me
to th
e M
arce
l A. D
esau
tels
Fac
ulty
of M
usic
.7.
FTE
's a
ssoc
iate
d w
ith s
chol
arsh
ips,
fello
wsh
ips,
and
rese
arch
gra
nts
are
excl
uded
.

OIA 2008/11/28 (Rev. 2008/12/03) 46
Table 17
FULL
-TIM
E EQ
UIV
ALE
NT
(FTE
) AC
AD
EMIC
AN
D S
UPP
OR
T ST
AFF
BA
SELI
NE
POSI
TIO
NS1
Fisc
al Y
ear 2
007-
2008
& 2
008-
2009
(as
at A
pril
1), O
pera
ting
Fund
sSu
mm
ary
Rep
ort
2008
-200
920
07-2
008
FTE
FTE
Aca
dem
ic S
taff
2
Aca
dem
ics
-- te
achi
ng u
nits
Pro
fess
oria
l Ran
ks97
6.70
1,01
2.49
Lect
urer
s11
.53
13.6
7In
stru
ctor
s19
7.71
199.
12S
trate
gic
Initi
ativ
e Fu
nd94
.70
63.4
7S
ubto
tal
1,28
0.64
1,28
8.75
Spe
cial
Aca
dem
ics
151.
5812
8.02
Tota
l Aca
dem
ics
-- te
achi
ng u
nits
1,43
2.22
1,41
6.77
Aca
dem
ics
-- n
on-te
achi
ng u
nits
Pro
fess
oria
l Ran
ks28
.75
25.7
5In
stru
ctor
s16
7.89
177.
01S
ubto
tal
196.
6420
2.76
Spe
cial
Aca
dem
ics
44.1
243
.56
Tota
l Aca
dem
ics
-- no
n-te
achi
ng u
nits
240.
7624
6.32
Tota
l Aca
dem
ic S
taff
1,67
2.98
1,66
3.09
Supp
ort S
taff
Tota
l Sup
port
-- te
achi
ng u
nits
671.
7667
2.62
Sup
port
-- n
on-te
achi
ng u
nits
Sup
port
Sta
ff1,
333.
121,
304.
81A
cade
mic
Lib
raria
ns57
.00
61.8
7To
tal S
uppo
rt --
non
-teac
hing
uni
ts1,
390.
121,
366.
68
Tota
l Sup
port
Sta
ff2,
061.
882,
039.
30
Tota
l Aca
d. a
nd S
uppo
rt S
taff
3,73
4.86
3,70
2.39
Anc
illar
y Se
rvic
es S
taf f
Tota
l Anc
illar
y Se
rvic
es S
taff
121.
4012
7.93
Uni
vers
ity S
taff
- Ope
ratin
g B
udge
t Onl
y(in
cl. A
ncill
ary
Serv
ices
)3,
856.
263,
830.
32
1. F
or th
e pu
rpos
es o
f cal
cula
ting
FTE
pos
ition
s, fu
ll-tim
e is
def
ined
as
a co
ntin
uous
twel
ve-m
onth
app
oint
men
t, an
d pa
rt-tim
e as
eith
er a
ses
sion
al a
ppoi
ntm
ent (
less
than
twel
ve m
onth
s), o
r cas
ual.
In M
edic
ine,
'Geo
grap
hic
Full-
Tim
e' (G
FT) a
re in
clud
ed in
full-
time.
2. F
TEs
asso
ciat
ed w
ith s
chol
arsh
ips,
fello
wsh
ips,
and
rese
arch
gra
nts
are
excl
uded
.

47OIA 2008/11/28 (Rev. 2008/12/03)
Table 18
Facu
lty/S
choo
l/Uni
tR
even
ues
FTE
$/F.
T.E.
Rev
enue
sFT
E$/
F.T.
E.R
even
ues
FTE
$/F.
T.E.
Rev
enue
sFT
E$/
F.T.
E.St
aff
Staf
fSt
aff
Staf
fSt
aff
Staf
fSt
aff
Staf
f
Agr
icul
tura
l & F
ood
Sci
ence
s13
,686
,922
$
76.7
0$1
78,4
479,
942,
321
$
72
.68
136,
796
$
10,7
02,4
74$
71
.68
149,
309
$
7,26
8,00
9$
72.0
610
0,86
1$
Arc
hite
ctur
e19
7,91
948
.12
4,11
316
2,28
841
3,95
815
6,66
8
39
.00
4,01
7
37
,858
39.0
097
1A
rts4,
473,
477
239.
4218
,685
3,74
6,57
126
0.5
14,3
822,
890,
143
25
2.82
11,4
32
1,96
0,01
824
2.11
8,09
6A
rt, S
choo
l of
33,6
3423
.67
1,42
125
,552
22.6
71,
127
41,7
33
22
.67
1,84
1
34
,218
22.6
71,
509
Bus
ines
s, A
sper
Sch
ool o
f93
0,50
258
.74
15,8
4196
3,89
459
.16
16,2
9392
3,71
1
55
.89
16,5
27
670,
999
58.5
311
,464
Den
tistry
1,02
7,80
944
.04
23,3
3880
1,25
152
.08
15,3
8559
5,14
7
50
.18
11,8
60
548,
288
48.9
111
,210
Edu
catio
n45
8,00
051
.03
8,97
587
0,85
655
.98
15,5
571,
026,
970
50
.81
20,2
12
703,
686
48.5
314
,500
Eng
inee
ring
12,7
19,5
3166
.11
192,
400
11,0
75,2
5470
.78
156,
474
9,28
5,21
9
71.9
512
9,05
1
7,
898,
123
73.9
910
6,74
6E
nviro
nmen
t, E
arth
, and
Res
ourc
es
Cla
yton
H. R
idde
ll Fa
culty
of
6,69
7,18
641
.56
161,
145
4,52
8,76
540
.56
111,
656
4,31
1,22
5
38.7
211
1,34
4
3,
081,
573
33.7
291
,387
Hum
an E
colo
gy2,
279,
648
19.7
011
5,71
81,
837,
123
24.8
573
,928
1,70
3,91
1
23.5
072
,507
1,
131,
039
21.5
052
,606
Kin
esio
logy
and
Rec
reat
ion
Man
agem
ent
783,
554
19.4
040
,389
1,32
9,25
719
.33
68,7
671,
264,
519
20
.11
62,8
80
997,
866
21.7
445
,900
Law
69,9
8621
.80
3,21
089
,500
22.5
3,97
879
,304
22.5
03,
525
68,1
0221
.50
3,16
8M
edic
ine
57,1
19,0
9018
2.45
313,
067
56,4
93,9
0820
9.9
269,
147
45,7
02,9
62
20
8.69
218,
999
48,8
30,8
0919
6.87
248,
036
Mus
ic, M
arce
l A. D
esau
tels
Fac
ulty
of 3
-
26
.39
-
1,
769
27.1
565
6,63
6
22.3
029
8
-
20
.00
-N
ursi
ng1,
541,
721
64.0
024
,089
1,18
2,78
764
18,4
811,
260,
433
61
.20
20,5
95
931,
659
71.2
013
,085
Pha
rmac
y1,
624,
686
18.0
090
,260
1,45
1,11
219
.24
75,4
221,
714,
749
20
.09
85,3
53
1,16
6,73
318
.48
63,1
35S
cien
ce7,
976,
643
172.
5446
,231
7,06
3,12
716
7.95
42,0
557,
160,
997
16
6.84
42,9
21
7,13
7,52
916
5.00
43,2
58S
ocia
l Wor
k68
0,49
844
.35
15,3
4453
2,94
645
11,8
4360
0,92
8
46
.80
12,8
40
813,
503
46.8
017
,383
Oth
er4
10,0
15,3
754.
262,
351,
027
7,05
0,42
35
N/A
6,79
4,59
1
0.50
N/A
7,80
9,31
71.
00N
/A
Tota
l12
2,31
6,18
1$
1,22
2.28
100,
072
$
109,
148,
704
$ 1,
280.
3585
,249
$
96
,222
,320
$
1,24
6.25
77
,209
$
91
,089
,329
$
1,22
3.61
74
,443
$
1. R
esea
rch
fund
s ar
e ob
tain
ed fr
om b
oth
fede
ral a
nd p
rovi
ncia
l gra
ntin
g ag
enci
es a
nd o
ther
pub
lic a
nd p
rivat
e so
urce
s. S
ome
exam
ples
of t
he re
spec
tive
gran
ting
agen
cies
are
NS
ER
C, t
he M
edic
al R
esea
rch
Cou
ncil,
the
Hea
lth R
esea
rch
Cou
ncil,
and
the
Nat
iona
l Can
cer I
nstit
ute
of C
anad
a. A
lso
incl
udes
rese
arch
con
tract
s.2.
FTE
's a
re d
eriv
ed fr
om th
e IS
Boo
k ta
ble
'Ful
l-Tim
e E
quiv
alen
t Aca
dem
ic a
nd S
uppo
rt S
taff
Bas
elin
e P
ositi
ons,
(As
at A
pril
1)'.
The
figu
res
incl
ude
the
FTE
's fo
r Aca
dem
ic U
nits
that
pro
vide
a te
achi
ng s
ervi
ce m
inus
Spe
cial
Aca
dem
ic F
TE's
.
4. T
he 'O
ther
' cat
egor
y in
clud
es n
on-te
achi
ng u
nits
that
rece
ived
rese
arch
reve
nues
. S
ome
exam
ples
of t
hese
uni
ts a
re G
radu
ate
Stu
dies
, Uni
vers
ity 1
, Lib
rarie
s, a
nd S
tude
nt S
ervi
ces.
For
this
tabl
e G
radu
ate
Stu
dies
is v
iew
ed a
s an
adm
inis
trativ
e un
it on
ly.
T
he F
TE v
alue
sho
wn
in th
e 'O
ther
' cat
egor
y be
long
s to
Uni
vers
ity 1
and
is in
clud
ed in
the
'Tot
al $
/FTE
Sta
ff'.
RES
EAR
CH
REV
ENU
ES F
RO
M E
XTER
NA
L SO
UR
CES
1
per F
ULL
-TIM
E EQ
UIV
ALE
NT
STA
FF 2
by F
AC
ULT
Y/SC
HO
OL/
UN
ITas
at M
arch
31
3. T
he F
acul
ty o
f Mus
ic c
hang
ed it
s na
me
to th
e M
arce
l A. D
esau
tels
Fac
ulty
of M
usic
in 2
008.
2006
2005
2007
2008
OIA 2008/11/28 (Rev. 2008/12/03) 48
Table 19
Facu
lty/S
choo
l/Uni
tC
FIM
IFTo
tal $
CFI
MIF
Tota
l $C
FIM
IFTo
tal $
CFI
and
MIF
CFI
and
MIF
CFI
and
MIF
Agr
icul
tura
l & F
ood
Sci
ence
s25
0,00
0$
24
9,98
9$
49
9,98
9$
19
9,59
8$
2,
574,
598
$
2,
774,
196
$
99
,697
$
2,
467,
508
$
2,
567,
205
$
A
rchi
tect
ure
Arts
122,
422
72,4
2219
4,84
492
,283
92,2
8318
4,56
6A
rt, S
choo
l of
Bus
ines
s, A
sper
Sch
ool o
fD
entis
tryE
duca
tion
Eng
inee
ring
224,
997
220,
421
445,
418
225,
000
229,
575
454,
575
299,
709
829,
423
1,12
9,13
2
Env
ironm
ent,
Ear
th, a
nd R
esou
rces
,
Cla
yton
H. R
idde
ll Fa
culty
of
109,
165
109,
722
218,
887
1,81
0,60
41,
810,
604
3,62
1,20
8(1
46,6
63)
(146
,663
)
Hum
an E
colo
gy99
,499
99
,499
19
8,99
8
K
ines
iolo
gy &
Rec
reat
ion
Man
agem
ent
Law
Med
icin
e75
0,11
41,
220,
775
1,97
0,88
946
8,61
769
2,15
51,
160,
772
682,
394
792,
793
1,47
5,18
7
Mus
ic, M
arce
l A. D
esau
tels
Fac
ulty
of 2
Nur
sing
Pha
rmac
yS
cien
ce32
4,88
332
4,88
364
9,76
630
0,00
030
0,00
060
0,00
048
7,32
9
49
0,02
8
97
7,35
7
S
ocia
l Wor
k
Cen
tre o
n A
ging
125,
000
125,
000
250,
000
Tota
l1,
781,
581
$
2,
198,
212
$
3,
979,
793
$
3,
096,
102
$
5,
699,
215
$
8,
795,
317
$
1,
646,
965
$
4,
804,
251
$
6,
451,
216
$
1. T
he v
alue
s in
this
tabl
e do
not
incl
ude
the
20%
mat
chin
g fu
nds
that
the
Uni
vers
ity o
f Man
itoba
is re
quire
d to
pro
vide
.
CFI
& M
IF a
re m
atch
ed fu
nds,
but
am
ount
s m
ay n
ot m
atch
in a
ny g
iven
yea
r due
to th
e fin
anci
al y
ear i
n w
hich
the
trans
actio
ns w
ere
reco
rded
.2.
The
Fac
ulty
of M
usic
cha
nged
its
nam
e to
the
Mar
cel A
. Des
aute
ls F
acul
ty o
f Mus
ic in
200
8.
CA
NA
DIA
N F
OU
ND
ATI
ON
FO
R IN
NO
VATI
ON
AN
D M
AN
ITO
BA
INN
OVA
TIO
N F
UN
D A
WA
RD
S 1
As
at M
arch
31s
t
2006
2007
2008