Institutional Assessment Report: 2017-2018 Kutztown ...
64
Institutional Assessment Report: 2017-2018 Kutztown University of Pennsylvania The Kutztown University 2017-2018 Institutional Assessment Report documents an increasing commitment to the expansion of assessment efforts at all levels of the University. This report provides clear evidence of the assessment of curricular and co-curricular activities, the development of infrastructure, and the use of assessment results to inform planning, budgeting, resource allocation, and decision making. In particular, we now have an institutional document repository, academic and administrative programs sharing examples of effective assessment practices, and departments facilitating ongoing assessment of student learning outcomes, and the organized tracking of assessment data. This report identifies transparency within and across divisions to improve the assessment of student learning, resource management, institutional quality, and overall assessment processes. The four annual assessment reports included are: Strategic Planning Assessment, Academic Assessment, General Education Assessment, and Administrative Units and Programs Assessment. Strategic Planning Assessment Report Goal 1: Kutztown University will promote, enhance, and recognize excellence in teaching, learning, creativity, scholarship, and research. Objective 1: Develop and deliver distinctive and high-quality academic programs Action 1: Expand and grow the honors program by offering (a) scholarships that facilitate the recruitment and retention of honors students (b) service-learning experiences, and (c) study abroad opportunities. Action 2: Strengthen the University’s culture of learning. Action 3: Infuse high-impact practices throughout the student learning experience. Action 4: Strengthen the General Education program to serve as a foundation for students in all disciplines. Action 5: Utilize the academic program review process to ensure high-quality, viable, and innovative academic programs and services. Action 6: Develop and implement a vibrant First Year Experience that connects undergraduate students to the University’s academic experience. Action 7: Increase domestic and international visiting scholars, executives, and artists-in- residence programs.
Transcript of Institutional Assessment Report: 2017-2018 Kutztown ...

Institutional Assessment Report: 2017-2018 Kutztown University of Pennsylvania
The Kutztown University 2017-2018 Institutional Assessment Report documents an increasing commitment to the expansion of assessment efforts at all levels of the University. This report provides clear evidence of the assessment of curricular and co-curricular activities, the development of infrastructure, and the use of assessment results to inform planning, budgeting, resource allocation, and decision making. In particular, we now have an institutional document repository, academic and administrative programs sharing examples of effective assessment practices, and departments facilitating ongoing assessment of student learning outcomes, and the organized tracking of assessment data. This report identifies transparency within and across divisions to improve the assessment of student learning, resource management, institutional quality, and overall assessment processes. The four annual assessment reports included are: Strategic Planning Assessment, Academic Assessment, General Education Assessment, and Administrative Units and Programs Assessment.
Strategic Planning Assessment Report Goal 1: Kutztown University will promote, enhance, and recognize excellence in teaching,
learning, creativity, scholarship, and research.
Objective 1: Develop and deliver distinctive and high-quality academic programs Action 1: Expand and grow the honors program by offering (a) scholarships that facilitate the recruitment and retention of honors students (b) service-learning experiences, and (c) study abroad opportunities. Action 2: Strengthen the University’s culture of learning. Action 3: Infuse high-impact practices throughout the student learning experience. Action 4: Strengthen the General Education program to serve as a foundation for students in all disciplines. Action 5: Utilize the academic program review process to ensure high-quality, viable, and innovative academic programs and services. Action 6: Develop and implement a vibrant First Year Experience that connects undergraduate students to the University’s academic experience. Action 7: Increase domestic and international visiting scholars, executives, and artists-in-residence programs.

Action 8: Increase the internationalization of the campus by (a) recruiting and retaining international students and (b) providing study abroad opportunities for students. Benchmark: Increased retention, continuation, and graduation rates for all student
groups. ASSESSMENT
o As of fall 2018, our retention rate has improved to 76% from 74% last year (and 73% the year before); our persistence rate has remained at 65%; our 4-year graduation rate has fallen one point to 38%; and our 6-year graduation rate is steady at 53%.
Benchmark: Increased number of domestic and international visiting scholars,
executives, and artists-in-residence programs.
ASSESSMENT o The data related to progress against this benchmark are not
available.
Benchmark: Increased participation in the major high impact practices. Scholarships have been put in place for high achieving students which
require honors participation.
Administrators, faculty, and students asked to develop working groups to identify ways to enhance the program and increase honors participation.
As a result of student group recommendations; Honors has been moved
under “Academics” on the KU website.
ASSESSMENT o In fall 2016 there were 235 students in the honors program and, for
fall 17, there were 284 students in the honors program, an increase of 49 students.
Benchmark: Demonstrated achievement (via assessment) of the General Education learning goals. ASSESSMENT
o See General Education Assessment Committee AY 2017-2018 Final Report.
Benchmark: Increased participation in Academic Enrichment activities.
2

ASSESSMENT o The Academic Enrichment Department expanded its services to
Academic Jeopardy program students by partnering with CASA to provide the KU Succeed program. Students who participated in the program earned more credits and had higher semester GPAs compared to similar students who chose not to participate in KU Succeed.
Benchmark: Increased activities of and participation in discipline-based student clubs. ASSESSMENT
o Data show that between 2015 and 2017 the percent of the student population engaged with clubs increased from 14% to 15%. In addition, the ratio of student members per club increased from 23 to 28 members.
Benchmark: Implementation of a First Year Experience that connects first year students to the University and its academic goals. A symposium of those involved in FYE and retention initiatives took place and
other discussions have been held throughout the university and a number of suggestions have been put in practice as a result - core general education classes in math and English composition have had their class size reduced and our FYE class was expanded from 50 students to over 200 students this year (and will go up more next year), we will be making substantial additional investments to support FYE to include the hiring of our new FYE Director to lead these efforts.
In addition, an important new initiative that will have a positive impact on retention will be our requirement that freshmen and sophomores live in the residence hall beginning fall 2017. We have vetted this initiative throughout last year and it has received broad support from many of our constituents. Data shows that there is an 11% increase in the 4-yr graduation rate between freshman/sophomores who live on campus vs. those who don't live on campus.
ASSESSMENT
o The DFWI rate improved when MAT 105 class sizes were decreased from 80 to 40. The DFWI rate decreased from 46.66% to 37.22%.
o Retention rates for the fall 2017 freshmen and sophomore cohorts required to live on campus will be available in fall 2018.
o Summer academy analyses are inconclusive.
Benchmark: Re-accreditation from the Middle States Commission on Higher Education All Middle States Working Groups have submitted chapter drafts to the Middle
3
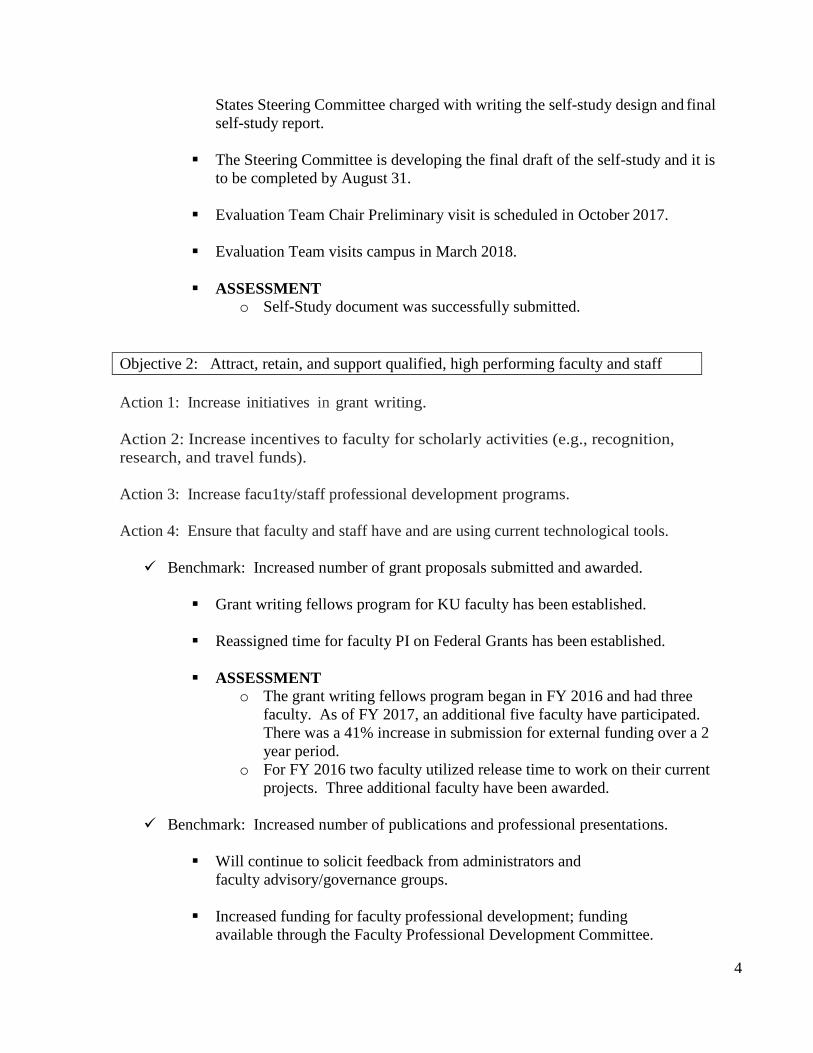
States Steering Committee charged with writing the self-study design and final self-study report.
The Steering Committee is developing the final draft of the self-study and it is to be completed by August 31.
Evaluation Team Chair Preliminary visit is scheduled in October 2017.
Evaluation Team visits campus in March 2018.
ASSESSMENT
o Self-Study document was successfully submitted.
Objective 2: Attract, retain, and support qualified, high performing faculty and staff
Action 1: Increase initiatives in grant writing. Action 2: Increase incentives to faculty for scholarly activities (e.g., recognition, research, and travel funds). Action 3: Increase facu1ty/staff professional development programs. Action 4: Ensure that faculty and staff have and are using current technological tools. Benchmark: Increased number of grant proposals submitted and awarded.
Grant writing fellows program for KU faculty has been established.
Reassigned time for faculty PI on Federal Grants has been established.
ASSESSMENT
o The grant writing fellows program began in FY 2016 and had three faculty. As of FY 2017, an additional five faculty have participated. There was a 41% increase in submission for external funding over a 2 year period.
o For FY 2016 two faculty utilized release time to work on their current projects. Three additional faculty have been awarded.
Benchmark: Increased number of publications and professional presentations. Will continue to solicit feedback from administrators and
faculty advisory/governance groups.
Increased funding for faculty professional development; funding available through the Faculty Professional Development Committee.
4
Hosted a reception at President's House for new faculty.
ASSESSMENT
o Research Committee funded $78,235 for 12 projects. o Professional development committee funded $167,233 for 181 awards. o KU BEARS funded $42,000 for 26 students and 21 faculty. o Undergraduate Research Fund funded $33,521 for 52 awards. o Above data is the most recent available, FY 2016. Funding and awards
should be reevaluated with the close of FY 2017.
Benchmark: Increased use of effective educational technology. ASSESSMENT
o Since 2013 the faculty engagement with educational technologies has increased dramatically. Faculty use of the Learning Management System – D2L –has increased from approximately 35% to nearly 90% for academic year 2017-2018. In addition, faculty have access to media streaming for producing and delivering content, and web conferencing technology to increase synchronous learning opportunities.
Objective 3: Attract, retain, and support motivated, high performing students
Action 1: Establish scholarships for high-achieving students. Action 2: Raise admission standards. Action 3: Increase the opportunities for undergraduate and graduate students to engage in professional-level scholarship. Action 4: Create incentives for transfer students. Action 5: Establish recruiting initiatives to enhance t h e number and quality of the student body. Action 6: Develop department and college recruitment and retention initiatives. Action 7: Develop and implement a multi-media marketing campaign that promotes the recruitment of motivated, qualified new, transfer, and graduate students.
Benchmark: Increased percentage of students recruited from the top 10% of
high school graduating classes.
Sesquicentennial Academic Honors Scholarship established - requirements: above 1350 SAT and 3.25 GPA. Award of $7,000/$28,000. Recipients must be
5

members of the honors program and live in the residence hall the first 3 years.
A second tier scholarship has been developed (above 1200 SAT, 3.25 GPA).
Award is $1,000 ($4,000 over 4 years) plus additional support from the Kutztown University Foundation. Honors Program required and must live in residence hall for first two years.
Housing scholarships have been established for high achieving incoming
freshman student athletes.
Talent grants have been established for high achieving incoming freshman in the arts.
Revised tuition reduction for qualified out-of-state students (150% of in-state
tuition).
Revised tuition reduction for qualified international students (150% of in-state tuition.
All institutional scholarships have been reviewed and adjusted (see KU
Scholarships).
KU Academic Excellence Scholarship established – requirements: above 3.5 GPA and financial need. Award of $1500 or half tuition per year for four years.
Funding is in place for KU-BEARS (Kutztown University Bringing Experiences
about Research in Summer); an initiative to support undergraduates (specifically freshmen and sophomores) working with KU faculty; undergraduates will be paid research assistants during the summer.
ASSESSMENT
o It was established that HSGPA and SAT scores were a better measure of academic quality of the applicant.
o As of fall 2018, freshman academic profile has improved in recent years and the HSGPA is at 3.20 and the SAT average is 1061.
o Fall 2017 saw a 4% increase in yield for students with 1200 SAT and 3.25 HSGPA. Please note that the Sesquicentennial Scholarship was awarded for fall 2016 and had a 45% yield, although the yield was 28% for fall 17.
o Academic Excellence grant had a 64% yield and the Academic Excellence waiver had a 62% yield. Please note that these awards began fall 2017.
o Overall need based scholarships (Golden Bear) had an increase in the number of deposits but due to a larger volume of applicants meeting the criteria, the yield decreased.
6
Benchmark: Raised minimum standards for admission (SAT 820+, GPA
2.0+). Admission standards have been raised at KU helping to significantly raise
the academic profile of our freshman class.
COMPLETED
Benchmark: Increased the 4- and 6-year graduation rates. ASSESSMENT
o As of fall 2018, our 4-year graduation rate has fallen one point to 37%; and our 6-year graduation rate increased by 2% to 55%.
Benchmark: Increased numbers of undergraduate and graduate students engaging
in professional-level scholarship. Funding is in place for KU-BEARS (Kutztown University Bringing
Experiences about Research in Summer); an initiative to support undergraduates (specifically freshmen and sophomores) working with KU faculty; undergraduates will be paid research assistants during the summer. There were a total of 10 students involved in the first year of this program (2016); the second year of the program saw the number of student participants increase to 26.
Benchmark: Increased number of highly qualified transfer students. A $500 book award has been established for any student with an
Associate Degree.
Meeting with Community College leaders to collaborate on joint initiatives (met thus far with HACC, LCCC, Luzerne CC, MCCC, RACC, and NCC).
Created a Phi Theta Kappa scholarship for up to eight incoming transfer
students who exhibit promising academic performance; and, ability to participate in Kutztown University's Honors program as evidenced by a 3.25 or higher transfer GPA.
Additional scholarships are being proposed to attract high achieving transfer students to KU.
Signed an agreement with American Honors, a selective honors program offered at community colleges across the U.S.
ASSESSMENT
7

o Yield increased by 4% for AA degree holders for fall 2017. RACC, LCCC, NCC. For LCCC, comparing fall 16 to fall 17, yield increased by 7% to 76% and deposits increased by 37 students, a 45%change. Transfer counts for RACC and NCC were unchanged from fall 16 to fall 17. Despite declining community college enrollments, we have stabilized and maintained our transfer enrollment from these community colleges.
Benchmark: Increased number of highly qualified new undergraduate and
graduate students. Re-organized our admissions area and placed a full-time recruiter in
Philadelphia at the City Center.
Established free "bus passes" for students with need to travel to university.
Working with the Allentown and Reading School Districts to re-introduce special programs to entice more students from these important population centers.
Received a $1.3 million Upward Bound grant with the Allentown School
District.
Math Placement pilot implemented.
Completed online graduate assistantship process.
Hired a Philadelphia Regional Admissions Recruiter.
Trained Alumni Board members to participate in college fairs and high school visits.
Additional recruitment and retention initiatives are included in the 2017-
2020 University Strategic Enrollment Management Plan.
ASSESSMENT o Freshman academic profile has improved in recent years and the
HSGPA is at 3.20 and the SAT average is 1061. o Fall 2017 saw a 4% increase in yield for students with 1200 SAT and
3.25 HSGPA. o Fall 2017 saw a significant increase in yield for students with
financial need (71% to 79%).
Goal 2: Kutztown University will partner with the community to serve the needs of the people of the Commonwealth and the region.
8
Objective 1: Provide increased access to educational opportunities for the region’s citizens
Action 1: Increase online educational experiences and non-traditional delivery methods (e.g., weekend academy, evening courses, non-traditional schedules).
Action 2: Strengthen and grow graduate education.
Action 3: Provide lifelong learning opportunities for (a) adult learners, (b) non-degree seeking students oriented to regional culture, agriculture, business, and government, (c) seekers of certificates and specialized programs that address the needs of professionals in the workforce, and (d) non-degree seeking students that meet their personal needs.
Action 4: Promote dual admissions, dual enrollment, and other initiatives with community colleges as well as develop partnerships with other four-year institutions.
Action 5: Establish new integrated bachelors to masters programs.
Action 6: Increase educational opportunities for alumni. Benchmark: Increased number of new online academic programs.
ASSESSMENT
o Fully online graduate programs. M.A. Arts Administration M.Ed. Music Education Special Education Certification
o Hybrid/low residency programs
MBA MFA Communication Design DSW Leadership Education Ed.D. Transformational Teaching and Learning
Benchmark: Increased number of new integrated bachelors to masters
programs. ASSESSMENT
o Current proposal for a 4+1 program in CSIT with Slippery Rock University.
Benchmark: Increased enrollments as a result of partnerships with the community colleges in our region. ASSESSMENT
9

Benchmark: New certificate programs. ASSESSMENT
o Due to current accreditation status, the University is not able to submit a substantive change to offer certificate programs, although, the following certificate programs are internally approved and awaiting accreditation status change. Data Analytics, Geospatial Information Technology, Social
Media Strategies.
Benchmark: New non-degree courses and programs. KU President, Kenneth S. Hawkinson, signed a five-year admission
agreement with Kutztown Area School District Superintendent, George F. Fiore, on Tuesday, Dec. 4, to facilitate the enrollment of high school students in both on and off-campus courses.
Objective 2: Increase the education-related experiences available to the public
Action 1: Increase education-related entertainment and service events. Action 2: Increase attendance at University cultural, entertainment, arts, and athletic programming by regional community residents. Action 3: Increase activities of alumni in University events (e.g., dynamic alumni events calendar, alumni members of the KU ambassadors’ initiative). Benchmark: Increased attendance at University education-related events (e.g.,
cultural, arts, athletics, lectures, demonstrations). ASSESSMENT
o Source: PASSHE Economic Development Survey.
Community College 2015 2016 2017 2018Bucks County 35 20 28 34Harrisburg Area 23 18 24 21Philadelphia County 4 8 4 7Lehigh-Carbon County 84 82 114 115Luzerne County 11 4 5 7Montgomery County 49 50 45 44Northampton County 76 94 87 73Reading Area 48 53 48 70
10

2015-16: Outside attendance at ticketed events = 5,200 2016-17: Outside attendance at ticketed events = 5,950
Benchmark: Increased alumni participation in University events.
ASSESSMENT
o Over the past three years, alumni engagement and participation in University events has increased by 25%, with the most notable increases in homecoming events (77% increase) and 50th class events (105% increase).
Objective 3: Increase the participation of members of the University community in the wider community
Action 1: Increase service-learning experiences and community service opportunities. Action 2: Develop programs that encourage students to demonstrate good citizenship and social responsibility. Action 3: Increase the number of hours of community engagement of students, faculty, and staff. Action 4: Increase the number of community academic partnerships. Benchmark: Obtain Carnegie School of Engagement Classification.
A high level inventory of community engagement efforts has been completed.
Individuals are being identified who can help us move forward on
attaining Carnegie classification status.
Benchmark: Increased number of participants in service-learning experiences and community service. ASSESSMENT
o Source: PASSHE Economic Development Survey. 2015-16: student service hours = 33,301; staff service hours
= 266. 2016-17: student service hours = 30,100; staff service hours
= 200.
Goal 3: Kutztown University will value and respect all campus constituents, celebrate diversity, and embrace shared governance.
11

Objective 1: Mirror the diversity of the region within the campus community
Action 1: Increase the diversity of the faculty through establishing fellowships and programs that bring faculty from diverse backgrounds to campus for extended periods. Action 2: Increase the diversity of the student body, faculty, and staff by strengthening multi-cultural programming. Action 3: Increase the diversity of the student body by developing enhanced programs to recruit veterans and military personnel and serve their unique needs. Action 4: Increase the diversity of the student body by developing special programs to support female students in STEM areas. Action 5: Increase the internationalization of the campus community. Benchmark: Increased diversity of student body, faculty, and staff.
We will expand our efforts to recruit in urban areas and offer scholarship
opportunities for high achieving students of diverse backgrounds.
We will continue to devote resources to sponsor the Frederick Douglas Institute Visiting Scholars Program.
Joint university/community committee in place to discuss ways to support
diverse populations in the community.
Regularly meet with many constituencies on campus to discuss this initiative.
Sponsored nationally known speakers of diverse views to campus for
speeches and other programs.
ASSESSMENT o We have increased our overall diversity from 19% in fall 2016 to
21% for fall 2017 and our freshmen class cohort from 19% in fall 2016 to nearly 26% for fall 2017. This places us among the more diverse universities in the state system.
o A pilot overnight visit program for admitted students from diverse backgrounds occurred in the spring 2017 semester. The program resulted in approximately 70% (n=36) of the participants submitting a deposit to enroll at KU. The average GPA and SAT scores of program participants was higher than the incoming freshmen class averages.
o $90,000 was allocated for an FDI Faculty Fellowship in October 2016 through the Strategic Initiative Request process. The FDI account
12
gets a base budget of $10,458 each year.
Benchmark: Increased number of veterans in the student body. ASSESSMENT
o Source: fall freeze. 2016 = 203 2017 = 190 2018 = 183
Benchmark: Increased number of female students in STEM disciplines.
ASSESSMENT
o Source: fall freeze. 2016 = 560 2017 = 548 2018 = 623
Benchmark: Increased number of international students.
Established an advisory committee of international faculty and have
received invaluable advice.
o This committee did not meet in 2017-2018, but will attempt to reconvene in 2018-2019 to gather input.
We have joined a State System consortium that will assist us in recruiting in India.
o We signed an articulation agreement with Symbiosis College of Arts and Commerce. We are targeting for fall 2019 admissions in one of the 3 integrated degree programs within the agreement.
o In discussion with Stonehill College, a private secondary school in India, about online courses that would be part of a dual credit agreement.
Revised tuition reduction for international students (150% of in-state
tuition).
o In 2017-2018 received approval to offer the following academic merit scholarships to eligible incoming international students;
13
President’s Academic Honors Scholarship; KU Stem, Sesquicentennial Academic Honors Scholarship.
o We are proposing an amendment to the existing structure of international student tuition waivers. At this time, we are awaiting a decision from the President and Cabinet.
Signed an agreement with American Honors, a selective honors program
offered at community colleges across the U.S. International students represent a sizable percentage of the American Honors population.
o As of 2017-2018, we have yet to benefit from the AH agreement despite our outreach to the community college network.
ASSESSMENT o International enrollment increased from 69 students in fall 2016
to 77 students in fall 2017. Enrollment is expected to be flat for fall 2018.
Benchmark: Increased number of students participating in study abroad
opportunities. ASSESSMENT
o Student Abroad headcount has increased significantly for the 2018-2019 academic year. Fall studies have increased from 1 to 15, Spring 5 to 9 (applied) and Winter from 14 to 20 (applied).
o Implemented Terra Dotta - provides a robust searchable database of study abroad programs.
o Improved Financial Aid Process – financial aid is now permitted to
work with any approved program, not just exchange, faculty-led, or affiliated programs.
o Offered weekly information sessions – previously had students make
appointments; now they can walk-in for weekly information sessions to get an overview.
o Consistently staffed information table in MSU two times a month.
o Held two study abroad fairs – previously had a fall fair; this has not
been practice since the 2013-2014 academic year.
Objective 2: Encourage high levels of participation in University governance
14

Action 1: Foster an environment in which all constituents have an equal opportunity to participate in the process of shared governance. Action 2: Work with student leaders on establishing a “student bill of rights.”
Benchmark: Completion of a “student bill of rights”
Student government has authored a comprehensive Student Bill of Rights.
COMPLETED
Benchmark: Increased campus participation in University governance.
President’s Faculty advisory group established. Provost Faculty advisory group established. Marketing Faculty & Staff advisory group established. Human Resources advisory group established. International Programs Faculty advisory group established. President’s & First Lady Town & Gown Councils established.
Objective 3: Ensure a campus culture that respects all campus constituents
Action 1: Develop a welcoming and service-oriented culture for students’ families and support networks, as well as members of the community, who visit our campus. Action 2: Develop a service-oriented culture for students. Benchmark: The Quality of Interactions and Supportive Environment items on
the National Survey of Student Engagement (NSSE) will exceed our State System peers by fall 2017. ASSESSMENT
o First-year students rated their quality of interaction/peer comparison (Scale 1-Poor, 7-Excellent).
• Students – 5.2/5.3 • Academic Advisors – 5.0/5.0 • Faculty – 5.2/5.3 • Student Services – 5.0/5.0 • Administrative Staff & Offices – 5.0/4.9
o Senior-year students rated their quality of interaction/peer
comparison.
• Students – 5.5/5.5
15

• Academic Advisors – 5.3/5.2 • Faculty – 5.7/5.5 • Student Services – 4.9/4.8 • Administrative Staff & Offices – 4.9/4.8
Benchmark: Achieve level 4 on customer satisfaction of “Secret Shopper”
evaluations. Secret Shopper evaluations have been discontinued.
Goal 4: Kutztown University will maintain and enhance physical, financial, and human resources necessary to fulfill its mission.
Objective 1: Enhance the University’s human resources to better support the academic mission
Action 1: Enhance the quality of the University’s workplace experience by providing improved communication and employee engagement. Action 2: Conduct 360-degree administrator evaluations. Action 3: Conduct regular Presidential visits to all units and constituencies on campus by May 2016. Action 4: Establish roundtable/advisory groups. Action 5: Conduct regular Presidential meetings with faculty and employee governance leaders and groups as well as student leaders and groups. Benchmark: Achieve results equal to or exceed Carnegie Classification for peers
by 2019 on the “Overall Great Colleges to Work” survey. ASSESSMENT
o Great Colleges to Work For survey was not conducted in 2018 in favor of the campus climate survey. The University will again conduct the Great Colleges to Work For survey in 2019. An assessment of satisfaction results from 2016 and 2019 will be conducted.
Benchmark: 75% of employees will be “highly satisfied” or “satisfied” with their jobs at the University, based on a campus climate survey conducted in 2018. ASSESSMENT
16
o The University did conduct the CECE Campus Climate survey for all Faculty, Staff and Students in spring 2018. Data results were provided in early fall 2018. These reports did not include benchmarking data, which was subsequently requested. Upon receipt of the benchmarking data, the Campus Climate Committee will conduct a full review of the results.
Objective 2: Enhance the financial resources of the University to better support the academic mission
Action 1: Ensure all spending is essential and based on the University’s planning and budgeting process. Action 2: Reprioritize the budget to fund new initiatives resulting from the University’s planning process. Action 3: Initiate major capital campaign. Action 4: Increase private giving through established and new fundraising sources and improved alumni support. Action 5: Increase corporate giving. Action 6: Ensure that colleges and divisions develop fundraising plans and initiatives. Action 7: Achieve a balanced University budget without the use of non-recurring funds. Action 8: Identify new sources of financial aid for students enrolled at the University. Action 9: Engage in a fundraising initiative to raise funds to support student scholarships. Action 10: Identify new sources of financial aid to be used to recruit freshman and transfer students. Action 11: Increase work opportunities for students on campus. Action 12: Identify strategies to reduce student indebtedness. Benchmark: The University’s Return on Physical Assets key performance
indicator results will be maintained in the top 20% among all State System peers throughout the period of the Strategic Plan. ASSESSMENT
17

o Due to budgetary reasons, the University’s return on physical asset performance indicator has declined over the past two years. While still maintaining strong performance, the University’s results are no longer among the top 20%.
Benchmark: The University will reverse the decline in its composite financial index results and will achieve results comparable to the top one-third of State System institutions by 2018. ASSESSMENT
o Due to recent budgetary changes, this benchmark will be attainable in subsequent years.
Benchmark: Private giving will increase an average of 5% annually over the period of the Strategic Plan. ASSESSMENT
o Based on the last three years, we have increased yearly giving over that period 6.578%.
Benchmark: New, permanently restricted gifts will be added to the KU Foundation endowment each year and the investment performance of the endowment fund will meet or exceed benchmarks appropriate to the fund’s asset allocation.
Objective 3: Enhance the physical facilities to better support the University’s academic
mission Action 1: Renovate classrooms and faculty offices in Lytle Hall and DeFrancesco Building. Action 2: Replenish campus computers. Action 3: Initiate the library master plan. Benchmark: Improved classrooms and faculty offices in Lytle Hall and
DeFrancesco Building.
Benchmark: Complete computer replenishment.
18
Academic Assessment Report This is the first annual academic assessment report for Kutztown University, which includes data about assessment activities of academic major programs during the 2017-18 academic year. The data were collected in summer 2018 by the Academic Assessment Council. The Council was formed by the Provost in May 2018, to increase commitment and support of assessment efforts in Academic Affairs. This increase is partly due to the Middle States Commission on Higher Education ruling “To warn the institution that its accreditation may be in jeopardy because of insufficient evidence that the institution is currently in compliance with Standard V (Educational Effectiveness Assessment).” The charge of the council: The Academic Assessment Council will facilitate and support academic assessment of student learning outcomes in the context of the curriculum, including undergraduate and graduate degree programs, and general education. In this role, the Council will:
• Develop and implement procedures for annual program student learning outcome assessments and support the use of these annual assessments in 5-year program reviews
• Review program student learning outcome assessment plans and provide feedback on their efficacy and appropriateness
• Ensure that student learning outcomes developed by programs are in alignment with the University mission and are used for continuous improvement
• Prepare an annual report for the Provost and Vice President for Academic Affairs on the state of program student learning outcome assessments and share the findings with the campus community
• Facilitate conversations with stakeholders about assessment results The Council collected annual Program Assessment Reports that were submitted to the Dean of each College. Each Dean summarized the Program Assessment Reports into a College report. The Council has developed a cycle of academic assessment that all academic programs will follow beginning in Fall 2018. The Council intends for this cycle to capture and document the academic program assessment activities and improvements that are happening in all of Kutztown University’s academic programs. We plan to assess as many Program Student Learning Outcomes in the 2018-19 academic year as we can. Following that, we will move to a more sustainable cycle, where all Program Student Learning Outcomes will be assessed in a three-year cycle. This report is intended to provide the campus community with an update of the progress, as well as the status of assessment across academic programs as indicated by their annual assessment reports. General Education assessment is conducted by the General Education Assessment Committee (GEAC.) GEAC submits an annual report to the Provost and Vice President for Academic Affairs, and the 2017-18 report was submitted in August 2018. An executive summary of the report is available in Appendix B. In future reports, when Program Student Learning Outcomes are aligned with General Education (Institutional) Student Learning Outcomes, it will be possible for this report to provide a synthesis of the data.
19

Progress Update
Before summer 2018, programs conducted assessment of academic programs using their own methods and timelines. Data were collected using Nuventive’s Tracdat software. This resulted in different processes and timelines varied greatly, and Tracdat was used differently by different programs. The biggest deficit, which was identified by the Middle States Commission on Higher Education during our decennial review: Very few programs documented plans for program improvement based on assessment data. To address this uneven approach to program assessment, the Academic Assessment Council developed a schedule of assessment activities that each academic program will complete in the 2018-19 year, and continue in subsequent years. These activities, when completed, will provide programs the opportunity to complete each step of the assessment cycle in this initial year. To facilitate this process, workshops have been scheduled to provide support and professional development in this area. College Assessment Committees will also provide support for these efforts, and assessment liaisons will be identified for each program, and these faculty, perhaps in conjunction with a department committee, can coordinate assessment efforts and communicate their department’s needs to the College Assessment Committee and Academic Assessment Council. We are working to create a culture of assessment at Kutztown University as one way to ensure that these efforts are sustainable in the long term. During this first year with a defined assessment cycle for Kutztown University, assessment activities will be submitted using templates in Excel or MS Word. The information that is collected will be entered into Nuventive’s Improve software by graduate students trained for this task. By entering the data in this manner, each program’s Improve site will be set up the same way and assessment coordinators/department chairs will be spared some data entry work. The system will also be customized to provide a space to enter the data in a way that works with Kutztown University’s assessment cycle. It is our plan to use this report to document our progress on academic assessment, by showing how many programs have made progress on each part of the assessment cycle. We will highlight successes, and describe specific areas in which we must improve, and provide details about program improvement plans, when possible. It is also our plan to use the 2018-19 Annual Academic Assessment Report to share the plans programs have made to improve student learning based on assessment data analysis.
20

The Assessment Cycle
• Step 1: Develop student learning outcomes or performance outcomes that align with the university’s mission, the university’s institutional student learning outcomes (general education student learning outcomes), and (if applicable) the accreditation requirements of the respective discipline;
• Step 2: Develop and implement methods of assessment involving direct and indirect measures, and create a curriculum map to illustrate which courses help students to achieve particular student learning outcomes;
• Step 3: Determine criteria for success and rubrics; • Step 4: Collect and analyze data; • Step 5: Plan (and execute) improvement actions;
21
The cycle begins again when programs collect assessment data to determine if improvement actions resulted in student improvement.
Assessment Status
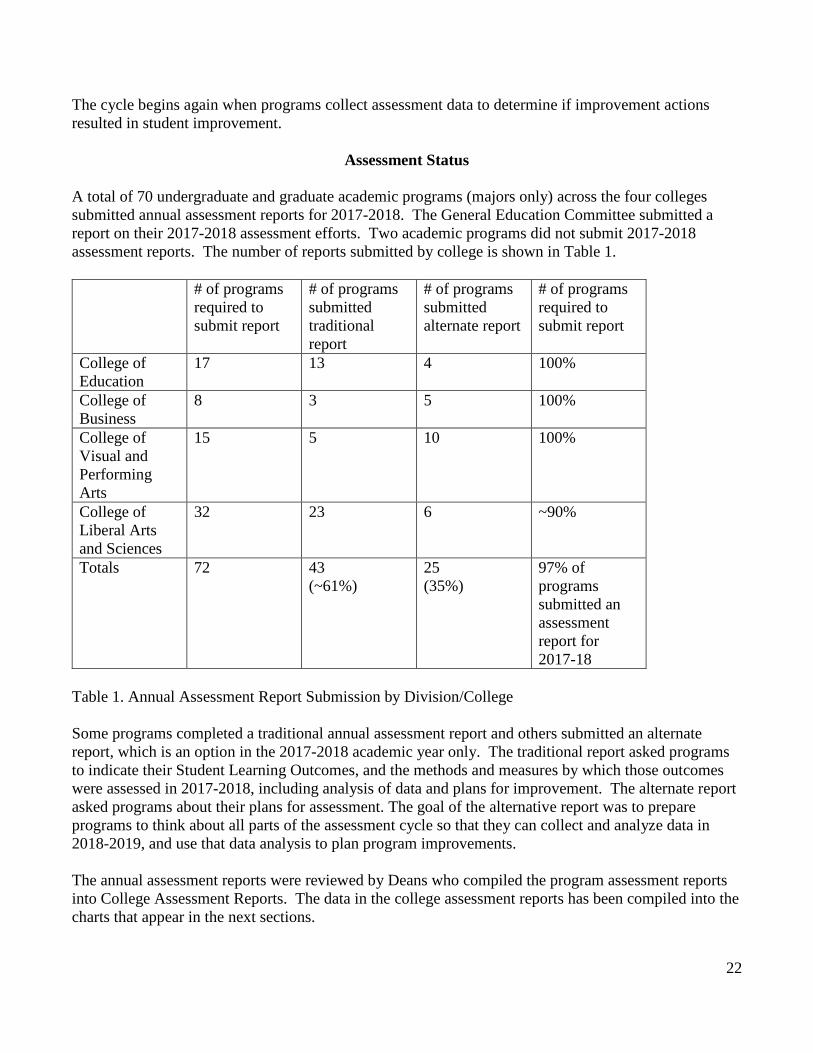
A total of 70 undergraduate and graduate academic programs (majors only) across the four colleges submitted annual assessment reports for 2017-2018. The General Education Committee submitted a report on their 2017-2018 assessment efforts. Two academic programs did not submit 2017-2018 assessment reports. The number of reports submitted by college is shown in Table 1. # of programs
required to submit report
# of programs submitted traditional report
# of programs submitted alternate report
# of programs required to submit report
College of Education
17 13 4 100%
College of Business
8 3 5 100%
College of Visual and Performing Arts
15 5 10 100%
College of Liberal Arts and Sciences
32 23 6 ~90%
Totals 72 43 (~61%)
25 (35%)
97% of programs submitted an assessment report for 2017-18
Table 1. Annual Assessment Report Submission by Division/College Some programs completed a traditional annual assessment report and others submitted an alternate report, which is an option in the 2017-2018 academic year only. The traditional report asked programs to indicate their Student Learning Outcomes, and the methods and measures by which those outcomes were assessed in 2017-2018, including analysis of data and plans for improvement. The alternate report asked programs about their plans for assessment. The goal of the alternative report was to prepare programs to think about all parts of the assessment cycle so that they can collect and analyze data in 2018-2019, and use that data analysis to plan program improvements. The annual assessment reports were reviewed by Deans who compiled the program assessment reports into College Assessment Reports. The data in the college assessment reports has been compiled into the charts that appear in the next sections.
22

Programs were assigned a color, (red, yellow, or green) for each of the five parts of the assessment cycle:
• Define Student Learning Outcomes • Defining Methods and Measures/Curriculum Map • Defining Criteria of Success/Creating Rubrics • Collecting and Analyzing Data • Using Data Analysis to Develop and Execute a Plan for Improvement
Green: the program has successfully completed that part of the assessment cycle, and can move on to the next part. Yellow: some work has been done on this part of the assessment cycle, but must be revised or completed. The amount of work that needs to be done in areas where a two was given varies greatly, but an attempt has been made. Red: the program has done very little or no work on this part of the assessment cycle.
Summary of Assessment Report Data
Table 1. Scores of all programs on progress in assessment areas
23

To reiterate the scoring system: In Table 1, green means that a program has completed that step in a manner that is satisfactory, and the program can move forward to the next part of the cycle. Yellow means that the program has worked on that part of the assessment cycle, but the step is not complete, or revisions are necessary. Red indicates that the program has done little to no work on that step of the cycle.
Step 1: Outcomes
Relative to other steps, we are in fairly good shape now. A majority of programs (66%) have reasonable SLOs, and only a small number (4%) reported no student learning outcomes. AAC has reviewed all SLOs and provided feedback to programs regarding SLOs. The deans’ offices have been involved in reviews of the SLOs, have received the AAC feedback and will guide the revisions. During 2018-19, all programs are being asked to revisit their student learning outcomes and make revisions (or, in the case of three programs, write the outcomes.) During the fall 2018, 100% of programs should have viable, clear, concise, assessable student learning outcomes. Several programs began the revision process in Summer 2018. In many accredited programs, the student learning outcomes are informed by national standards:
• Educator Preparation Programs - National Council for the Accreditation of Education Programs (CAEP)
• Counseling - Council for Accreditation of Counseling & Related Education Programs (CACREP)
• Business Administration - Association of Advance Collegiate Schools of Business (AACSB) • Sports Management - Commission on Sport Management Accreditation (COSMA) • Programs in the College of Visual and Performing Arts - include the National Association of
Schools of Art & Design (NASAD), National Association of Schools of Music (NASAM) • Social Work - Council on Social Work Education (CSWE) • Chemistry - American Chemical Society (ACS)
Of the revisions that are needed for all programs to move to green, rewording for clarity and to including more action verbs are the most prevalent. There will be a workshop held in September 2018 to present best practices in Student Learning Outcome development with faculty to help with the revision process.
Step 2: Methods and Measures By methods and measures, the Academic Assessment Council is referring to methods and measures by which student progress toward achievement of student learning outcomes is assessed. The measures by which outcomes are measured are identified on a curriculum map, which programs use to identify where in the curriculum students are exposed to the program student learning outcomes. The curriculum map can be used to identify where a student learning outcome is introduced, reinforced, and mastered, and assessment methods should take that scaffolding into account by identifying possible measures at each level of understanding before identifying a particular measure to use. Over half of all programs have not completed this step of the process: 14% of programs have not yet developed methods and defined measures, and 41% must make more progress in this area before defining criteria of success, the next step. The main trends needed for improvement include using
24

varying types of assessment and developing a schedule and process that assesses student progress throughout the program. Some programs are assessing only student artifacts that are completed at the end of a program, such as a capstone project or comprehensive exam. It may be necessary to also assess student learning outcomes earlier in the program, to identify issues sooner. Programs also need to identify both direct and indirect measures for assessment. This will be discussed in the curriculum map workshop to be held in late September. Student surveys, self-reflection, or other methods of student self-assessment are valid measures that can be used alongside direct measures like student writing or performance on a standardized test. The workshop will discuss these measures as valued additions to possible assessable measures. As a form of direct assessment, embedded assessment is not mentioned by many programs. This concept, which involves embedding questions related to program learning outcomes in course exams or assignments, will also be discussed at the curriculum map workshop. This form of assessment could be a way to make assessment more manageable and sustainable in the long term. One promising trend is the introduction of signature assignments for program assessment, which several programs are using. These signature assignments are completed by students in different sections of the same course. The assignments are tied to program student learning outcomes, and are assessed for program assessment, in addition to being assessed as a course assignment. Other good examples of assessment methods include a capstone assessment evaluated by mentor teachers and university supervisors in the Secondary Education program, which also uses alumni survey and standardized test data. The Communication Design program has an event during which senior portfolios are reviewed by external evaluators who are professionals in the field, and Biochemistry uses data from a standardized test and a capstone project to assess student progress on student learning outcomes. Business administration uses several measures: a standardized test, group projects, essay questions, and case studies.
Step 3: Criteria of Success Criteria of Success is a crucial step in the assessment process, whereby departments determine the level of student performance that is acceptable and considered an indication that the outcomes have been accomplished. These criteria expand upon the outcome to offer specific details about expectations in that area of the program. Programs have not made enough progress in this area. Roughly 40% have very little work done in this area, and about the same percentage have begun to develop methods and define measures, but have much to do before the data collection phase. Various types of criteria are used across programs. When evaluating student work, a rubric is often used, and the criteria of success involves a percentage of students reaching a particular level of achievement, such as “70% of students should demonstrate competency on the assessment (3 on a 4 point scale.)” Criteria of success for standardized tests involves a minimum test score, and surveys may also use a
25

percentage as a criteria. For example, “75% of students indicate satisfaction with their preparation in classroom management” may be the minimum acceptable response on an alumni survey. Some programs have the advantage of benchmarks or other success criteria defined by a professional association or accrediting body. This is the type of information that should be shared with programs who are not accredited, and would benefit from seeing the level of expectation issued by an accreditor. Only about fifteen KU programs, or roughly 21%, currently have criteria of success sufficient to move on to the next step, data collection. There will be a workshop related to rubrics and other criteria of success in mid-October to help programs determine which type of criteria works best for different measures, and to share examples of those criteria. This is an area where sharing of information across department and colleges will be helpful. Many programs will assess student writing, for example, and may be able to share criteria of success standards.
Step 4: Data Collection and Analysis The Program Academic Assessment Reports indicate that only 19% of programs report getting to this step in 2017-2018. It is important to note that does not mean that 81% of programs are not collecting and analyzing data. It means that 81% are not collecting data regularly, or did not collect and analyze data in 2017-2018. In many cases, some data was collected in spring 2018 and will be analyzed sometime in 2018-2019. The process of collecting data is relatively straightforward for a standardized test or student survey. Collecting student work samples must be planned, and programs may benefit from hearing how other programs collect, store, and anonymize student work in preparation for assessment. Deciding when it is appropriate to assess a sample of student work instead of all student work is also an important concept, which can lessen the amount of time spent on assessment while still providing valid results. A workshop about data collection will be held in early November 2018 and will address these topics.
Step 5: Using Data to Plan for Improvement With respect to this step, we believe that only one program, in 2017-2018, clearly indicated an alignment of assessment results to a specific improvement. However, it should be noted that many programs are making an attempt, and there seems to be some progress in this area. Sometimes the work in this area is not documented properly, or changes are made without data being noted to justify them. In some cases, programs are very small and are unsure what to do with the data that has been gathered. In other programs, no action is deemed necessary because benchmarks are being met. By using a new schedule of assessment, programs will be asked to demonstrate the use of assessment data for program improvement every year, and “meeting benchmarks” will not be a valid assessment of data, because continuous improvement is our goal. We hope that some of these issues can be solved with training, and there will be a workshop offered in January 2019 about what to do with assessment data, and programs will be invited to bring their program assessment data to the workshop. There are several programs who did complete this step of the assessment cycle – using assessment data to plan for improvement – but not during the 2017-2018 academic year, which is the subject of this
26
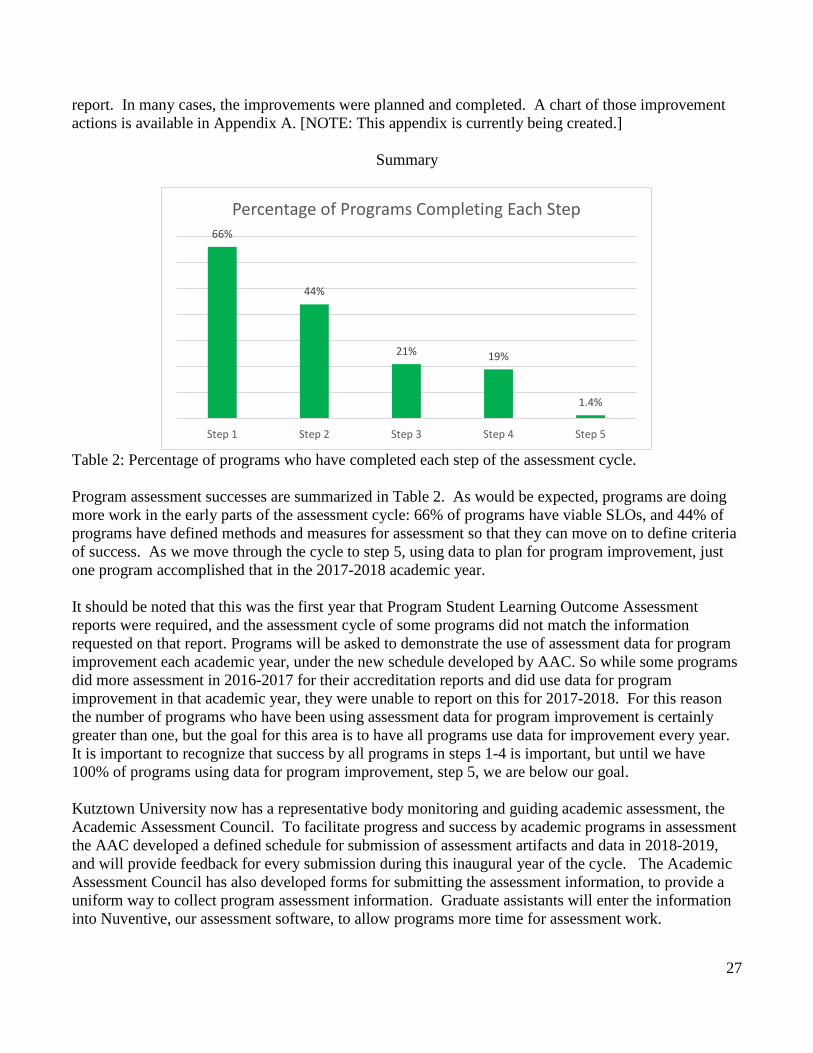
report. In many cases, the improvements were planned and completed. A chart of those improvement actions is available in Appendix A. [NOTE: This appendix is currently being created.]
Summary
Table 2: Percentage of programs who have completed each step of the assessment cycle. Program assessment successes are summarized in Table 2. As would be expected, programs are doing more work in the early parts of the assessment cycle: 66% of programs have viable SLOs, and 44% of programs have defined methods and measures for assessment so that they can move on to define criteria of success. As we move through the cycle to step 5, using data to plan for program improvement, just one program accomplished that in the 2017-2018 academic year. It should be noted that this was the first year that Program Student Learning Outcome Assessment reports were required, and the assessment cycle of some programs did not match the information requested on that report. Programs will be asked to demonstrate the use of assessment data for program improvement each academic year, under the new schedule developed by AAC. So while some programs did more assessment in 2016-2017 for their accreditation reports and did use data for program improvement in that academic year, they were unable to report on this for 2017-2018. For this reason the number of programs who have been using assessment data for program improvement is certainly greater than one, but the goal for this area is to have all programs use data for improvement every year. It is important to recognize that success by all programs in steps 1-4 is important, but until we have 100% of programs using data for program improvement, step 5, we are below our goal. Kutztown University now has a representative body monitoring and guiding academic assessment, the Academic Assessment Council. To facilitate progress and success by academic programs in assessment the AAC developed a defined schedule for submission of assessment artifacts and data in 2018-2019, and will provide feedback for every submission during this inaugural year of the cycle. The Academic Assessment Council has also developed forms for submitting the assessment information, to provide a uniform way to collect program assessment information. Graduate assistants will enter the information into Nuventive, our assessment software, to allow programs more time for assessment work.
66%
44%
21% 19%
1.4%
Step 1 Step 2 Step 3 Step 4 Step 5
Percentage of Programs Completing Each Step
27

This assessment schedule ensures that all programs will complete the assessment cycle, and begin, or continue, using assessment data to plan for improvement. This report is a baseline, and next year we plan to report that most programs are completing the cycle of assessment to improve student learning. During this first year with a defined academic assessment process, we are already seeing some progress. For example, all programs now have articulated Program Student Learning Outcomes. This is the first step in developing a sustainable assessment plan. This is a faculty-driven process, and the administration is working to support the faculty in their work. Workshops are being offered in areas of assessment, and some faculty have attended assessment conferences. Internal evidence suggests that the campus community is moving away from the perception that assessment is an administrative task driven by the accreditation process and toward the idea that assessment is part of the educational process. Developing a campus culture of assessment is our goal, and there is an evident shift in that direction. Academic Assessment Council Denise Bosler, Chair, Communication Design Anne Carroll, Dean, College of Business Gil Clary, Assistant Provost for Academic Administration Mary Eicholtz, Chair, General Education Assessment Committee Michelle Kiec, Dean, College of Visual and Performing Arts Diane King, Associate Professor, Special Education Jonathan Kremser, Chair, Criminal Justice Krista Prock, Interim Director, Office of Assessment Karen Rauch, Associate Dean, College of Liberal Arts and Sciences Gregory Shelley, Chair, Psychology George Sirrakos, Chair, Secondary Education Natalie Snow, Director of Institutional Research John Ward, Dean, College of Education Carole Wells, Vice Provost and Dean of Graduate Studies Appendix A will be a chart of pre 2017-18 improvement actions that were based on assessment. This information will be added before spring 2019.
28
Appendix B – General Education Assessment Committee Summary
Academic Year 2017-2018
EXECUTIVE SUMMARY
• The General Education Assessment Committee is charged with directly assessing student learning outcomes for the KU General Education Program. In the seventh year of its existence, the committee continues the assessment and renewal plan that was developed in accordance with its bylaws with some modification to the original plan.
• This is the General Education Assessment Committee’s sixth annual report, based on the approved assessment plan, which analyzed data from AY2017-2018 relevant to the Critical Thinking and Writing Intensive competencies of the General Education Program.
• Data were gathered using student work samples and evaluated using templates based on the VALUE (Valid Assessment of Undergraduate Education) rubrics created by the Association of American Colleges and Universities and modified by the General Education Assessment Committee. The rubrics or reporting templates were adapted by GEAC to create a common rating scheme for use across disciplines.
• For the assessment, a total of 212 student work samples representing the Critical Thinking competency and 256 student work samples representing the writing intensive competency were collected from students completing their last requirement in each of the competencies. The student samples revealed some strengths and weaknesses in the assessment process as well as the general education program.
• The methodology for the AY 2017 – 2018 used the same methodology piloted in AY 2016 – 2017. Students who were completing their first CT course and third WI course were identified by Institutional Research (IR). Instructors in these courses were notified to send a student work sample from these particular students who had completed their requirements for these competencies to the assessment committee. These work products were evaluated by 28 independent raters.
• Overall, of the 166 faculty who were asked to submit student work, 82 or 48% of the faculty complied and provided 468 pieces of student work between the two competencies. Approximately 37% of the student samples were reviewed and scored.
• Twenty-six faculty volunteers reviewed anonymous student samples against the VALUE rubric. Ten percent of the samples were scored by two raters to evaluate intercoder reliability. Overall, 42% of the two scores were within .5 of each other and 63% of them were within one performance level.
• The average score for the Critical Thinking competency was 2.13 on a scale of 4.0. For the Writing Intensive competency, the average performance level was 2.77.
29
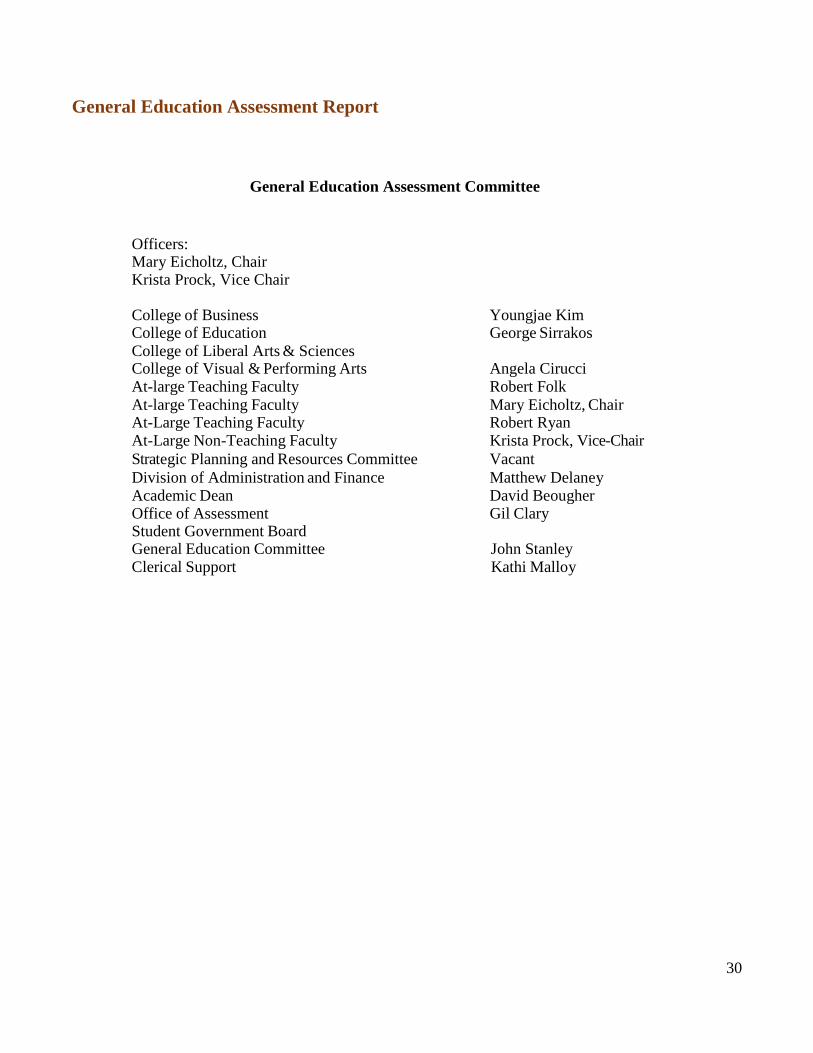
General Education Assessment Report
General Education Assessment Committee
Officers: Mary Eicholtz, Chair Krista Prock, Vice Chair College of Business Youngjae Kim College of Education George Sirrakos College of Liberal Arts & Sciences College of Visual & Performing Arts Angela Cirucci At-large Teaching Faculty Robert Folk At-large Teaching Faculty Mary Eicholtz, Chair At-Large Teaching Faculty Robert Ryan At-Large Non-Teaching Faculty Krista Prock, Vice-Chair Strategic Planning and Resources Committee Vacant Division of Administration and Finance Matthew Delaney Academic Dean David Beougher Office of Assessment Gil Clary Student Government Board General Education Committee John Stanley Clerical Support Kathi Malloy
30

I. INTRODUCTION
The General Education Assessment Committee (GEAC) has been charged with collecting and analyzing assessment data on student learning outcomes emerging from Kutztown University’s General Education Program. The General Education Program consists of three Learning Goals each containing a number of specific domains:
• Goal 1 - To cultivate intellectual and practical skills that are practiced extensively, across the curriculum, in the context of progressively more challenging problems, projects, and standards for performance,
• Goal 2 - To develop an understanding of human cultures and the physical and natural world that is focused by engagement with big questions, both contemporary and enduring, and,
• Goal 3 - To inculcate a sense of personal and social responsibility that is anchored through active involvement with diverse communities and real-world challenges.
The structural components that facilitate achieving the Learning Goals of
this General Education Program include: • The University Core Curriculum, containing 12 credits distributed across four
areas: Oral Communication, Written Communication, Mathematics, and Wellness;
• University Distribution Requirements, containing 15 credits distributed across five areas: Natural Sciences, Written Communication, Social Sciences, Arts, and Free Electives
• Competencies across the Curriculum, thematic courses containing 21 credits distributed across five themes (9 credits in Writing Intensive; 3 credits each in Quantitative Literacy or Computer Intensive; Visual Literacy or Communication Intensive; Cultural Diversity; and Critical Thinking.
Because the program consists of three goals, GEAC rotates through the
goals in a three-year assessment cycle. In the first year, the GEAC evaluated learning outcome data relevant to Goal 1; in the second year, learning outcome data relevant to Goal 2 was evaluated; and in the third year, learning data relevant to Goal 3 was evaluated. Following the completion of the cycle, GEAC spent one academic year evaluating its process and results from the study. As part of the process evaluation, the committee determined that it would be more productive to evaluate two of the University competencies this year. The competencies selected for the 17 – 18 academic year were Critical
Thinking and written communication effectiveness through the Writing Intensive competency.
Each year GEAC is charged with submitting data-informed
recommendations to the Division of Academic and Student Affairs and the University Curriculum Committee. At the conclusion of each three-year cycle, GEAC also submits an additional report to the Division of Academic and Student Affairs and the General Education Committee. The purpose of each annual report is to make recommendations for the allocation of resources to improve the student learning outcomes of the General Education Program, as well as the General Education Assessment process. The triennial report will also make recommendations on any potential structural changes required to improve the quality and effectiveness of the General Education Program. This will be the last report under the general education assessment plan approved for the general education program implemented in 2011. A new assessment plan has been developed for the 2018 general education program.
II. METHODS
A. The Data Last year, the committee shifted its focus from a course centered unit of
analysis where data from all the students in a course identified as achieving a particular SLO were assessed to a student focused approach, where students’ progress was assessed and the students were the analysis unit. We continued that focus this year and after some minor modifications to the methodology used in 17 – 18, we once again asked faculty to submit student work samples.
Two of the five competencies that are part of the general education
program are Writing Intensive and Critical Thinking. GEAC wanted to know if students were achieving SLOs aligned with the competencies by the time they completed their required number of competency courses. Each student must complete one CT course and three WI courses. Institutional Research (IR) was asked to identify each student who was completing their required CT course requirement for general education in the Spring 2018 semester along with their instructor and course. Additionally, IR identified students in their third WI class during the spring 2018 semester. Their efforts produced two spreadsheets with a potential of 715 potential student work samples from 99 faculty
32
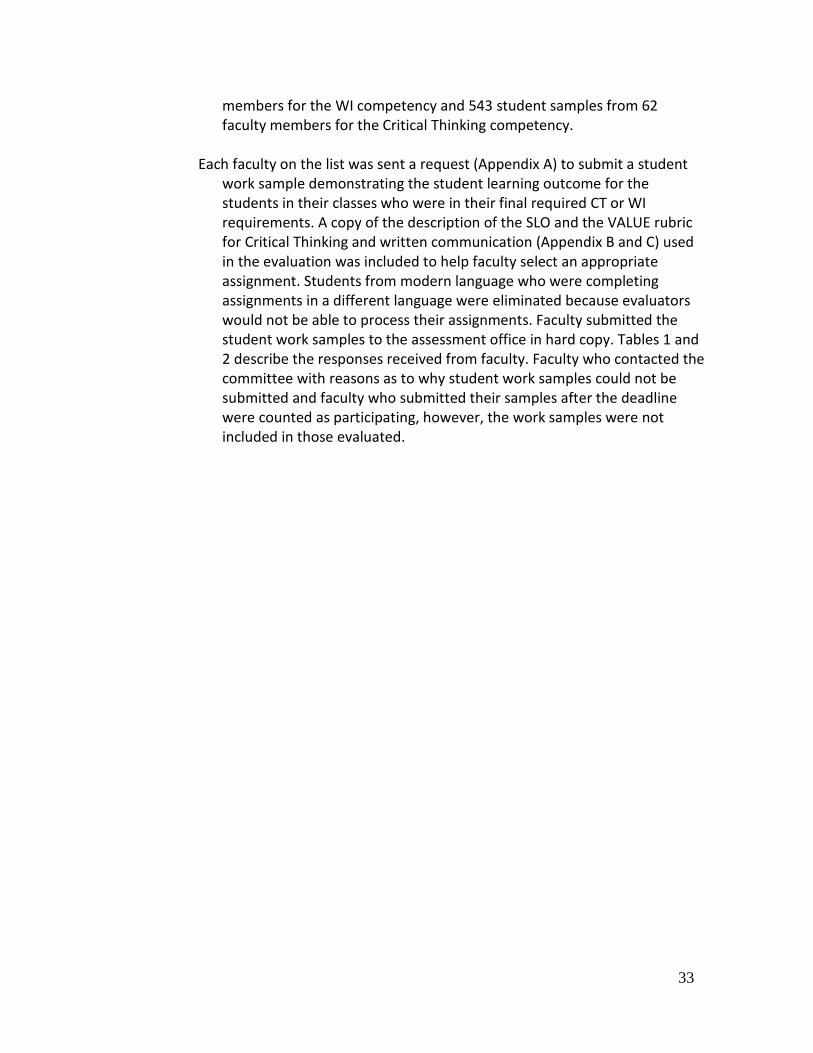
members for the WI competency and 543 student samples from 62 faculty members for the Critical Thinking competency.
Each faculty on the list was sent a request (Appendix A) to submit a student
work sample demonstrating the student learning outcome for the students in their classes who were in their final required CT or WI requirements. A copy of the description of the SLO and the VALUE rubric for Critical Thinking and written communication (Appendix B and C) used in the evaluation was included to help faculty select an appropriate assignment. Students from modern language who were completing assignments in a different language were eliminated because evaluators would not be able to process their assignments. Faculty submitted the student work samples to the assessment office in hard copy. Tables 1 and 2 describe the responses received from faculty. Faculty who contacted the committee with reasons as to why student work samples could not be submitted and faculty who submitted their samples after the deadline were counted as participating, however, the work samples were not included in those evaluated.
33

Department # Fac req'ed
# Fac sub'ing
% Fac Comply
# stud samples sub'ed
# samples excused
#samples sub'ed but not used
Unsub'ed req'ed samples
Total number of samples
Anthro/Soc 2 0 0% 0 0 0 3 3 Art Education 1 1 100% 1 0 0 0 1 Art History 3 1 33% 15 5 0 6 26 Biology 1 0 0% 0 0 0 13 13 Business Administration 3 0 0% 0 0 0 18 18 Communication Design 3 0 0% 0 0 0 10 10 Communication Studies 5 3 60% 2 2 0 12 16 Computer Science 2 2 100% 11 0 18 0 29 Cinema, TV, Media 1 1 100% 11 4 0 0 15 Elementary Education 1 0 0% 0 0 0 2 2 English 15 6 40% 11 11 5 44 71 Geography 1 1 100% 1 0 0 0 1 History 3 1 33% 4 3 0 7 14 Music 2 1 50% 65 16 1 38 120 Philosophy 5 4 80% 43 20 6 10 79 Physical Science 2 1 50% 1 1 0 4 6 Political Science 2 1 50% 4 1 1 4 10 Psychology 5 3 60% 4 1 4 2 11 Secondary Education 1 0 0% 0 0 0 23 23 Social Work 7 2 29% 20 7 1 42 70 Special Education 1 1 100% 0 0 0 0 0 Sport Management 1 1 100% 4 0 1 0 5 TOTAL 67 30 45% 197 71 37 238 543
Table 1: Faculty Requests and Submissions for Critical Thinking – Part 1
Assessment Data
34

Department # Fac req'ed
# Fac sub'ing
% Fac Comply
# stud samples sub'ed
# samples excused
#samples sub'ed but not used
Unsub'ed req'ed samples
Total number of samples
College of Business Business Administration 3 0 0% 0 0 0 18 18 Sport Management 1 1 100% 4 0 1 0 5 TOTAL 4 1 25% 4 0 1 18 23 College of Education Elementary Education 1 0 0% 0 0 0 2 2 Secondary Education 1 0 0% 0 0 0 23 23 Special Education 1 1 100% 0 0 0 0 0 TOTAL 3 1 33% 0 0 0 25 25 Liberal Arts & Sciences Anthro/Soc 2 0 0% 0 0 0 3 3 Biology 1 0 0% 0 0 0 13 13 Computer Science 2 2 100% 11 0 18 0 29 English 15 6 40% 11 11 5 44 71 Geography 1 1 100% 1 0 0 0 1 History 3 1 33% 4 3 0 7 14 Philosophy 5 4 80% 43 20 6 10 79 Physical Science 2 1 50% 1 1 0 4 6 Political Science 2 1 50% 4 1 1 4 10 Psychology 5 3 60% 4 1 4 2 11 Social Work 7 2 29% 20 7 1 42 70 TOTAL 45 21 47% 99 44 35 129 307 Visual & Performing Arts Art Education 1 1 100% 1 0 0 0 1 Art History 3 1 33% 15 5 0 6 26 Communication Design 3 0 0% 0 0 0 10 10 Communication Studies 5 3 60% 2 2 0 12 16 Cinema, TV, Media 1 1 100% 11 4 0 0 15 Music 2 1 50% 65 16 1 38 120 TOTAL 15 7 47% 94 27 1 66 188
Table 1: Faculty Requests and Submissions for Critical Thinking Competency – Part 2 Assessment Data
35
# Fac req'ed
# Fac sub'ing
% Fac Comply
# stud samples sub'ed
# samples excused
#samples sub'ed but not used
Unsubmitted requ'ed samples
Total number of samples
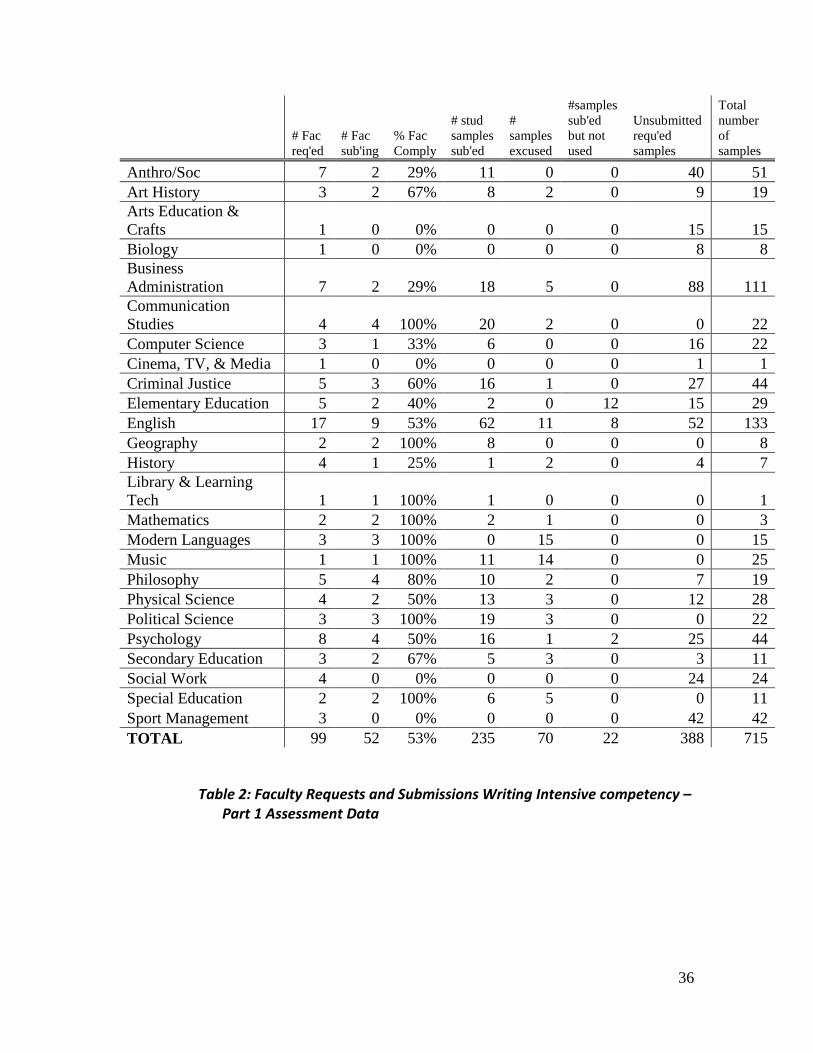
Anthro/Soc 7 2 29% 11 0 0 40 51 Art History 3 2 67% 8 2 0 9 19 Arts Education & Crafts 1 0 0% 0 0 0 15 15 Biology 1 0 0% 0 0 0 8 8 Business Administration 7 2 29% 18 5 0 88 111 Communication Studies 4 4 100% 20 2 0 0 22 Computer Science 3 1 33% 6 0 0 16 22 Cinema, TV, & Media 1 0 0% 0 0 0 1 1 Criminal Justice 5 3 60% 16 1 0 27 44 Elementary Education 5 2 40% 2 0 12 15 29 English 17 9 53% 62 11 8 52 133 Geography 2 2 100% 8 0 0 0 8 History 4 1 25% 1 2 0 4 7 Library & Learning Tech 1 1 100% 1 0 0 0 1 Mathematics 2 2 100% 2 1 0 0 3 Modern Languages 3 3 100% 0 15 0 0 15 Music 1 1 100% 11 14 0 0 25 Philosophy 5 4 80% 10 2 0 7 19 Physical Science 4 2 50% 13 3 0 12 28 Political Science 3 3 100% 19 3 0 0 22 Psychology 8 4 50% 16 1 2 25 44 Secondary Education 3 2 67% 5 3 0 3 11 Social Work 4 0 0% 0 0 0 24 24 Special Education 2 2 100% 6 5 0 0 11 Sport Management 3 0 0% 0 0 0 42 42 TOTAL 99 52 53% 235 70 22 388 715
Table 2: Faculty Requests and Submissions Writing Intensive competency – Part 1 Assessment Data
36
# Fac req'ed
# Fac sub'ing
% Fac Comply
# stud samples sub'ed
# samples excused
#samples sub'ed but not used
Unsubmitted requ'ed samples
Total number of samples
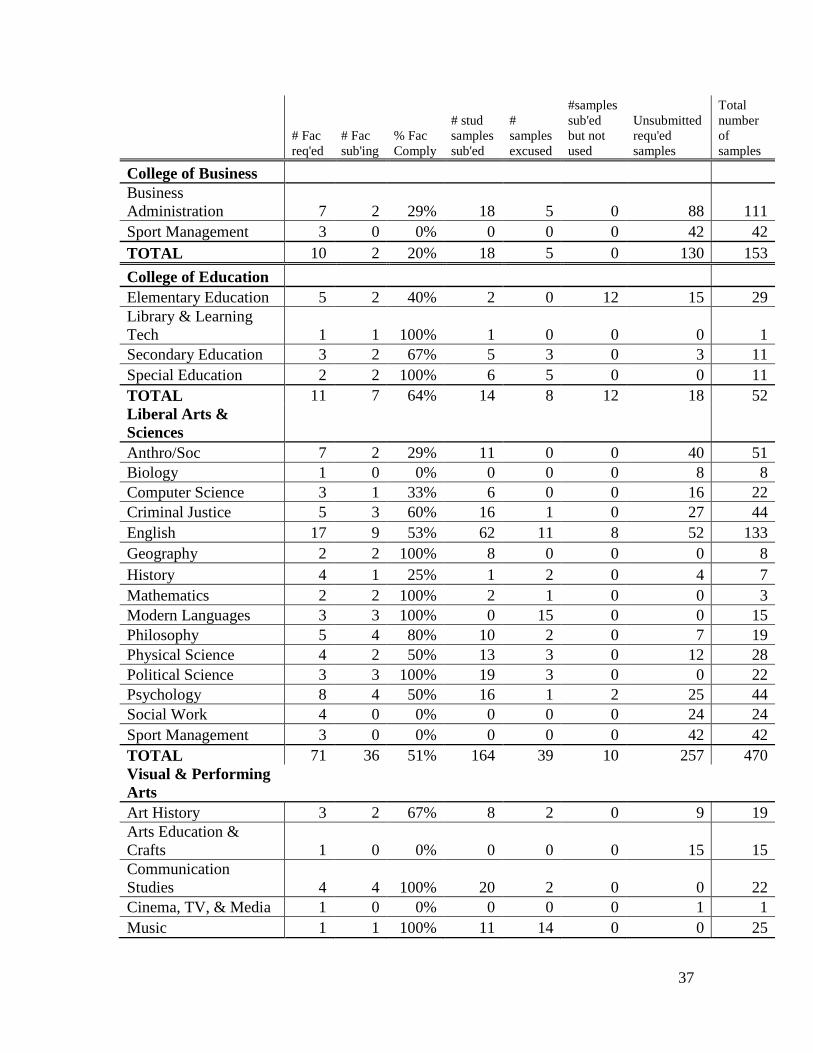
College of Business Business Administration 7 2 29% 18 5 0 88 111 Sport Management 3 0 0% 0 0 0 42 42 TOTAL 10 2 20% 18 5 0 130 153 College of Education Elementary Education 5 2 40% 2 0 12 15 29 Library & Learning Tech 1 1 100% 1 0 0 0 1 Secondary Education 3 2 67% 5 3 0 3 11 Special Education 2 2 100% 6 5 0 0 11 TOTAL 11 7 64% 14 8 12 18 52 Liberal Arts & Sciences Anthro/Soc 7 2 29% 11 0 0 40 51 Biology 1 0 0% 0 0 0 8 8 Computer Science 3 1 33% 6 0 0 16 22 Criminal Justice 5 3 60% 16 1 0 27 44 English 17 9 53% 62 11 8 52 133 Geography 2 2 100% 8 0 0 0 8 History 4 1 25% 1 2 0 4 7 Mathematics 2 2 100% 2 1 0 0 3 Modern Languages 3 3 100% 0 15 0 0 15 Philosophy 5 4 80% 10 2 0 7 19 Physical Science 4 2 50% 13 3 0 12 28 Political Science 3 3 100% 19 3 0 0 22 Psychology 8 4 50% 16 1 2 25 44 Social Work 4 0 0% 0 0 0 24 24 Sport Management 3 0 0% 0 0 0 42 42 TOTAL 71 36 51% 164 39 10 257 470 Visual & Performing Arts Art History 3 2 67% 8 2 0 9 19 Arts Education & Crafts 1 0 0% 0 0 0 15 15 Communication Studies 4 4 100% 20 2 0 0 22 Cinema, TV, & Media 1 0 0% 0 0 0 1 1 Music 1 1 100% 11 14 0 0 25
37

TOTAL 10 7 70% 39 18 0 25 82 Table 2: Faculty Requests and Submissions for Writing Intensive
competency – Part 2 Assessment Data Some faculty did contact GEAC to say they would not be submitting data
because their course did not have an appropriate assignment to measure the SLO. Some simply refused to comply. Some faculty contacted GEAC to report that some students were no longer in their classes.
All student work samples submitted were selected for assessment. The
samples were coded for CT or WI, course level, course prefix, student credits earned, college, and degrees sought. They were randomly distributed to the raters.
B. The Assessors and Process GEAC asked for faculty volunteers to serve as raters. Twenty-six faculty from
across the university volunteered to participate. Each faculty member attended one of four training and norming sessions where the process was explained. The assessors were divided into two groups (Critical Thinking and Writing Intensive) according to their area of study or comfort level in evaluating the student samples. Each group discussed the VALUE rubric in their area and evaluated three student samples as a group to norm or calibrate the rubric. Discussion about what constituted each performance level among the group assured that samples were being evaluated consistently. Following the group calibrations, each assessor was assigned 20-22 student samples to review and score. Ten percent of the student samples were assessed by two assessors. The samples selected to determine intercoder reliability were compared by the assessment coordinator. The consistency between raters is summarized in Chart 1 and Chart 2. Eighteen samples were evaluated twice by Critical Thinking raters. Sixty-one percent of the raters evaluated the same sample within one competency level. Eleven percent of the raters scored the same sample at more than two different competency levels while 28% of the raters had one sample indicated as not enough information or inappropriate information (X). Twenty samples in the writing intensive group were assessed by two raters and 65% of the samples were rated within one competency level.
38
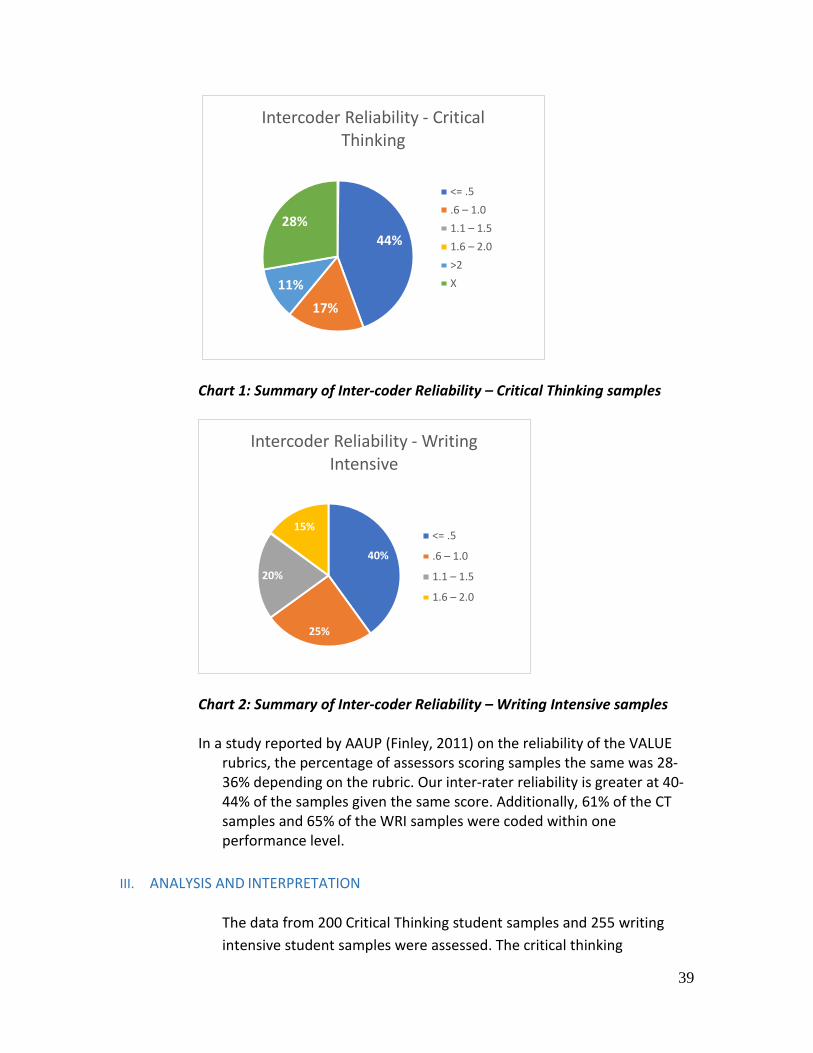
Chart 1: Summary of Inter-coder Reliability – Critical Thinking samples
Chart 2: Summary of Inter-coder Reliability – Writing Intensive samples In a study reported by AAUP (Finley, 2011) on the reliability of the VALUE
rubrics, the percentage of assessors scoring samples the same was 28-36% depending on the rubric. Our inter-rater reliability is greater at 40-44% of the samples given the same score. Additionally, 61% of the CT samples and 65% of the WRI samples were coded within one performance level.
III. ANALYSIS AND INTERPRETATION
The data from 200 Critical Thinking student samples and 255 writing intensive student samples were assessed. The critical thinking
44%
17%11%
28%
Intercoder Reliability - Critical Thinking
<= .5.6 – 1.01.1 – 1.51.6 – 2.0>2X
40%
25%
20%
15%
Intercoder Reliability - Writing Intensive
<= .5
.6 – 1.0
1.1 – 1.5
1.6 – 2.0
39

samples included 16 different course prefixes and 23 different courses from across the University. The writing intensive samples included 23 different course prefixes and 43 different courses. The analysis reveals strengths, as well as areas in which student performance may need to improve. Additionally, concerns about the General Education program were revealed.
A. Critical Thinking Competency
The following results are based on the review of 200 pieces of student work samples submitted by instructors. Students were taking their first CT course in their General Education curriculum. Data were coded for course level, course prefix, college, credits earned, and degree sought. The rubric used for the assessment can be found in Appendix B. Specifically, critical thinking is defined as:
Definition: Critical thinking is a habit of mind characterized by the exploration of issues, artifacts and events before accepting or formulating an opinion or conclusion.
On a scale of one to four, with four being capstone level and one being benchmark level; the overall average score for the Critical Thinking was 2.13. Fifty-nine samples did not have enough information or were inappropriate for evaluation.
Chart/Table 3: Performance Level Frequency of Student Work Samples – Critical Thinking
18
29
56
44
3431
0
10
20
30
40
50
60
4.0 – 3.5 3.4 – 2.5 2.4 – 1.5 1.4 – .5 0 X
Perf
orm
ance
Lev
el
Performance Level
Total # of Samples by Competency Level
Comp. Level 4.0 – 3.5 3.4 – 2.5 2.4 – 1.5 1.4 – .5 0 X 2.13 Avg.
n 18 29 56 44 34 31 212
Key:
4-1 = Levels of performance 0 = Not enough information in the assignment to evaluate X = Submitted assignment inappropriate for Student Learning Outcome
40
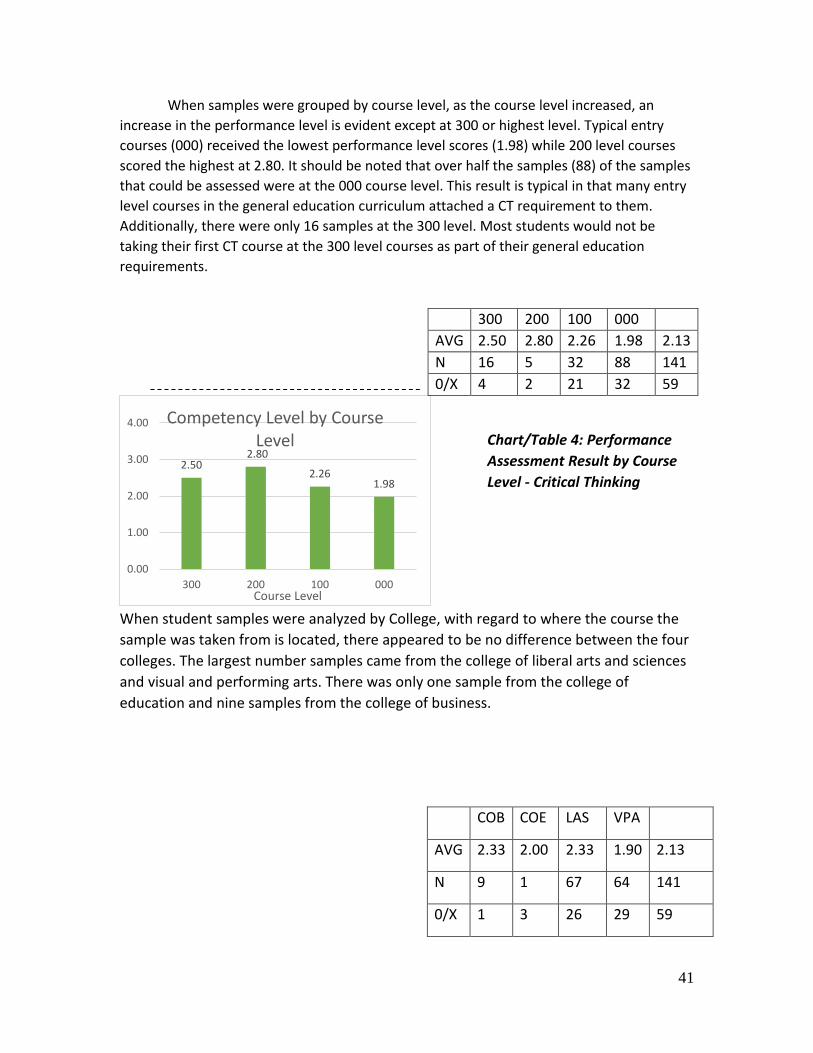
When samples were grouped by course level, as the course level increased, an increase in the performance level is evident except at 300 or highest level. Typical entry courses (000) received the lowest performance level scores (1.98) while 200 level courses scored the highest at 2.80. It should be noted that over half the samples (88) of the samples that could be assessed were at the 000 course level. This result is typical in that many entry level courses in the general education curriculum attached a CT requirement to them. Additionally, there were only 16 samples at the 300 level. Most students would not be taking their first CT course at the 300 level courses as part of their general education requirements.
When student samples were analyzed by College, with regard to where the course the sample was taken from is located, there appeared to be no difference between the four colleges. The largest number samples came from the college of liberal arts and sciences and visual and performing arts. There was only one sample from the college of education and nine samples from the college of business.
2.502.80
2.261.98
0.00
1.00
2.00
3.00
4.00
300 200 100 000Course Level
Competency Level by Course Level
300 200 100 000
AVG 2.50 2.80 2.26 1.98 2.13 N 16 5 32 88 141 0/X 4 2 21 32 59
COB COE LAS VPA
AVG 2.33 2.00 2.33 1.90 2.13
N 9 1 67 64 141
0/X 1 3 26 29 59
Chart/Table 4: Performance Assessment Result by Course Level - Critical Thinking
41

Chart/Table 5: Performance Level by College – Critical Thinking
It was difficult to see a pattern or trend when the data was sorted by course prefix. This inability to make a conclusion may have been the result of a broad definition of critical thinking. Another function of the results may have been due to the number of samples for each of the prefixes.
ARH COM CSC CTM ENG GEG GEL HIS MUS PHI POL PSY SPT SPU SWK
AVG 2.27 1.00
2.00 1.93 4.00 2.33 2.17 1.61 2.49 2.92 2.92 1.89
2.11 2.13 N 12 1
4 10 1 1 4 41 44 4 4 3
12 141
0/X 5 1 12 4 1
20 9
1 1 3 2 59
Chart/Table 6: Performance Level by Course Prefix – Critical Thinking
2.332.00
2.331.90
0.00
1.00
2.00
3.00
4.00
COB COE LAS VPA
Performance
Competency Level by College
2.27
1.00
2.00 1.93
4.00
2.332.17
1.61
2.49
2.92 2.92
1.892.11
0.00
0.50
1.00
1.50
2.00
2.50
3.00
3.50
4.00
ARH COM CSC CTM ENG GEG GEL HIS MUS PHI POL PSY SPT SPU SWK
Course Prefix
Performance Level by Course Prefix
42
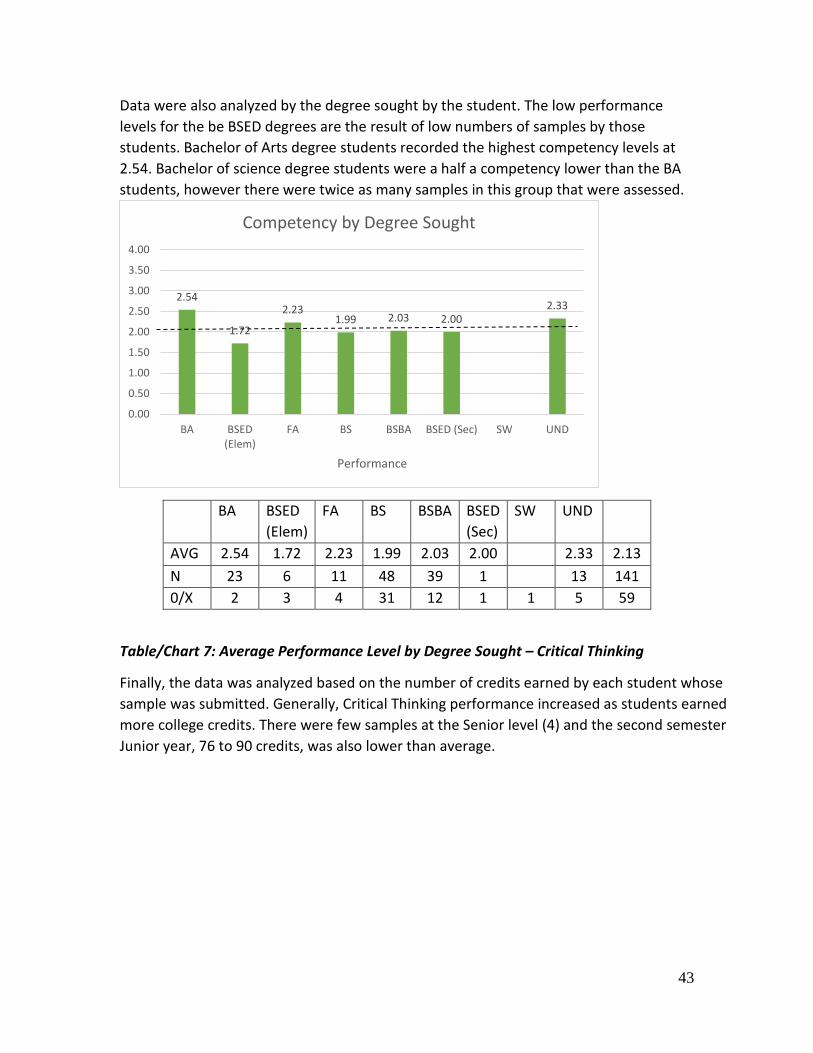
Data were also analyzed by the degree sought by the student. The low performance levels for the be BSED degrees are the result of low numbers of samples by those students. Bachelor of Arts degree students recorded the highest competency levels at 2.54. Bachelor of science degree students were a half a competency lower than the BA students, however there were twice as many samples in this group that were assessed.
BA BSED (Elem)
FA BS BSBA BSED (Sec)
SW UND
AVG 2.54 1.72 2.23 1.99 2.03 2.00
2.33 2.13 N 23 6 11 48 39 1
13 141
0/X 2 3 4 31 12 1 1 5 59
Table/Chart 7: Average Performance Level by Degree Sought – Critical Thinking
Finally, the data was analyzed based on the number of credits earned by each student whose sample was submitted. Generally, Critical Thinking performance increased as students earned more college credits. There were few samples at the Senior level (4) and the second semester Junior year, 76 to 90 credits, was also lower than average.
2.54
1.72
2.231.99 2.03 2.00
2.33
0.00
0.50
1.00
1.50
2.00
2.50
3.00
3.50
4.00
BA BSED(Elem)
FA BS BSBA BSED (Sec) SW UND
Performance
Competency by Degree Sought
43

</=15 16 – 30 31 – 45 46 – 60 61 – 75 76 – 90 91 – 105 106 – 120 >120
AVG 1.95 2.20 2.12 2.16 2.50 1.91 3.00 4.00 2.50 2.13 N 56 23 23 10 16 8 2 1 2 141 0/X 27 10 6 2 4 9
1
59
Table/Chart 8: Average Performance Level by Credits Earned – Critical Thinking
B. Written Communication Results
The following results are based on the review of 255 student work samples submitted by instructors. Students were taking their last required Writing Intensive course in their General Education curriculum. All students are required to take three writing intensive classes to meet their general education requirements. Data were coded for course level, college, course prefix, credits earned, and degree sought. The rubric used for assessment can be found in Appendix C. Specifically, the Written Communication Domain is defined as:
Definition: Written communication is the development and expression of ideas in writing. Written communication involves learning to work in many genres and styles. It can involve working with many different writing technologies, and mixing texts, data, and images. Written communication skills develop through iterative experiences.
1.952.20 2.12 2.16
2.50
1.91
3.00
4.00
2.50
0.00
0.50
1.00
1.50
2.00
2.50
3.00
3.50
4.00
</=15 16 – 30 31 – 45 46 – 60 61 – 75 76 – 90 91 – 105 106 – 120 >120Earned Credits
Performance Level by Earned Credits
44
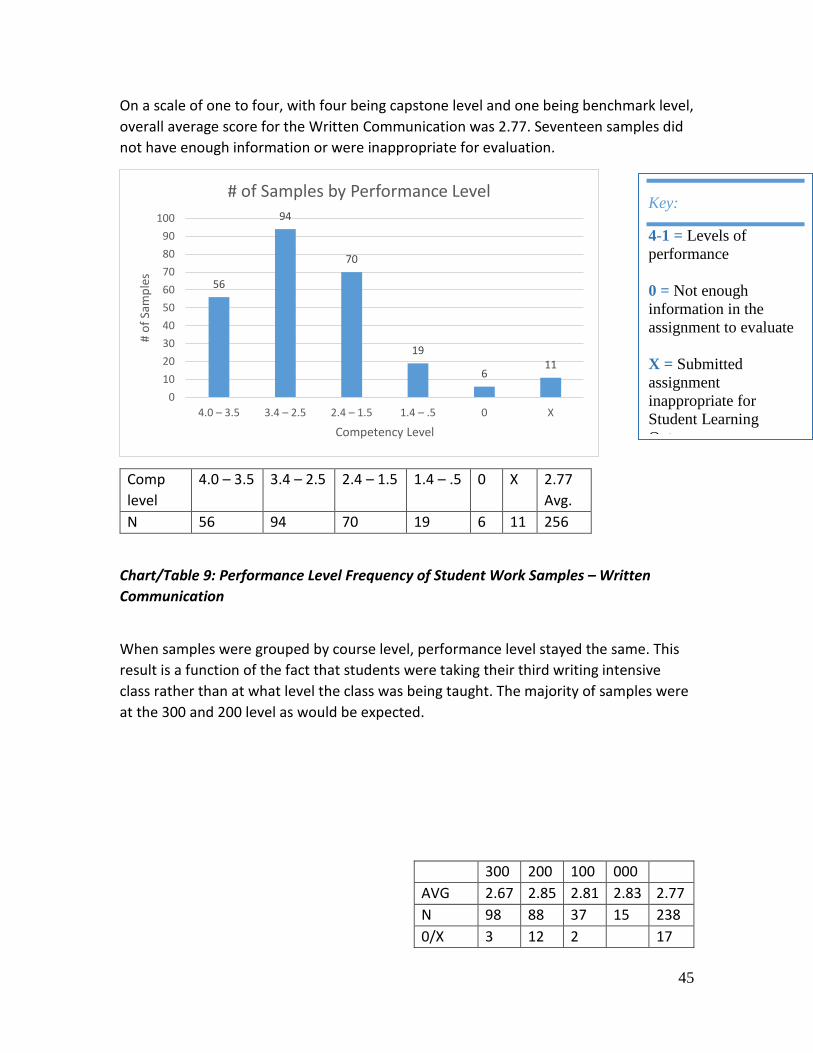
On a scale of one to four, with four being capstone level and one being benchmark level, overall average score for the Written Communication was 2.77. Seventeen samples did not have enough information or were inappropriate for evaluation.
Comp level
4.0 – 3.5 3.4 – 2.5 2.4 – 1.5 1.4 – .5 0 X 2.77 Avg.
N 56 94 70 19 6 11 256
Chart/Table 9: Performance Level Frequency of Student Work Samples – Written Communication
When samples were grouped by course level, performance level stayed the same. This result is a function of the fact that students were taking their third writing intensive class rather than at what level the class was being taught. The majority of samples were at the 300 and 200 level as would be expected.
56
94
70
19
611
0102030405060708090
100
4.0 – 3.5 3.4 – 2.5 2.4 – 1.5 1.4 – .5 0 X
# of
Sam
ples
Competency Level
# of Samples by Performance Level
300 200 100 000
AVG 2.67 2.85 2.81 2.83 2.77 N 98 88 37 15 238 0/X 3 12 2
17
Key:
4-1 = Levels of performance 0 = Not enough information in the assignment to evaluate X = Submitted assignment inappropriate for Student Learning O t
45

When the data for the writing intensive student work samples was evaluated by College, College of Education scored the highest at 3.08. College of Business was assessed at 2.59. The colleges of Liberal arts and sciences and visual and performing arts have the greatest number samples and scored at the overall average of 2.77.
Chart/Table 11: Performance Level by College – Written Communication
When data was analyzed by course prefix in the written communication competency there was no discernible pattern or trend. Again, the results seem to be tied more to the sample size than to the course material.
2.67 2.85 2.81 2.83
0
0.5
1
1.5
2
2.5
3
3.5
4
300 200 100 000
Perf
orm
ance
Lev
el
Course Level
Performance Level by Course Level
2.593.08 2.80 2.74
0
1
2
3
4
COB COE LAS VPA
College
PerformanceLevel by College
COB COE LAS VPA
AVG 2.59 3.08 2.80 2.74 2.77 N 31 13 132 62 238 0/X 2 2 10 3 17
Chart/Table 10: Written Communication Assessment Result by Course Level
46
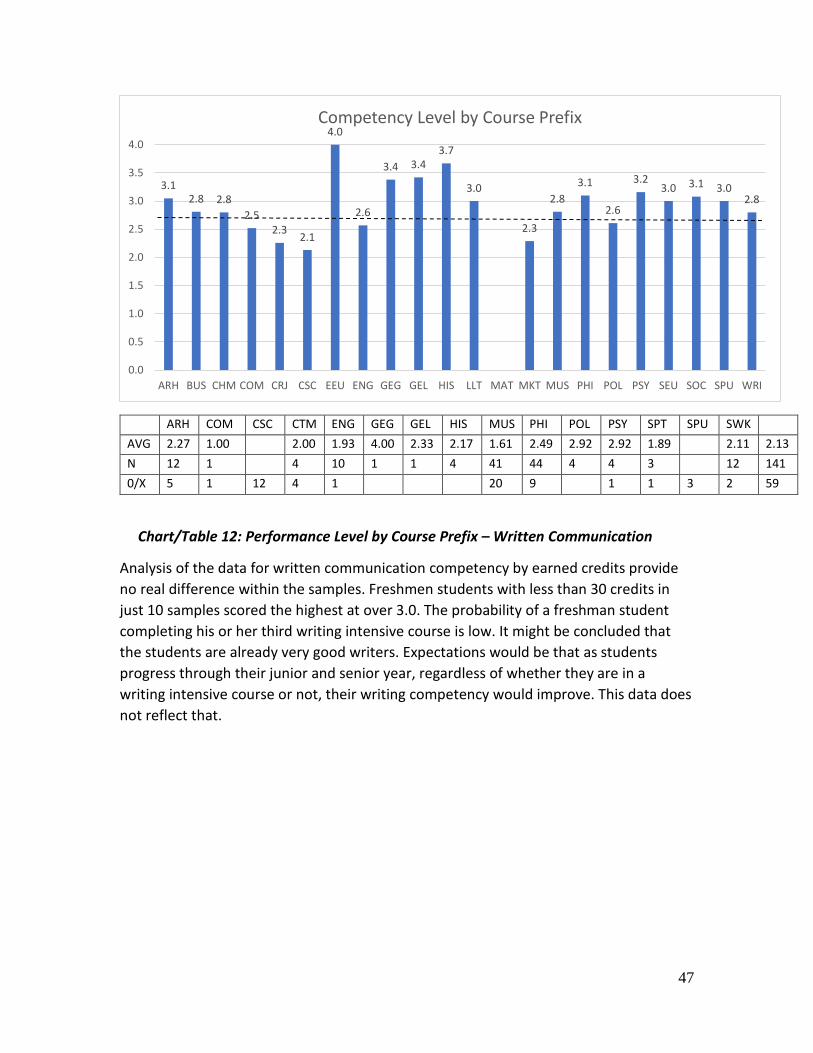
ARH COM CSC CTM ENG GEG GEL HIS MUS PHI POL PSY SPT SPU SWK
AVG 2.27 1.00
2.00 1.93 4.00 2.33 2.17 1.61 2.49 2.92 2.92 1.89
2.11 2.13 N 12 1
4 10 1 1 4 41 44 4 4 3
12 141
0/X 5 1 12 4 1
20 9
1 1 3 2 59
Chart/Table 12: Performance Level by Course Prefix – Written Communication
Analysis of the data for written communication competency by earned credits provide no real difference within the samples. Freshmen students with less than 30 credits in just 10 samples scored the highest at over 3.0. The probability of a freshman student completing his or her third writing intensive course is low. It might be concluded that the students are already very good writers. Expectations would be that as students progress through their junior and senior year, regardless of whether they are in a writing intensive course or not, their writing competency would improve. This data does not reflect that.
3.12.8 2.8
2.52.3 2.1
4.0
2.6
3.4 3.43.7
3.0
2.3
2.83.1
2.6
3.23.0 3.1 3.0
2.8
0.0
0.5
1.0
1.5
2.0
2.5
3.0
3.5
4.0
ARH BUS CHM COM CRJ CSC EEU ENG GEG GEL HIS LLT MAT MKT MUS PHI POL PSY SEU SOC SPU WRI
Competency Level by Course Prefix
47
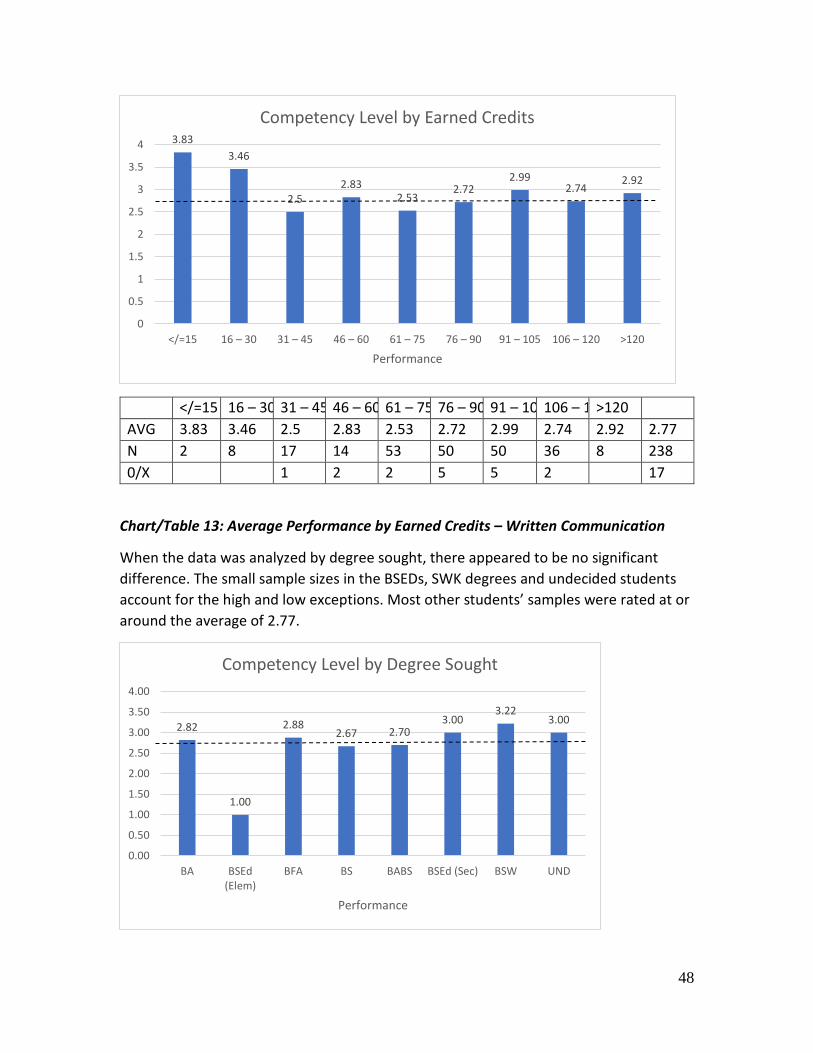
</=15 16 – 30 31 – 45 46 – 60 61 – 75 76 – 90 91 – 10 106 – 1 >120
AVG 3.83 3.46 2.5 2.83 2.53 2.72 2.99 2.74 2.92 2.77 N 2 8 17 14 53 50 50 36 8 238 0/X
1 2 2 5 5 2
17
Chart/Table 13: Average Performance by Earned Credits – Written Communication
When the data was analyzed by degree sought, there appeared to be no significant difference. The small sample sizes in the BSEDs, SWK degrees and undecided students account for the high and low exceptions. Most other students’ samples were rated at or around the average of 2.77.
3.833.46
2.52.83
2.532.72
2.992.74
2.92
0
0.5
1
1.5
2
2.5
3
3.5
4
</=15 16 – 30 31 – 45 46 – 60 61 – 75 76 – 90 91 – 105 106 – 120 >120
Performance
Competency Level by Earned Credits
2.82
1.00
2.882.67 2.70
3.003.22
3.00
0.00
0.50
1.00
1.50
2.00
2.50
3.00
3.50
4.00
BA BSEd(Elem)
BFA BS BABS BSEd (Sec) BSW UND
Performance
Competency Level by Degree Sought
48

BA BSEd
(Elem) BFA BS BABS BSEd
(Sec) BSW UND
AVG 2.82 1.00 2.88 2.67 2.70 3.00 3.22 3.00 2.77 N 85 1 11 96 28 12 3 2 238 0/X 3 2
9 2
1
17
Chart/Table 14: Average Performance by Degree Sought – Written Communication
IV. RECOMMENDATIONS GEAC has organized our recommendations under three headings,
addressing proposed changes to the General Education Program, actions by which we can improve the process by which General Education is assessed at Kutztown University, and the allocation of resources for the continuous improvement of General Education.
Curricular Improvements to the General Education Program
As mentioned at the beginning of this report, this report is the last
assessment of the 2011 general education program. However, both written communication and critical thinking will continue to be assessed in the new program that will be implemented in the fall of 2018. Therefore, some recommendations are relevant and should be considered moving forward.
With regard to content in these categories it appears that within the critical
thinking SLO, there were many interpretations of how to meet that SLO and what is considered critical thinking. As the rubric for this SLO’s assessment has not significantly changed under the new general education program, care should be given to explaining what is expected within the critical thinking SLO. As 59 samples submitted either did not have enough information or the information was inappropriate, nearly 25% of the samples were unable to be assessed. It is evident that faculty have multiple definitions of what critical thinking is, and it does not always align with the general education definition.
The same cannot be said for written communication. There was greater
intercoder reliability, and only 17 samples were either insufficient or inappropriate.
It can’t be expected that students achieve a high level of critical thinking
when only one CT course is required in the general education program. Most of these courses were taken at the freshman and sophomore level.
49

The results of an average competency level of 2.13 is not surprising. The 2018 general education program will require up to six courses attached to the Critical Thinking SLO. This increase should allow us to see an increase in competency level when they have completed all six Critical Thinking courses.
More surprising is the written communication competency. Many of this
students’ samples came from their senior capstone experience course. Expectations would be that students would be a higher competency level than 2.77 after three writing intensive courses. The new general education program includes the addition of a second level composition course. This focus on writing will hopefully increase the competency level average to above 2.77.
Assessment Process As suggested last AY, the GEAC continued the methodology used in AY 16 –
17 to collect data focusing on only two domains, 1.3a Critical Thinking and 1.4a Written Communication. Under the new General Education program, a new assessment plan was also written and approved. The new assessment plan evaluates all eight SLO’s in a rotating fashion over three years.
The methodology for collecting student work samples and asking faculty
volunteers to participate as objective reviewers and scorers was successful and will continue with the new assessment plan implementation with minor adjustments to the process.
We now have benchmarks for critical thinking and written communication
and the new general education assessment of these two areas should be measured against them. Additional benchmarks for the other SLO’s in the new assessment plan should also be established. Defining the criteria for success will allow for better program development. Identifying what percentage of students should be achieving at each performance level will assist in monitoring progress and maintaining excellence.
Benchmark performance levels of all new SLOs should be part of the new
First Year Seminar course. The committee recommends that a sample assignment, which would be
used in the collection of assessment data, be included in the approval process to assure that faculty understand the SLO measure. This additional verification would assure that the number of unusable
50

samples would decrease.
Resource Allocation to Improve General Education To improve compliance by faculty, the committee recommends that a policy
be created that outlines consequences for non-compliance which includes not being available to teach general education courses or removal of the course from the general education program.
Continued support by the administration in terms of faculty resources is
beneficial to the timely completion of general education assessment. Additional resources may be needed as the new general education program is implemented.
Opportunities for debriefing and education of faculty and administration
about the assessment process used and the resulting questions should be supported. Specifically, the General Education and GEAC committees, the assessors, and the faculty who submitted student work samples should be encouraged to participate in discussions that help understand the results and implement improvements. Additional opportunities should then be afforded to the entire faculty so there is an understanding as to how the data is used to make curricular decisions and improve the educational experience for students.
References
Finley, A. (2011). How reliable are the VALUE rubrics? Peer Review (13/14) 4. AACU. Available at: www.aacu.org/publications-research/periodicals/how-reliable-are-value-rubrics.
51

Administrative Units and Programs Assessment Report During 2017-2018, the Implementation Team for Institutional Effectiveness continued to monitor program reviews, processes, and procedures for the University’s administrative units and programs. This is the first annual report, although a number of administrative units have been undergoing formal and informal review for several years. Historical Perspective One result of the 2008 decennial Middle States Self-Study was the creation of the Implementation Team for Institutional Effectiveness in late Fall 2010. The Team consists of representatives from all divisions, and under the direction of the President’s Cabinet, is charged with coordinating institution-wide assessments and submitting findings to the Cabinet. Along with working on assessments of institutional effectiveness, the Team was largely responsible for the 2013 Periodic Review Report. Since the submission of the Periodic Review Report, the Implementation Team has evolved into the campus group that monitors accreditation issues and institutional assessment best practices, and it formed the core of the Steering Committee for the 2018 decennial Middle States Self-Study. Administrative Units and Programs Review Guidelines The Implementation Team incorporated best practices, Middle States Commission on Higher Education recommendations, and State System policies and procedures into a set of guidelines to support the various administrative units in the divisions of Academic Affairs, Administration and Finance, Enrollment Management and Student Affairs, Equity and Compliance, and University Relations and Athletics, to achieve the most encompassing and productive five-year reviews. See Attachment I for the latest iteration of this guide, procedure, and forms. As shown, effort is made to model the academic program review process. Administrative Units and Programs Self-Study and External Review Schedule Currently, 53 administrative units and programs are scheduled for five-year self-study and external reviews (see Attachment II). Prior to 2017-2018, 27 units underwent self-study with eight external reviews. During 2017-2018, one accredited program underwent self-study and external review, three programs went through self-study, and seven programs underwent external review. Feedback from members of the Implementation Team suggest that, in some instances, self-studies and external reviews point to the need for
52

1. understanding the importance of aligning the self-study with established criteria and following the guidelines provided.
2. clarifying unit mission, goals, and objectives, and linking mission to unit activities and program outcomes.
3. using direct assessment measures and less reliance on indirect assessment. 4. identifying assessment plans that are measurable and support program and student
learning outcomes. 5. understanding of and adherence to external review procedures and guidelines. 6. providing better communication with external reviewer(s)/evaluator(s) about
expectations. Having said this, one unit was commended by the Implementation Team for “clear goals/outcomes that have been reviewed/assessed. The office is to be commended for its thoroughness.” In two other instances, one office was praised for a “very nicely written and comprehensive self-study,” and another office for its “resourcefulness, leadership, support of university mission and goals.” Administrative Units and Programs Self-Study and External Review Results Numerous administrative units/programs provided examples of assessment results and outcomes, actions taken, and improved outcomes. Athletics. The Athletics Program external reviewer, Pennsylvania’s State System of Higher Education auditors, and PSAC auditor identified the need for processes to certify academic eligibility (i.e., initial eligibility for freshmen, transfer eligibility, and continuing eligibility). A compliance committee developed an action report and the first components of a University handbook to outline compliance efforts. State System auditors accepted the effort as satisfactory; and, the committee will continue to meet to complete the manual and address protocol. The external reviewer for the Athletics Program also addressed the department budgets and recurring fiscal challenges. A strategic planning committee was formed and a new position, Assistant Vice President for Recreational Services and Athletic Resources, was assigned to the division to assist with the fiscal review process. A tiered sports structure was developed to support a balanced budget while helping the University meet Title IX requirements. This allowed the University to avoid cutting sports, which would impact enrollment, and reduced the amount of additional fiscal support provided to athletics from $500,000 to $160,000. Conduct Program. A new student conduct management system was recommended to be adopted in a previous self-study in order to improve efficiency, enhance student communication, improve records management, and reduce case processing time. Maxient’s Student Conduct Manager was on boarded in 2017 and deployed campus wide for 2017-2018. Implementation of this software resulted in (a.) a reduction in certified mail expenses by 93%; (b.) a reduction in paper consumption by 75%; (c.) a reduction in time spent filing by 40%; (d.) the elimination of paper records; (e.) a reduction in Clery
53

reporting time by 153%; (f.) a reduction in records purge time by 137%; (g.) a 50% reduction in student employee expenses; (h.) an 18% improvement in adjudication time; and, (i.) an overall communication retrieval rate of 82% versus a 65% national average. Financial Aid. Although the Financial Aid Office review was not performed during the time of this report (i.e., 2014-2015), it is important to note that in response to a recommendation that document imaging software be used to chart workflows and as a tool with PeopleSoft, Ivue Intellinetics software was implemented for the 2017 aid year. This enabled charting and improved workflow efficiencies; also, it pointed to the necessity for document management. The Office is now implementing Campus Logic for the 2020 aid year as a document imaging/storage system. Grants and Sponsored Projects. As a result of self-study and external review, the Grants and Sponsored Projects Office reported improved outcomes in three areas; (1.) During the self-study, survey responses from faculty and staff and a SWOT analysis noted that the paper internal routing form for external funding was inconvenient and inefficient. The Office reviewed several electronic-based options and created an electronic version; the form is now completed online and the workflow for all signatures is automatic. The external reviewer indicated that the automated process reduces the paper burden on faculty and staff and the Office of Grants and Sponsored Projects; (2.) Also through the survey, it was noted that the grant application process, requiring an original and seven copies, was inefficient. After reviewing several electronic-based options, the Office has built an automated application process. With over 180 applications received per year, the online version has reduced paper waste and increased the efficiency of the committee; and, (3.) Data from the KU Bringing Experiences About Research in Summer (KU Bears) Program have been positive. In the summer pilot year, ten undergraduate students participated with faculty on research. Because faculty indicated that some students would have applied but could not afford housing, in year two the budget was doubled from $20,000 to $40,000 and free housing was offered. Twenty-six students participated in year 2 and 31 students participated in year 3. Fall 2018 data showed that all students from the three years have persisted to the next year or graduated. Housing. The impact of the co-curricular experience on student success was the impetus for the establishment of a two-year housing requirement for incoming students. During an assessment of housing operations, it was learned that students who lived on campus during their first two years had markedly higher graduation rates. These data supported an institutional policy change enacted in fall of 2017 that all new students were required to live on campus during their first two years of study. The program included exceptions for commuters and other circumstances. An analysis of the impact of this program will be conducted in 2021-2022. Information Technology. In response to self-study and external review, an Assistant Vice President for the Office of Information Technology was hired and a Manager for Cyber Security is being recruited. A department communications plan was implemented along with department restructuring. The department has modernized classroom technology in many areas of the campus (e.g., modernized 65 classrooms from analog to digital;
54
supported implementation of Social Media Hub; implemented 5 new computer labs; replaced University’s storage environment) and is performing RFPs to replace the antiquated telephone system and IT Service Desk in anticipation of IT Service Desk Consolidation. KU Presents! As a result of the KU Presents! external review, the KU Arts Society was publicly launched in September 2018 to seek additional sources of revenue through new fundraising efforts. The long-term goal is that the Society will generate enough funding not only to support “Promoting the Love of Arts for Youth Series” but also will enhance KU Presents! and the arts. Recreational Services. Following the Recreational Services self-study, the department researched cardio and strength equipment trends to best meet the needs of students and other patrons. New equipment was installed during summer 2018 and preventative maintenance was established. Rohrbach Library. In support of Strategic Goal 4 Stewardship of the University’s Infrastructure, the University Writing Center was relocated to the Rohrbach Library’s first floor, creating collaborative partnerships and spaces for our students. Similarly, in support of Strategic Goal 3 Caring Campus Community, the Rohrbach Library budget undergoes an annual review each fall semester to reflect student and faculty instructional and research needs. Budget realignment redirects resources to added streaming videos, e-books, additional laptops for circulation, and miscellaneous resources to satisfy students and faculty demands. University Marketing. Following University Marketing’s external review, a brand refresh was launched in summer 2017, accompanied by a new admissions landing page for the web, branded banners and videos, and a comprehensive advertising campaign that ran from September 2017 through February 2018. These branding efforts were partially credited for the best enrollment figures since 2010; the enrollment at the freeze date of 8,309 students in September 2018 was just 20 students short (0.24% drop) of the 2017 number. It marked the lowest drop in students in eight years (184 student drop, 2.16% in 2017). University Relations. The University Relations external review identified multiple University calendars (i.e., arts, athletics, academics, alumni, student affairs, and conference services calendars). Strategic funding was requested and software purchased for a Master Calendar compatible with the virtual EMS. The review also identified the need for a redesigned website, with admissions given first priority, followed by programs of distinction. Work is continuing through the collaborative efforts of University Marketing, Information Technology, and an outside agency. Extensive research has been conducted with plans to launch a new, responsive site in summer 2019; the primary focus will be student recruitment.
55

Continuous Improvement With the recent adoption of the eight General Education Student Learning Outcomes as Institutional Student Learning Outcomes (see https://www.kutztown.edu/about-ku/mission-vision-and-purpose.htm), State System Policy 1986-04-A: Program Review (see http://www.passhe.edu/inside/policies/BOG_Policies/Policy%201986-04-A.pdf), Procedure 2018-35 Review of Academic Programs and Programs in Support of the Student Experience (see http://www.passhe.edu/inside/policies/Policies_Procedures_Standards/Review%20of%20Academic%20Programs%20and%20Programs%20in%20Support%20of%20the%20Student%20Experience%202018-35.pdf), and collaborations with the Academic Assessment Council and administrative units across divisions, assessment is an evolving and improving process. It is anticipated that 2018-2019 will prove to be a valuable experience for administrative units undergoing self-study and external review. The Implementation Team expects the incorporation and assessment of Institutional Student Learning Outcomes where applicable and an annual assessment update be provided by each unit supervisor to the division vice president. Recommendations Division vice presidents are reminded to (1.) identify and include institutional student learning outcomes in administrative unit goals/initiatives where appropriate; (2.) provide thorough and meaningful feedback to unit supervisors; (3.) assess how results led to interventions and demonstrated improvements and change; and, (4.) use self-study and external review guidelines provided by the Implementation Team to effectively and efficiently navigate the self-study and external review processes. It is also recommended that administrative units/programs engage collaboratively to review their mission statements.
56

ATTACHMENT I Administrative Units and Programs Review Guidelines
Purpose The purpose of this document is to outline the instructions, processes, and standards regarding the review of administrative units and programs at Kutztown University as required in Pennsylvania’s State System Board of Governors Policy 1986-04-A: Program Review. Administrative departments/units are organized areas of the University structured to deliver unique sets of services, support functions, or student learning experiences that support the institutional mission (e.g., student success, infrastructure sustainability, community support). Administrative program reviews generate knowledge about how well programs are supporting the University’s strategic plan and mission. They provide programs with a platform to exercise self-reflection on performance and to identify the strengths and weaknesses that inform future planning. Emphasis should be placed on strengthening the self-evaluation capacity of programs/units so that they can effectively adapt to change and practice continuous improvement. Rationale The purposes of program review are:
1. Assure deliberate and continuous attention to the enhancement of the quality of administrative programs.
2. Provide analyses using quantitative and qualitative data, including student learning outcomes, to assess program sustainability and program effectiveness to contribute to both University and State System planning.
3. Provide the Council of Trustees, Chancellor, Board of Governors, and accrediting bodies including the Middle States Commission on Higher Education with assurance that programs are being assessed in a systematic fashion and that plans for making continuous improvements are developed, implemented, and communicated.
Program Review Process
1. An annual assessment update is to be provided by the administrative unit supervisor to the division vice president.
2. An internal self-study is required every five (5) years. Each vice president, in collaboration with the Implementation Team for Institutional Effectiveness, will determine the schedule of administrative program reviews for the respective division.
3. The unit/program supervisor will meet with the vice president (or designee) to outline the plan for the program review committee, self-study preparation, and review process.
4. The program review committee analyzes the program’s mission fit, outcomes assessment, progress made on the action plan from the previous review, and cost effectiveness.
57

5. The program review committee writes the self-study including an action plan addressing its recommendations. The committee submits the self-study to the department, supervisor, and vice president for review and feedback.
6. If necessary, the self-study will be revised and re-submitted to the vice president for input.
Contents of the Self-Study The goal of these reviews is to recognize program strengths, identify opportunities for improvement, and provide recommendations for improvements or modifications. Results and action plans to implement recommendations will be used in the unit operational planning process and documented in TracDat. The sections of the self-study are outlined in Appendix A: Academic- and Student-Support Program Review Summary Form. External Program Review
1. An external review is required the year following the self-study. 2. The purpose of external review is to garner additional perspectives on program
strengths and weaknesses from individuals in the field, or closely related field, who are affiliated with other institutions. External reviewers have a unique opportunity and obligation to bring an outside perspective to the program review process. They are encouraged to be constructively honest as they (1.) evaluate processes and procedures within the unit/program; (2.) recommend improvements or alternative assessment methods; (3.) evaluate unit/program strengths as well as weaknesses; and, (4.) articulate recommendations for unit/program improvement. According to Board of Governors Policy 1986-04-A, except under special circumstances, external evaluators are to be from outside the State System.
3. The program review committee recommends candidates for external evaluators to the supervisor. The supervisor, in consultation with the vice president, will select up to two external evaluators.
4. The unit will contact the approved recommended individual(s) and make arrangements concerning duties, timeline, and compensation (travel and honorarium).
5. Prior to the visit, the unit will send the external evaluator(s) the program review committee’s self-study report and action plan.
6. Usually a one- or two-day visit by the evaluator(s) is planned. 7. During the campus visit, external evaluator(s) will generally meet with members
of the office along with supervisors, the vice president, and recipients of the office’s services.
8. The opportunity for structured as well as unstructured meetings with department members should be planned for the external evaluator(s).
The external reviewer(s) written report should be submitted within one to two months of the visit and should provide the following information:
58

1. In what way did the self-study documentation provide the necessary context to complete the program review?
2. Were department/unit/program mission, goals, and objectives appropriate? How did they support the University strategic plan?
3. How were previous self-study recommendations addressed? 4. Are the resources available to support this function adequate and appropriate? 5. Are assessment processes appropriate? Do they contribute to measuring program
effectiveness and supporting a cycle of continuous improvement? Do they inform program planning?
6. Are the internal program review recommendations appropriate for achieving goals?
7. What are recommendations resulting from this review? Function of Implementation Team for Institutional Effectiveness The Implementation Team for Institutional Effectiveness is tasked by the President and Cabinet with overseeing and implementing administrative units and program reviews. The Team is to:
1. review the self-study reports. See Appendix B: Academic- and Student-Support Program Review Evaluation Sheet for the rubric used by the Team. Include the external review report in the evaluation.
2. endorse program action plans for improvement. 3. recommend completed program self-studies/external reviews to the Cabinet for
final acceptance and approval.
59
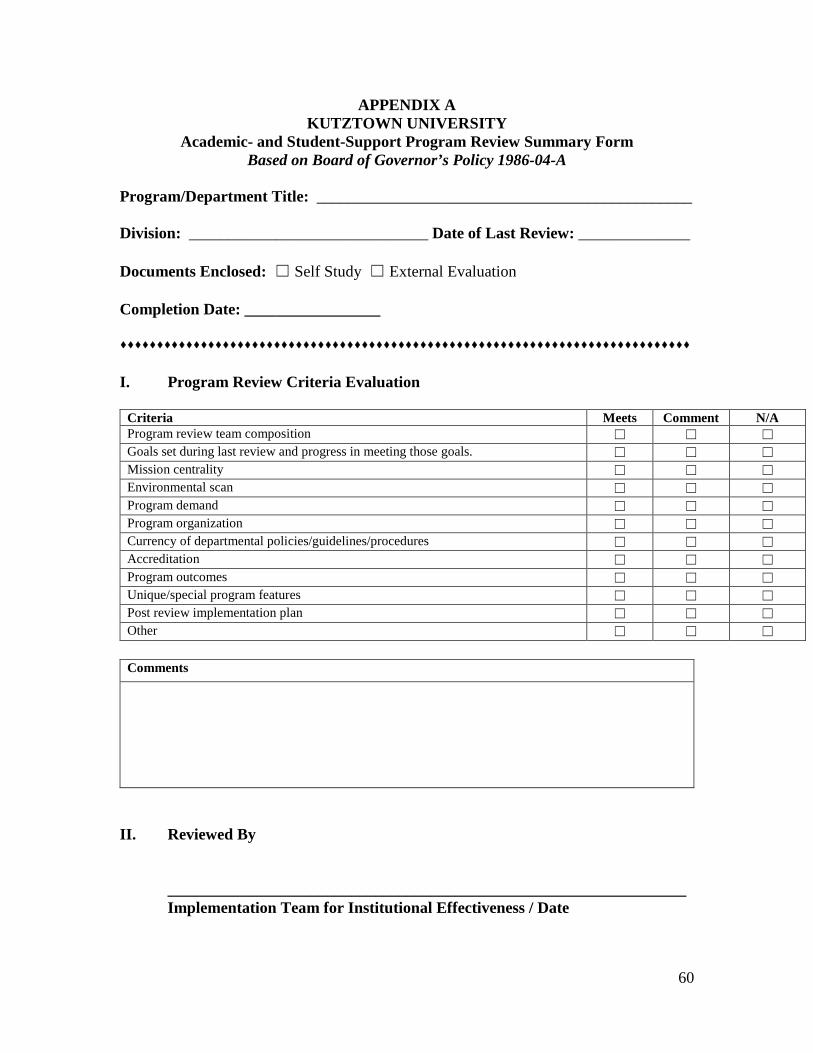
APPENDIX A KUTZTOWN UNIVERSITY
Academic- and Student-Support Program Review Summary Form Based on Board of Governor’s Policy 1986-04-A
Program/Department Title: _______________________________________________ Division: ______________________________ Date of Last Review: ______________ Documents Enclosed: ☐ Self Study ☐ External Evaluation Completion Date: _________________ I. Program Review Criteria Evaluation
Criteria Meets Comment N/A Program review team composition ☐ ☐ ☐ Goals set during last review and progress in meeting those goals. ☐ ☐ ☐ Mission centrality ☐ ☐ ☐ Environmental scan ☐ ☐ ☐ Program demand ☐ ☐ ☐ Program organization ☐ ☐ ☐ Currency of departmental policies/guidelines/procedures ☐ ☐ ☐ Accreditation ☐ ☐ ☐ Program outcomes ☐ ☐ ☐ Unique/special program features ☐ ☐ ☐ Post review implementation plan ☐ ☐ ☐ Other ☐ ☐ ☐
Comments
II. Reviewed By _________________________________________________________________ Implementation Team for Institutional Effectiveness / Date
60
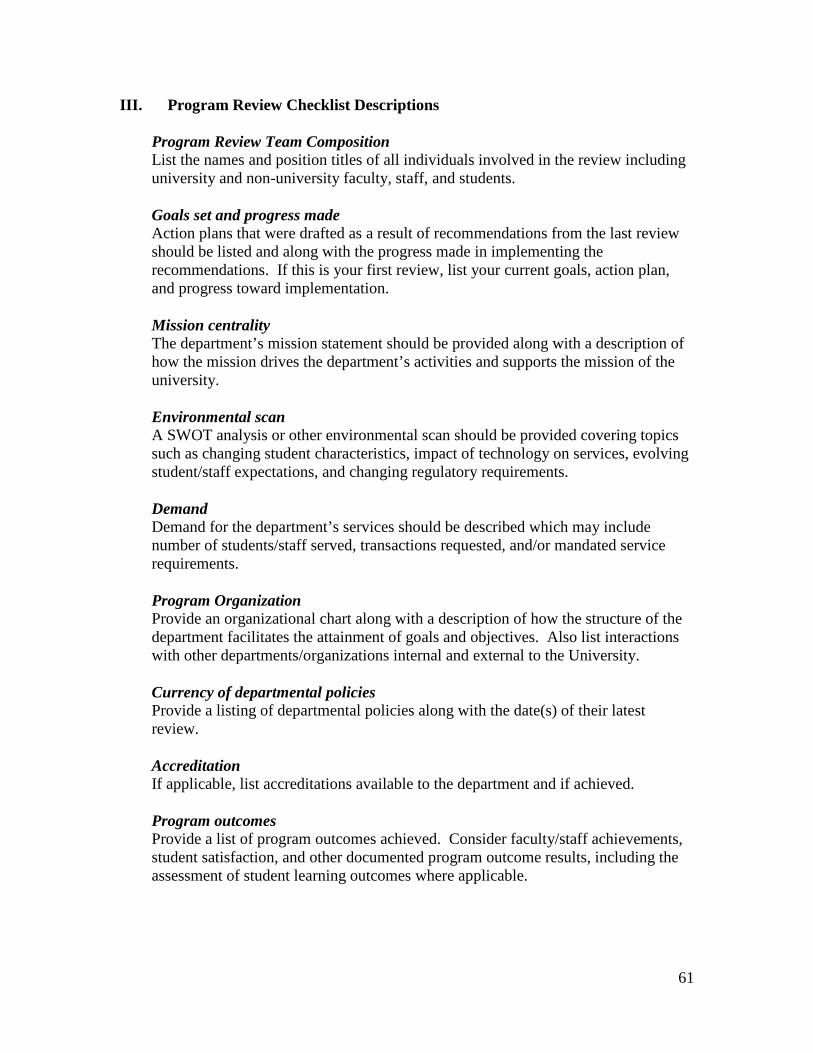
III. Program Review Checklist Descriptions Program Review Team Composition List the names and position titles of all individuals involved in the review including
university and non-university faculty, staff, and students. Goals set and progress made Action plans that were drafted as a result of recommendations from the last review
should be listed and along with the progress made in implementing the recommendations. If this is your first review, list your current goals, action plan, and progress toward implementation.
Mission centrality The department’s mission statement should be provided along with a description of
how the mission drives the department’s activities and supports the mission of the university.
Environmental scan A SWOT analysis or other environmental scan should be provided covering topics
such as changing student characteristics, impact of technology on services, evolving student/staff expectations, and changing regulatory requirements.
Demand Demand for the department’s services should be described which may include
number of students/staff served, transactions requested, and/or mandated service requirements.
Program Organization Provide an organizational chart along with a description of how the structure of the
department facilitates the attainment of goals and objectives. Also list interactions with other departments/organizations internal and external to the University.
Currency of departmental policies Provide a listing of departmental policies along with the date(s) of their latest
review. Accreditation If applicable, list accreditations available to the department and if achieved. Program outcomes Provide a list of program outcomes achieved. Consider faculty/staff achievements,
student satisfaction, and other documented program outcome results, including the assessment of student learning outcomes where applicable.
61
Unique/special program features If applicable, describe other aspects of the department that may be beneficial in
reviewing the department. Post review implementation plan A plan to provide for continuous improvement by building on strengths and
addressing challenges should be provided. The recommendations and action items should be accomplished by the next review period.
62

APPENDIX B KUTZTOWN UNIVERSITY
Academic- and Student-Support Program Review Evaluation Sheet
Program/Department Title: Division: Review type: ☐ Self Study ☐ External Evaluation Completion Date: I. Program Review Criteria Evaluation
Criteria Meets Comment N/A Program review team composition ☐ ☐ ☐ Goals set during last review and progress in meeting those goals ☐ ☐ ☐ Mission centrality ☐ ☐ ☐ Environmental scan ☐ ☐ ☐ Program demand ☐ ☐ ☐ Program organization ☐ ☐ ☐ Currency of departmental policies/guidelines/procedures ☐ ☐ ☐ Accreditation ☐ ☐ ☐ Program outcomes ☐ ☐ ☐ Unique/special program features ☐ ☐ ☐ Post review implementation plan ☐ ☐ ☐ Other ☐ ☐ ☐
Comments
II. Reviewed By _________________________________________________________________ Implementation Team for Institutional Effectiveness / Date
63
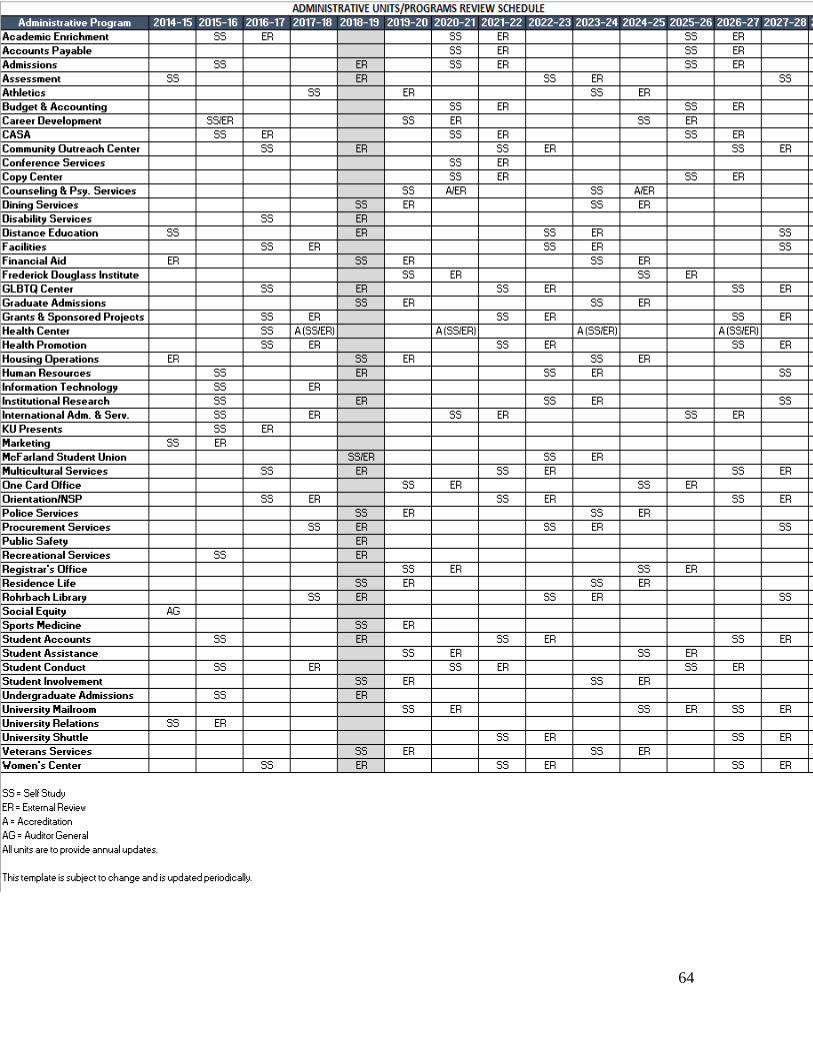
64