INSTITUTE OF NATURAL AND APPLIED SCIENCES …library.cu.edu.tr/tezler/7519.pdf · BASAMAKLI PLATİN...
90
INSTITUTE OF NATURAL AND APPLIED SCIENCES UNIVERSITY OF ÇUKUROVA MASTER THESIS İpek KILIÇCI UPD (UNDER-POTENTIAL DEPOSITION) AT STEPPED PLATINUM SINGLE CRYSTAL SURFACES DEPARTMENT OF CHEMISTRY ADANA, 2009
Transcript of INSTITUTE OF NATURAL AND APPLIED SCIENCES …library.cu.edu.tr/tezler/7519.pdf · BASAMAKLI PLATİN...

INSTITUTE OF NATURAL AND APPLIED SCIENCES UNIVERSITY OF ÇUKUROVA
MASTER THESIS
İpek KILIÇCI
UPD (UNDER-POTENTIAL DEPOSITION) AT STEPPED PLATINUM
SINGLE CRYSTAL SURFACES
DEPARTMENT OF CHEMISTRY
ADANA, 2009

INSTITUTE OF NATURAL AND APPLIED SCIENCES UNIVERSITY OF ÇUKUROVA
UPD (UNDER-POTENTIAL DEPOSITION) AT STEPPED PLATINUM
SINGLE CRYSTAL SURFACES
By İpek KILIÇCI
A THESIS OF MASTER of CHEMISTRY DEPARTMENT
We cerfity that the thesis titled above was reviewed and approved for the award of degree of the master of physicochemistry by the board of jury on …… Signature .................. Signature .................... Signature .................... Prof.Dr.Birgül Yazıcı Assoc.Prof.Dr.Gülfeza Kardaş Assist.Prof.Dr.Muzaffer Özcan Supervisor Jury Jury This Master Thesis is performed in Chemistry Department of the Instute of Natural and Applied Science of ÇUKUROVA University Registration Number:
Prof.Dr.İlhami YEĞİNGİL Director
The Istitute of Natural and Applied Science
Signature and Seal Not: The usage of the presented specific declarations, tables, figures and photographs either in the thesis or any other reference without citation is subject to‘the Law of Intellectual and Arts Products’ numbered 5846 of Turkish Republic.

I
ABSTRACT
MS THESIS
UPD (UNDER-POTENTIAL DEPOSITION) AT STEPPED PLATINUM SINGLE CRYSTAL SURFACES
İpek KILIÇCI
DEPARTMENT OF CHEMISTRY
INSTITUTE OF NATURAL AND APPLIED SCIENCES
UNIVERSITY OF ÇUKUROVA
Supervisor: Prof. Dr. Birgül YAZICI
Year: 2009, Pages: 76
Jury: Prof.Dr. Birgül YAZICI
Assoc.Prof.Dr. Gülfeza KARDAŞ
Assist.Prof.Dr. Muzaffer ÖZCAN
It is investigated the underpotential deposition (UPD) of Tl and Pb on stepped Pt single-crystals vicinal to the (100)-surfaces, (like Pt (19,1,1), Pt (11,1,1), Pt (511), Pt (100) and Pt (111)) and the influence of Ru on the CO oxidation on Pt (19,1,1). For Ru deposition two peaks appeared at high potential in the CV in CO free solution. CO oxidation are performed on the Ru free and the Ru modified Pt-surface and it is shown that all peaks shifted to low potential with Ru deposited on the Pt (19,1,1) surface. Instead of one peak for the CO oxidation at 0.75 V on the Ru free Pt (19,1,1), on the Ru modified Pt surface two peaks are visible for the CO adsorbate at 0.58 and 0.63 V. When the potential is stoped at 0.54 V for 3 min., the second peak at 0.7 V is not affected. Tl/Pt (111) the sharpest peak at 0.76 V is explained as a phase-Transition from a 7x3 - to a °30R3x3 -overstructure of the Tl-Adlayer. Comparison of Tl and Pb has been done and it shows that Tl preferential decorated on step-sites and Pb preferential decorated on terrace-sites. And it is shown that Pb adsorption is more stable at (100) surface than (111) surface. Keywords : Platinum electrode, Platinum single crystal, CO oxidation, Ru.

II
ÖZ
YÜKSEK LİSANS TEZİ
BASAMAKLI PLATİN TEK KRİSTAL YÜZEYİNDE DAHA DÜŞÜK
POTANSİYELDE BİRİKME
İpek KILIÇCI
ÇUKUROVA ÜNİVERSİTESİ FEN BİLİMLERİ ENSTİTÜSÜ
KİMYA ANABİLİM DALI
Danışman: Prof. Dr. Birgül YAZICI
Yılı: 2009, Sayfa: 76
Jüri: Prof.Dr. Birgül YAZICI
Doç.Dr. Gülfeza KARDAŞ
Yrd.Doç.Dr. Muzaffer ÖZCAN
Bu çalışmada; (100) basamak yüzeyinde (Pt(19,1,1), Pt(11,1,1) ve Pt(511) gibi) Pt tek kristalinin Tl ve Pb UPD’sini ve Pt(19,1,1) yüzeyinde Ru’un CO oksidasyonu üzerinde etkisini araştırdık.Serbest CO çözeltisinde Ru birikimi sırasında siklik voltamogramda (CV) yüksek potansiyelde 2 pik gözlenmiştir. CO oksidasyonu ; Ru içermeyen çözeltide ve Ru içeren çözeltide çalışılmıştır.Bu kıyaslamanın sonucu olarak Ru etkisiyle Pt(19,1,1) yüzeyinde bütün piklerin daha düşük potansiyele doğru kaydığı gözlenmiştir. Pt(19,1,1) yüzeyindeki Ru içermeyen çözeltide CO oksidasyonu sırasında 0.75 V’ta görülen tek pik yerine ; Ru içeren çözeltide 0.58 ve 0.63 V’ta CO adsorpsiyonu gözlenmiştir. Ru içeren çözelti deneyinde; 0.54 V’ta 3 dakikalığına potansiyel akımını durdurduğumuzda 0.7 V’taki 2. pikin etkilenmediği gözlenmektedir.Tl/Pt(111) yüzeyindeki 0.76 V’taki keskin pik
7x3 yapısından °30R3x3 yapısına faz değiştirdiğini göstermektedir.Tl ve Pb arasında kıyaslama yapılmıştır ve sonuçlar Tl’un özellikle basamağı, Pb’nin ise özellikle terası modife ettiği saptanmıştır. Ayrıca Pb adsorpsiyonunda (100) yüzeyinin (111) yüzeyine göre daha kararlı olduğu saptanmıştır. Anahtar Kelimeler: Platin elektrodu, Platin tek kristali, CO oksidasyonu, Ru.

III
ACKNOWLEDGEMENTS
This work was supported by ERASMUS (Student exchange programm).
The authors would like to thank her thesis supervisor Prof.Dr. Birgül YAZICI
for having accepted me as s a master student in her group and helped me to go and
study at Bonn University.And I want to thank all of members in our
Physicochemistry department.
All of the my work performed in electrochemistry department of Bonn
University. I went this university for all of my work via Erasmus program. I want to
thank a lot Assoc.Prof. Gülfeza Kardaş and our international office for their interest
about Erasmus program.
Thanks to all the members of the jury for reading and evaluating my thesis as
well as assisting in my exam.
Special thanks to Prof.Dr. Helmut Baltruschat for accepting me for one year in
his research group in Bonn.I was very pleased from meet in the airport to end of all
my study.When I went there, I met wonderful people there.I never forget their
helps.Thank you very much all of Prof.Dr. H. Baltruschat’s group for your
hospitality.
The author also would like to thank Nicky Bogolowski for his interest about
my study and for discussions and corrections.Thank you very much for everything
Nicky Bogolowski and all of my group; You are very good friend and very good
colleagues.
Finally I would like to thank my family specially my mother for favor and
support.

IV
CONTENTS PAGE
ABSTRACT.……………………………………………………………………............…... I
ÖZ...........................……………………………………………………………………........ II
ACKNOWLEDGEMENTS……………………………………………………........…...... III
CONTENTS..... ……….……………………………………………..…………................. IV
TABLE CAPTIONS……………………………………….............…………....................VII
FIGURES CAPTIONS……………………………………………..…………..................VIII
SYMBOLS AND ABBREVIATIONS…………………………….…………................... XII
1.INTRODUCTION……………………………………………………………................... 1
2. THEORETICAL................................................................................................................. 2
2.1. Crystallography of Metals.……..........……………………………….......................... 2
2.1.1. Single Crystal Surfaces........................................................................................ 4
2.1.2. Miller Indices...………………............................................................................ 4
2.1.3. Low-Miller-Index Planes of Crystals.................................................................. 6
2.1.4. High-Miller-Index Stepped Surfaces....…......................................................... 12
2.2. Surface Structures........................................................................................................ 15
2.2.1. Woods Notation….…………............................................................................ 15
2.2.2. Relaxation.......................................................................................................... 16
2.2.3. Reconstruction................................................................................................... 17
2.3. Electrochemical Characterization of Single Crystal Surface...................................... 20
2.4. Cyclic Voltammetry.................................................................................................... 20
2.5. CV Measurements.............................................................................................…….. 22
2.6. Under-potential Deposition (UPD).............................................................................. 23
2.7. Electrode Immersion Technique.................................................................................. 24
2.8. CO Oxidation.............................................................................................................. 24
2.9. Aim of This Work....................................................................................................... 25
2.9.1. Why Thallium and Lead ?................................................................................ 25
2.9.1.1. Thallium............................................................................................. 25
2.9.1.2. Lead.................................................................................................... 26
2.9.2. Why Ruthenium ?............................................................................................. 27

V
2.9.2.1. Ruthenium......................................................................................... 28
3. LITERATURE SURVEY................................................................................................. 29
3.1. Adsorption Test.......................................................................................................... 29
3.2. Hydrogen adsorption on the Low-Indexed Pt ingle-crytals and on stepped single-
crystal vicinal to the (100) surface in sulphuric and perchloric acid.......................... 30
3.3. Tl and Pb UPD............................................................................................................ 34
3.4. Effect of Ru deposition on the CO oxidation at Pt single-crystals............................. 37
4. MATERIALS AND METHODS...................................................................................... 39
4.1. Materials.................................................................................................................... 39
4.1.1. Chemicals....................................................................................................... 39
4.1.2. Apparatus........................................................................................................ 40
4.1.3. The Bead Single Crystal Teflon-Holder......................................................... 40
4.1.4. Electrochemical Instrumentation.................................................................... 41
4.1.4.1. The Electrodes................................................................................... 41
4.1.4.2. The Cell............................................................................................. 44
4.1.4.3. The Potentiostat................................................................................. 44
4.1.5. Glassware........................................................................................................ 45
4.2. Methods..................................................................................................................... 46
4.2.1. Preparation of well-ordered noble metal single crystal surfaces..................... 46
4.2.2. Calculation of Charge in Cyclic Voltammetry................................................ 46
5. EXPERIMENTAL RESULTS AND DISCUSSON........................................................ 47
5.1. Tl-UPD on Pt(111), Pt(100), Pt(11,1,1) and Pt(511)............................................... 47
5.1.1. Voltammetry of the unmodified Pt bead ingle-crystal surfaces in H2SO4
solution............................................................................................................ 47
5.1.2. Diffusion controlled Tl-UPD on Pt(111), Pt(100), Pt(511) and Pt(11,1,1)..... 50
5.2. Pb-UPD on Pt(100) and stepped-crystal Pt(19,1,1), Pt(11,1,1) and Pt(511).............. 55
5.2.1. Voltammetry of the unmodified Pt bead single-crystal in HClO4 solution..... 55
5.2.2. Pb-UPD on Pt(100), Pt(19,1,1), Pt(11,1,1) and Pt(511) from Pb(ClO4)2
containing solution.......................................................................................... 58
5.2.3. Cyclic Voltammetry of Pb/Pt-surfaces in HClO4 solution.............................. 61
5.3. Effect of Ru submonolayers on the CO oxidation on Pt(19,1,1)............................... 62

VI
5.3.1. CO oxidation at the Ru free Pt(19,1,1) surfaces............................................... 62
5.3.2. Adsorption of Ru submonolayers on Pt(19,1,1) surfaces................................. 65
5.3.3. Voltammogram of the Ru/Pt(19,1,1) electrode in H2SO4................................ 66
5.4. Discussion.....................................................................................................................70
6. SUMMARY...................................................................................................................... 72
REFERENCES...................................................................................................................... 73
CURRICULUM VITAE....................................................................................................... 76

VII
TABLE CAPTIONS PAGE
Table 2.1. In the table for stepped surface in the cubic system, stepped-surface
designation, Miller indices and ‘angle of curt from terrace along zone
line toward step’ are related……............................................................ 13
Table 4.1. The chemicals that used in this work....................................................... 39
Table 5.1. Charge of various Pt-single crystals for the integration limit is between
0.1 V and 0.45 V..................................................................................... 49
Table 5.2. Charge of various Pt-ingle crystals.......................................................... 57
Table 5.3. Charge density of various Pt-single crystals............................................ 60
Table 5.4. Charge of various Pt-single crystals.The integration limit is between
0.1 V and 0.5 V........................................................................................ 62

VIII
FIGURE CAPTIONS PAGE
Figure 2.1. Five two-dimensional Bravais lattices.Translation vectors a and b are
shown....................................................................................................... 2
Figure 2.2. Shows a step, island, terrace, vacancy and adatom.................................. 3
Figure 2.3. Shows Miller indices calculation.............................................................. 6
Figure 2.4. FCC metallic elements structures are shown in yellow at room
temperature.............................................................................................. 7
Figure 2.5. Main low-index planes of three basal plane of FCC................................ 8
Figure 2.6. Main low-index planes of a FCC.............................................................. 8
Figure 2.7. BCC metallic elements structures are shown in yellow at room
temperature.............................................................................................. 9
Figure 2.8. Main Low-Index planes of a BCC (body-centred cubic) crystal............ 10
Figure 2.9. Main Low-Index planes of a HCP (hexagonal close-packed) crystal.
For the (1010) and (1011) planes, two possible types of
surface termination are shown.................................................................11
Figure 2.10. Main Low-Index planes of a diamond crystal...................................... 11
Figure 2.11. Shows the High-Miller-Index stepped surfaces.................................... 12
Figure 2.12. a) Stepped (755) and b) Kinked (10,8,7) FCC crystal faces................. 13
Figure 2.13. The stereographic triangle for the FCC system, depicting some of the
platinum high index planes present between the low index planes. The
arc between (111) and (100) plane is called the [011] zone. On the
connection lines the stepped surfaces can be found............................. 14
Figure 2.14. Wood’s and matrix notation for some super lattices on a hexagonal
2D lattice............................................................................................... 15
Figure 2.15 Wood’s and matrix notation for some super lattices on a square 2D
lattice..................................................................................................... 15
Figure 2.16. a) Normal and b) Lateral relaxation in the top atomic layers of a semi-
infinite crystal....................................................................................... 17
Figure 2.17. a) and c) represent the conservative reconstruction. When the number
density of surface atom is preserved b) and d) represent the non-

IX
conservative reconstruction in this case when the number density of
surface atoms are modified.................................................................... 18
Figure 2.18. Hexagonal packing of the top-layer Pt atoms on the square Pt(100)
atomic plane.......................................................................................... 19
Figure 2.19. a) An ideal non-reconstructed Pt(110) 1x1 b) Recontructed Pt(110)
2x1 with a missing-row structure......................................................... 19
Figure 2.20. Shows typical voltammogram of the Pt-crystals.................................. 21
Figure 2.21. The CVs of Pt stepped single crystals Pt(S)[n(100)x(111)] with
n=2, 3 and 4 with v=50 mV/s.............................................................. 22
Figure 3.1. Scheme of adsorption test....................................................................... 29
Figure 3.2. Voltammetric profiles of the Low-indexed Pt(100), Pt(110) and Pt(111)
single-crystal surfaces in 0.1 M H2SO4 v=50 mV/s.............................. 31
Figure 3.3. Voltammetric profiles of the Low-indexed Pt(100) and
Pt(S)[n(100)x(111)] with n=2, 4 and 6 in 0.1 M H2SO4 v=50mV/s....... 32
Figure 3.4. Voltammetric profiles of the Pt(S)[n(100)x(111)] electrodes, with
n=3, 4, 8 and 20 and Pt(100) in 0.1 M HClO4 v=50 mV/s.
Arrows indicate the increase of the step density................................... 33
Figure 3.5. Cyclic voltammograms of the basal planes Pt(111) and Pt(100) in
0.1 M HClO4, v=50 mV/s...................................................................... 34
Figure 3.6. Voltammogram of a Pt(111) orientated electrode in contact with an
acidic solution of thallium, 5x10⁻³ M Tl+ in 0.5 M H2SO4 ; sweep
rate 20 mV/s........................................................................................... 35
Figure 3.7. a) Cyclic voltammogram for Pb-UPD in 0.1 M HClO4 on the Pt(100)
disk electrode in a RRDE assembly. Base voltammogram without Pb+2
in solution under otherwise identical conditions are shown for
comparison. b) Ring electrode current with the ring being potentiostated
at 0.65 V. Insert integrated charges for the stripping of Pb from the disk
electrode assessed from ring (ISC) and disk (TDC) uppdotentiodynamic
curves. Rotation rate 900 rpm; sweep rate 50 mV/s............................... 36
Figure 3.8. a) Cyclic voltammograms of Pt(111) mounted in the disk position of the
RRDE in 0.1 M HClO4 and 5x10⁻⁵ M Pb+2 ; rotation rate 900 mV/s,

X
Sweep rate 50 mV/s b) Ring electrode currents recorded with the ring
being potentiostated at -0.59 V................................................................ 37
Figure 3.9. Shows the CV of oxidation of adsorbed CO at Pt(111) covered by
(submonolayers of) Ru and Sn. CVs are shown in 3.9.a ; MSCVs
(massspectrometry cyclic voltammetry) for CO2 are shown in
3.9.b dE/dt=10 mV/s, 0.5 M H2SO4 (__) deposition of Ru followed
by deposition of Sn (- - -) deposition of Sn followed by deposition of
Ru (-,-,-) only deposition of Sn (. . .) bare Pt-surface for comparison... 38
Figure 4.1. The Pt-electrodes with Teflon-holder..................................................... 41
Figure 4.2. Potentiostat/Galvonostat Model 273...................................................... 45
Figure 5.1. Recorded CVs of the two basal plane single-crystals in 0.1 M H2SO4
with v=50mV/s....................................................................................... 48
Figure 5.2. CVs of Pt stepped single crystals Pt(S)[n(100)x(111)] with n=3, 6
and Pt(100) in 0.1 M H2SO4.................................................................. 49
Figure 5.3. The CVs for Tl/Pt(111) in 10-3 M Tl2SO4+0.1 M H2SO4 with v=10
mV/s....................................................................................................... 51
Figure 5.4. The CVs for Tl deposition (__) on Pt(11,1,1) in 10-6 M Tl2SO4+0.1 M
H2SO4 and after preparation (. . .) with v=50 mV/s............................... 52
Figure 5.5. The CVs for Tl deposition (__) on Pt(511) in 10-6 M Tl2SO4+0.1 M
H2SO4 and (. . .) after preparation in 0.1 M H2SO4 with v=50mV/s..... 53
Figure 5.6. The CVs for Tl deposition (__) on Pt(100) in 10-6 M Tl2SO4+0.1 M
H2SO4 and (. . .) after preparation in 0.1 M H2SO4 with v=50mV/s..... 54
Figure 5.7. The CVs for Tl deposition (__) on Pt(111) in 10-6 M Tl2SO4+0.1 M
H2SO4 and (. . .) after preparation in 0.1 M H2SO4 with v=50mV/s.... 55
Figure 5.8. Voltammetric profiles of the Pt(S)[n(100)x(111)] electrodes, with
n=3,6 and 10 and Pt(100) in 0.1 M HClO4. v= 50 mV/s....................... 56
Figure 5.9. Recorded CVs Pt(111) in 0.1 M HClO4. v= 50 mV/s............................ 57
Figure 5.10. Voltammetric profiles of the Pt(S)[n(100)x(111)] electrodes,
with n=3,6 and 10 and Pt(100) in 10-3 M Pb(ClO4)2+0.1 M HClO4
a) v= 50 mV/s b) v=10 mV/s............................................................... 59

XI
Figure 5.11. CVs for Pt(111) in 10-3 M Pb(ClO4)2+0.1 M HClO4 with
a) v=50 mV/s b) v= 10 mV/s................................…........................... 60
Figure 5.12. Voltammetric profiles of the Pt(S)[n(100)x(111)] electrodes,
with n=3,6 and 10 and Pt(100) after Pb-UPD in 0.1 M HClO4
with v= 50 mV/s…………………...………………………………....61
Figure 5.13. CVs for Pt(111) after Pb-UPD in 0.1 M HClO4 with v=50 mV/s........ 62
Figure 5.14 Recorded CVs for after preparation of Pt(19,1,1) in 0.1 M H2SO4
v=50 mV/s............................................................................................. 63
Figure 5.15. The first CV for Pt(19,1,1) after CO oxidation in 0.1 M H2SO4
with v= 10 mV/s................................................................................... 64
Figure 5.16. CV for the Pt(19,1,1) for after CO oxidation in 0.1 M H2SO4 with
v=50 mV/s............................................................................................ 65
Figure 5.17. CVs for Ru deposition at Pt(19,1,1) in 10-5 M RuCl3+0.1 M H2SO4
with v= 50 mV/s.................................................................................. 66
Figure 5.18. The CVs for Ru/Pt(19,1,1) in 0.1 M H2SO4......................................... 67
Figure 5.19. The CVs for CO oxidation in 0.1 M H2SO4 with v=10mV/s............... 68
Figure 5.20. The CV for CO oxidation of Pt(19,1,1) with v=10mV/s...................... 69
Figure 5.21. The CV for the Pt(19,1,1) (. . .) after CO oxidation and (__) after
Ru/Pt in 0.1 M H2SO4 with v=50 mV/s............................................... 69
Figure 5.22. Compares the CO oxidation (. . .) Ru free surface and (__) Ru
containing solution with v=10 mV/s.................................................... 70
XII
SYMBOLS AND ABBREVIATIONS
V : Volt
E : Electrod potential (V)
F : Faraday constant (96485 C.mol-1)
I : Ionic current (mA/cm2)
η : Over voltage (V)
µC : Micro Coulomb
Po : Nernst potential
Poo : Standard potential
Z : Number of transferred electrons
Pt : Platinum
Tl : Thallium
Pb : Lead
Ru : Ruthenium
UPD : Under-potential deposition
QF : Faradic charge
FCC : Face-centred cubic
BCC : Body-centred cubic
HCP : Hexagonal close-packed

1. INTRODUCTION İpek KILIÇCI
1
1. INTRODUCTION
The adsorption of adatoms on metal electrodes and underpotential deposition
has been studied in electrochemical research. It is wanted studied with Tl and Pb to
observe their behaviour on Pt surfaces. It is wanted obtain that these metals can
decorate on step sites or terrace sites. Subsequent Pt single-crystals are prepared by
heating and cooling in pure water saturated by hydrogen .It can be modified with
these metals under-potential control adsorption from a metal containing solution.
In combination with Pt, ruthenium has good catalytic properties for the CO in
fuel cells. Ruthenium is often studied on Pt single-crystal surface with defined
surface geometry because of this it is wanted study Pt(S)[n(100)x(111)] n= 10
electrodes. After heating and cooling down in a hydrogen atmosphere over MilliQ-
water process it can be modified with Ru under potential control adsorption from a
ruthenium containing solution.
Adsorption is the collection of atoms or molecules on the surface of a material.
It creates a film of the adsorbate on the adsorbent`s surface. Adsorption/desorption
process are main amount of the solid/gas or solid/liquid interfaces.
There are two important differences between metal-gas and metal-solution
interfaces.
The first one is that the gas which is a dilute phase is replaced by solution
which is a concentrated phase; for electrolytic systems, adsorption always
corresponds to a replacement process.
The second one is the greater convenience by which the local field may be
varied at the electrochemical interface than at the gas-solid interface.

2. THEORETICAL İpek KILIÇCI
2
2. THEORETICAL
2.1. Crystallography of metals
Crystals consist of periodic repetitions of identical cells each containing one or
more atoms. The unit cell which can be used for construct the crystal is the smallest
cell.
2-dimensional crystal with a rectangular unit cell containing a single atom.
Bravais Lattice
The same lattice as above generated from a different choice of unit cell.
If the unit cell contains a single atom, the cell is called primitive and the lattice is
a Bravais lattice.Following the figure 2.1. is related to Bravais lattices.
Figure 2.1. Five two-dimensional Bravais lattices. Translation vectors a and b are shown.
Lattice planes
A lattice contains a large number of planes of atoms. These planes are named
using the Miller indices ( ni , nj , nk ) defined with the convention that the vector.

2. THEORETICAL İpek KILIÇCI
3
r =nii + njj + nkk
is a normal vector for the plane. In this equation i, j and k are the basis vectors and
ni, nj, and nk are integers. This is 3D (three-dimensional) Lattices plane.
Real surfaces, as opposed to the ideal surfaces described below, one
characterized by steps and terraces. The steps can be one or many rows of atoms. The
step also need not be straight, that gives rise to kinks. Single atoms or adatoms may
stay anywhere on a terrace. There can be also vacancies in the terrace, leaving small
holes in the surface. These holes are indicated by the dotted cubes [G.A.
Somorjai,(1994)] [ T. Michely and G. Comsa,(1991)].
This is a simple model of a real surface and typical STM images are shown. As
indicated below, a main cause for the existence of steps on a single crystal surface is
a (small) misorientation as a result of cutting and polishing. Sometimes such a miscut
is formed willfully, in order to obtain surfaces with nearly equidistant monoatomic
high steps and terraces of a certain average width [G.A. Somorjai,(1994)].
Figure 2.2. Shows a step, island, terrace, vacancy and adatom [L. A. Kibler, (2003)].

2. THEORETICAL İpek KILIÇCI
4
2.1.1. Single Crystals Surface
Due to the known regular surface geometry, Pt single crystal electrodes are suited
model systems for the analysis of the relationship between the surface structure and
the surface reactivity.
The crystal itself is composed of regularly repeating structural motives (e.g.,
atoms, molecules). In the ideal case, the space lattice three-dimensional infinite array
of atoms is surrounded in an identical way by its neighbours with a periodicity free
from defects. The crystal structure itself is obtained by associating with each lattice
point into an identical structural motive.
2.1.2. Miller Indices
Miller indices were introduced in 1839 by the British mineralogist William
Hallowes Miller. The method was also historically known as the Millerian system.
The certain meaning of this notation depends upon a choice of lattice vectors
for the crystal, as described below. Usually, three primitive lattice vectors are used.
Although, for cubic crystal systems, the cubic lattice vectors are used even when they
are not primitive (e.g., as in BCC (body-centred) and FCC (face-centred crystals) ).
A system of notation called Miller indices that provides a short , unequivocal
numeral label for all rational crystal planes. Rational crystallographic planes are
defined by a set of rational lattice points, which in turn are specified by the primitive
lattice vectors.
If each atom in the crystal is represented by a point and these points are
connected by lines, the resulting lattice may be divided into a number of blocks, or
unit cells; the intersecting edges of one of the unit cells defines a set of
crystallographic axes, and the Miller indices are determined by the intersection of the
plane with these axes. The reciprocals of these intercepts are computed, and fractions
are giving the three Miller indices (hkl) [N. Tian, (2008)].

2. THEORETICAL İpek KILIÇCI
5
Where a surface plane has unequal contributions from two different basal
planes of the unit cell cube, a stepped surface is obtained, for example, (100) planes
separated by (110) steps. Also , if the surface plane has unequal contributions from
all three planes of the unitcell cube a kinked surface is obtained by characterised for
example , (100) planes separated by kinks of (110) and (111) symmetry. The ratio of
the contributions of the different planes of the unit cell cube when determines sizes
of the different domains [A. L. Spek, (2003)].
Now it can be explained the Miller İndices with example. They are:
Determine the intercepts of the face along the crystallographic axes, in terms of unit
cell dimensions.
1 Take the reciprocals
2 Clear fractions
3 Reduce to lowest terms
For example, if the x-, y-, and z- intercepts are 2, 1, and 3, the Miller indices are
calculated as;
1 Take reciprocals: 1/2, 1/1, 1/3
2 Clear fractions {multiply by 6}: 3, 6, 2
3 Reduce to lowest terms (already there)
Thus, the Miller indices are 3, 6, 2.Following the figure is related to Miller indices
calculation.

2. THEORETICAL İpek KILIÇCI
6
Figure 2.3. Shows Miller indices calculation.
Some General Principles
♦ When the plane is parallel to the axis, its intercept is at infinity the Miller index is
‘0’ (zero).
♦ When the plane is more nearly parallel to the axis, the Miller index is smaller.
♦ When the plane is more nearly perpendicular to the axis, the Miller index is larger.
♦ Multiplying or dividing a Miller index by a constant has no effect on the
orientation of the plane.
♦ Miller indices are almost small.
2.1.3. Low-Miller-Index Planes of Crystals
The FCC ( Face-centred-cubic) Lattice : Bulk structure
The face centred lattice equals the simple cubic lattice with the addition of a
lattice point in the centre of each of the six faces of each cube. This cell contains 4
atoms. It is conventional and cubic, the FCC lattice can be build from a primitive
cell. But the primitive cell is inconvenient for many purposes. For example it is a
parallelepiped and not cubic. Also, the crystallographic directions are defined with

2. THEORETICAL İpek KILIÇCI
7
regard to the conventional cell. (FCC) unit cell there is one host atom at each corner
and one host atom in each face. Since each corner atom contributes one eighth of its
volume to the cell interior, and each face atom contributes one half of its volume to
the cell interior (and there are six faces), then Z = 1/8.8 + 1/2.6 = 4.
Figure 2.4. FCC metallic elements structures are shown in gray at room Temperature [http://www.mateck.de].
The FCC (100) surface
Atoms in the first layer have 8 neighbours. The (100) surface is that obtained by
cutting the FCC metal parallel to the front surface of the FCC cubic unit cell - this
exposes a surface (the atoms in blue) with an atomic arrangement of 4-fold
symmetry.
The FCC (110) surface
This surface is the most open surface of the three basal planes for FCC.
In the first layer atoms have 7 neighbours. But in the second layer atoms have 11
neighbours [http://www.mateck.de]. The (110) surface is obtained by cutting the
FCC unit cell in a manner that intersects the x and y axes but not the z-axis - this
exposes a surface with an atomic arrangement of 2-fold symmetry.
2. THEORETICAL İpek KILIÇCI
8
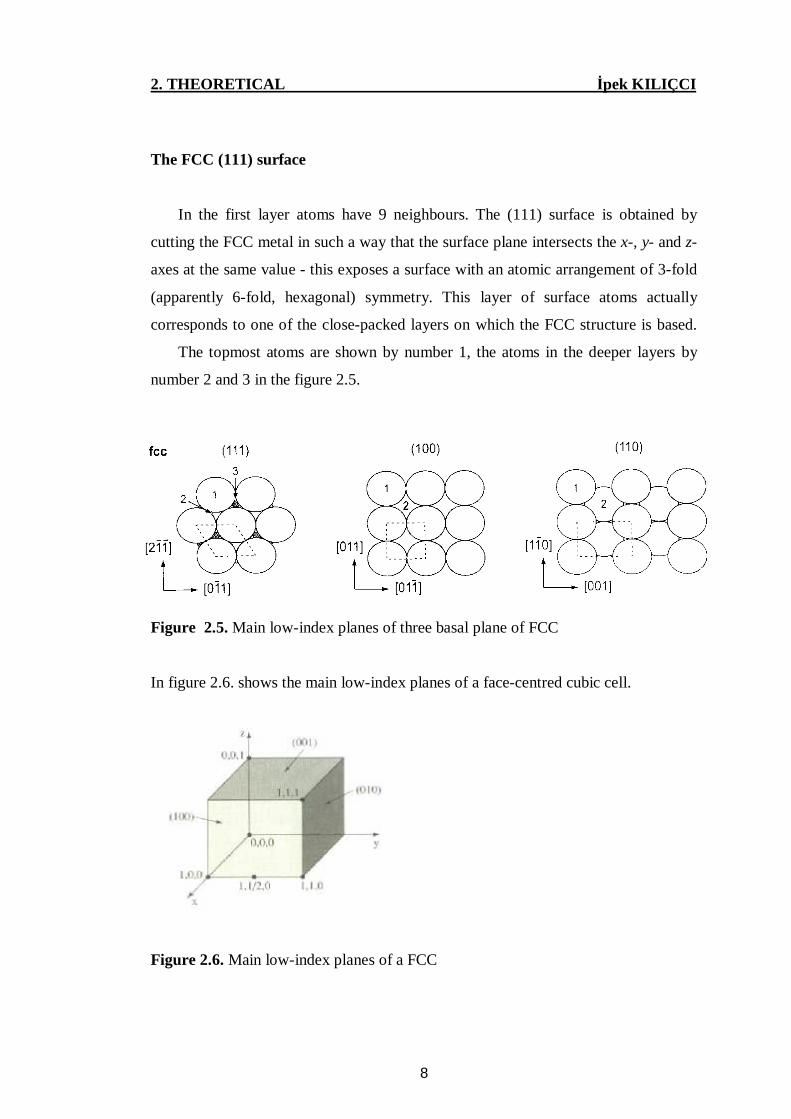
The FCC (111) surface
In the first layer atoms have 9 neighbours. The (111) surface is obtained by
cutting the FCC metal in such a way that the surface plane intersects the x-, y- and z-
axes at the same value - this exposes a surface with an atomic arrangement of 3-fold
(apparently 6-fold, hexagonal) symmetry. This layer of surface atoms actually
corresponds to one of the close-packed layers on which the FCC structure is based.
The topmost atoms are shown by number 1, the atoms in the deeper layers by
number 2 and 3 in the figure 2.5.
Figure 2.5. Main low-index planes of three basal plane of FCC
In figure 2.6. shows the main low-index planes of a face-centred cubic cell.
Figure 2.6. Main low-index planes of a FCC

2. THEORETICAL İpek KILIÇCI
9
BCC (Body-centred cubic) Lattice : Bulk
The body centred lattice equals the simple cubic lattice with the addition of a
lattice point in the centre of each cube. The figure 2.7. shows the conventional unit
cell for BCC, this cell is cubic and contains 2 atoms. Each atom has 8 neighbours.
(BCC) unit cell there is one host atom (lattice point) at each corner of the cube
and one host atom in the centre of the cube: Z = 2. Each corner atom touches the
central atom along the body diagonal of the cube, and it is easy to show by that the
unit cell edge, an irrational number, is about 2.3r. Thus, the corner atoms do not
touch one another.
Figure 2.7. BCC metallic elements structures are shown in gray at room temperature [http://www.mateck.de].
The BCC (100) surface
In the surface plane each surface atom has 4 neighbours and 1 neighbour in the
plane below the figure 2.8. [http://www.mateck.de].

2. THEORETICAL İpek KILIÇCI
10
The BCC (110) surface
In the surface plane each surface atom has 4 neighbours and 2 neighbours in the
plane below. This surface plane is the most open of the three planes for BCC.
The BCC (111) surface
In the first layer atoms have 3 atoms in the second layer and 1 neighbour in the
third layer. In the second layer atoms have 3 neighbours in the first layer, 3
neighbours in the second layer and 1 neighbour in the third layer. This surface is very
open.
In the figure 2.8. the atoms in the top layer present a rather "open" arrangement
of atoms with poor packing efficiency. This surface often reconstructs. The (110)
surface has pseudo-hexagonal packing. Four sides of each hexagon have equal length
while the remaining two are longer. The (111) surface has hexagonal packing but is a
very rough surface.
Figure 2.8. Main low-index planes of a BCC (body-centred cubic) crystal [http://www.mateck.de].
HCP (Hexagonal close-packed)
With hexagonal crystal systems, it is possible to use the Bravais-Miller index
which has 4 numbers (h k i l).
i = -h - k

2. THEORETICAL İpek KILIÇCI
11
h , k and l are identical to the Miller index , and i is a redudant index.The HCP
(0001) surface is very similar to the FCC (1,1,1) surface.The odd difference occurs
deeper into the surface. It can be explained with this example; (110) ≡ (112 0) and
(12 0) ≡ (12 10) is more obvious when the redundant index is shown ;
Figure 2.9. Main low-index planes of a HCP (hexagonal close-packed) crystal. For the (1010) and (1011) planes, two possible types of surface termination are shown.
The diamond lattice consists of a face-centred cubic Bravais point lattice which
contains two identical atoms per lattice point. The distance between the two atoms
equals one quarter of the body diagonal of the cube. The diamond lattice represents
the crystal structure of diamond, germanium and silicon.
Figure 2.10. Main low-index planes of a diamond crystal.

2. THEORETICAL İpek KILIÇCI
12
2.1.4. High-Miller-Index Stepped Surfaces
High Miller index surfaces have been studied less than low Miller index crystal
surfaces. The few studies that have been made using metal, semiconductor and oxide
surfaces revealed that these surfaces are structurally heterogeneous.The figure 2.11.
shows High-Miller-Index Stepped surface.
♦ If the crystal surface is misoriented from the low-index plane by a small angle, it
can be described by the combination of three parameters: tilt angle, tilt azimuth and
tilt zone.
♦ The tilt zone specifies the axis, around which the rotation from the basal low-index
plane to the tilted plane is conducted.
♦ The azimuth specifies the direction of the rotation.
♦ The tilt angle specifies the angle of rotation [G. Somorjai and D. W. Blakely,
(1997)].
Figure 2.11. Shows the High-Miller-index stepped surfaces
The atomic structures of high-Miller-index surfaces are composed of terraces,
separated by steps, which may have kinks in them. Thus, the (755) surface of an FCC
crystal consist of (111) terraces, six atoms deep, separated by straight steps of (100)
orientation and of single-atom height. The FCC (10,8,7) has kinks in its step edges,
the steps are not straight. The steps and kinks provide a degree of roughness that can
be very important [D. W. Blakely and G. A. Somorjai, (1977)] [S. T. Pratt, (2005)].

2. THEORETICAL İpek KILIÇCI
13
a) Stepped (755)
b) Kinked (10,8,7) Fcc faces
Figure 2.12. a) stepped (755) and b) Kinked (10,8,7) FCC Crystal Faces
Table 2.1.The table shows types of stepped surface in cubic system, ‘stepped-surface Designation’, ‘Miller indices’ ,and ‘angle of curt from terrace along zone line toward step’ are related [G. Somorjai and D. W. Blakely, (1977)].

2. THEORETICAL İpek KILIÇCI
14
This is the some of the most important angles between the planes.
For example, a Pt (19,1,1) single crystal surface, can also be labelled as a
Pt(S)[10(100)x(111)] with 10 atoms wide (100) terraces and a single atom high
(111) steps. In the FCC system, all planes can be described by various combinations
of the three FCC basal planes (111), (110) and (100). The smooth transition in the
voltammograms, on going from one low index plane to another around the
stereographic triangle (Fig. 2.13), via intermediate high index planes, is apparent.
Figure 2.13. The stereographic triangle for the FCC system, depicting some of the platinum high index planes present between the low index planes .The arc between (111) and (100) plane is called the [ 0 11] zone. On the connection lines the stepped surfaces can be found [G. Somorjai and D. W. Blakely, (1977)].

2. THEORETICAL İpek KILIÇCI
15
2.2. Surface Structures
2.2.1. Wood’s Notation
Wood's notation is the simplest and most frequently used method that describes
a surface structure. It only works, however, if the two unit cells are the same
symmetry or closely-related symmetries. The ratio of lengths of the supper lattice
and substrate lattice vectors, and angle of rotation between them. In addition , one
indicates the angle of rotation which makes the unit mesh of the surface to be aligned
with the basic translation vectors substrate.
Some examples
Figure 2.14. Wood´s and matrix notation for some super lattices on a hexagonal 2D lattice.
Figure 2.15. Wood´s and matrix notation for some super lattices on a square 2D lattice

2. THEORETICAL İpek KILIÇCI
16
Matrix Notation
This is a much more general system of describing surface structures which can
be applied to all ordered over layers: quite simply it relates the vectors b1 & b2 to the
substrate vectors a1 & a2 using a simple matrix i.e.
a1 , a2 , b1 and b2 are vectors.
Dimension of Matrix The dimensions of a matrix refer to the number of rows and columns of a given
matrix. By convention the dimension of a matrix are given by;
number of rows • number of columns
[L. C. Ward and J. L. Stickney, (2001)]
Due to the absence of neighbouring atoms on one side, the forces acting on the
surface atoms are modified. Therefore, one expects that the equilibrium structure of
the top atomic layer differs from the corresponding atomic plane in the bulk. Two
general types of atomic rearrangements are identified as:
1) Relaxation
2) Reconstruction
2.2.2. Relaxation When the atomic structure of the topmost layer is the same as in the bulk but the
first interlayer spacing are modified, is defined as normal relaxation. In addition to
normal relaxation, sometimes uniform displacement of the topmost layers parallel to
the surface takes place. This case is defined as parallel or tangential relaxation [K.
Swammy, (1999)].

2. THEORETICAL İpek KILIÇCI
17
Figure 2.16. a) Normal b) lateral relaxation in the top atomi c layers of a semi- infinite crystal 2.2.3. Reconstruction
When the atomic structure of the top layer is modified is referred to as
reconstruction. It is depending on the number of atoms in the top layer is preserved
or not, two types namely ,
1) Conservative reconstructions
2) Non-conservative reconstructions
1) The number of atoms is conserved and reconstruction contains only displacement
of surface atoms from the ideal sites.
2) The number of atoms in the reconstructed layer is changed in comparison with the
bulk [S. J. Jenkins, (2001)].

2. THEORETICAL İpek KILIÇCI
18
Figure 2.17. a) and c) represent the conservative reconstruction When the number density of surface atoms is preserved b) and d) represent the non- conservative reconstruction in this case when the number density of surface atoms are modified.
Reconstructed Surface of Metals
In contrast to most metal surfaces, which are not reconstructed, the surfaces of
some noble and near-noble FCC metals, Au, Ir and Pt and BCC transition metals, W
and Mo , display reconstructions [V. Fiorentini, (1993)].
Pt (100)
Platinum is a FCC metal and ideal non-reconstructed (100) surface comprises an
arrangement of atoms forming a square lattice. An ideal Pt (100) surface is loosely
packed and is subjected to a large tensile stress unstable.

2. THEORETICAL İpek KILIÇCI
19
Figure 2.18. Hexagonal packing of top-layer Pt atoms on the square Pt (100) atomic plane.
Pt (110)
An ideal (110)-terminated FCC structure consists of atoms arranged in rows
along the (110) direction. Doubled periodicity at Pt (110) is due to the missing-row-
structure [S. J. Jenkins, (2001)] [R. Michaelis and D. M. Kolb, (1992)].
Figure 2.19. a) An ideal non-reconstructed Pt (110)1x1 b) reconstructed Pt (110)2x1 with a missing-row structure.

2. THEORETICAL İpek KILIÇCI
20
2.3. Electrochemical characterization of single crystal surfaces
First of all working under clean conditions is the most important thing of well-
prepared single crystal surfaces. Because of this electrochemical cells must be
cleaned. For many electrochemical experiments, the freshly prepared electrode must
be immersed into the electrolyte under potential control, for example to preserve the
thermally induced reconstruction. The initial potential should chose to lie in the
double-layer region. Because in this region there is no Faraday reactions take place.
Nevertheless, the electrode surface remains are not always unchanged upon
immersion into the electrolyte under potential control and because of this it is an
important and it depends on potential and solution composition [K. Sashikata,
(1991)], [J. Clavilier, (1980)].
2.4. Cyclic voltammetry
This is the simplest and most commonly used technique.It is a type of
potentiodynamic electrochemical measurement and it is ideal for a first
characterization of metal/electrolyte interfaces. Current-potential curves can be used
as fingerprints and allow to get a general idea of the surface quality. Under
examination the electrode potential is cycled between two potential limits at a
constant scan rate. Plotting the measured current density versus the electrode
potential gives typical voltammograms (CV) e.g. for hydrogen, oxygen and anion
adsorption [L. A. Kibler, (2003)].
Different stepped surfaces were subsequently studied by cyclic voltammetry. In
particular, through the extensive work of Clavilier et al. the different single crystal
platinum surface were investigated and the relationship between hydrogen
adsorption-desorption and Pt single crystal surface structure was quantitatively
analyzed. The experimental results have shown that the structure sensitive hydrogen
adsorption/desorption varies systematically with changing indices and that such
voltammograms can be used as a reference for in situ surface characterization. Such

2. THEORETICAL İpek KILIÇCI
21
a general survey of voltammograms for various surfaces of platinum single crystals
is depicted.
Figure 2.20. Shows typical voltammogram of the Pt-crystals [N. Furuya and S. Koide, (1989)].
Blank voltammograms
The potential ranges were chosen with respect to hydrogen evolution, which
starts at 0.06 V, and the beginning oxidation of Pt(100) over 0.8 V, which causes
damage to the surface order and therefore should be avoided.
Examples are given in the figure 2.21. where it can be seen that the current
profile mainly consists of three contributions. The current from 0.06 to 0.2 V has

2. THEORETICAL İpek KILIÇCI
22
been ascribed to hydrogen adsorption/desorption on (111)-steps, from 0.25 to 0.33 V
to competitive anion/hydrogen adsorption/desorption on (100)-terrace edges and
from 0.33 to 0.43 V to the latter process on (100)-terraces. It is clearly visible that
contributions due to processes related with steps increase with the step density, while
those related with processes on terraces diminish with the terrace width.
Figure 2.21. The CVs of Pt stepped single crystals Pt(S)[n(100)x(111)] with n= 2 , 3 and 4 with v = 50 mV/s .
2.5. CV measurements
CV techniques are easy to use and produced useful information about oxide
thickness. To gain good results it is necessary to avoid every kind of contamination
of the cell parts and the solution, which would be directly visible in the
voltammograms. In order to prove that the solution is clean enough for further
experiments, before each experiment a CV of well known basal plane was measured
(Pt (111) or Pt (100)) [F. Hernandez and H. Baltruschat, (2006)].

2. THEORETICAL İpek KILIÇCI
23
2.6. Under potential deposition (UPD)
The adsorption and deposition of metal atoms on foreign metal substrates
represents a very attractive family of systems for study because the strong
adatom/substrate bonding can control the growth behavior and the resulting
structures, especially as a function of surface coverage. Particularly attractive is the
study of such systems by electrochemical means, especially within the context of
underpotential deposition (UPD).
Underpotential deposition (UPD) species at a potentail less negative than the
Nernst equilibrium potential for the reduction of this metal.The occurance of
underpotential deposition is generally explained as a result of strong interaction
between the electrodepositing metal with the substrate. The interaction between the
metal and substrate needs energetically favoured to the metal-metal interaction in the
crystal lattice of the pure metal.
A metal deposition from a metal salt solution on an electrode surface often
can proceed at a potential, which lies above the thermodynamic potential of the
regarded process. This phenomenon is caused by strong interactions between
substrate and adsorbate. The equilibrium potential by the Nernst equation [R.
Francke, (2008)].
Ρ0= ρ00 + RT/ Z.F ln a M+Z
where ρ0 is the Nernst potential, ρ00 the standard potential, z the number of
transferred electrons and aM+Z the activity of metal ions in solution.
In order to understand the under potential deposition, one has to distinguish
between the properties of a monolayer and the bulk metal. In the thermodynamic
consideration the chemical potential of the monolayer μML is lowered in comparison
to the chemical potential of the bulk metal μM, due to interactions between the
electrode surface and the deposited atoms.

2. THEORETICAL İpek KILIÇCI
24
2.7. Electrode Immersion Technique
In this method, the flame-annealed Pt electrode protected by a droplet of water
was immersed in the aqueous metal solution for a fixed length of time to produce an
overlayer of the desired metal coverage. Any excess of metal solution was then
rinsed off and the electrode was transferred to the electrochemical cell as usual. The
immersion in the same metal cation solution could be repeated many times in order
to increase the number of adatoms. One could also simply increase the time of
exposure of the single crystal to the metal cation solution. However, it was found that
a much more controlled method of deposition using immersion was to use different
concentrations of metal ion. Finally, after completion of all metal deposition
experiments, the platinum crystal was removed from the solution and etched in nitric
acid to dissolve away any residual surface adatoms prior to flame-annealing in order
to avoid the possibility of forming an alloy.
2.8. CO oxidation
Carbon monoxide is one of the best characterized adsorbates in catalysis because
of its specific role in many catalytic reactions. Since it is a strongly adsorbed species,
it usually blocks the catalyst’s surface for desired reactions.
In the electrochemical environment, the oxidation of pre-adsorbed CO is known
to proceed through a two-step (Langmuir-Hinshelwood) mechanism. The first step
involves the adsorption of OH, while, in the second step, the adsorbed OH causes
oxidation of CO;
H + 2O + * → OHad + H+ + e-
OHad + COad → 2* + CO2 + H+ + e- [H. A. Gasteiger, (1993)]
where * denotes an empty site on the metal. On Pt, the rate-determining step is the
first reaction, as electro-oxidation starts as soon as OH adsorption sets in. However,

2. THEORETICAL İpek KILIÇCI
25
the second step appears to be the rate-determining one on Ru, as the metal’s surface
is covered with OHad very early in the potential scale, before the onset of oxidation.
2.9. AIM OF THIS WORK
The aim of these experiments is to study adsorption of various metals on
stepped surfaces with (100) terraces. Whether these metals can decorate on the steps
or terraces. It is worked with Tl, Pb and Ru in this experiment. They are just an
example of metal adsorption or the deposition of monolayer on Pt surfaces.
2.9.1. Why Thallium and Lead?
In literature there are not many article about the adsorption of these metals on Pt
surfaces. Copper and some of the other metals were examined before and we have an
idea about these metals, but not for thallium and lead. I wanted to have deposition
monolayer in the potential range between 0 and 1.0 V. It can be adsorbed and
desorbed this metals in this potential range. This is only possible for this metals [N.
Bogolowski, (2008)].
2.9.1.1. Thallium
Chemical element, metal of main Group 13 of the periodic table .When freshly
exposed to air, thallium exhibits a metallic lustre, but soon develops a bluish-grey
tinge, resembling lead in appearance. A heavy oxide builds up on thallium if left in
air, and in the presence of water the hydroxide is formed. The metal is very soft and
malleable. It can be cut with a knife.
The element and its compounds are toxic and should be handled carefully.
Thallium may cause cancer [Gary Attard, (1998)].

2. THEORETICAL İpek KILIÇCI
26
Symbol: Tl
Atomic number : 81
Atomic weight: 204.3833 (2)
Standard state: Solid at 298 K
Atomic Structure of Thallium
Atomic Radius: 2.08 Å
Atomic Volume: 17.2cm3/mol
Covalent Radius: 1.48Å
Cross Section : (Thermal Neutron Capture) a/barns: 3.43
Crystal Structure: Hexagonal
Uses of Thallium:
Its compounds are used in rat and ant poisons. Also for detecting infrared
radiation and heart muscle research.
2.9.1.2. Lead
Lead is the heaviest member of the carbon family. The carbon family consists
of the five elements in Group 14 (IVA) of the periodic table. Lead is known to be a
poisonous metal that is able to bring about blood and brain disorders and can cause
an effect on the nervous connections in the body. Element lead can be found in
concentrations in the crust of the earth, however, element of lead does not form
crystals on its own and therefore the mineral lead is not seen that often.
Symbol : Pb
Atomic number :82
Atomic mass : 207.2

2. THEORETICAL İpek KILIÇCI
27
The Physical Properties of Lead
Color: Light gray to a slight bluish grey color
Hardness: 1.5
Streak: Light gray and has a shiny streak
Transparency: Opaque
Specific gravity: 11.3
Luster: Metallic
Cleavage: No cleavage
Fracture: Hackly
Density: 11.4 qm.cm3
Physical properties
Lead is a heavy, soft, gray solid. It is both ductile and malleable. Ductile means
capable of being drawn into thin wires. Malleable means capable of being hammered
into thin sheets. It has a shiny surface when first cut, but it slowly tarnishes (rusts)
and becomes dull. Lead is easily worked [Gary Attard, (1998)].
Chemical properties
Lead is a moderately active metal. It dissolves slowly in water and in most cold
acids. It reacts more rapidly with hot acids. It does not react with oxygen in the air
readily and does not burn.
2.9.2. Why Ruthenium?
Catalysts of Pt group metals are of technological importance and are used
indispensably in modern chemical industry, petrochemical industry and fuel cells,
owing to their excellent activity and stability.

2. THEORETICAL İpek KILIÇCI
28
In alloys with Pt, Ru has a good catalytic properties for the CO oxidation in
fuel cells. Ruthenium is often studied on Pt single-crystal surface with defined
surface geometry. For preparation process after heating and cooling in a hydrogen
atmosphere process it can be modified with Ru by potential controlled adsorption
from a ruthenium containing solution. But ruthenium single-crystals are harder to
prepare because they are oxidized by oxygen [N. Tian, (2008)] [B. Lanova, (2009)].
2.9.2.1. Ruthenium
Physical Properties of Ruthenium
Atomic Mass Average: 101.07
Boiling Point: 4173K 3900°C 7052°F
Coefficient of lineal thermal expansion/K-1 : 9.1E-6
Conductivity
Electrical: 0.137 106/cm
Thermal: 1.17 W/cmK
Density: 12.37g/cc at 300K
Description:
Ruthenium is a hard, white metal. It does not tarnish at room temperatures, but
oxidises in air at about 800°C. The metal is not attacked by hot or cold acids or aqua
regia, but when potassium chlorate is added to the solution, it oxidises explosively.
Uses of Ruthenium
Used to harden platinum. Also used in eye treatments, thickness meters for egg
shells, fountain pen points, and electrical contacts. Aircraft magnetos use platinum
alloy with 10% ruthenium [B. Lanova, (2009)].

3. LITERATURE SURVEY İpek KILIÇCI
29
3. LITERATURE SURVEY
3.1. Adsorption Test
This is for cleaning the polycrystaline platinum electrode.
0,0 0,2 0,4 0,6 0,8 1,0 1,2 1,4 1,6-0,06
-0,05
-0,04
-0,03
-0,02
-0,01
0,00
0,01
0,02
E
D
C
B
A
I / m
A
E / V vs. RHE
Adsp. test Pt(Pc) in 0.5 M H2SO
4
5 µL/s
Figure 3.1. Scheme of adsorption test.
At section A is desorption of hydrogen from the platinum surface. The
hydrogen adlayer is desorbed in two steps, the reactions being the reverse of those
presented above.
H (ads) → H+ (aq) + e -
At section B there is no current flows in the system, this point is double layer.

3. LITERATURE SURVEY İpek KILIÇCI
30
At section C ; at nearly 0.8V the adsorption of an oxygen species to form a Pt
surface oxide is under way. Oxygen-containing species become strongly
chemisorbed and eventually may enter into the bulk.
Pt + H-O-H → Pt-O-H + H+ +e –
Pt-O-H + H-O-H → Pt-(OH)2 + H+ + e –
Pt- (O-H)2 → Pt-O + H-O-H
At section D is PtO reduction in cathodic direction at nearly 1.2 V.
Pt-O + 2H + + 2e - → Pt + H2O
At section E a hydrogen layer is adsorbed onto the surface in two distinguishable
stages.
Pt + H+ + e - → Pt-H (ads)
3.2. Hydrogen adsorption on the low-indexed Pt single-crystals and on stepped
single-crystals vicinal to the (100) surface in sulphuric and perchloric acid.
The cylic voltammogramms of the low-indexed Pt single-crystals and stepped Pt
single-crystals vicinal to the (100) surface show charcteristic peaks for the adsorption
and desorption of hydrogen and a clear trends for these peaks is visible, when the
surfaces are stepped, especially in sulphuric acid. The voltammograms of these
surface are like “finger-prints”, and they can be used to identify the single-crystals or
to judge about a succesful preparation of the surface.
Figure 3.2. Reprinted from Bogolowski et al , [N. Bogolowski, (2008)] shows
the CVs for the three Pt single crystals Pt (100), Pt (110) and Pt (111) in 0.1 M
H2SO4 with a sweep rate of 50 mV/s which could be considered as ideal infinitely
wide terraces of the basal planes. The charge density in the potential range between 0
and 400 in the CV for the Pt (100) is related to hydrogen adsorption/desorption. The

3. LITERATURE SURVEY İpek KILIÇCI
31
peak for strongly bound hydrogen at the more positive potential of 0.35 V in the
anodic scan has been attributed by Clavelier et. al. [J. Clavilier and D. Armand,
(1986)] to hydrogen desorption from flat (100) terraces, whereas the peak at 0.24 V
is related to hydrogen adsorption at defect sites. The peak in the CV for Pt(110) at a
potential of 0.07 V is related to hydrogen adsorption/desorption. Whether this is on
the reconstructed or on the (1x1), is indistinguishable from the CV in sulphuric acid
[R. Michaelis and D. M. Kolb, (1992)] [R. Michaelis, (1992)]. For the Pt(111) in the
potential range between 0 and 0.35 V vs Pd/H mainly hydrogen is
adsorbed/desorbed. The small peaks at 0.07 and 0.22 V are related to hydrogen
adsorption/desorption on defect sites [J. M. Feliu, (1994)] [A. M. Funtikov, (1995)].
0,0 0,2 0,4 0,6 0,8
-200
-100
0
100
200 Pt(100) Pt(110) Pt(111)
I / µ
A c
m-2
E / V vs. Pd/H
Figure 3.2. Voltammetric profiles of the low-indexed Pt (100), Pt (110) and Pt (111) single-crystal surfaces in 0.1 M H2SO4 v= 50 mV/s [N. Bogolowski, (2008)].
Figure 3.3. Reprinted from Bogolowski et al [N. Bogolowski, (2008)] shows
the CVs for the stepped Pt(S)[n(100)x(111)] single-crystals surfaces with a terrace-

3. LITERATURE SURVEY İpek KILIÇCI
32
width n = 2, 4 and 6. In the potential region between 0 and 0.40 V is related to
hydrogen adsorption/desorption.
0,0 0,2 0,4 0,6 0,8
-200
-100
0
100
200
300
Pt(100) Pt(11,1,1) Pt(711) Pt(311)
I /
µA
cm
-2
E / V vs. Pd/H
Figure 3.3. Voltammetric profiles of the low-indexed Pt (100) and Pt(S)[n(100)x(111)] electrodes with n = 2 , 4 , 6 in 0.1 M H2SO4 v= 50 mV/s [N. Bogolowski, (2008)].
The voltammogramms of the low-indexed Pt single-crystals and stepped Pt
single-crystals vicinal to the (100) surface which recorded in perchloric acid are not
as characteristic as the ones in sulphuric acid, only the CVs of the low-indexed
surfaces differ drastically. Nevertheless, even in perchloric acid, a clear trend for the
influence of steps on the surfaces vicinal to the (100) surface is visible.
Figure 3.4. Reprinted from Francke et al [R. Francke, (2008)] the blank
voltammograms of the Pt(S)[n(100)x(111)] electrodes, with n = 3, 4, 8, 20 and
Pt(100) in 0.1 M perchloric acid with sweep rate v=50 mV/s are shown. They
resemble the shape and peak intensity is used in this work to control the preparation
of the Pt single-crystal. The voltammetric profiles look different from those recorded
in 0.1 M sulphuric acid, but still contain the important peaks with almost the same

3. LITERATURE SURVEY İpek KILIÇCI
33
assignment. According to Francke et al [ R. Francke, (2008)], instead of a
competitive hydrogen/anion adsorptionat potentials underneath 0.5 V hydrogen
adsorption is dominant, while this process is superimposed with OH-adsorption at
potentials higher than 0.5 V, all due to the fact that the perchlorate anion does not
adsorb significantly at Pt surfaces within the applied potential region.
Figure 3.4. Voltammetric profiles of the Pt(S)[n(100)x(111)] electrodes, with n = 3, 4, 8, 20 and Pt(100) in 0.1 MHClO4 v = 50 mV/s. Arrows indicate the increase of the step density. Reprinted from [ R. Francke, (2008)].

3. LITERATURE SURVEY İpek KILIÇCI
34
Figure 3.5. Cyclic voltammograms of the basal planes Pt(111) and Pt(100) in 0.1 M HClO4, v = 50 mV/s. Reprinted from [ R. Francke, (2008)].
3.3. Tl and Pb UPD
The typical voltammogram of the underpotential deposition and desorption of
Tl+ in 0.5 M H2SO4 solution as supporting electrolyte on a Pt (111). At low potential,
all the sites of the surface are blocked for the reversible adsorption of the weakly
bonded hydrogen. II and III peaks are related to central region of the voltammogram.
At the high potential it contains a pair of slightly irreversible sharp peaks Ic and Ia.

3. LITERATURE SURVEY İpek KILIÇCI
35
Figure 3.6. Voltammogram of a Pt (111) orientated electrode in contact with an acidic solution of thallium, 5x10⁻³ M Tl+ in 0.5 M H2SO4; v= 20 mV/s. Reprinted from [J. Clavilier, (1989)].
The effect of the UPD of Pb on the voltammetric features of Pt (100) recorded in
pure 0.1 M HClO4 is easily observed simply by comparing the voltammetry of Pt
(100) with and without Pb+2 as shown below the figure. 3.7.a) reveals that
information of a monolayer of hydrogen in 0.10 M HClO4 occurs through two
distinctive small voltammetric peaks, the first at 0.10 V and second at 0 V. These
two peaks most likely correspond hydrogen adsorption/desorption on (100) terrace
sites and on (100)x(111) terrace-step sites.

3. LITERATURE SURVEY İpek KILIÇCI
36
Figure 3.7. (a) Cyclic voltammogram for Pb UPD in 0.1 M HClO4 on the Pt (100) disk electrode in a RRDE assembly. Base voltammogram without Pb+2
in solution under otherwise identical conditions is shown for comparison. (b) Ring electrode current with the ring being potentiostated at 0.65 V. Insert: Integrated charges for the stripping of Pb from the disk electrode assessed from ring (ISC) and disk (TDC) uppdotentiodynamic curves. Rotation rate 900 rpm; sweep rate 50 mV/s.
The cyclic voltammograms of Pt (111) in 0.1 M HClO4 free of lead, and in the
presence of 5x10⁻⁵ M Pb+2 are shown in below the figure 3.8. The CV shows a
characteristic broad hydrogen adsorption wave, -0.22 < E < 0.1 V, and the so-called
“butterfly peak” at 0.3-0.6 V, which corresponds to adsorption of hydroxyl species.

3. LITERATURE SURVEY İpek KILIÇCI
37
Figure 3.8. a) Cyclic voltammograms of Pt(111) mounted in the disk position of the RRDE in 0.1 M HClO4 and 5x10⁻⁵ M Pb+2 : rotation rate , 900 rpm ; sweep rate , 50 mV/s b) Ring electrode currents recorded with the ring being potentiostated at -0.59 V.
3.4. Effect of Ru deposition on the CO oxidation at Pt single-crystals
The sequence of deposition of Ru has a minor influence on the shape of the mass
spectrometric cyclic voltammograms. The onset of CO oxidation is lowered to
similar values as on the corresponding Pt-surfaces modified by Sn alone, which is
much lower than achieved by modification with Ru alone.

3. LITERATURE SURVEY İpek KILIÇCI
38
Figure 3.9. Shows the CV of oxidation of adsorbed CO at Pt(111) covered by (submonolayers of) Ru and Sn. CVs are shown in 3.9.a) ; MSCVs (mass spectrometry cyclic voltammetry) for CO2 are shown in 3.9.b) dE/dt=10 mV/s , 0.5 M H2SO4 (__) deposition of Ru followed by deposition of Sn (- - - ) deposition of Sn followed by deposition of Ru(-.-.-) only deposition of Sn(…) bare Pt-surface for comparison. Reprinted from [H. Massong, (2000)].
.

4. MATERIALS AND METHODS İpek KILIÇCI
39
4. MATERIALS AND METHODS
4.1. Materials
4.1.1. Chemicals
Table 4.1. The chemicals that used in this work.
Name / Formula Description / Company Typical Use
Sulphuric acid
H2SO4
% 95-97 Aldrich Base electrolyte
Perchloric acid
HCl4
% 70 Aldrich Base electrolyte
Ruthenium (III) chloride
RuCl3
Aldrich Electrolyte for Ru
deposition
Lead (II) perchlorate
Pb(ClO4)2
% 99 Aldrich Electrolyte for Pb deposition
Thallium (I) sulfate
Tl2SO4
% 99 Aldrich Electrolyte for Tl deposition
Potassium hydroxide
KOH
Aldrich Tip etching solution
Platinum
Pt wire
ChemPur GmbH
0.5 mm diameter
For Pt single-crystals
Argon
Ar ( Gases )
Praxair 5.0 Degassing of the electrolyte
and preparation of single
crystals
Hydrogen
H2 ( Gases )
Praxair 6.0 Preparation of single crystals

4. MATERIALS AND METHODS İpek KILIÇCI
40
The Milli-Q-Water System
In this work the Milli-Q plus system (Millipore, Watford, Hertfordshire) is
used to produce ultra-pure water which contained very low levels of organic
material. The system is capable of producing up to 1.5 litres per minute of ultra-pure
18.2 MΩ cm receptivity water with a total organic content of less than 10 parts per
billion. Ultra-pure water is used for cleaning glassware and for the preparation of all
electrolyte solutions.
4.1.2. Apparatus
• An electrochemical cell with the cell accessories (hydrogen reference electrode
platinum counter electrode, Teflon crystal holder and gas caps)
• A variety of glassware (beakers, measuring cylinders, volumetric flasks, pipettes
and gases bubblers)
• A series of platinum single crystal electrodes
4.1.3. The Bead Single Crystal Teflon-Holder
The single-crystal holder has two steel rods for electrode contact inside the
Teflon-holder. The Teflon holder can be easily moved up and down . The single-
crystal itself was contacted via two small Pt-wires, one wrapped around the end of
the Pt wire where the crystal was made of, the other at the beginning of the bead
single-crystal , to screw holes at the end of the steel rods. This setup allows easily
varying the distance between the crystal surface and solutions to have a good
hanging meniscus-configuration and resistive heating of the crystal [N. Bogolowski,
(2008)].

4. MATERIALS AND METHODS İpek KILIÇCI
41
Figure 4.1. The Pt-electrodes with Teflon-holder.
4.1.4. Electrochemical Instrumentation
4.1.4.1 The Electrodes
a) Working electrodes
I studied with Pt electrodes as a working electrodes. For quantitative
electrochemical analysis in laboratories; Platinum electrodes of various types are
used in this work.
• Flat single crystals: Pt (111) and Pt (100)
• Stepped single crystals: Pt (511) , Pt (11,1,1) , Pt (19,1,1)
Why platinum?
Platinum is a lustrous, silvery-white, malleable and ductile metal. It is
unaffected by air and water, and will only dissolve in aqua regia and molten alkalis

4. MATERIALS AND METHODS İpek KILIÇCI
42
[A. M. Bittner, (1997)]. There are a lot of reasons for choice of platinum for the
hydrogen electrode :
♦ Inertness of platinum (it does not corrode)
♦ The capability of platinum to catalyze the reaction of proton reduction
♦ A high intrinsic exchange current density for proton reduction on platinum (see the
data in the table for comparison of platinum with other materials)
♦ Excellent reproducibility of the potential (bias of less than 10 μV when two well-
made hydrogen electrodes are compared with one another.
Melting Point : 1772 °C
Lattice Constant : 3.9231 Å
Atomic Diameter : 2.774 Å
b) Reference electrodes and Counter electrodes
In this work it is used hydrogen electrode as reference electrode and a
platinum electrode as counter electrode. To keep it free from contamination, it was
stored in 0.1 M H2SO4 for thallium and ruthenium experiments and in 0.1 M HClO4
for lead experiments.
A reference electrode is an electrode which has a stable and well-known
electrode potential. The high stability of the electrode potential is usually reached by
employing a redox system with constant (buffered or saturated) concentrations of
each participants of the redox reaction.
Reference electrodes, as their name suggests, are used to give a value of
potential to which other potentials can be referred in terms of a potential difference—
potentials can only be registered as differences with respect to a chosen reference
value. Thus, a good reference electrode needs to have a potential that is stable with
time and with temperature and which is not altered by small perturbations to the
system—that is, by the passage of a small current. There are three types of reference
electrode:

4. MATERIALS AND METHODS İpek KILIÇCI
43
• Type 1: e.g. the hydrogen electrode
• Type 2: e.g. the calomel electrode
• Others: e.g. glass electrodes, Type 3 electrodes, etc.
The reference electrode is used in the H-cell experiments is a reversible
hydrogen electrode (RHE) in 0.1 M H2SO4 and HClO4. In principle, vacuum is
applied to the open arm of the glass cylinder to fill the bulb of the electrode with
electrolyte. The electrode is then connected to the negative terminal of a dc power
supply (10-20 V) using a Pt wire as the counter electrode, in the same electrolyte. Pt
wire was briefly immersed in concentrated HCl to remove traces of foreign metals
and oxide, then flame-annealed for a few seconds.
Due to the electrolysis of the sulphuric acid solution, hydrogen is generated on
the negative electrode, while oxygen evolves from the counter electrode. The
hydrogen bubble displaces the solution inside of the bulb, creating a gas/liquid
interface in contact with the Pt wire. This vacuum and electrolysis procedure is
repeated one more time in order to make sure that the bubble trapped in the bulb is
pure hydrogen without traces of atmospheric oxygen. The electrode is stored in the
glass cylinder, keeping the bulb immersed in electrolyte. Fresh reference electrodes
must be prepared often and handled with care to avoid variations in the potential due
to atmospheric oxygen entering the bulb.
Hydrogen electrode is based on the redox half cell.
2H+ (aq) + 2e- → H2 (g)
This redox reaction occurs at platinized platinum electrode. That implies that the
pressure of hydrogen gas is 1 bar and the concentration of hydrogen in the solution is
1 molar. The Nernst equation should be written as: Equation is taken from [R.
Francke, (2008)].
or

4. MATERIALS AND METHODS İpek KILIÇCI
44
4.1.4.2 The Cell
The cell is made of borosilicate glass and consists of three sections; the body of
the cell, one compartment for the reference and one for the counter electrode.
The body of the cell has room for the working electrode and the electrolyte. A
glass tube coming from the back part of the cell can be used as inlet to bubble gas in
the electrolyte. A stopcock allows to adjust precisely the electrolyte level.
The reference electrode compartment is connected to the cell body with a
Luggin capillary. Since there is a stopcock separating them, different solutions can
be used in both chambers; this is advantageous when working with electrolytes
containing metal ions which could contaminate the reference electrode. The stopcock
is made of glass, and thus hydrophilic. The thin layer of electrolyte wetting the glass
has sufficient conductivity to keep potential control even if the stopcock is closed. A
fritted glass disk separates the counter electrode compartment from the main room of
the cell.
4.1.4.3 The Potentiostat
In this work it is used Potentiostat / Galvanostat Model 273.It is for use with
Solartron 1260 EIS-Analyzer. This model has :
♦ High Sensitivity, Low Noise Signals
♦ High Speed Current Measurement
♦ Easy Front Panel Operation
♦ GPIB and RS232 Interfaces
♦ Many Advanced Features

4. MATERIALS AND METHODS İpek KILIÇCI
45
Figure 4.2. Potantiostat/Galvonostat Model 273
4.1.5. Glassware
First of all, in my work cleaning is the most important thing. All the glassware
must be very clean and degreased before every experiment. Cleaning with water is
not enough.To dispose of traces of metal ions, the glassware is soaked overnight in
chromic acid (640 ml of concentrated H2SO4 + 360 ml H2O + 21.4 g CrO3) at room
temperature. Chromic acid generally refers to a collection of compounds generated
by the acidification of solutions containing chromate and dichromate anions or the
dissolving of chromium trioxide in sulphuric acid. After that, it is rinsed widely with
Millipore water and stored in 5 M KOH solution to keep it free from grease. If the
glassware is not contaminated metal ions or organic molecules, it is not important to
soaked in chromic acid.
Cleanliness can be checked with a simple adsorption experiment using a Pt
electrode before the main experiment. The Pt electrode is cycled several times in the
electrolyte. When obtaining a steady CV, the potential is stopped in the double-layer
region and kept there for a few minutes. After that, the potential scan is continued in
the cathodic direction.
4. MATERIALS AND METHODS İpek KILIÇCI
46
4.2. Methods
4.2.1. Preparation of well-ordered noble metal single crystal surfaces
Explanations of measurements to get ease and not to be misleading, we should
be able to prepare reproducibly well ordered surfaces for all basic electrochemical
investigations. A well-ordered low-index surface must be atomically flat, having
large terraces separated by monoatomic high [J. Clavilier, (1980)], [K. Sashikata,
(1991)], [S.L. Yau, (1996)].
The small spherical single crystals, which are often used for the flame
annealing and quenching method are usually prepared by melting one end of a high
purity wire. A well-prepared bead consists of (111) facets in an octahedral
configuration consists of large terraces, separated by monoatomic high steps [J.
Clavilier, (1980)], [P. N. Ross and F. T. Wagner, (1984)] , [M. P. Soriaga, (1992)].
4.2.2. Calculation of Charge in Cyclic Voltammetry
Charge associated with a cyclic voltammetry could be determined by two
methods:
• Manual technique of cutting and weighing the peaks and then taking the ratio of the
peak weight to a rectangle of a known area and weight.
• the second method, which was employed in the present study, by using a computer
program to calculate the charge.
In the second method, after displaying the cyclic voltammogram on a monitor,
the area between two potential limits could be calculated automatically by computer
which then converts this number to charge density.

5. EXPERIMENTAL RESULTS AND DISCUSSION İpek KILIÇCI
47
5. EXPERIMENTAL RESULTS AND DISCUSSION
5.1. Tl UPD on Pt (111), Pt (100), Pt( 11,1,1) and Pt (511)
5.1.1. Voltammetry of the unmodifed Pt bead single–crystal surfaces in H2SO4
The desired Pt bead single crystal is cleaned by potential cycling in the range
between 0.05 V and 1.5 V in 0.1 M sulphuric acid, performing several electrolyte-
exchanges at 1,5 V. Then the crystal is annealed in a bunsen-burner flame for 45 s to
a pale red colour, and afterwards allowed to cool down in a hydrogen atmosphere
over MilliQ-water. Protected by a droplet of hydrogen saturated MilliQ-water, the
electrode is transferred to the H-cell. Electrolyte contact is performed under potential
control in a hanging meniscus configuration. To control the success of the
preparation of the single-crystal surface by annealing, a CV is recorded in a potential
range between 0.05 V and 0.8 V in 0.1 M sulphuric acid and compared to those
reported in literature, e.g. [R. Francke, (2008)], [N. Bogolowski, (2008)]. After a
successful preparation, the electrode is transferred to another cell, protected by an
argon saturated droplet of sulphuric acid, with a Tl or Ru containing electrolytes,
where e.g. the Tl UPD on the surface is investigated. Before immersion to an
electrolyte containing Pb, i.e. a lead containg perchlorate solution, the electrode
surface is rinsed with water to wash away the sulphate from the surface, because Pb
forms insoluble salts with sulphate.
Figure 5.1. Shows the CVs for the unmodified electrodes of Pt(100) and
Pt(111) in 0.1 M H2SO4. At 0.38 V in the CV for the Pt (100) is related to hydrogen
adsorption/desorption. The peaks at 0.30 V and 0.35 V are related to hydrogen
adsorption at defect sites. According to literature , the hydrogen peak at 0.38 V
should be sharper and higher [R. Francke, (2008)]. For Pt (111) the CV can be
divided in two region. In first region in the potential range between 0.05 and 0.35 V
vs. RHE hydrogen is adsorbed/desorbed .The small peaks at 0.10 V and 0.25 V are
related to hydrogen adsorption/ desorption on defect sites [D. R. Wheeler, (1995)].In
the second region in the voltammogram between 0.35 V and 0.50 V sulphate

5. EXPERIMENTAL RESULTS AND DISCUSSION İpek KILIÇCI
48
adsorption takes place. The “spike” at 0.49 V in the voltammogram indicates a
phase–transition within the sulphate adlayer [A. M. Funtikov, (1997)]. At the
potential range between 0.65 V and 0.80 V in the CV contains a pair of slightly
irreversible sharp peaks.
0 ,0 0 ,1 0 ,2 0 ,3 0 ,4 0 ,5 0 ,6 0 ,7 0 ,8 0 ,9-1 5 0
-1 0 0
-5 0
0
5 0
1 0 0
1 5 0 P t ( 1 0 0 ) P t ( 1 1 1 )
J / µ
Α .
cm-2
E / V v s . R H E
v = 5 0 m V / s
Figure 5.1. Recorded CVs of the two basal plane single-crystals in 0.1 M H2SO4
with v = 50 mV/s.
Figure 5.2. Shows the CVs for the unmodified Pt(S)[n(100)x(111)]-electrodes
with n = 3 , 6 stepped single-crystal surfaces vicinal to the (100) surfaces and the
CV for the Pt (100) surfaces in 0.1 M H2SO4. The potential range between 0.05 V
and 0.17 V is related to hydrogen adsorption on step-sites with local (110) geometry.
With increasing step-density on the Pt(S)[n(100)x(111)] surface, a clear trend for the
sharp peak at around 0.25 V, assigned to hydrogen adsorption/desorption on the step
sites, is visible. The charge-density of this peak increases with increasing step
density.
For Pt (511) at the 0.29 V in the voltammogram is related to hydrogen
adsorption and desorption peak at step sides.
For Pt (11,1,1) the sharp peak at 0.28 V , assigned to hydrogen/anion adsorption
on the step sites in figure 5.2. In the same time, the peaks at potential around 0.40 V,

5. EXPERIMENTAL RESULTS AND DISCUSSION İpek KILIÇCI
49
that is assigned to adsorption at terrace sites, decrease. As compared to literature the
peaks for hydrogen adorption/desorption from step sites should be sharper [R.
Francke, (2008)].
0 ,0 0 ,1 0 ,2 0 ,3 0 ,4 0 ,5 0 ,6 0 ,7 0 ,8 0 ,9-2 5 0
-2 0 0
-1 5 0
-1 0 0
-5 0
0
5 0
1 0 0
1 5 0
2 0 0
P t ( 1 0 0 ) P t ( 1 1 , 1 , 1 ) P t ( 5 1 1 )
J / µ
Α .
cm-2
E / V v s . R H E
v = 5 0 m V / s
Figure 5.2. CVs of Pt stepped single crystals Pt(S)[n(100)x(111)] with n= 3 , 6 and Pt (100) in 0.1 M H2SO4 with v=50 mV/s.
For the CVs in figure 5.1. and 5.2. in the potential range of 0.10 V to 0.45 V a
charge-density of these CVs are integrated after correction of double-layer
contribuation and they are summarized in Table 5.1.
Table 5.1. Charge of various Pt-single crystals for the integration limit is between 0.10 and 0.50 V. For Pt (111) integration limit is between 0.10 and 0.45 V. Single Crystal
Charge / µC.cm-2
Pt (100 )
≈221
Pt (111 )
≈188
Pt (511 )
≈302
Pt (11,1,1)
≈270

5. EXPERIMENTAL RESULTS AND DISCUSSION İpek KILIÇCI
50
5.1.2. Diffusion controlled Tl UPD on Pt(111) , Pt(100) , Pt(511) and Pt(11,1,1)
After the recording a voltammogram of the as prepared electrode in the base
electrolyte , the electrode is transferred into the containing 1x10⁻³ M or 1x10⁻⁶ M
Tl2SO4 solution and a voltammogram is recorded in the second cell. The Pt (111)
electrode is cycled in the thallium solution for more than fifty cycles.
The Figure 5.3 shows the typical voltammogram of the underpotential
deposition and desorption of Tl+ in 1x10⁻³ M Tl2SO4 on a Pt (111) electrode.
According to Oda et al [I. Oda, (1996)] there is a strong suppression of the hydrogen-
UPD region by adsorbed Tl in the potential range between 0.05 V an 0.35 V. The
broad peak at positive potentials is related to the adsorption of sulphate and shows a
sharp peak at 0.54 V which as in the case for the thallium free electrolyte is related to
a phase transition in the sulphate-adlayer structure [ A. M. Funtikov, (1997)].
The charge of this peak integration limit between 0.40 V and 0.60 V is ≈108
µC.cm-2. The sharp irreversible peak pair at an anodic potential of 0.78 V and a
cathodic potential of 0.76 V is according to Oda et al related to a phase-Transition
from a 7x3 - to a °30R3x3 -overstructure of the Tl-Adlayer after completion of
the Tl-Monolayer. The charge of this peak at an anodic potential 0.78 V is ≈61
µC.cm-2 and at an cathodic potential 0.76 V is ≈51 µC.cm-2 which closed to
theoretical value of ≈56 µC.cm-2 and ≈50 µC.cm-2 [J. Clavilier, (1989)] , [D. R.
Wheeler, (1995)].

5. EXPERIMENTAL RESULTS AND DISCUSSION İpek KILIÇCI
51
0.0 0.1 0.2 0.3 0.4 0.5 0.6 0.7 0.8 0.9
-60
-40
-20
0
20
40
60
80
J / µ
Α .
cm-2
E / V vs. RHE
Pt (1 1 1)
Figure 5.3. The CVs for Tl / Pt (111) in 10-3 M Tl2SO4 + 0.1 M H2SO4 with v=10 mV/s.
To test the cell setup, to train the electrode transfer and to have a comparison to
the diffusion controlled Tl UPD experiments performed on the stepped single-crystal
surface, firstly an experiment on the Tl UPD on Pt (111) is performed. And after that
Pt (100) and stepped-crystals are performed.
Figure 5.4. Shows the voltammogram of the underpotential deposition and
desorption of Tl+ in 1x10⁻⁶ M Tl2SO4 solution on a Pt (11,1,1) electrode. After
transferring the electrode from the base electrolyte, It cycled in the thallium
containing solution for more than sixty cycles. Already in the first cycle, the sharp
hydrogen adsorption peak at the 0.28 V and at the 0.40 V Tl dissolution. After sixty
cycles it suppressed and the hydrogen adsorption peak shifted to the positive
potential and the thallium peak height was decreased. In the potential range between
0.05 V and 0.17 V, the defect -sites are not totally suppressed. In the potential range
between 0.50 and 0.80 V is related to sulphate sites. The charge of (111) step sites
for Tl/Pt crystal is ≈126 µC.cm-2 and for after preparation of Pt crystal is ≈140
µC.cm-2. This is about 10% of the step-sites blocked by adsorbed Tl. The charge of
(100) terrace-sites for Tl/Pt crystal is ≈135 µC.cm-2 and for after preparation of Pt

5. EXPERIMENTAL RESULTS AND DISCUSSION İpek KILIÇCI
52
crystal is ≈142µC.cm-2. This is about 5% of the terrace-sites blocked by adsorbed Tl.
It should be noted there integration limit for terrace in the potential range between
0.32 V and 0.48 V. For the charge results it seems to be there is no preferential on
step-sites, whereas from the CV in figure 5.4. one can conclude that Tl preferentially
adsorbs at step sites.
0 ,0 0 ,2 0 ,4 0 ,6 0 ,8-20 0
-15 0
-10 0
-5 0
0
5 0
100
150
a fte r p re p . P t (1 1 , 1 ,1 ) T l/P t (1 1 , 1 ,1 )
J / µ
Α .
cm -2
E / V vs . R H E
v = 5 0 m V / s
Figure 5.4. The CVs for Tl deposition ( __ ) on Pt (11,1,1) in 1x10⁻⁶ M Tl2SO4 + 0.1 M H2SO4 and after preparation ( . . . ) with v= 50 mV/s.
Figure 5.5. Shows the voltammogram of the underpotential deposition and
desorption of Tl+ in 1x10⁻⁶ M Tl2SO4 solution on a Pt (511) electrode. It is cycled in
the thallium solution for more than sixty cycles. In the first cycle the sharp peak is
hydrogen adsorption peak at the 0.28 V and at the 0.40 V Tl dissolution. Peaks are
suppressed faster during the potential cycling preferential Tl on step. After sixty
cycles it suppressed and step can decorate. The hydrogen adsorption peak and the
thallium peak height decreased and totally conclude.
The charge of (111) step sites for Tl/Pt crystal is ≈128 µC.cm-2 and for after
preparation of Pt crystal is ≈176 µC.cm-2. This is about 27% of the step-sites blocked
by adsorbed Tl. The charge of (100) terrace sites for Tl/Pt crystal is ≈58 µC.cm-2 and

5. EXPERIMENTAL RESULTS AND DISCUSSION İpek KILIÇCI
53
for after preparation of Pt crystal is ≈62µC.cm-2 .This is about %4 of the terrace-sites
blocked by adsorbed Tl .The charge for the orientated defects sites for Tl/Pt crystal is
≈72 µC.cm-2 and for after preparation of Pt crystal is ≈99 µC.cm-2 .Tl is covered 27%
from orientated defect sites. According to this result; Tl is blocked step-sites of Pt.
There is no adsorption/desorption. At low concentration (1x10⁻⁶ M) difficult to say
anything definite but that seems to be Tl preferentially adsorb at the step sites.
0,0 0 ,1 0 ,2 0 ,3 0 ,4 0 ,5 0 ,6 0 ,7 0 ,8 0 ,9-250
-200
-150
-100
-50
0
50
100
150
200
a fte r p re p . P t ( 5 1 1 ) T l / P t ( 5 1 1 )
J / µ
Α .
cm-2
E / V vs . R H E
v = 5 0 m V / s
Figure 5.5. The CVs for Tl deposition (__) on Pt (511) in 1x10⁻⁶ M Tl2SO4 + 0.1 M H2SO4 and ( . . . ) after preparation in 0.1 M H2SO4 with v= 50 mV/s.
Figure 5.6. Shows the voltammogram of the underpotential deposition and
desorption of Tl+ in 1x10⁻⁶ M Tl2SO4 solution on a Pt (100) electrode at the potential
range between 0.10 and 0.80 V. Due to the fact, that the adsorption time was too
short, the blockage by Tl is incomplete in this very dilute solution. At the high
potential maybe there is some peak but in this potential range there is not any peak.

5. EXPERIMENTAL RESULTS AND DISCUSSION İpek KILIÇCI
54
0,0 0 ,1 0,2 0,3 0 ,4 0,5 0 ,6 0,7 0,8 0,9-150
-100
-50
0
50
100
150J
/ µΑ
.cm
-2
E / V vs. RHE
after prep. P t(100) T l/Pt (100)
v = 50 m V/s
Figure 5.6. The CVs for Tl deposition ( __ ) on Pt (100) in 1x10⁻⁶ M Tl2SO4 + 0.1 M H2SO4 and ( . . . ) after preparation in 0.1 M H2SO4 with v= 50 mV/s.
Figure 5.7. Shows the voltammogram of the underpotential deposition and
desorption of Tl+ in 1x10⁻³ M Tl2SO4 solution on a Pt (111) electrode at the potential
range between 0.10 and 0.80 V with v=50 mV/s. In this figure can see directly, all
peaks shifted more positive potential. Hydrogen is totally blocked.

5. EXPERIMENTAL RESULTS AND DISCUSSION İpek KILIÇCI
55
0 ,0 0 ,1 0 ,2 0 ,3 0 ,4 0 ,5 0 ,6 0 ,7 0 ,8 0 ,9-2 0 0
-1 5 0
-1 0 0
-5 0
0
5 0
1 0 0
1 5 0
2 0 0 T l /P t ( 1 1 1 ) a f te r p re p . P t(1 1 1 )
J / µ
Α .
cm-2
E / V v s . R H E
s c a n = 5 0 m V
Figure 5.7. The CVs for Tl deposition (__) on Pt (111) in 1x10⁻³ M Tl2SO4 + 0.1 M H2SO4 and (. . .) after preparation in 0.1 M H2SO4 with v= 50 mV/s.
5.2. Pb UPD on Pt (100) and the stepped Pt single-crystal Pt (19,1,1), Pt (11,1,1)
and Pt (511)
5.2.1. Voltammetry of the unmodified Pt bead single-crystals in perchloric acid
After preparation of the single-crystals by flame annealing, as described in
chapter 5.1.1. , the different bead single- crystals are brought in contact with a 0.1 M
HClO4 at a potential of 0.05 V in a hanging meniscus configuration and CV is
recorded with a sweep rate of 50 mV/s.
For the figure 5.8. Shows the voltammogram of the preparation for the Pt(S)
[n(100)x(111)] with n = 3, 6 and 10 stepped single-crystal surfaces and Pt (100)
surface. The CV are in good agreement with those previously reported by Clavilier
and Domke et al [A. Rodes, (1991)] [K. Domke, (2003)]. The peak in the potential
range between 0.25-0.5 V in the CV for the Pt (100) is related to hydrogen
adsorption /desorption. The peaks in the potential range between 0.25 and 0.35 V

5. EXPERIMENTAL RESULTS AND DISCUSSION İpek KILIÇCI
56
increase with increasing step-density, so do the peaks in the potential region between
0.05 and 0.25 V. These peaks are related to hydrogen adsorption/desorption on step-
sites. The peaks between 0.35 and 0.50 V are related to hydrogen
adsorption/desorption on the (100) terrace sites, and therefore decrease with
increasing step density.
0 ,0 0 ,1 0 ,2 0 ,3 0 ,4 0 ,5 0 ,6 0 ,7 0 ,8 0 ,9
-1 0 0
-8 0
-6 0
-4 0
-2 0
0
2 0
4 0
6 0
8 0
1 0 0
1 2 0 P t ( 1 0 0 ) P t ( 1 9 , 1 , 1 ) P t ( 1 1 , 1 , 1 ) P t ( 5 1 1 )
J / µ
Α c
m-2
E / V v s . R H E
v = 5 0 m V / s
Figure 5.8. Voltammetric profiles of the Pt(S)[n(100) _ (111)] electrodes, with n = 3, 6, 10 and Pt (100) in 0.1 M HClO4. Sweep rate = 50 mV/s.
Figure 5.9. In the potential range between 0.05 and 0.35 V vs. RHE hydrogen is
adsorbed/desorbed .The small peaks at 0.10 and 0.32 V are related to hydrogen
adsorption/ desorption on defect sites. At the 0.8 V in the CV is related to ClO4-
adlayer. This CV is a good agreement with literature [R. Francke, (2008)].

5. EXPERIMENTAL RESULTS AND DISCUSSION İpek KILIÇCI
57
0.0 0.2 0 .4 0 .6 0 .8 1 .0
-60
-40
-20
0
20
40
60
P t ( 1 1 1 )J
/ µΑ
. cm
-2
E / V vs. R H E
v = 50 m V / s
Figure 5.9. Recorded CVs Pt (111) in 0.1 M HClO4 with v =50 mV/s.
For the CVs in figure 5.8. and 5.9. in the potential range between 0.10 and 0.50 V
and for Pt (111) is between 0.10 and 0.70 V a charge-density of these CVs are
integrated after correction of double-layer contribution and they are summarized in
Table 5.2.
Table 5.2. Charge of various Pt-single crystals.
Single Crystal Charge / µC.cm-2
Pt (19,1,1) ≈198
Pt (11,1,1) ≈307
Pt (511) ≈242
Pt (100) ≈232
Pt ( 111) ≈221

5. EXPERIMENTAL RESULTS AND DISCUSSION İpek KILIÇCI
58
5.2.2. Pb UPD on Pt(100), Pt(19,1,1), Pt(11,1,1) and Pt(511) from Pb(ClO4)2
contianing solution
Figure 5.10. a) and b) shows the voltammogram of the Pb-upd on the
Pt(S)[n(100)x(111)] with n = 3 , 6 and 10 stepped single-crystal surfaces and Pt
(100) surface with v = 10 mV/s and v = 50 mV/s recorded after immersion into a
1x10⁻³ M Pb(ClO4)2 containing 0.1 M HClO4. In the potantial range between 0.5-
0.85 V in the CV, no peaks for hydrogen are visible any more, instead a large peak at
0.76 V is visible, which is related to Pb adsorption and desorption. Pb totally blocks
the surface for H-upd. At potentials above 0.80 V, the Pb dissolves as Pb2+. With
increasing step density on the Pt(S)[n(100)x(111)] surface, the sharp peak at around
0.76 V, assigned to Pb adsorption on the step sites, decreases. There is no further
peak visible for the adsorption of Pb on the step-sites. This might be due to the fact
that Pb is very large, as compared e.g. to copper, where for the underpotential
deposition 2 peaks are visible -one for Cu UPD on the step sites and one for Cu UPD
on the terrace sites, and is only adsorbed on the terrace sites. Another reason might
be that Pb deposited on the step-sites desorbs at fairly higher potentials. The charge
density for the Pb upd on the Pt (100) surface is much lower than the charge-density
observed on the stepped surface. For the CV of the Pt (100); it seems to be a problem
either in the preparation or with the electrolyte solution .If compare it to result of
Markovic et al the peak should be much larger [N. M. Markovic, (1998)].

5. EXPERIMENTAL RESULTS AND DISCUSSION İpek KILIÇCI
59
a)
0 ,0 0 ,2 0 ,4 0 ,6 0 ,8 1 ,0- 3 0 0
- 2 0 0
- 1 0 0
0
1 0 0
2 0 0
3 0 0
P t ( 1 0 0 ) P t ( 1 9 , 1 , 1 ) P t ( 1 1 , 1 , 1 ) P t ( 5 1 1 )
J / µ
Α .
cm
-2
E / V v s . R H E
v = 5 0 m V / s
b)
0 ,0 0 ,2 0 ,4 0 ,6 0 ,8 1 ,0-8 0
-6 0
-4 0
-2 0
0
2 0
4 0
6 0
8 0 P t ( 1 0 0 ) P t ( 1 9 , 1 , 1 ) P t ( 1 1 , 1 , 1 ) P t ( 5 1 1 )
J / µ
Α .
cm
-2
E / V v s . R H E
v = 1 0 m V / s
Figure 5.10. Voltammetric profiles of the Pt(S)[n(100)x(111)] electrodes, with n = 3, 6, 10 and Pt(100) in 1x10⁻³ M Pb(ClO4)2 + 0.1 M HClO4
a ) v = 50 mV/s. b) v = 10 mV/s.
Figure 5.11. a) and b) shows the voltammogram of the Pt (111) in 1x10⁻³ M
Pb(ClO4)2 solution. At 0.65 V in the CV is related to Pb adsorption and desorption
peaks. The total charge of anodic side is ≈301 µC.cm-2. This is good agreement with

5. EXPERIMENTAL RESULTS AND DISCUSSION İpek KILIÇCI
60
literature. Literature, where, a value of 304 µC.cm-2 is reported [B. N. Gurgur,
(1997)] [H. Massong, (1998)].
0,0 0,1 0,2 0,3 0,4 0,5 0,6 0,7 0,8 0,9
-80
-60
-40
-20
0
20
40
60
80 Pt ( 1 1 1 )
J / µ
Α .
cm-2
E / V vs. RHE
v = 50 mV / s
0,0 0,1 0,2 0,3 0,4 0,5 0,6 0,7 0,8 0,9
-15
-10
-5
0
5
10
15
20 Pt ( 1 1 1 )
v = 10 mV / s
J / µ
Α .
cm-2
E / V vs. RHE
Figure 5.11. CVs for Pt (111) in 1x10⁻³ M Pb(ClO4)2 + 0.1 M HClO4 with a) v= 50 mV/s b) v = 10 mV/s. Table 5.3 shows the charge density of the UPD peaks comparison. In the
potential range between 0.62 and 0.83 V and for Pt (111) is between 0.10 and 0.70
V a charge-density of these CVs are integrated after correction of double-layer
contribuation and they are summarized in table 5.3. It should be noted there; due to
correction of double-layer contribution, the charge value that is measured can be
more or less than these value.
Table 5.3. Charge density of various Pt-single crystals
Single Crystals Charge / µC.cm-2 for
V = 50 mV/s
Charge / µC.cm-2 for
v = 10 mV/s
Pt (19,1,1) ≈239 ≈ 253
Pt (11,1,1) ≈ 261 ≈ 258
Pt (511) ≈ 244 ≈ 279
Pt (100) ≈ 159 ≈177
Pt (111) ≈ 266 ≈301

5. EXPERIMENTAL RESULTS AND DISCUSSION İpek KILIÇCI
61
5.2.3. Cyclic Voltammetry of Pb / Pt-surfaces in HClO4 solutions
Figure 5.12. shows the voltammogram of Pb/Pt in 0.1 M HClO4 electrolyte
the Pt(S) [n(100)x(111)] with n = 3 , 6 and 10 stepped single-crystal surfaces and Pt
(100) after transferring the electrode back to the pure base electrolyte. It is immersed
the electrodes form the Pb containing electrolyte at high potential. It is holded for a
one or two minutes. It is rinsed the electrodes with MilliQ-water before immersion.
Compared to the voltammograms of the clean Pt electrode, the hydrogen adsorption
on step and terrace sites seem to be slightly blocked after performing the Pb upd
experiments. This might be due to some residual Pb due to insufficient rinsing of the
electrode before re-emmersion into to Pb free base electrolyte, or an incomplete
desorption of Pb at the emmersion potential from the Pb containing electrolyte.
Another possibility is, that due to the ongoing adsorption/desorption of Pb on the
surface, the surface is roughened afterwards.
0 .0 0 .2 0 .4 0 .6 0 .8 1 .0
-8 0
-6 0
-4 0
-2 0
0
2 0
4 0
6 0
8 0
P t ( 1 0 0 ) P t ( 5 1 1 ) P t ( 1 1 , 1 , 1 ) P t ( 1 9 , 1 , 1 )
J / µ
Α .
cm-2
E / V v s . R H E
v = 5 0 m V / s
Figure 5.12. Voltammetric profiles of the Pt(S)[n(100)x(111)] electrodes, with n = 3, 6, 10 and Pt(100) after Pb-upd in 0.1 M HClO4 with v = 50 mV/s.

5. EXPERIMENTAL RESULTS AND DISCUSSION İpek KILIÇCI
62
The changes in the voltammogram is at it´s extreme for the Pt (111) surface,
where the hydrogen and perchlorate adsorption/desorption are almost completely
blocked after performing the Pb-upd experiments, as can be seen in figure 5.13.
0 ,0 0 ,1 0 ,2 0 ,3 0 ,4 0 ,5 0 ,6 0 ,7 0 ,8 0 ,9-1 0 0
-8 0
-6 0
-4 0
-2 0
0
2 0
4 0 P t ( 1 1 1 )
v = 5 0 m V / s
J / µ
Α .
cm-2
E / V v s . R H E
Figure 5.13. CVs for Pt (111) after Pb-upd in 0.1 M HClO4 with v = 50 mV/s.
Table 5.4. Charge of various Pt-single crystals .The integration limit is between 0.10 and 0.50 V. Single Crystals
Charge / µC.cm-2
Pt ( 19 ,1 ,1 )
≈153
Pt ( 11 ,1 ,1 )
≈272
Pt ( 5 ,1 ,1 )
≈220
Pt ( 1 ,0 ,0 )
≈204
5.3. Effect of Ru submonolayers on the CO oxidation on Pt (19,1,1)
5.3.1. CO oxidation at the Ru free Pt(19,1,1) surfaces
Preparation process is the same step with Tl and Pb experiment. The single-
crystal is heated in a flame and cool over a pure water in a hydrogen atmosphere. It is

5. EXPERIMENTAL RESULTS AND DISCUSSION İpek KILIÇCI
63
good to giving bubble the electrolyte solution for a few seconds before forming a
meniscus to remove any contaminants on the surface of the solution. We should
make sure there is no water in the crystal holder or in the glass holder and we should
never expose the glass holder to the flame during annealing the crystal to avoid
forming contaminants that could be transferred to the electrolyte solution while
making the meniscus contact.
Figure 5.14. Shows the voltammogram of the preparation for the
Pt(S)[n(100)x(111)] with n = 10 stepped single-crystal surface in 0.1 M H2SO4 base-
electrolyte with v = 50 mV/s. In the potential range between 0.05-0.35 V in the CV is
related to hydrogen adsorption and desorption peaks at step sides. At 0.38 V in the
CV is related to hydrogen adsorption/desorption peaks at terrace sites. Charge of the
(111) terrace is ≈161 µC.cm-2.In the CV in the potential between 0.10 and 0.55 V the
all charge of anodic side is ≈352 µC.cm-2.
0 , 0 0 , 1 0 , 2 0 , 3 0 , 4 0 , 5 0 , 6 0 , 7 0 , 8
- 1 0 0
- 5 0
0
5 0
1 0 0
P t ( 1 9 , 1 , 1 )
J / µ
Α .
cm-2
E / V v s . R H E
v = 5 0 m v / s
Figure 5.14. Recorded CVs for after preparation of Pt (19,1,1) in 0.1 M H2SO4 with v=50 mV/s.
After recording a CV in the sulphuric acid to check the preparation of the
single-crystal, a CO oxidation experiments is performed on the Pt(19,1,1) surface.
Therefore, holding the potential at 0.7 V, 2 mL of CO saturated 0.1 M H2SO4 where
added to the H-cell. After adsorption of CO for 3 minutes the electrolyte in the cell is
exchanged under potential-control, by opening the glass-cock at the bottom of the H-

5. EXPERIMENTAL RESULTS AND DISCUSSION İpek KILIÇCI
64
cell, and at the same time adding new electrolyte to the cell via the electrolyte depot,
maintaining the hanging-meniscus configuration. At least 3 times the cell-volume is
exchanged. After CO adsorption, the potential-program is started again and a cyclic
voltammogram for the CO oxidation is recorded. For the CO oxidation, a sharp peak
at a potential of 0.75 V with a small shoulder at somewhat lower potential can be
observed, having a charge-density of approximately 356µC.cm-2. For the small
shoulder between 0.64 and 0.72 V a charge 104 µC.cm-2 is integrated.
0,0 0 ,2 0,4 0,6 0 ,8 1,0-50
0
50
100
150
200
250
300 P t ( 19 , 1 , 1 )
J / µ
Α .
cm
-2
E / V vs . R H E
v = 10 m V / s
Figure 5.15. The first CV for Pt ( 19,1,1 ) after CO oxidation in 0.1 M H2SO4 with v= 10mV/s.
Figure 5.16. Shows the voltammogram after CO oxidation in 0.1 M H2SO4 with
v = 50 mV/s. The charge in the potential between 0.15 and 0.50 V of the anodic is
≈317 µC.cm-2. No altering of the surface due to the CO adsorption and oxidation can
be observed.

5. EXPERIMENTAL RESULTS AND DISCUSSION İpek KILIÇCI
65
0 .0 0 .1 0 .2 0 .3 0 .4 0 .5 0 .6 0 .7 0 .8
- 1 0 0
- 5 0
0
5 0
1 0 0
1 5 0 P t ( 1 9 , 1 , 1 )
v = 5 0 m V / s
J / µ
Α .
cm-2
E / V v s . R H E
Figure 5.16. CVs for the Pt (19,1,1) for after CO oxidation in 0.1 M H2SO4 with v = 50 mV/s.
5.3.2. Adsorption of Ru submonolayers on Pt (19,1,1) surfaces
Figure 5.17. shows the CV for diffusion-controlled Ru-depositon on Pt (19,1,1)
in a 1x10⁻⁵ M RuCl3 in 0.1 M H2SO4 during potential-cycling in the potential range
of 0.05 to 0.80 V after emersion of the electrode at 0.80 V. Already in the first
cathodic sweep, a large peak at a potential of 0.30 V and a small peak at a potential
of 0.24 V is visible. The corresponding peaks can be obtained in the anodic sweep;
althought the peak at 0.35 V is not as sharp as in the cathodic sweep. The difference
between cathodic and anodic scan might be related to chloride adsorption on the
surface. With ongoing Ru-deposition the current-density in the potential range
between 0.05 and 0.15 V, related to hydrogen adsorption/desorption on the
Pt(19,1,1) surface, is more and more suppressed, and also the charge density for
both peaks. The whole cyclic voltammogram is shifting up, because during transfer
traces of oxygen, which lead to a negative charge due to reduction of this oxygen, are
reduced. The cathodic sweep is not effected that much by this extra-process. New
peak features for the deposited Ru appear at 0.58 and 0.64 V, related to OH-
adsorption on the Ru [G. Samjeske, (2002)] [J. S. Spendelow, (2004)]. Ru is
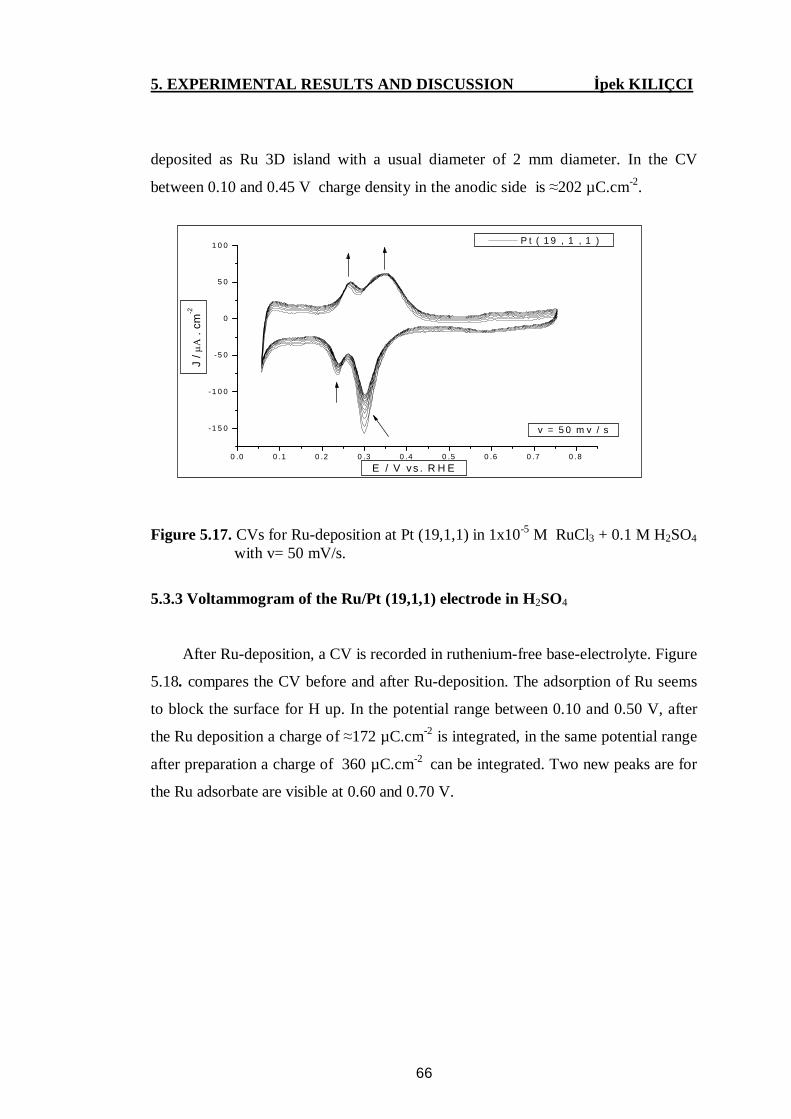
5. EXPERIMENTAL RESULTS AND DISCUSSION İpek KILIÇCI
66
deposited as Ru 3D island with a usual diameter of 2 mm diameter. In the CV
between 0.10 and 0.45 V charge density in the anodic side is ≈202 µC.cm-2.
0 .0 0 .1 0 .2 0 .3 0 .4 0 .5 0 .6 0 .7 0 .8
-1 5 0
-1 0 0
-5 0
0
5 0
1 0 0 P t ( 1 9 , 1 , 1 )
v = 5 0 m v / s
J / µ
Α .
cm-2
E / V vs . R H E
Figure 5.17. CVs for Ru-deposition at Pt (19,1,1) in 1x10⁻⁵ M RuCl3 + 0.1 M H2SO4
with v= 50 mV/s.
5.3.3 Voltammogram of the Ru/Pt (19,1,1) electrode in H2SO4
After Ru-deposition, a CV is recorded in ruthenium-free base-electrolyte. Figure
5.18. compares the CV before and after Ru-deposition. The adsorption of Ru seems
to block the surface for H up. In the potential range between 0.10 and 0.50 V, after
the Ru deposition a charge of ≈172 µC.cm-2 is integrated, in the same potential range
after preparation a charge of 360 µC.cm-2 can be integrated. Two new peaks are for
the Ru adsorbate are visible at 0.60 and 0.70 V.

5. EXPERIMENTAL RESULTS AND DISCUSSION İpek KILIÇCI
67
0 ,0 0 ,1 0 ,2 0 ,3 0 ,4 0 ,5 0 ,6 0 ,7 0 ,8
-1 0 0
- 5 0
0
5 0
1 0 0J
/ µΑ
.cm
-2
E / V v s . R H E
a f te r R u /P t ( 1 9 ,1 ,1 ) a f te r p re p . P t ( 1 9 ,1 ,1 )
Figure 5.18. The CVs for Ru / Pt (19,1,1) in 0.1 M H2SO4
CO oxidation
After the deposition of Ru on the Pt (19,1,1)-surface, CO oxidation experiments
are performed on the Ru/Pt (19,1,1) surface. Therefore, holding the potential at 0.07
V, 2 mL of CO saturated 0.1 M H2SO4 where added to the H-cell. After adsorption of
CO for 3 minutes the electrolyte in the cell is exchanged under potential-control, by
opening the glass-cock at the bottom of the H-cell, and at the same time adding new
electrolyte to the cell via the electrolyte depot, maintaining the hanging-meniscus
configuration. At least 3 times the cell-volume is exchanged. After CO adsorption,
the potential-program is started again and a cyclic voltammogram for the CO-
oxidation is recorded. Figure 5.19. shows the voltammogram, where two peak for the
CO-oxidation can be observed, the first one with a small shoulder at lower potential.
In the CV at the potential 0.55 and 0.63 V charge of the sharp peak is ≈215
µC.cm-2 for Pt(19,1,1) . In the CV at the potential 0.63 and 0.73 V charge of peak is
≈170 µC.cm-2 and between 0.50 and 0.58 V charge of peak is 77 µC.cm-2 . In the
potential range between 0.50 and 0.73 V the whole anodic charge is ≈462 µC.cm-2 .

5. EXPERIMENTAL RESULTS AND DISCUSSION İpek KILIÇCI
68
In the second anodic sweep no more peaks for CO oxidation are visible, indicating
that the electrolyte exchange was successful, and there is no residual CO in solution.
0 ,0 0 ,2 0 ,4 0 ,6 0 ,8 1 ,0
- 2 0
0
2 0
4 0
6 0
8 0
P t ( 1 9 , 1 , 1 )
J / µ
Α .
cm-2
E / v v s . R H E
v = 1 0 m V / s
Figure 5.19. The CVs for CO oxidation in 0.1 M H2SO4 with v= 10 mV/s.
A second experiment on the CO oxidation is performed, where after adsorption
of the CO at 0.07 V and starting the potential-program, the potential-program is
stopped again in the beginning of the first CO oxidation peak at 0.54 V for 3 minutes
before starting the potential-program again. The result of this experiment is shown in
figure 5.20. It can be easily distinguish to Ru effect with this cyclic voltammogram.
Performing the second potential stop, the second peak for CO oxidation at
around 0.70 V seems not to be affected. This indicates that there are two different
adsorption vicinities for CO on the surface, which can be oxidized separately.

5. EXPERIMENTAL RESULTS AND DISCUSSION İpek KILIÇCI
69
0 .0 0 .2 0 .4 0 . 6 0 . 8 1 .0- 3 0
- 2 0
- 1 0
0
1 0
2 0
3 0
J / µ
Α.c
m-2
E / V v s . R H E
C O o x i d . P t ( 1 9 , 1 ,1 )
v = 1 0 m V / s
Figure 5.20. The CV for CO oxidation of Pt (19,1,1) with v=10mV/s.
Figure 5.21. Shows after CO oxidation, we found no indication for a change of
the Ru modified surface, as compared to the CV record before CO oxidation.
0 , 0 0 ,1 0 ,2 0 ,3 0 ,4 0 ,5 0 ,6 0 ,7 0 ,8- 1 0 0
-5 0
0
5 0
1 0 0
J / µ
Α.c
m-2
E / V v s . R H E
a f te r R u /P t( 1 9 ,1 ,1 ) a f te r C O o x id .
v = 5 0 m V /s
Figure 5.21. The CV for the Pt (19,1,1) (. . .)after CO oxidation and (__) after Ru/Pt in 0.1 M H2SO4 with v = 50 mV/s

5. EXPERIMENTAL RESULTS AND DISCUSSION İpek KILIÇCI
70
5.4. Discussion
Effect of Ru on the CO oxidation at Pt (19,1,1)
As compared to the CO oxidation at the Ru-free surface, CO oxidations starts at
much lower potentials, approximately 0.25 V lower in potential. This is best
resembled in figure 5.22.
0 ,0 0 ,2 0 ,4 0 , 6 0 , 8 1 ,0
0
5 0
1 0 0
1 5 0
2 0 0
2 5 0
3 0 0 R u /P t C O o x id . R u f r e e C O o x id .
J / µ
Α .
cm-2
E / v v s . R H E
v = 1 0 m V / s
Figure 5.22. Compares the CO oxidation (….) Ru free surface and (___) Ru containing solution with v=10 mV/s.
Similar results for the CO oxidation, holding the potential at the beginning of CO
oxidation, at Ru modified Pt(S)[(111)x(111)] where reported by Massong on Lanova
et al [H. Massong, (2000)] , [B. Lanova and H. Baltruschat, (2008)]. They related
this effect to two different adsorption sites for the CO adsorbate: one in the vicinity
of Ru, and one far away from Ru. The catalytic effect of Ru is explained by the so
called bifunctional mechanism. On the one hand, Ru has an electronic effect, and
modifies the binding energy of the adsorbed CO. On the other hand, oxygen-species
adsorbed on Ru, can easiliy promote CO oxidation to CO2 on the Pt sites by a
spillover of this oxygen-species. Therefore the CO next to Ru is oxidized at much

5. EXPERIMENTAL RESULTS AND DISCUSSION İpek KILIÇCI
71
lower potential than CO adsorbed far away from Ru. This is observed here for the
first time for CO oxidation on a stepped Pt(S)[n(100)x(111)] surface, the Pt(19,1,1).
For Pb experiments terrace decoration is possible with Pb. For Pb-UPD with
increasing step density Pb adsorption decreases. At potentials above 0.80 V, the Pb
dissolves as Pb2+.If after preparation is compared with after Pb/Pt, that the original
shape of the hydrogen peaks are shifted and surfaces blocked by Pt. For Pt(111) ; it
seems to be a problem. It can due to maybe it is immersed at low potential.
For Tl experiments step decoration is possible with Tl. Tl preferential decorate
on step-sites. For Tl/Pt (111); all peaks shifted more positive potential and hydrogen
totally blocked.

6. SUMMARY İpek KILIÇCI
72
6. SUMMARY
In the past only Pt(111), Pt(100) was investigated, but in the present thesis , the
effect of step sites on the Tl and Pb upd on stepped Pt surfaces vicinal to the (100)
surface are studied. A comparison of these metals has been made. Tl decorated on
step-sites but for Pb it can be commented that it preferential orientated to decorate on
terrace-sites. For Pb-upd (100) surface is higher than (111) surface. It can be due to
adsorption geometry difference. Pb adsorption is more stable at (100) surface than
(111) surface. Because there is a big desorption potential difference.
CO oxidation experiments are performed on the Ru/Pt (19,1,1) surface. For the
CO oxidation on Pt (19,1,1), the catalytic effect of Ru is investigated. Onset of the
CO oxidation, two peaks instead of one, first peak can be oxidized separately; by
bifunctional mechanism Ru accelerates the CO oxidation on step sites by decreasing
the activation energy. Second peak is not affected by Ru. Electronic effect of Ru is, it
destabilize the CO molecules adsorbed on the vicinity of Ru. It is observed new
peaks due to Ru adsorption.
From the experiment I performed some questions, which could not be answered
completely. For the stepped single-crystal are the peaks really related to adsorption
on terraces/steps? How perfect are these metals-upd CVs? For Pb-upd why it can not
be observed H-upd on step-sites?

73
REFERENCE
BITTNER A. M. , WINTTERLIN J. , and ERTL G. , (1997) Surface Science,
376:267.
BLAKELY D. W. and SOMORJAİ G. A. , (1977), Surface Science 65:419.
BOGOLOWSKI N. , HUXTER S. , ATTARD G. , and BALTRUSCHAT H.,
(2008).
CASADESUS M. , (2009), Journal of Electroanalytical Chemistry 625:123.
CLAVILIER J. , (1980), Journal of Electroanalytical Chemistry 107:211.
CLAVILIER J. and ARMAND D. , (1986), J ELECTROANAL CHEM 199:187.
CLAVILIER J. , FAURE R. , GUINET G. , and DURAND R. , (1980), Journal of
Electroanalytical Chemistry 107:205.
CLAVILIER J. , GANON J.-P. , and PETIT M. , (1989), Journal of Electroanalytical
Chemistry 265:231.
DOMKE K. , HERRERO E. , RODES A., and FELIU J. M. , (2003), Journal of
Electroanalytical Chemistry 552:115.
FELIU J. M. , ORTS J. M. , GOMEZ R. , ALDAZ A. , and CLAVILIER J. , (1994),
Journal of Electroanalytical Chemistry 372:265.
FIORENTINI V. , METHFESSEL M. , and SCHEFFLER M. , (1993), Physical
Review Letters 71:1051.
FRANCKE R. , CLIMENT V. , BALTRUSCHAT H. , and FELIU J. M. , (2008),
Journal of Electroanalytical Chemistry and Interfacial Electrochemistry
624:228.
FUNTIKOV A. M. , LINKE U. , STIMMING U. , and VOGEL R. , (1995) , Surface
Science 324:L343.
FUNTIKOV A. M. , STIMMING U., and VOGEL R. , (1997), Journal of
Electroanalytical Chemistry 428:147.
FURUYA N. and KOIDE S. , (1989), Surface Science 220:18.
GASTEIGER H. A. , MARKOVIC N. , ROSS P. N. , and CAIRNS E. J. , (1993),
Journal of Physical Chemistry 97:12020.
GURGUR B. N. , MARKOVIC N. M. , and ROSS P. N. , (1997) , Langmuir

74
13:6370.
HAZZAZI O. A. , ATTARD G. A. , WELLS P. B. , VIDAL-IGLESIAS F. J. , and
ROSS P. N. and WAGNER F. T. , in Advances in Electrochemistry and
Electrochemical Engineering. XIII, Vol. XIII (H. Gerischer and C. W. Tobias,
eds.), Wiley-Interscience, N. York, 1984, p. 70.
HERNANDEZ F. and BALTRUSCHAT H. , (2006) Langmuir 22:4877.
JENKINS S. J. , PETERSEN M. A. , and KING D. A. , (2001), Surface Science
494:159.
KIBLER L. A. , (2003), Preparation and Characterization of Noble Metals Single
Crystal Electrodes, University of Ulm.
LANOVA B. , (2009) , in Institute für Physikalische und Theoretische Chemie,
Abteilung Elektrochemie, Vol. Ph.D., Rheinische Friedrich-Wilhelms
Universität Bonn, Germany.
LANOVA B. and BALTRUSCHAT H. , (2008).
MARKOVIC N. M. , GURGUR B. N. , LUCAS C. A. , and ROSS P. N. , (1998),
Journal of the Chemical Society-Faraday Transactions 94:3373.
MASSONG H. , TILLMANN S. , LANGKAU T. , MEGUID E. A. Abd El, and
BALTRUSCHAT H. , (1998) Electrochimica Acta 44:1379.
MASSONG H. , WANG H. S. , SAMJESKE G. , and BALTRUSCHAT H. , (2000)
Electrochimica Acta 46:701.
MICHAELIS R. and KOLB D. M. , (1992), Journal of Electroanalytical Chemistry
328:341.
MICHAELIS R. , ZEI M. S. , ZHAI R. S. , and KOLB D. M., (1992), Journal of
Electroanalytical Chemistry 339:299.
MICHELY T. and COMSA G. , (1991), Surf. Sci. 256:217.
ODA I. , SHINGAYA Y. , MATSUMOTO H. , and ITO M. , (1996), J.Electroanal.
Chem. 409:95.
PRATT S. J. , JENKINS S. J. , and KING D. A. , (2005), Surface Science 585:L159.
RODES A. , ZAMAKHCHARI M. A. , ACHI K. El , and CLAVILIER J. , (1991),
Journal of Electroanalytical Chemistry 305:115.
SAMJESKE G. , XIAO X.-Y. , and BALTRUSCHAT H. , (2002), Langmuir

75
18:4659.
SASHIKATA K. , FURUYA N. , and ITAYA K. , (1991), Journal of
Electroanalytical Chemistry 316:361.
SASHIKATA K. , FURUYA N. , and ITAYA K. , (1991), J. Vac. Sci. Technol. B
9:457
SOMORJAİ G. A. , (1994), Surface Science 299/300:849.
SOMORJAİ G. and BLAKELY D. W. , (1977), Surface Science 65:419.
SORIAGA M. P. , (1992), Surface Science 39:325.
SPEK A. L. , (2003), Journal of Applied Crystallography , 36:7
SPENDELOW J. S. and WIECKOWSKI A. , (2004), Physical Chemistry Chemical
Physics 6:5094.
SWAMY K. , BERTEL E., and VILFAN I., (1999), Surface Science 425:L369.
TIAN N. , ZHOU Z.-Y. , and SUN S.-G. , (2008), The Journal of Physical Chemistry
C 112:19801.
WARD L. C. and STICKNEY J. L. , (2001), Physical Chemistry Chemical Physics
3:3364.
WHEELER D. R. , WANG J. X. , and ADZİC R. R. , (1995) Journal of
Electroanalytical Chemistry 387:115.
YAU S. L. , KIM Y. G. , and ITAYA K. , (1996), Journal of the American Chemical
Society 118:7795.
http://www.mateck.de
http://www.lenntech.com/Periodic-chart-elements/pb-en.htm

76
CURRICULUM VITAE
İpek KILIÇCI was born in Adana in 1985. She finished primary school in
‘DSİ Primary school’ and She continued intermediate and high school in ‘Seyhan
Rotary Anatolian High School’. She graduated at 2003 and this year she started
chemistry in University of Çukurova a Master Degree at 2003. After she finished
BSc, she started to master degree of chemistry in Institute of Naturel and Applied
Sciences University of Çukurova in 2007. At 2008 she studied in Bonn University
for second year of my master via erasmus program.